
A Study of the Properties and Dynamics of the Disk of Satellites in a Milky-Way-like Galaxy System

Abstract
:1. Introduction
2. The Numerical Simulations
3. Results
3.1. Spatial and Mass Distributions
3.2. Dynamical Properties
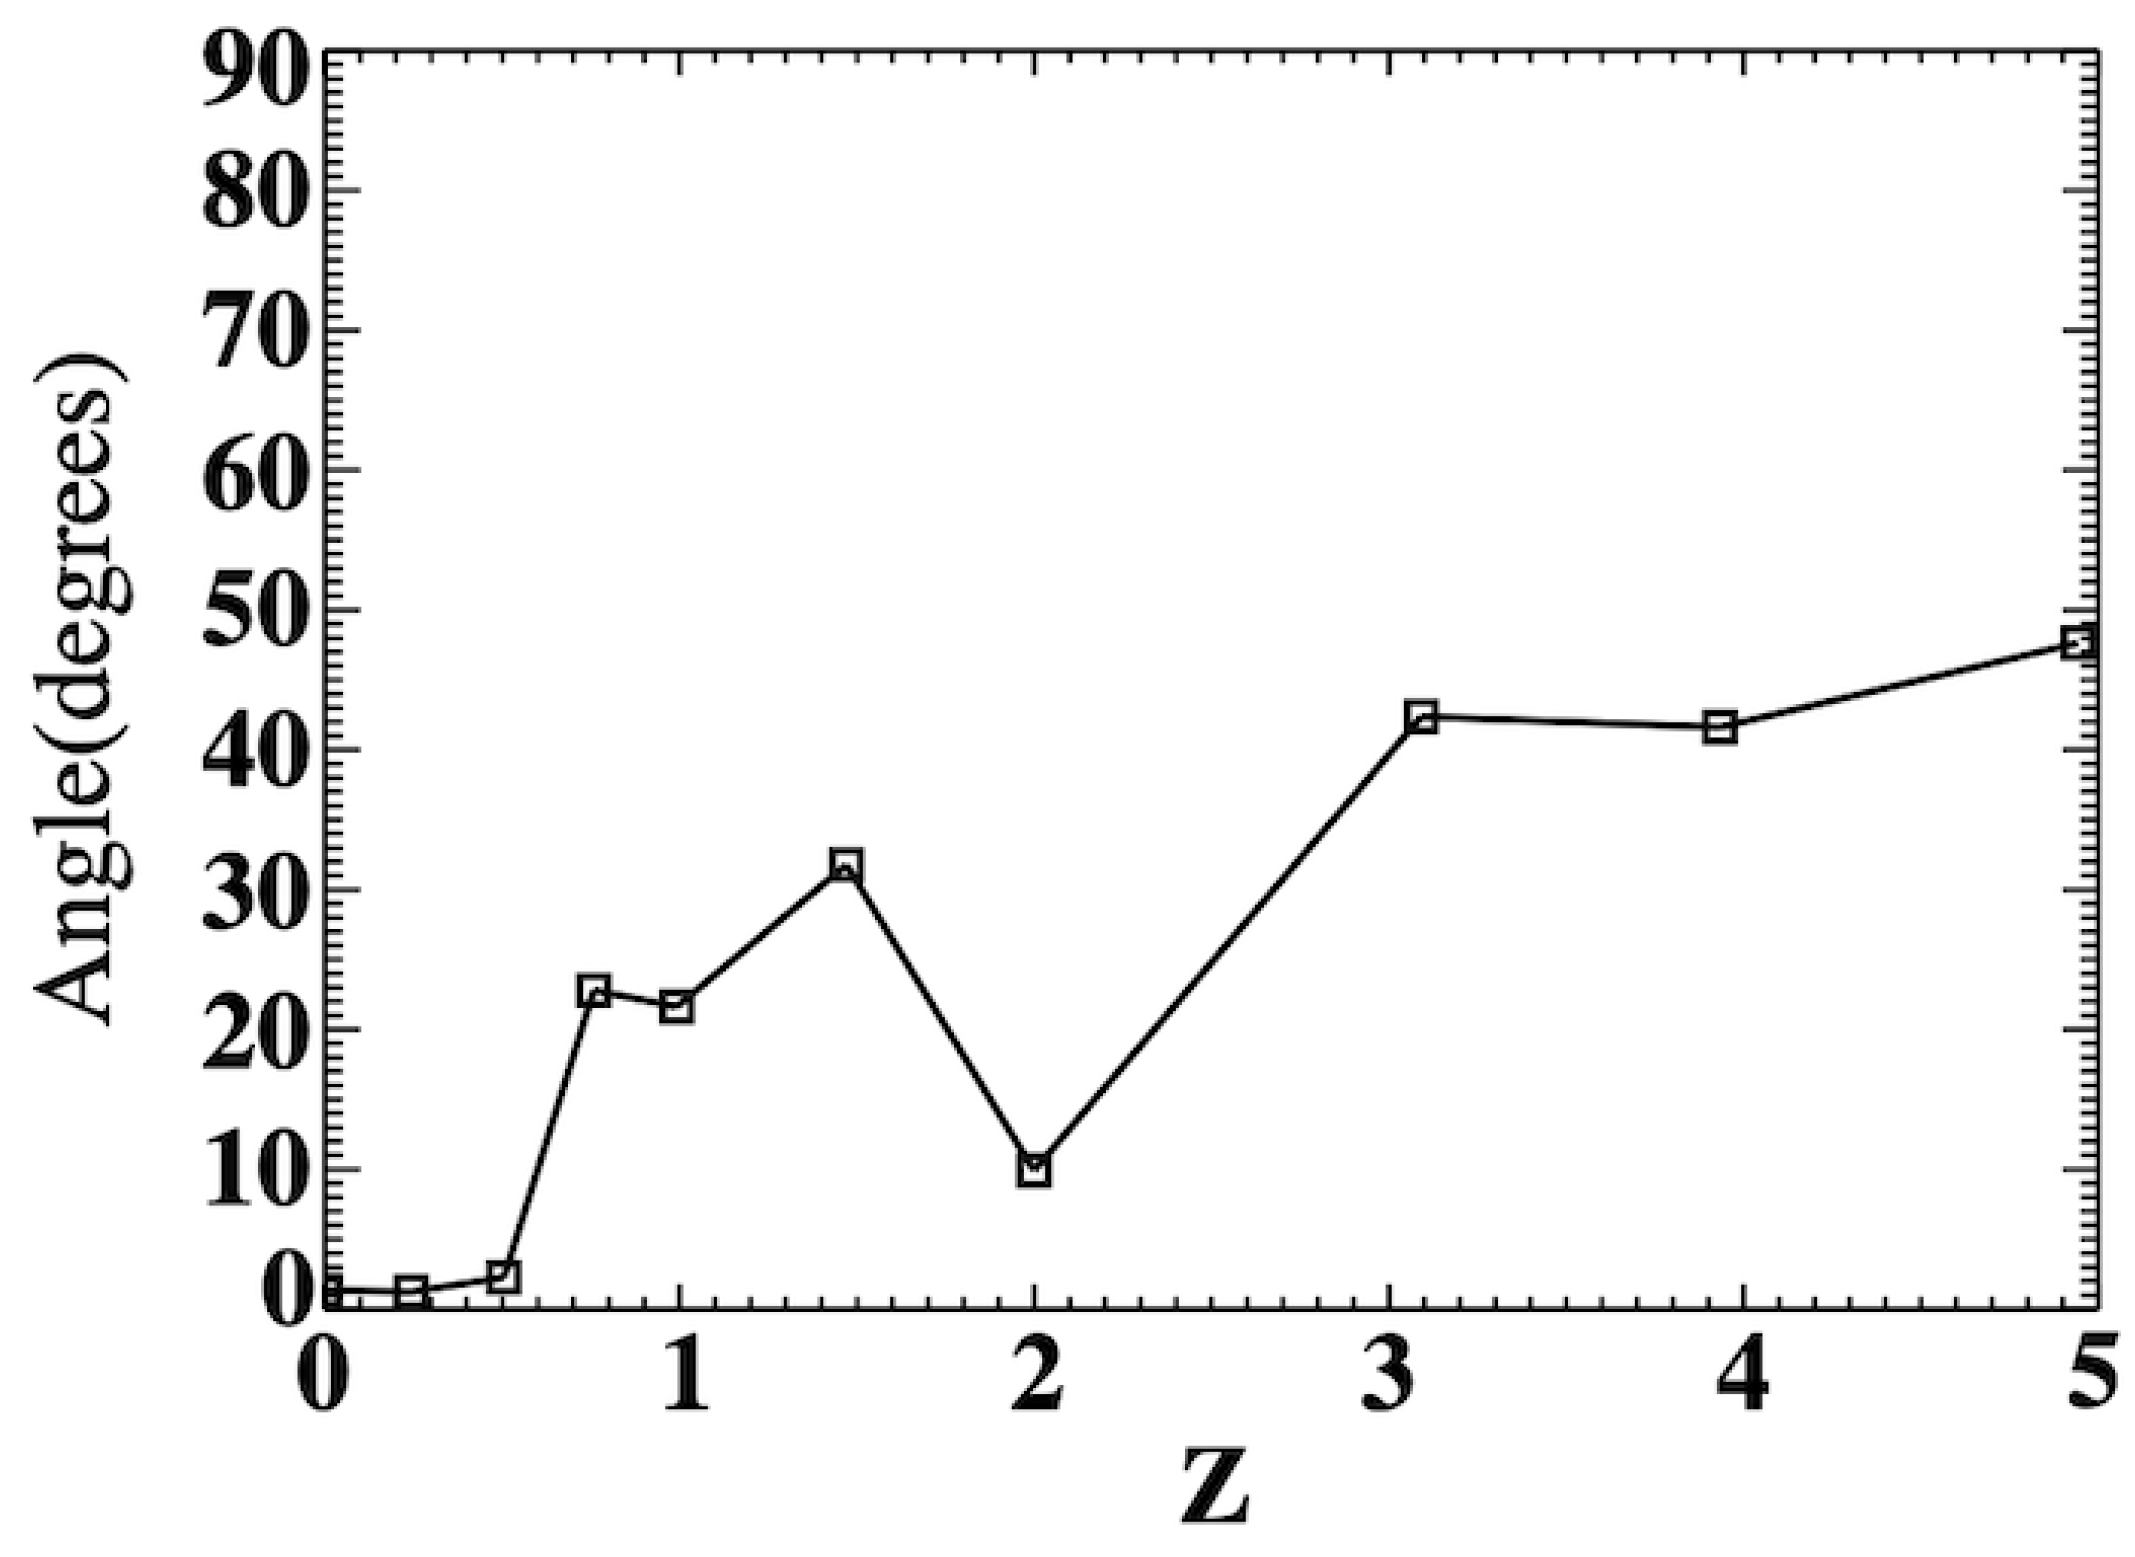
3.3. Time Evolution
4. Summary and Conclusions
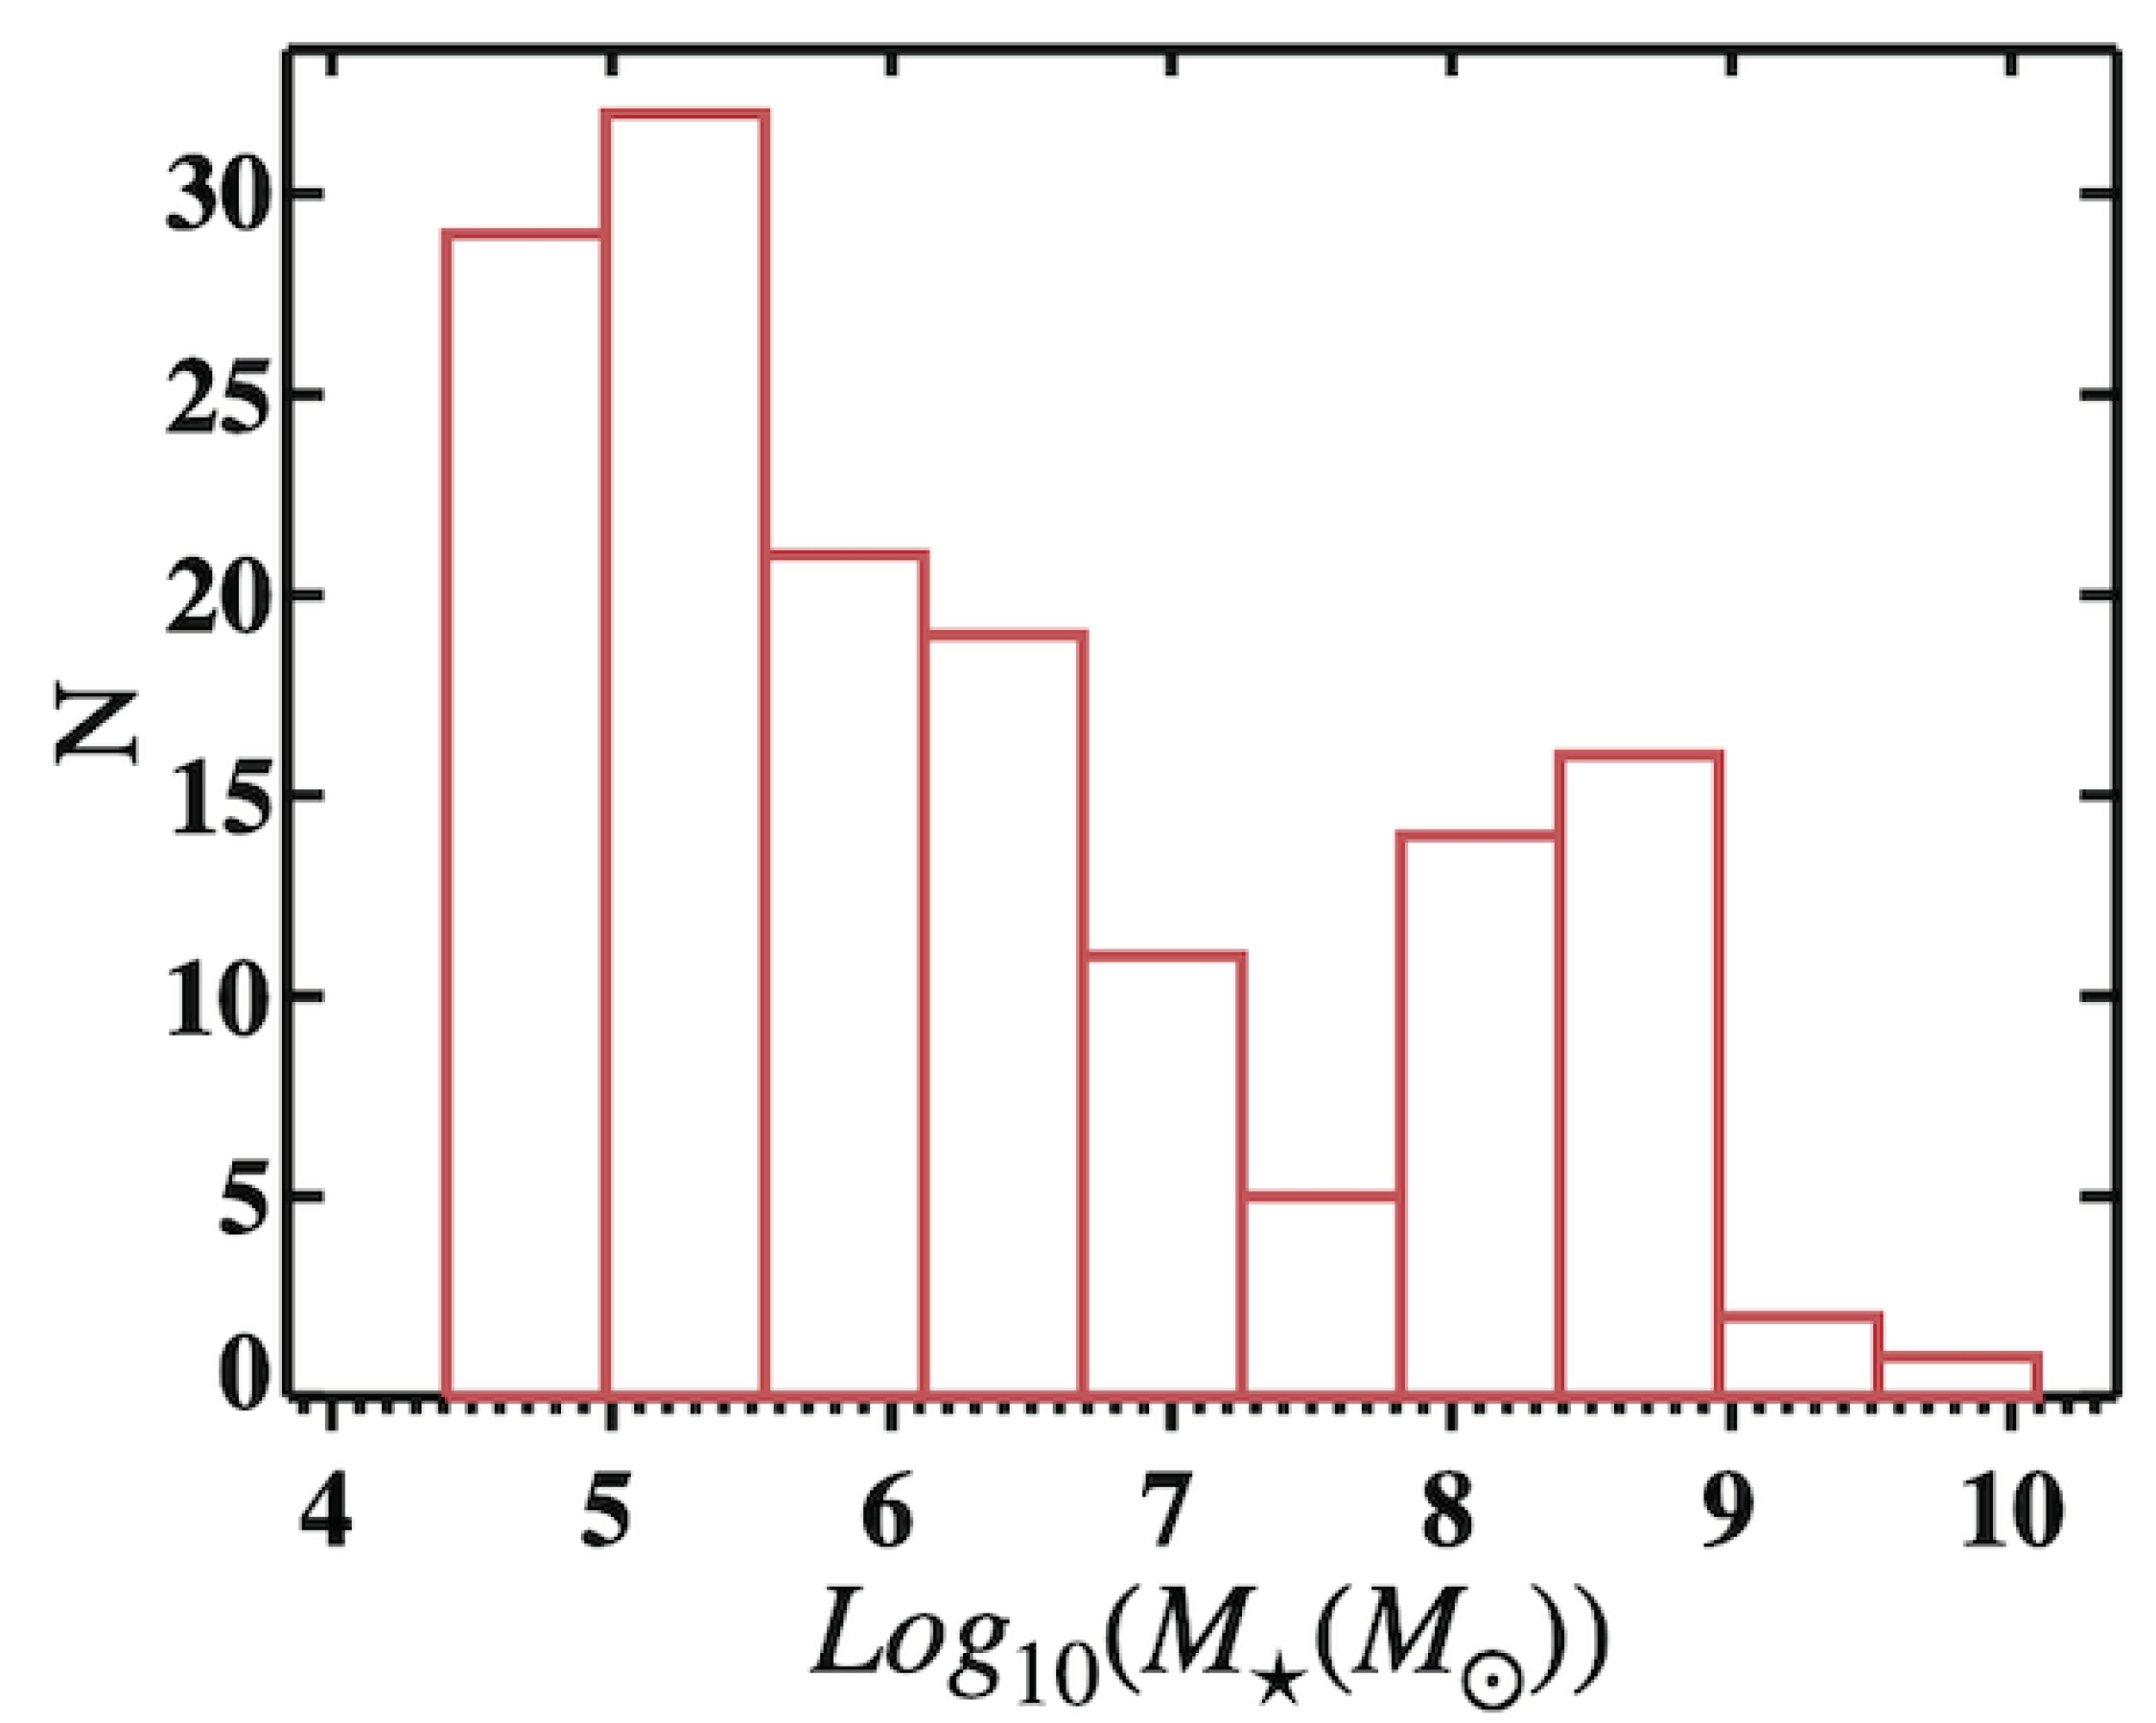
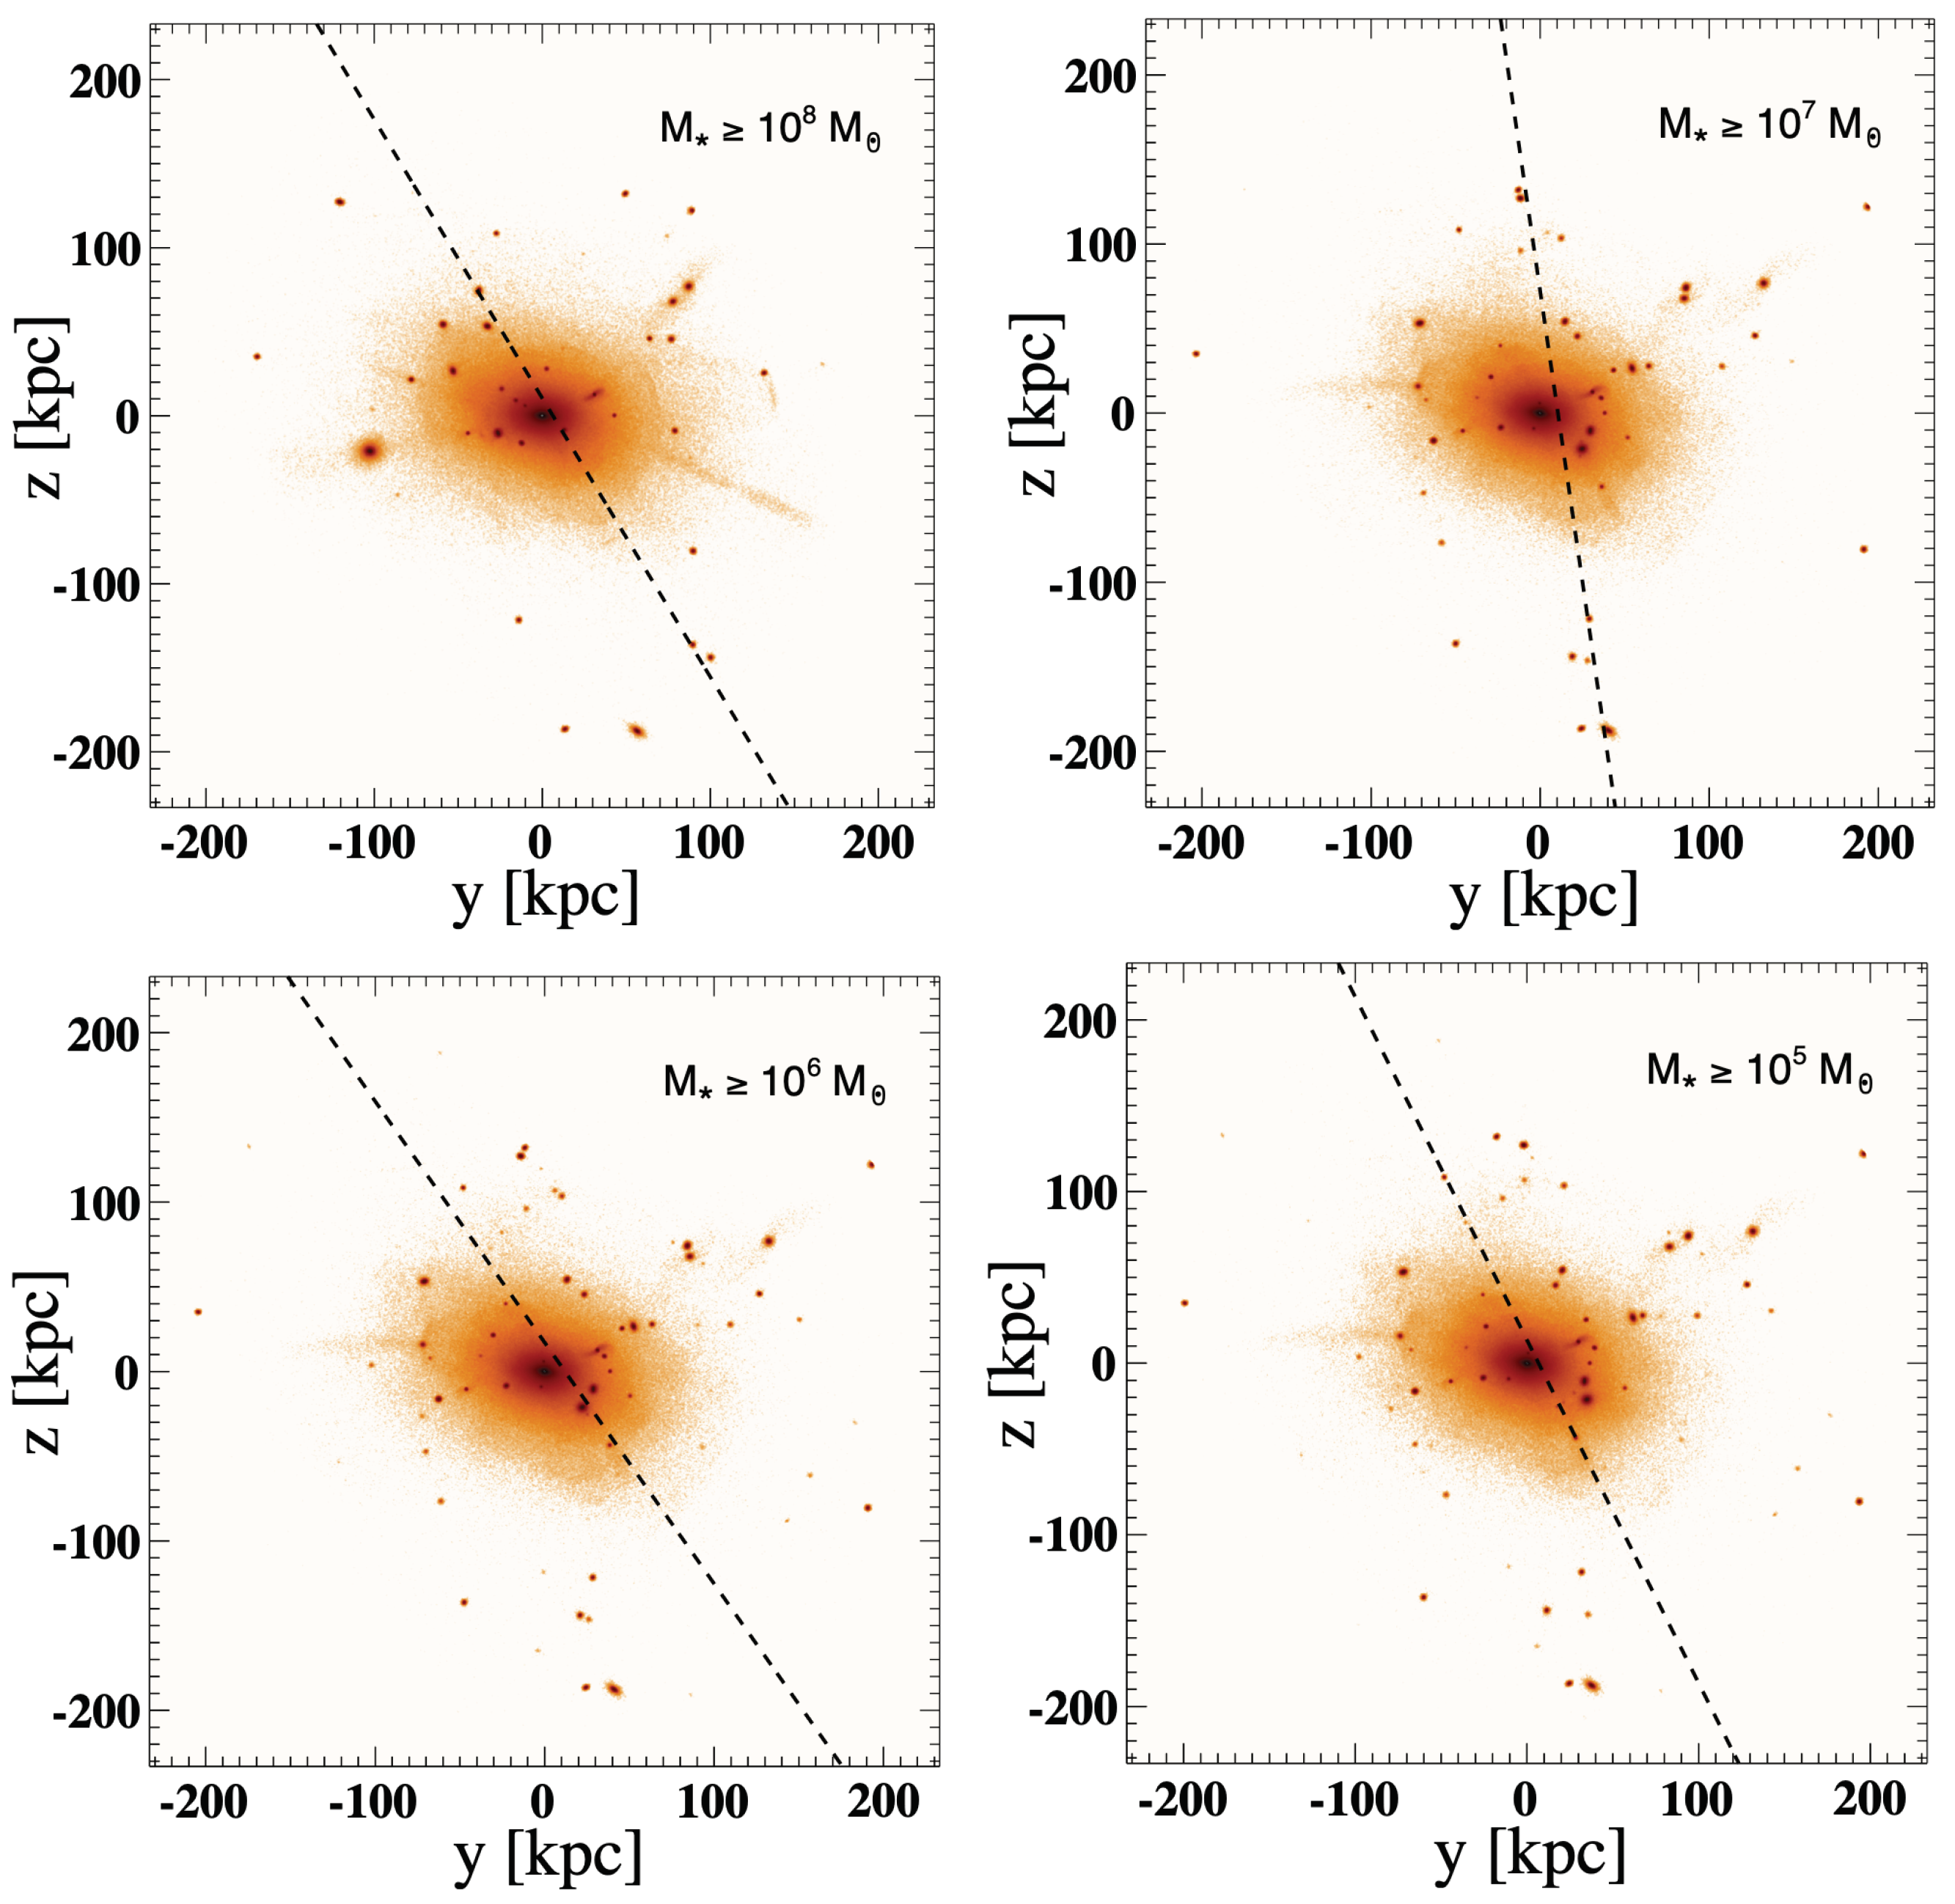
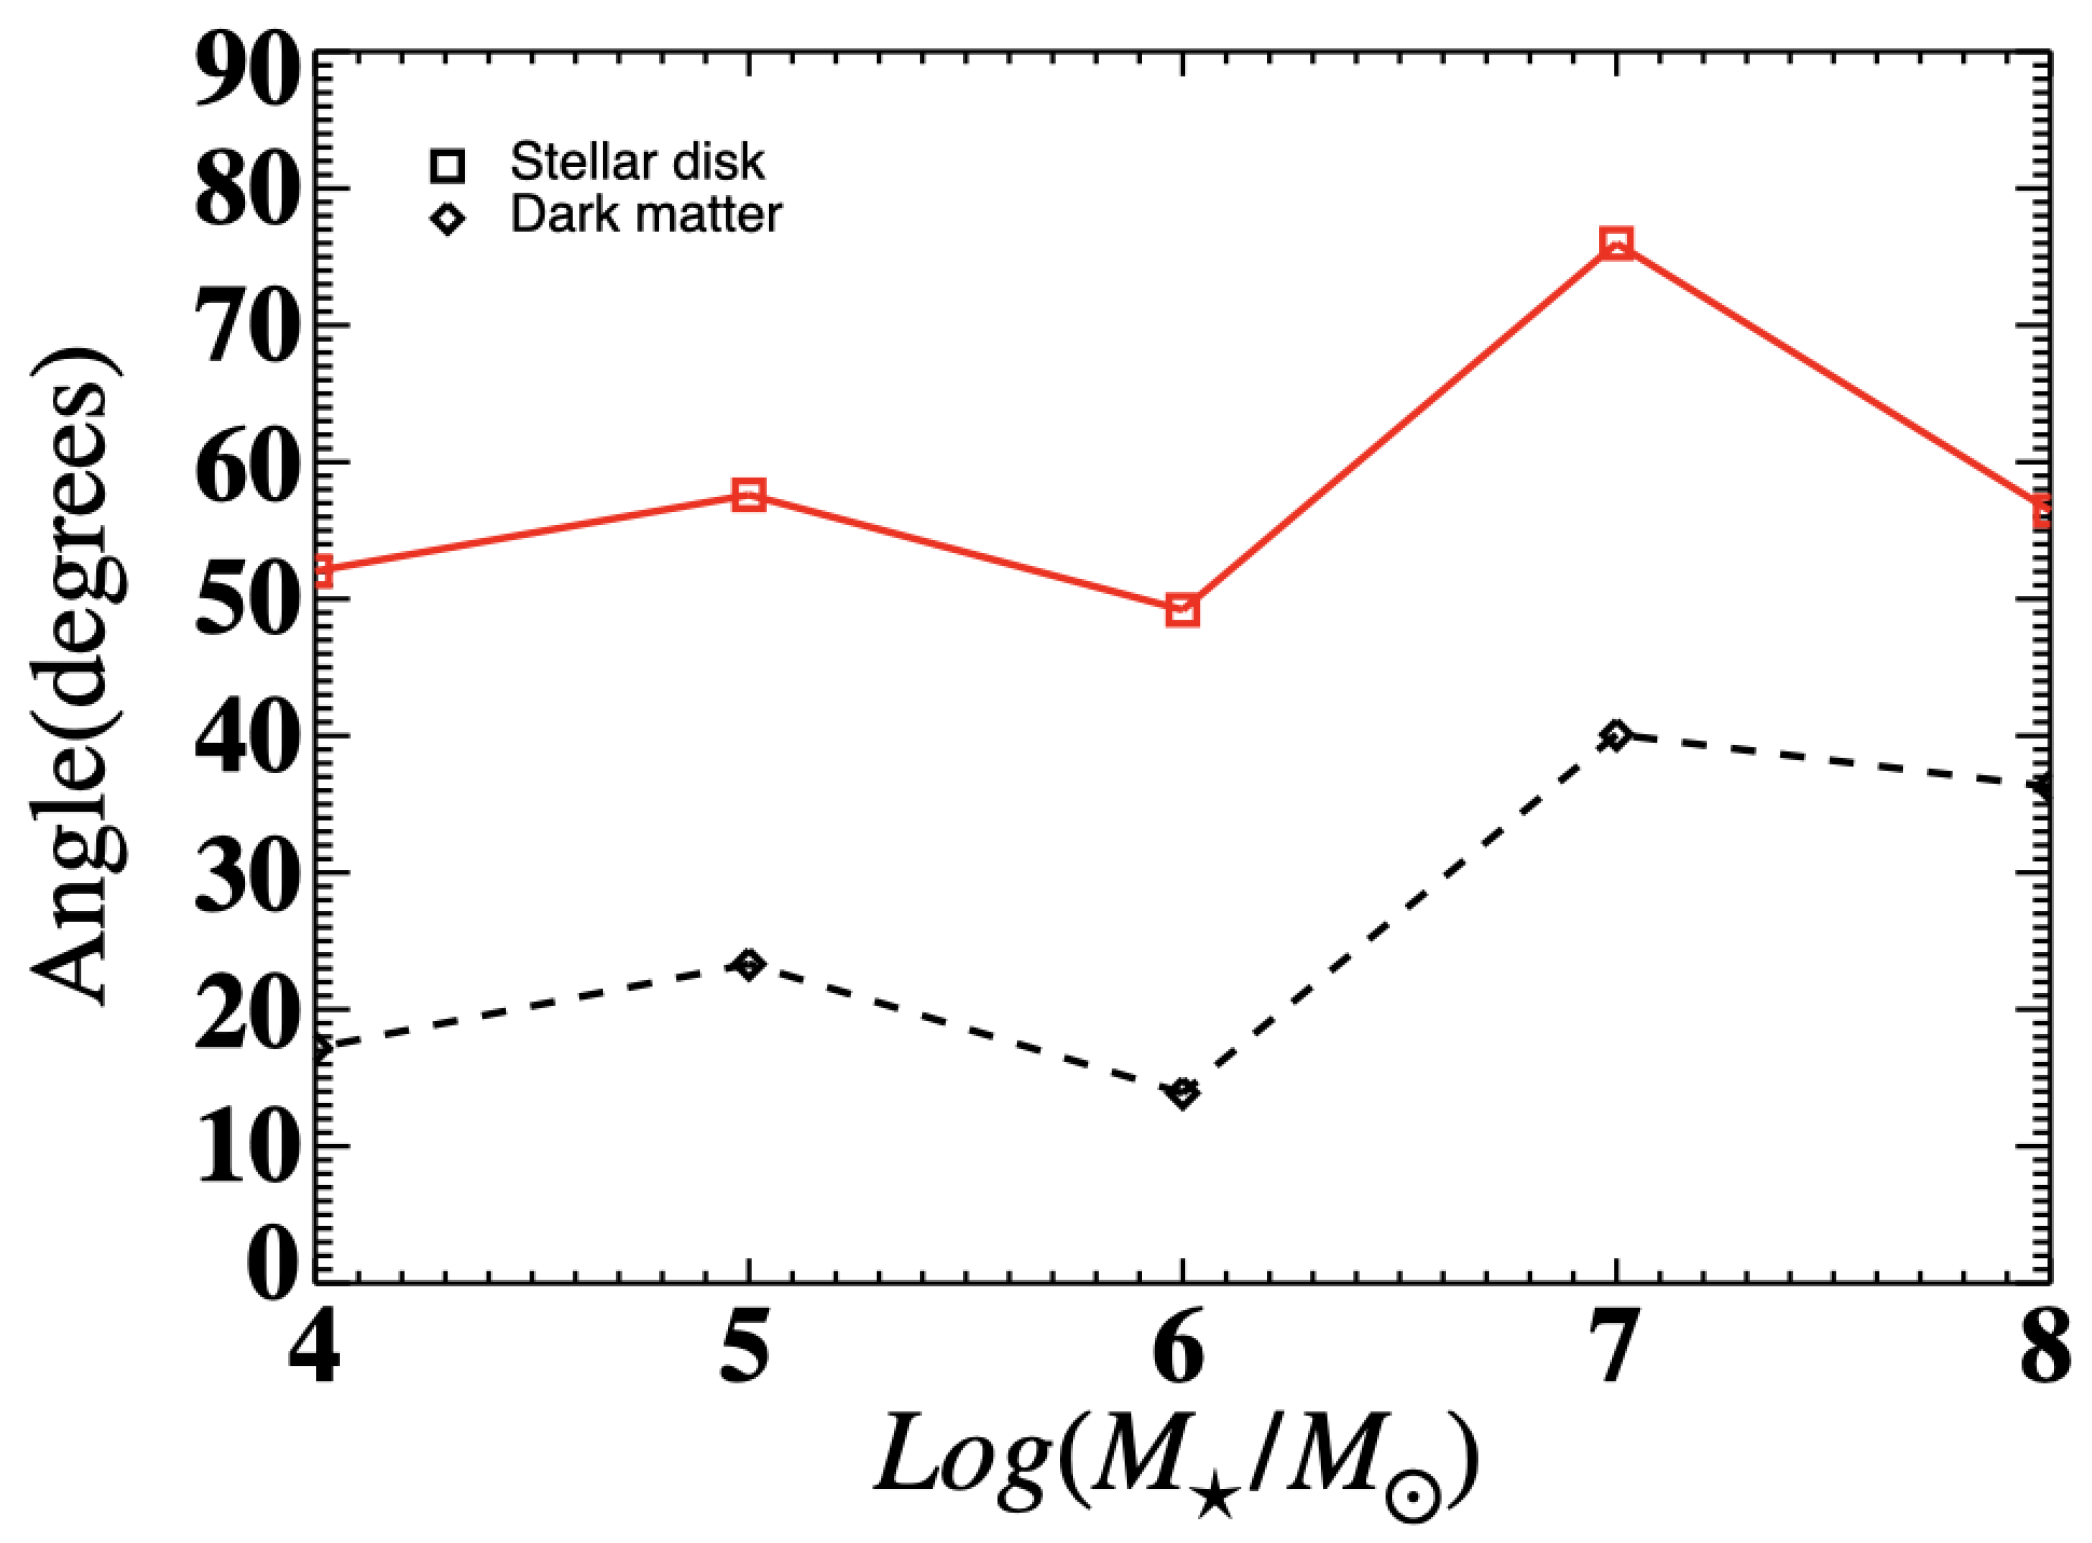
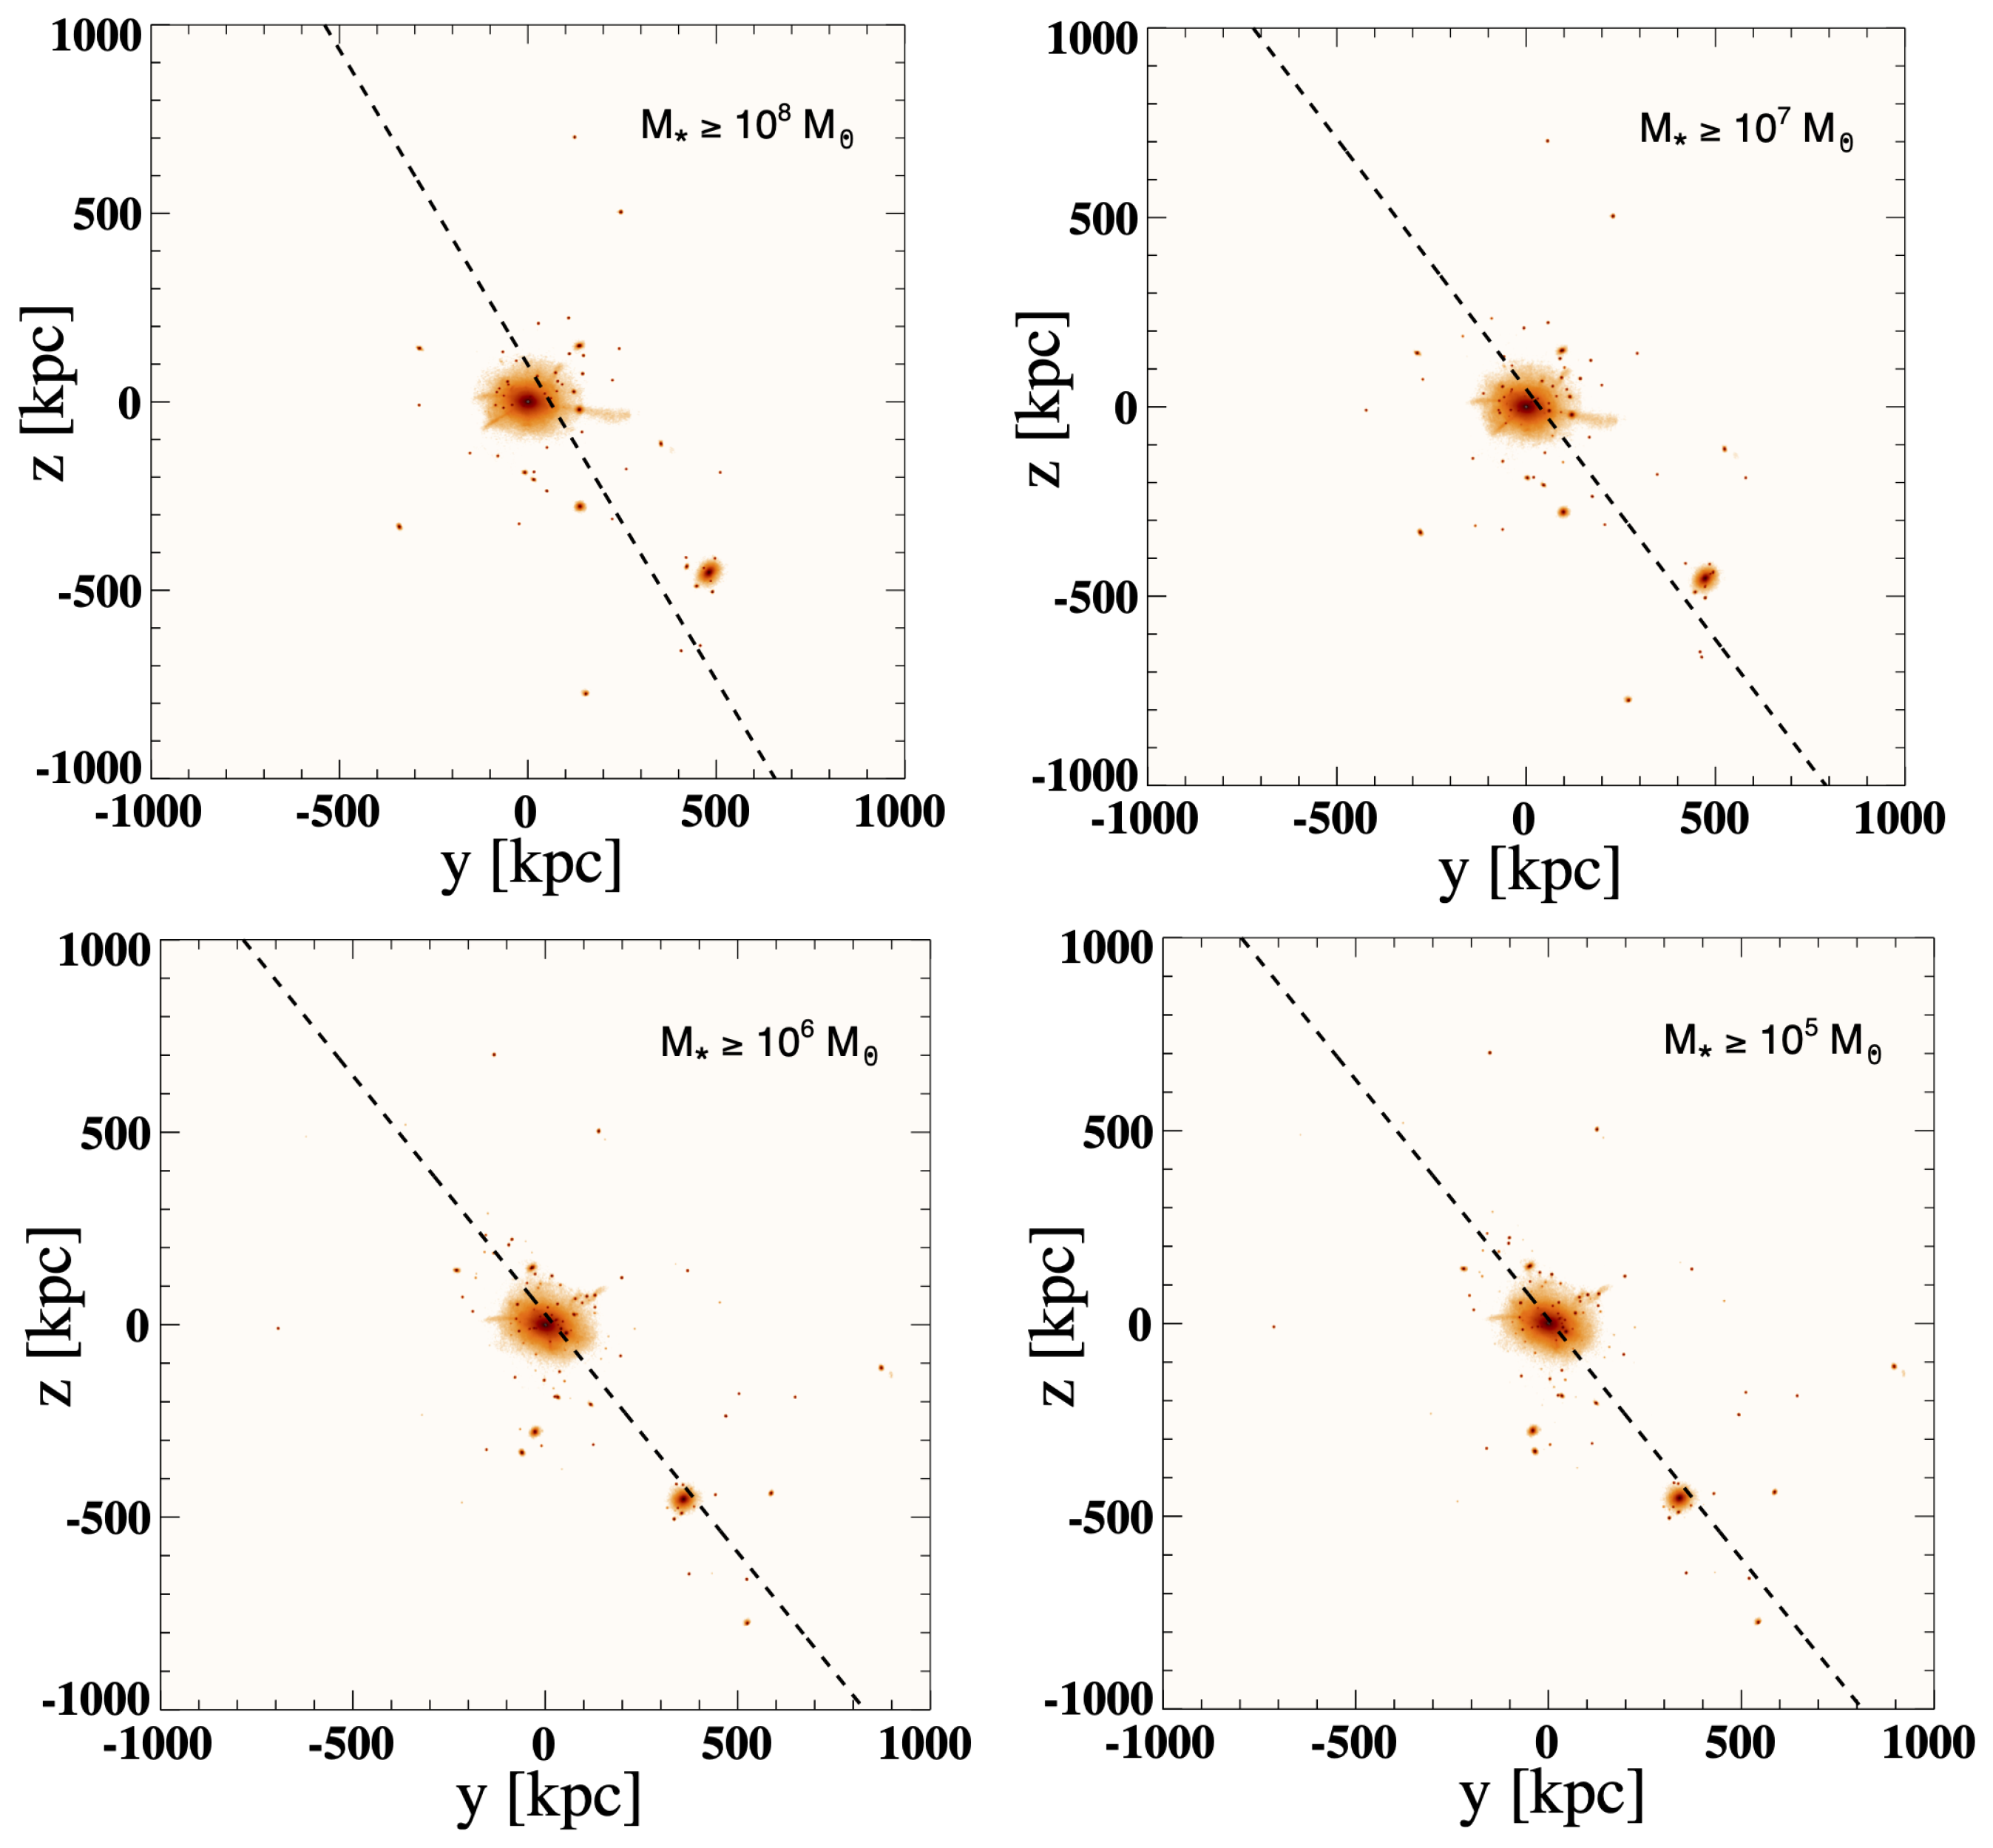
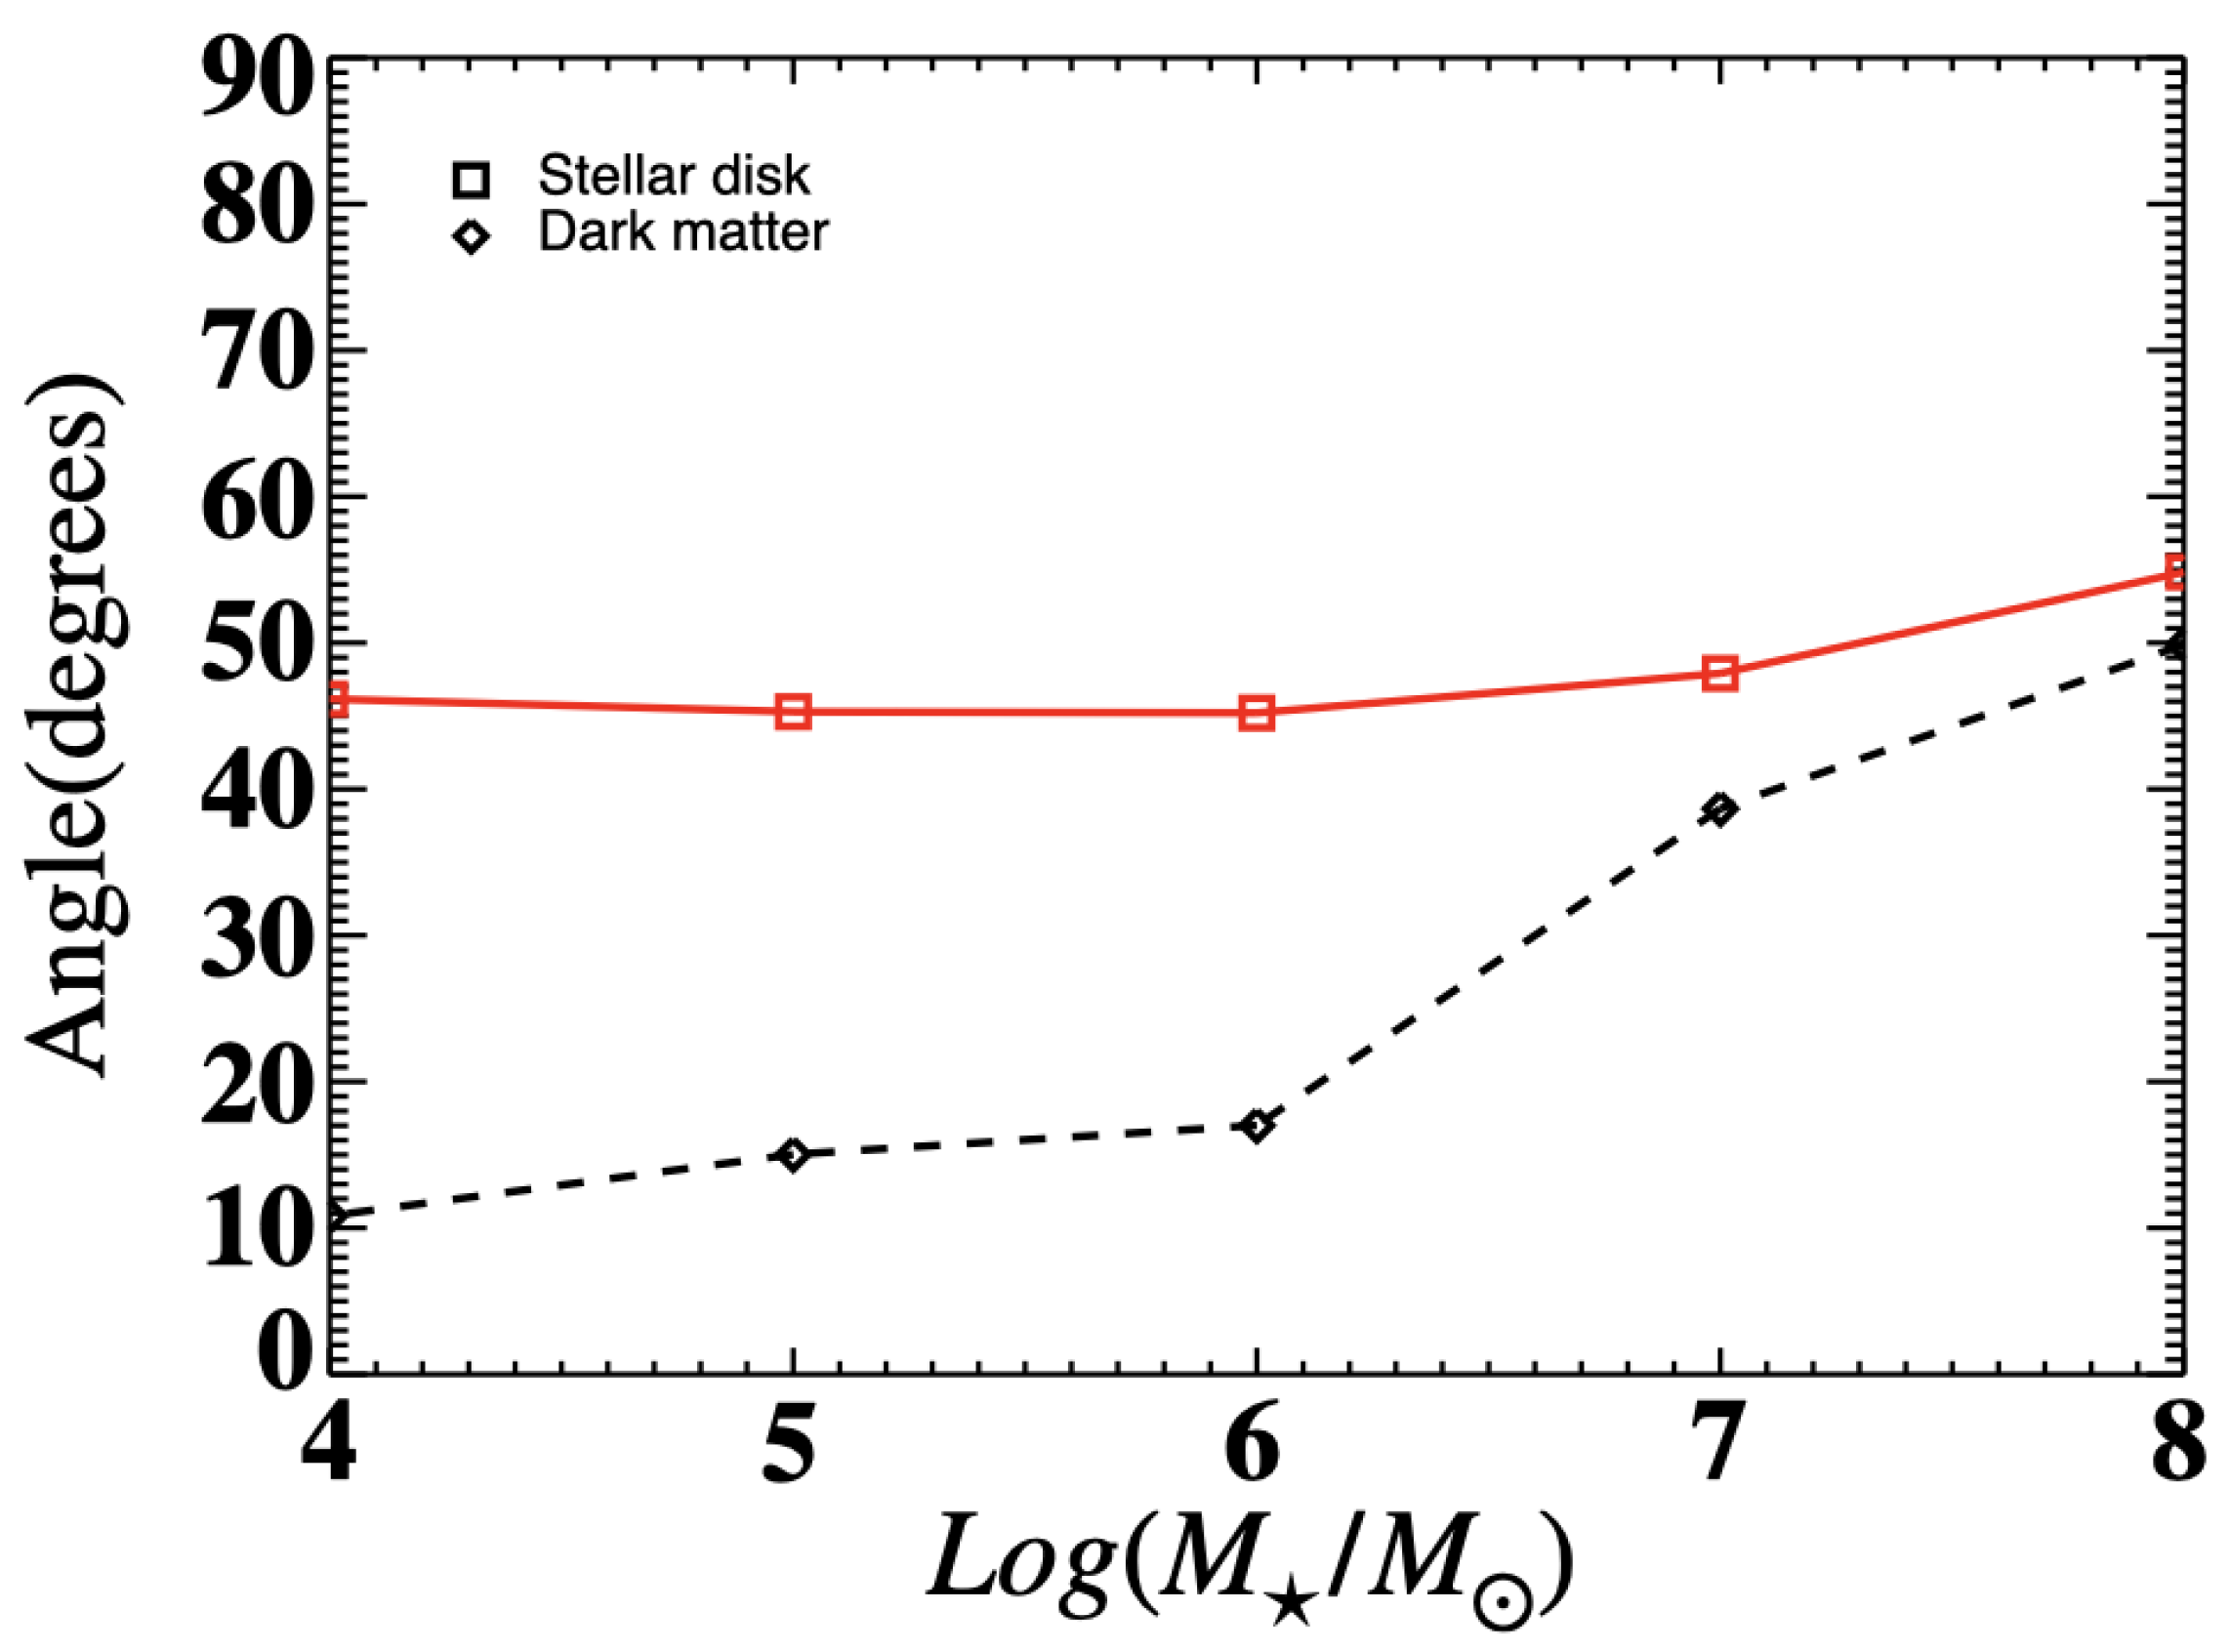
- We find that the properties of the fitted DOS planes are almost independent of the lower mass thresholds (proxy for luminosity) applied to the satellite samples, from to .
- Comparing our results with some previous observational studies, we find that the fitted DOS plane in our simulations can exhibit a significant inclination angle relative to the galactic disk which is slightly larger than the one observed in the Milky Way. However, the fitted DOS disk in the simulations is also thicker than that of the Milky Way. That is, the DOS aspect ratios given in Table 2 for the simulations range from 0.1 to 0.3, whereas the observed aspect ratio for the Milky Way DOS is ∼0.1–0.2.
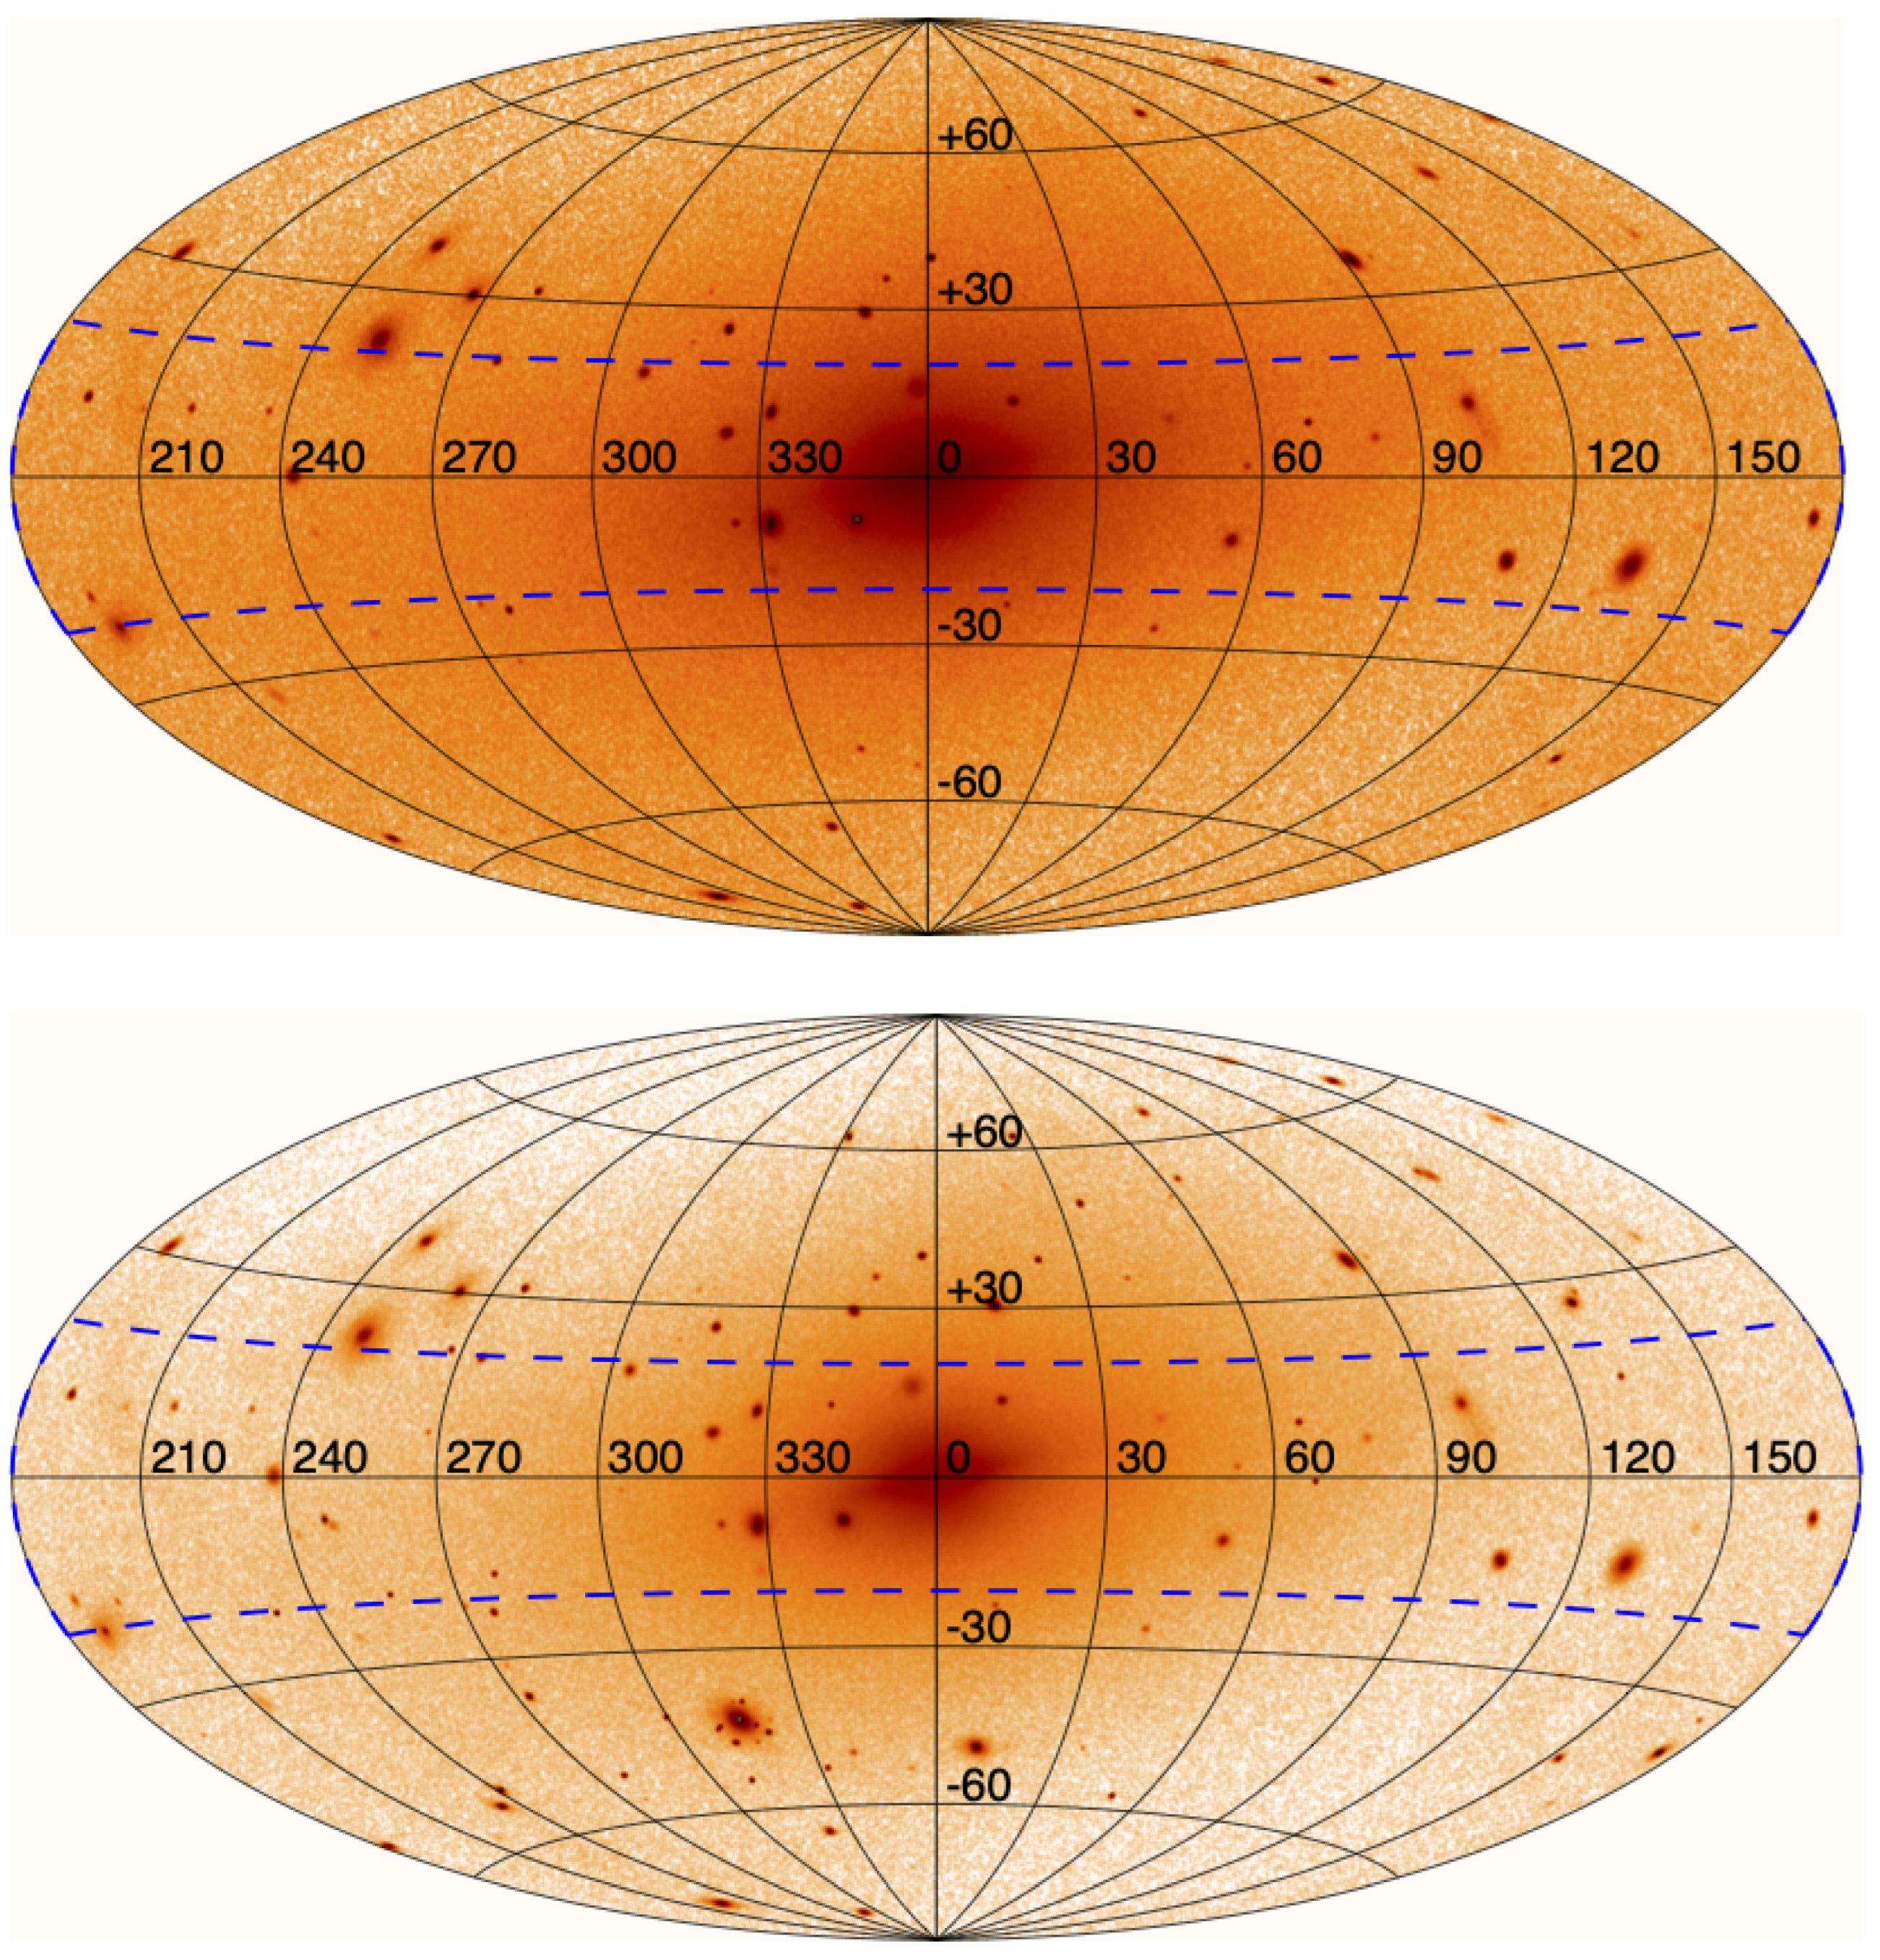
- We also find that the “Zone of Avoidance” of the Milky Way may have some impacts on the fitted parameters. Indeed, when including the ZOA in the simulations, the properties (angles, distances, etc.) from the simulations more closely resemble those from observations.
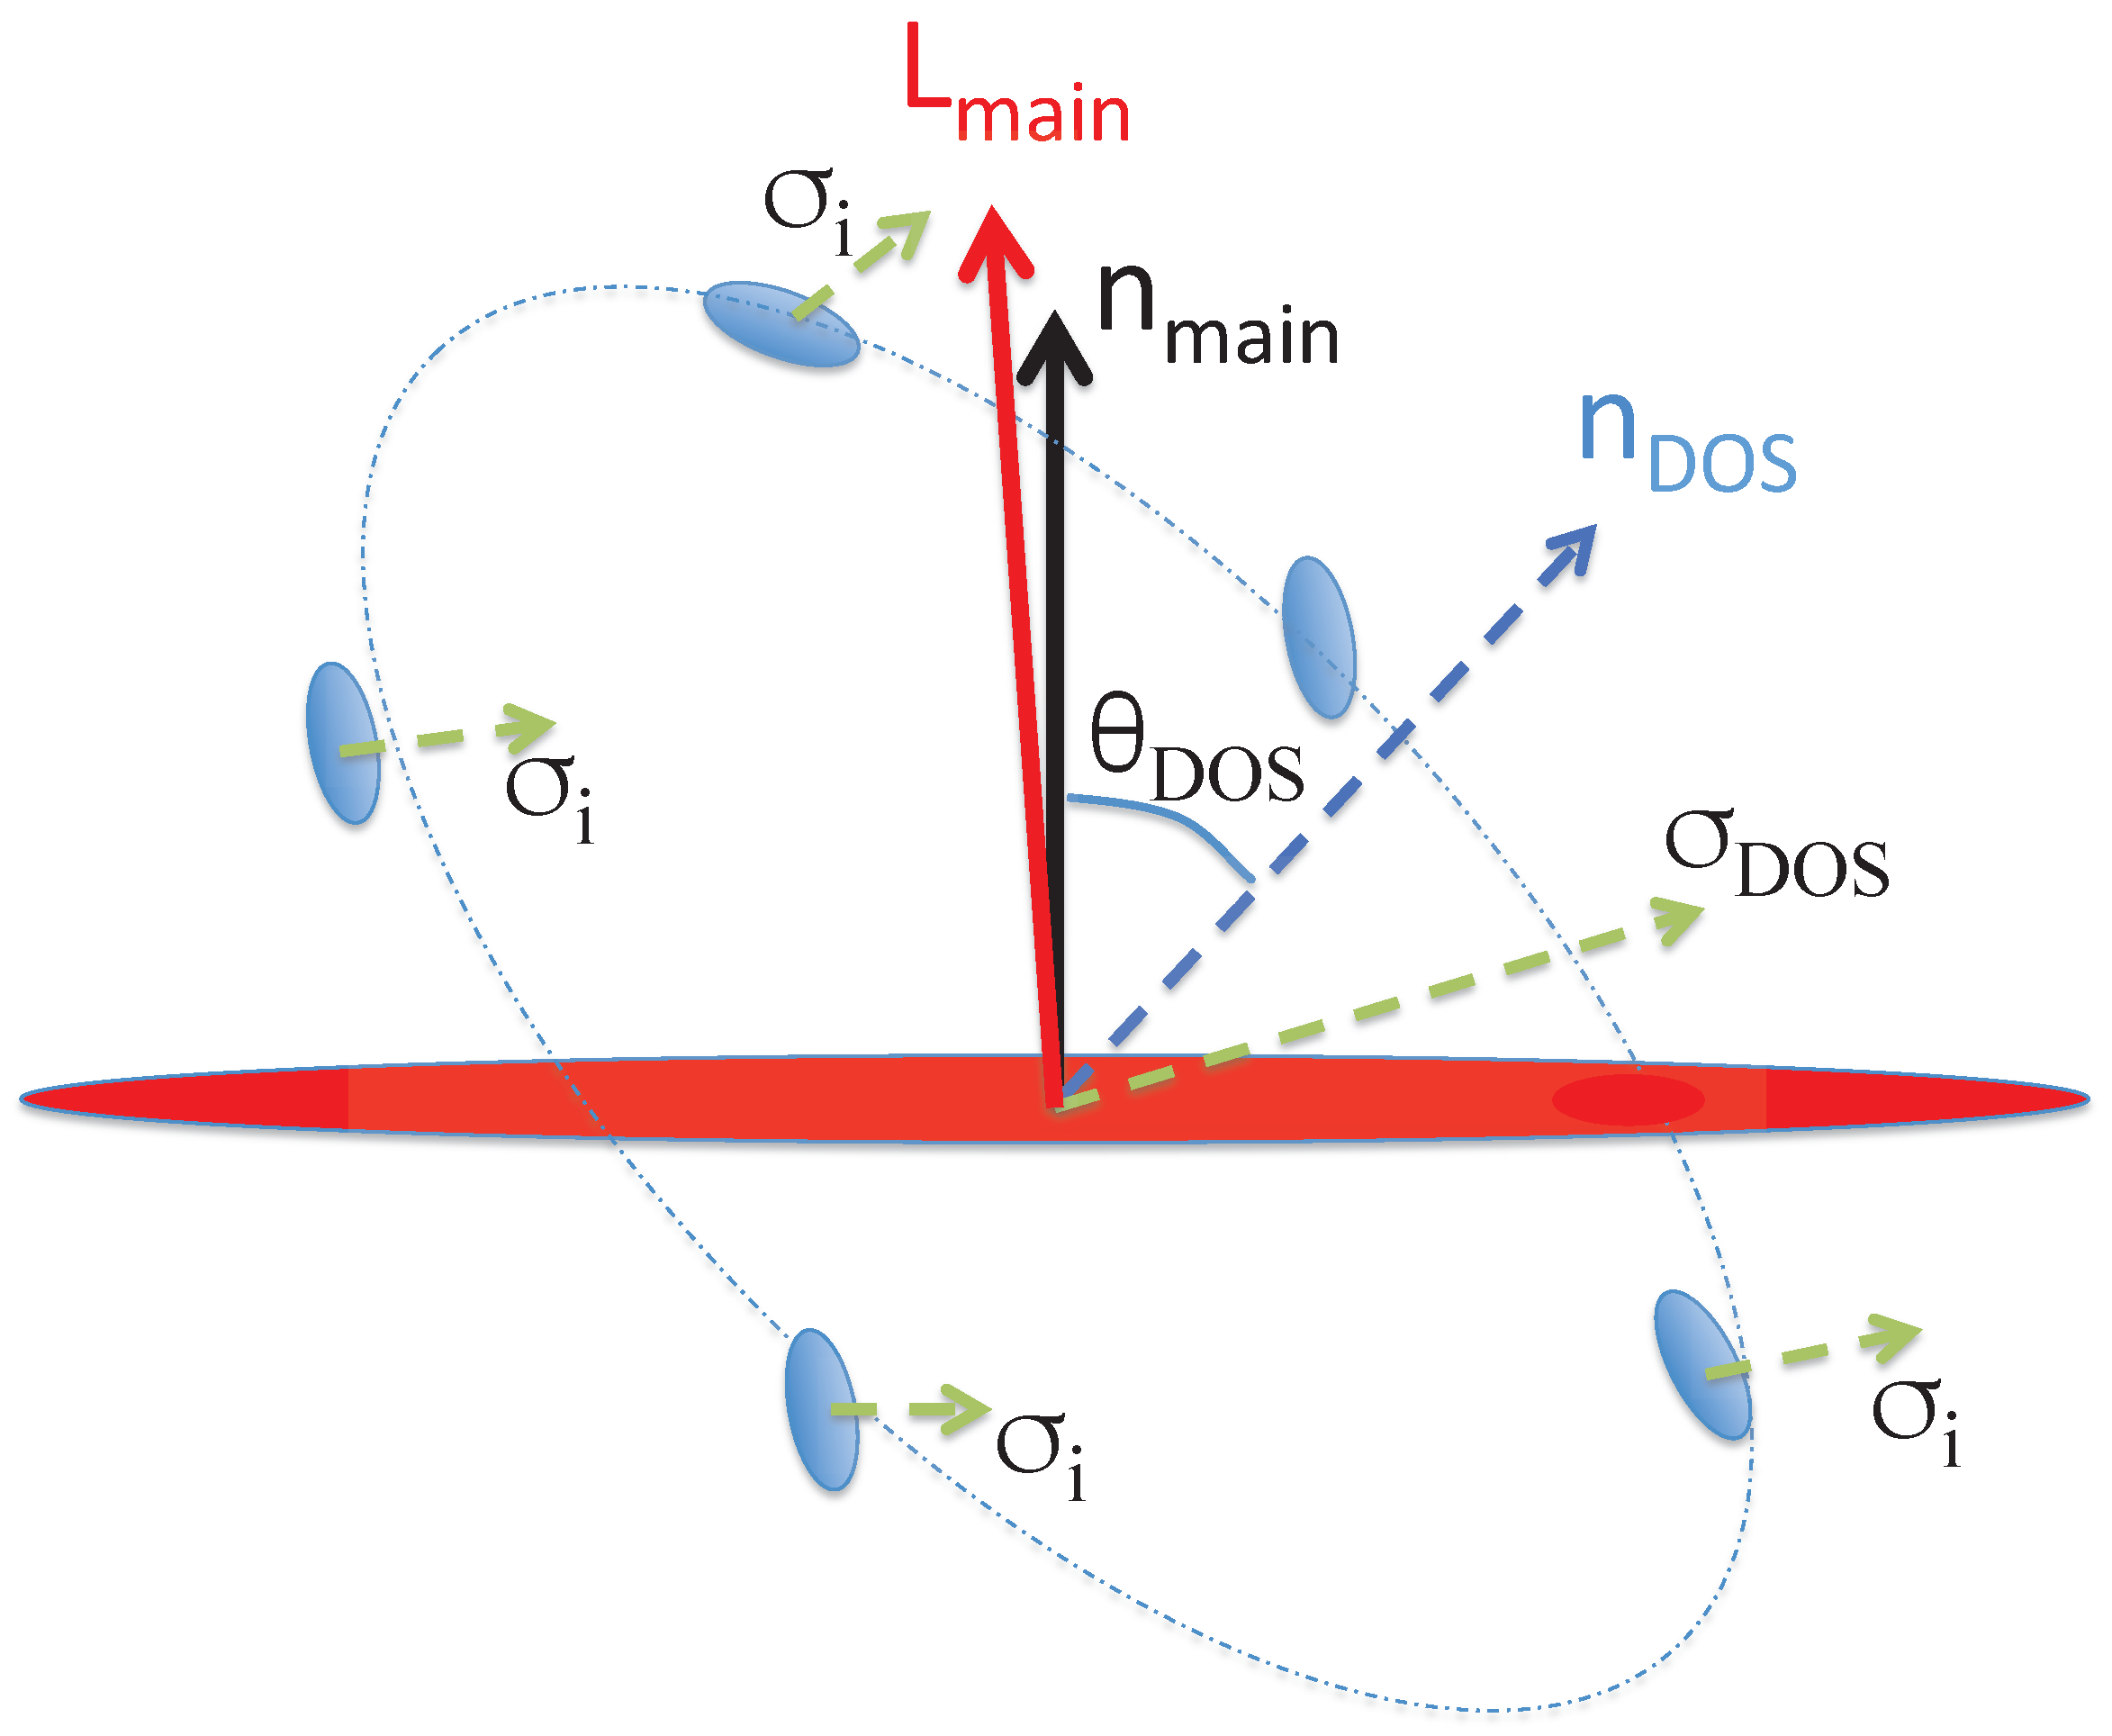
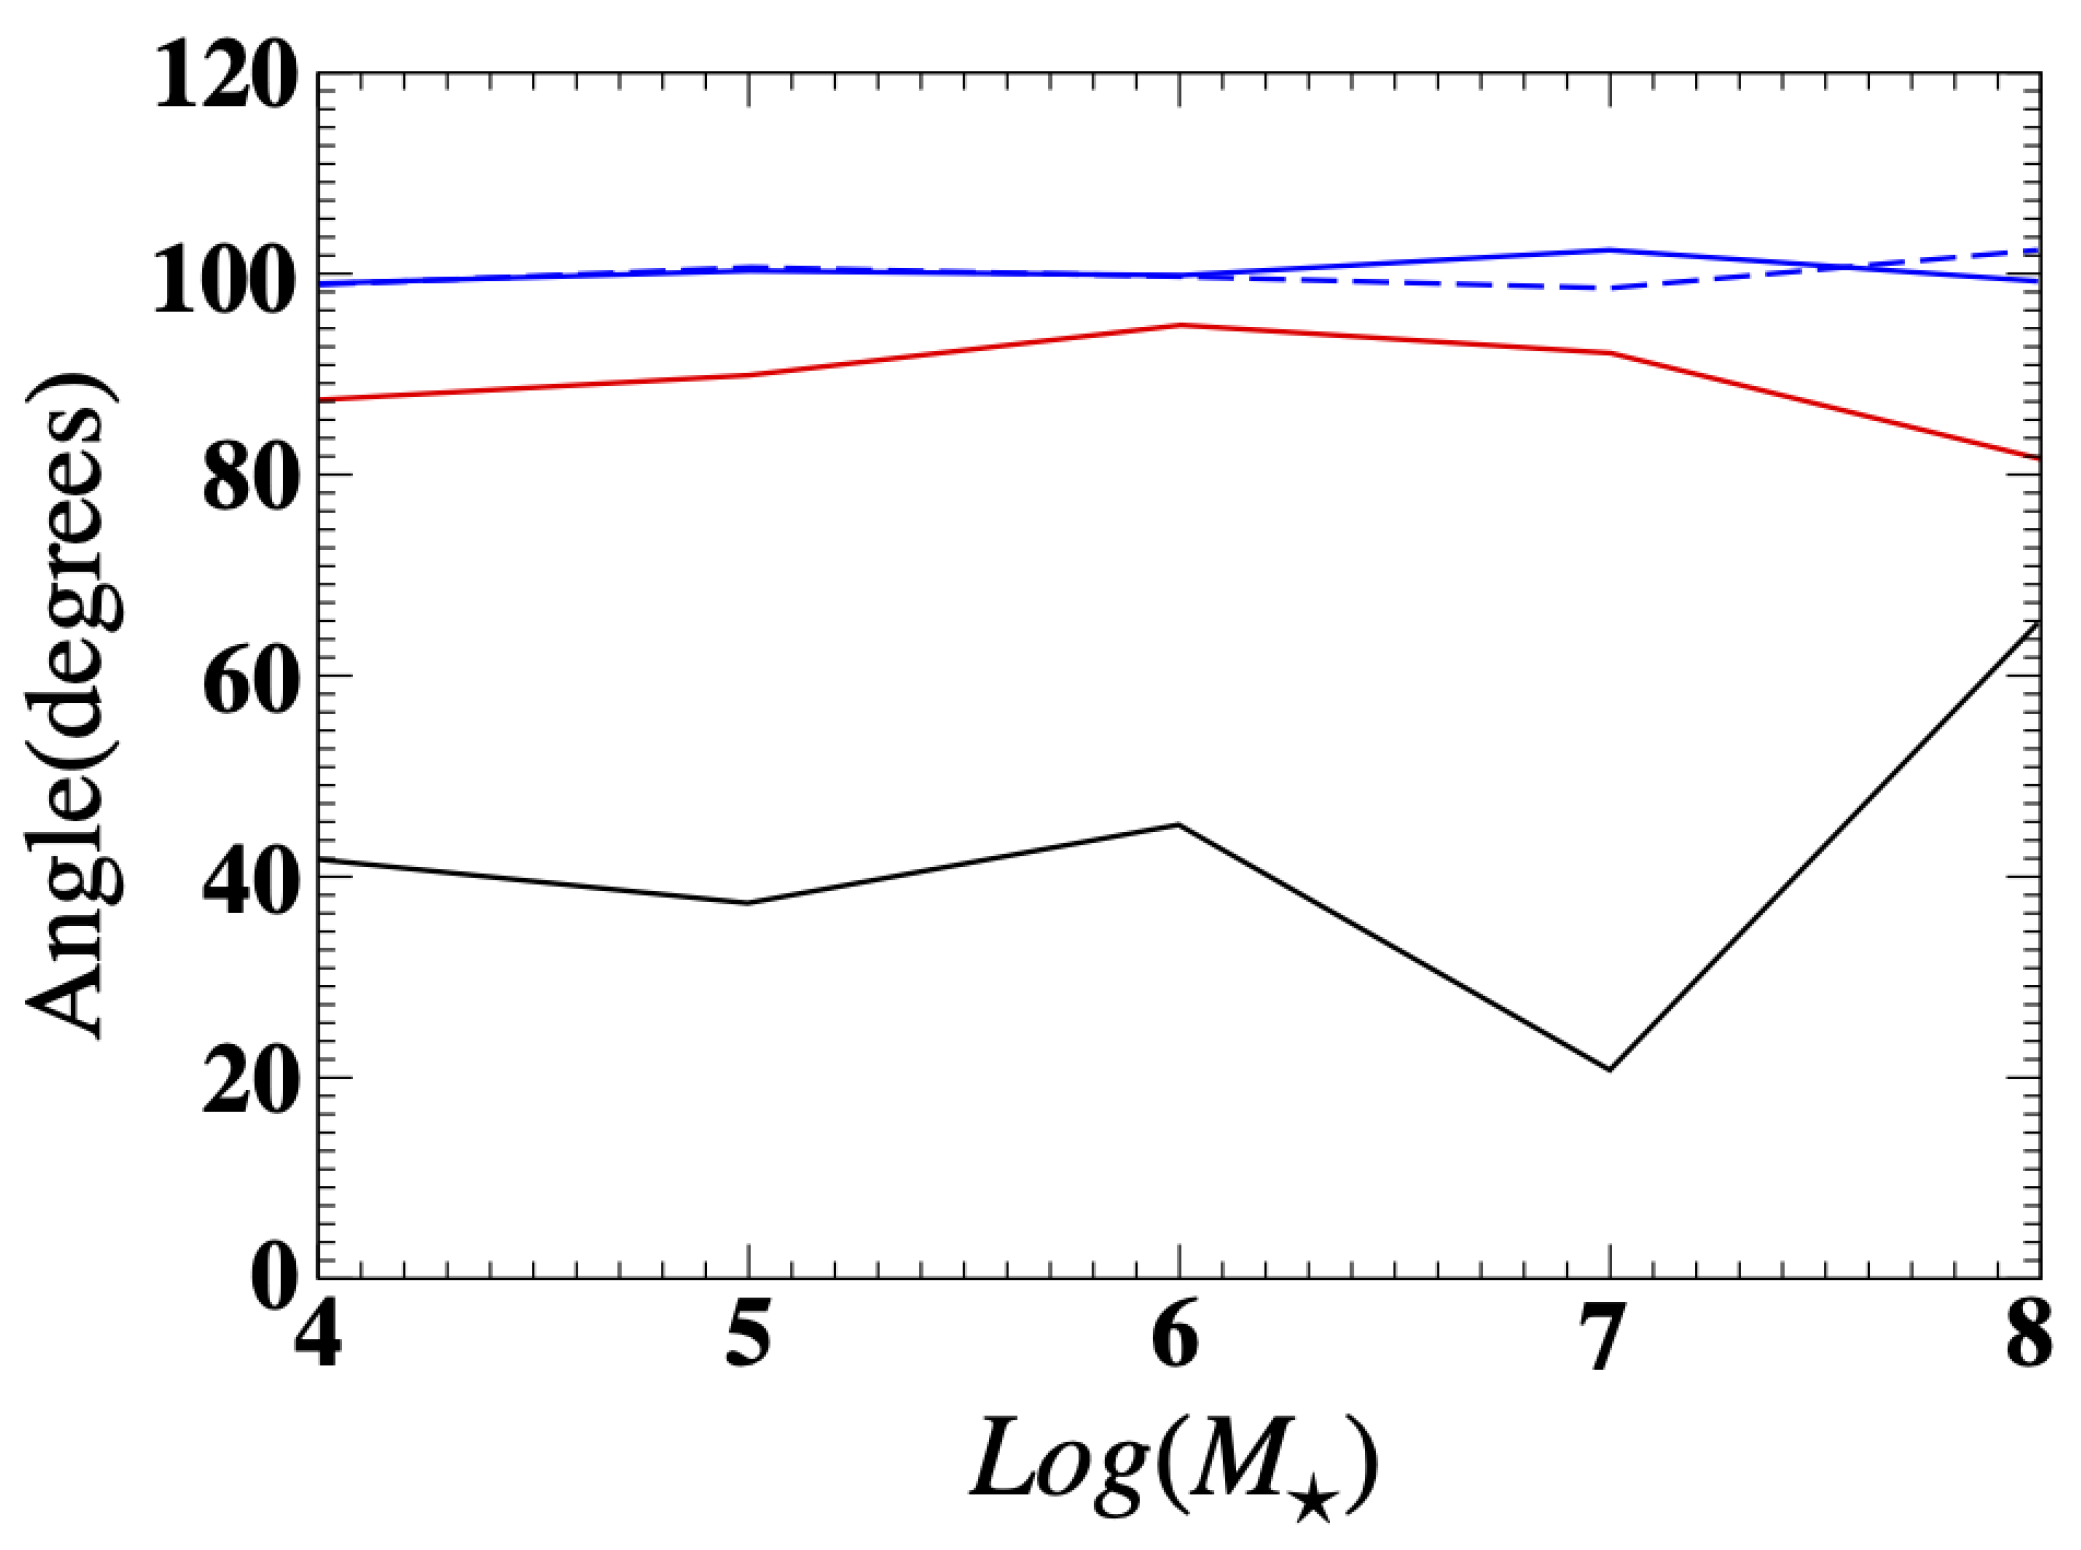
- Perhaps the most important conclusion from this study is the pronounced difference in the direction of the angular momentum of satellites in the DOS plane compared to the main galaxy. In the simulations, they are nearly perpendicular to each other suggesting that the satellite motion is consistent with infall from a larger scale. This is consistent with the observational data, indicating that, at least in our current study, the DOS is not rotationally supported.
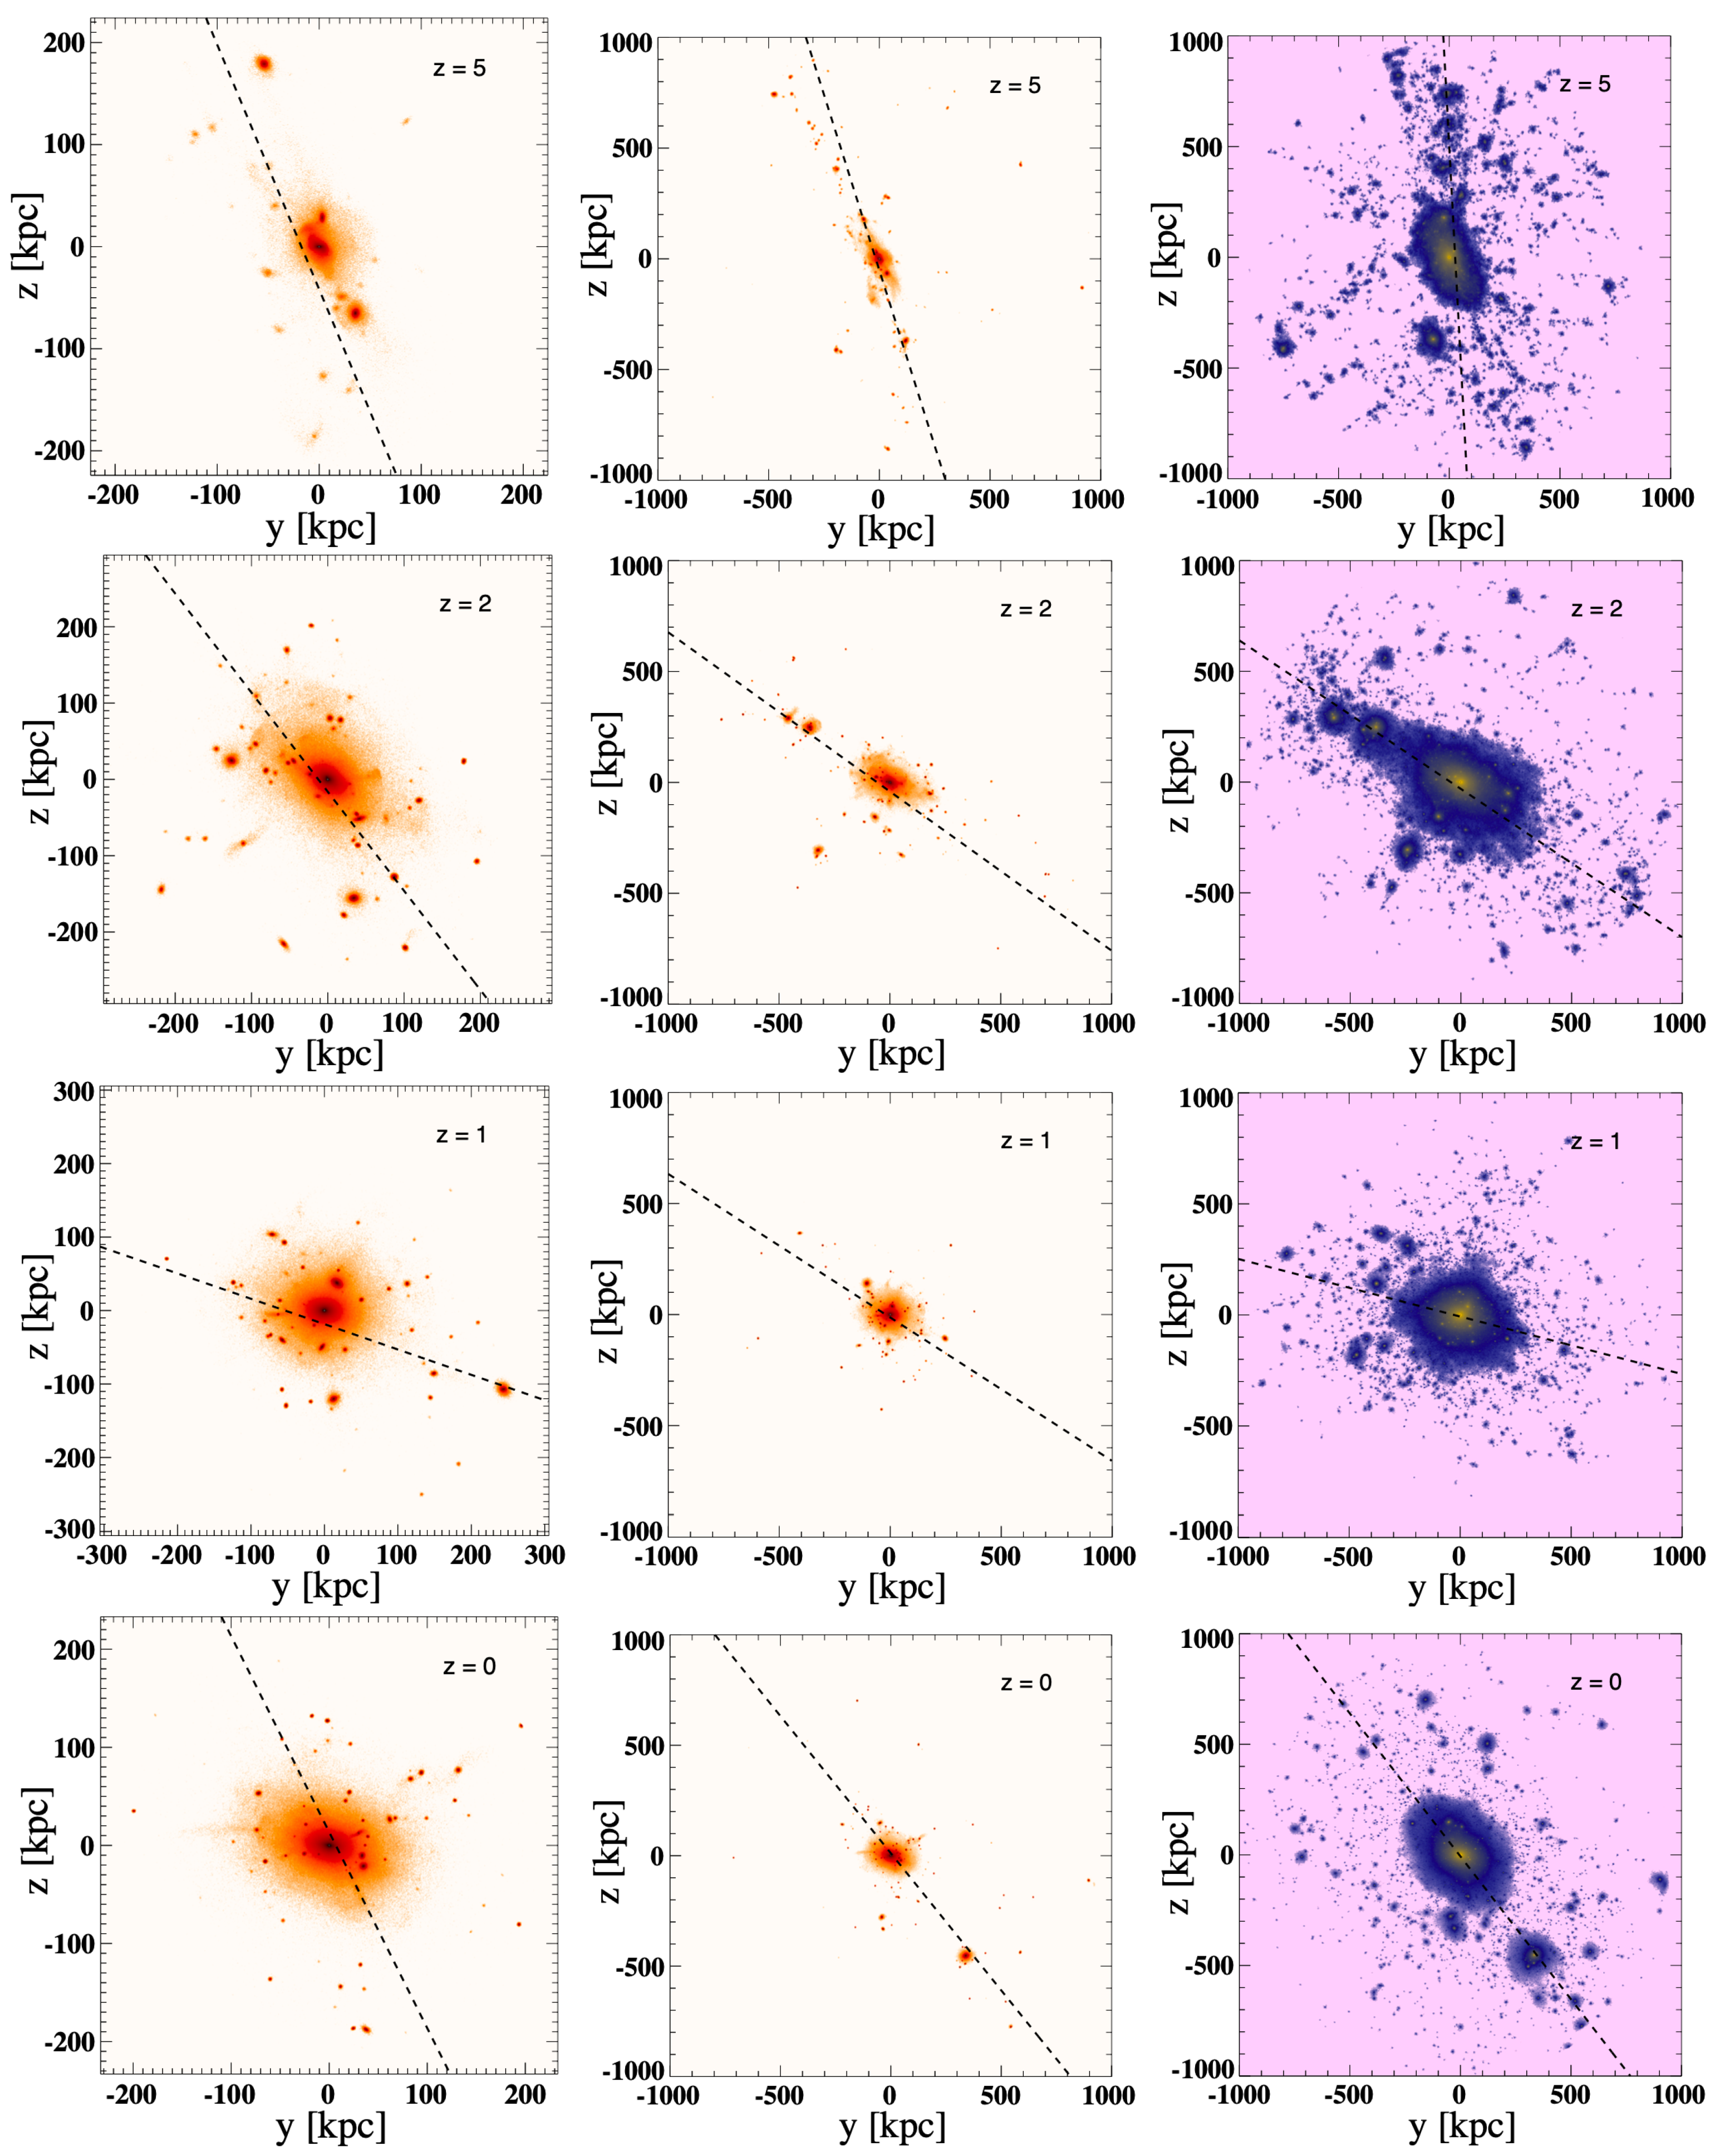
- Our analysis shows that the anisotropic distribution of the satellites in the simulations can have characteristic properties such as angles and distances similar to the characteristics of the Milky Way’s fitted DOS from observations.
Author Contributions
Funding
Data Availability Statement
Acknowledgments
Conflicts of Interest
| 1 | This is only for the purpose of finding the orientation of the stellar disk in this study, not an exact definition. |
| 2 | The inclination angle discussed here is the angle between the DOS plane and the stellar disk plane of the main galaxy. It is equal to the angle between the normal direction of the DOS and the angular momentum vector direction of the main stellar disk as plotted in Figure 6. |
| 3 | The satellites studied here may not all be gravitationally bound to the main galaxy, we keep the term only for the purpose of studying their spatial distribution. |
References
- Lynden-Bell, D. Dwarf galaxies and globular clusters in high velocity hydrogen streams. Mon. Not. R. Astron. Soc. 1976, 174, 695–710. [Google Scholar] [CrossRef]
- Kunkel, W.E.; Demers, S. The Magellanic Plane. In Royal Greenwich Observatory Bulletin, Proceedings of the Galaxy and the Local Group, Tercentenary Symposium, Hailsham, UK, 22–25 July 1975; Dickens, R.J., Perry, J.E., Smith, F.G., King, I.R., Eds.; Royal Greenwich Observatory: Herstmonceux, UK, 1976; Volume 182, p. 241. [Google Scholar]
- Kroupa, P.; Theis, C.; Boily, C.M. The great disk of Milky-Way satellites and cosmological sub-structures. Astron. Astrophys. 2005, 431, 517–521. [Google Scholar] [CrossRef]
- Kroupa, P.; Famaey, B.; de Boer, K.S.; Dabringhausen, J.; Pawlowski, M.S.; Boily, C.M.; Jerjen, H.; Forbes, D.; Hensler, G.; Metz, M. Local-Group tests of dark-matter concordance cosmology. Towards a new paradigm for structure formation. Astron. Astrophys. 2010, 523, A32. [Google Scholar] [CrossRef]
- Kroupa, P. The Dark Matter Crisis: Falsification of the Current Standard Model of Cosmology. Publ. Astron. Soc. Aust. 2012, 29, 395–433. [Google Scholar] [CrossRef]
- Metz, M.; Kroupa, P.; Jerjen, H. Discs of satellites: The new dwarf spheroidals. Mon. Not. R. Astron. Soc. 2009, 394, 2223–2228. [Google Scholar] [CrossRef]
- Simon, J.D. The Faintest Dwarf Galaxies. Annu. Rev. Astron. Astrophys. 2019, 57, 375–415. [Google Scholar] [CrossRef]
- Grebel, E.K.; Kolatt, T.; Brandner, W. Orbits versus Star Formation Histories: A Progress Report. In The Stellar Content of Local Group Galaxies, Proceedings of the 192nd Symposium of the International Astronomical Union, Cape Town, South Africa, 7–11 September 1998; Whitelock, P., Cannon, R., Eds.; Astronomical Society of the Pacific (ASP): San Francisco, CA, USA, 1999; Volume 192, p. 447. [Google Scholar]
- Hartwick, F.D.A. The Structure of the Outer Halo of the Galaxy and its Relationship to Nearby Large-Scale Structure. Astron. J. 2000, 119, 2248–2253. [Google Scholar] [CrossRef]
- Koch, A.; Grebel, E.K. The Anisotropic Distribution of M31 Satellite Galaxies: A Polar Great Plane of Early type Companions. Astron. J. 2006, 131, 1405–1415. [Google Scholar] [CrossRef]
- McConnachie, A.W.; Irwin, M.J. The satellite distribution of M31. Mon. Not. R. Astron. Soc. 2006, 365, 902–914. [Google Scholar] [CrossRef]
- Metz, M.; Kroupa, P.; Jerjen, H. The spatial distribution of the Milky Way and Andromeda satellite galaxies. Mon. Not. R. Astron. Soc. 2007, 374, 1125–1145. [Google Scholar] [CrossRef]
- Martin, N.F.; McConnachie, A.W.; Irwin, M.; Widrow, L.M.; Ferguson, A.M.N.; Ibata, R.A.; Dubinski, J.; Babul, A.; Chapman, S.; Fardal, M.; et al. PAndAS’ Cubs: Discovery of Two New Dwarf Galaxies in the Surroundings of the Andromeda and Triangulum Galaxies. Astrophys. J. 2009, 705, 758–765. [Google Scholar] [CrossRef]
- Richardson, J.C.; Irwin, M.J.; McConnachie, A.W.; Martin, N.F.; Dotter, A.L.; Ferguson, A.M.N.; Ibata, R.A.; Chapman, S.C.; Lewis, G.F.; Tanvir, N.R.; et al. PAndAS’ Progeny: Extending the M31 Dwarf Galaxy Cabal. Astrophys. J. 2011, 732, 76. [Google Scholar] [CrossRef]
- Martin, N.F.; Slater, C.T.; Schlafly, E.F.; Morganson, E.; Rix, H.W.; Bell, E.F.; Laevens, B.P.M.; Bernard, E.J.; Ferguson, A.M.N.; Finkbeiner, D.P.; et al. Lacerta I and Cassiopeia III. Two Luminous and Distant Andromeda Satellite Dwarf Galaxies Found in the 3π Pan-Starrs1 Survey. Astrophys. J. 2013, 772, 15. [Google Scholar] [CrossRef]
- Martínez-Delgado, D.; Karim, N.; Charles, E.J.E.; Boschin, W.; Monelli, M.; Collins, M.L.M.; Donatiello, G.; Alfaro, E.J. Pisces VII: Discovery of a possible satellite of Messier 33 in the DESI legacy imaging surveys. Mon. Not. R. Astron. Soc. 2021, 509, 16–24. [Google Scholar] [CrossRef]
- Lynden-Bell, D.; Lynden-Bell, R.M. Ghostly streams from the formation of the Galaxy’s halo. Mon. Not. R. Astron. Soc. 1995, 275, 429–442. [Google Scholar] [CrossRef]
- Metz, M.; Kroupa, P.; Libeskind, N.I. The Orbital Poles of Milky Way Satellite Galaxies: A Rotationally Supported Disk of Satellites. Astrophys. J. 2008, 680, 287–294. [Google Scholar] [CrossRef]
- Santos-Santos, I.; Domínguez-Tenreiro, R.; Artal, H.; Pedrosa, S.E.; Bignone, L.; Martínez-Serrano, F.; Gómez-Flechoso, M.Á.; Tissera, P.B.; Serna, A. Planes of Satellites around Simulated Disk Galaxies. I. Finding High-quality Planar Configurations from Positional Information and Their Comparison to MW/M31 Data. Astrophys. J. 2020, 897, 71. [Google Scholar] [CrossRef]
- Wang, P.; Libeskind, N.I.; Tempel, E.; Pawlowski, M.S.; Kang, X.; Guo, Q. The Alignment of Satellite Systems with Cosmic Filaments in the SDSS DR12. Astrophys. J. 2020, 900, 129. [Google Scholar] [CrossRef]
- Pawlowski, M.S.; Tony Sohn, S. On the Co-orbitation of Satellite Galaxies along the Great Plane of Andromeda: NGC 147, NGC 185, and Expectations from Cosmological Simulations. Astrophys. J. 2021, 923, 42. [Google Scholar] [CrossRef]
- Keller, S.C.; Mackey, D.; Da Costa, G.S. The Globular Cluster System of the Milky Way: Accretion in a Cosmological Context. Astrophys. J. 2012, 744, 57. [Google Scholar] [CrossRef]
- Pawlowski, M.S.; Pflamm-Altenburg, J.; Kroupa, P. The VPOS: A vast polar structure of satellite galaxies, globular clusters and streams around the Milky Way. Mon. Not. R. Astron. Soc. 2012, 423, 1109–1126. [Google Scholar] [CrossRef]
- Cautun, M.; Wang, W.; Frenk, C.S.; Sawala, T. A new spin on discs of satellite galaxies. Mon. Not. R. Astron. Soc. 2015, 449, 2576–2587. [Google Scholar] [CrossRef]
- Libeskind, N.I.; Guo, Q.; Tempel, E.; Ibata, R. The Lopsided Distribution of Satellite Galaxies. Astrophys. J. 2016, 830, 121. [Google Scholar] [CrossRef]
- Maji, M.; Zhu, Q.; Marinacci, F.; Li, Y. Is There a Disk of Satellites around the Milky Way? Astrophys. J. 2017, 843, 62. [Google Scholar] [CrossRef]
- Shao, S.; Cautun, M.; Frenk, C.S. Evolution of galactic planes of satellites in the EAGLE simulation. Mon. Not. R. Astron. Soc. 2019, 488, 1166–1179. [Google Scholar] [CrossRef]
- Gu, Q.; Guo, Q.; Zhang, T.; Cautun, M.; Lacey, C.; Frenk, C.S.; Shao, S. The spatial distribution of satellites in galaxy clusters. Mon. Not. R. Astron. Soc. 2022, 514, 390–402. [Google Scholar] [CrossRef]
- Pawlowski, M.S.; Kroupa, P.; Angus, G.; de Boer, K.S.; Famaey, B.; Hensler, G. Filamentary accretion cannot explain the orbital poles of the Milky Way satellites. Mon. Not. R. Astron. Soc. 2012, 424, 80–92. [Google Scholar] [CrossRef]
- Cautun, M.; Frenk, C.S. The tangential velocity excess of the Milky Way satellites. Mon. Not. R. Astron. Soc. 2017, 468, L41–L45. [Google Scholar] [CrossRef]
- Sawala, T.; Cautun, M.; Frenk, C.; Helly, J.; Jasche, J.; Jenkins, A.; Johansson, P.H.; Lavaux, G.; McAlpine, S.; Schaller, M. The Milky Way’s plane of satellites is consistent with ΛCDM. Nat. Astron. 2022, 7, 481–491. [Google Scholar] [CrossRef]
- Holmberg, E. A study of physical groups of galaxies. Ark. Astron. 1969, 5, 305–343. [Google Scholar]
- Zaritsky, D.; Smith, R.; Frenk, C.S.; White, S.D.M. Anisotropies in the Distribution of Satellite Galaxies. Astrophys. J. Lett. 1997, 478, L53. [Google Scholar] [CrossRef]
- Sales, L.; Lambas, D.G. Anisotropy in the distribution of satellites around primary galaxies in the 2dF Galaxy Redshift Survey: The Holmberg effect. Mon. Not. R. Astron. Soc. 2004, 348, 1236–1240. [Google Scholar] [CrossRef]
- Brainerd, T.G. Anisotropic Distribution of SDSS Satellite Galaxies: Planar (Not Polar) Alignment. Astrophys. J. Lett. 2005, 628, L101–L104. [Google Scholar] [CrossRef]
- Yang, X.; Mo, H.J.; van den Bosch, F.C.; Weinmann, S.M.; Li, C.; Jing, Y.P. The cross-correlation between galaxies and groups: Probing the galaxy distribution in and around dark matter haloes. Mon. Not. R. Astron. Soc. 2005, 362, 711–726. [Google Scholar] [CrossRef]
- Azzaro, M.; Patiri, S.G.; Prada, F.; Zentner, A.R. Angular distribution of satellite galaxies from the Sloan Digital Sky Survey Data Release 4. Mon. Not. R. Astron. Soc. 2007, 376, L43–L47. [Google Scholar] [CrossRef]
- Bailin, J.; Power, C.; Norberg, P.; Zaritsky, D.; Gibson, B.K. The anisotropic distribution of satellite galaxies. Mon. Not. R. Astron. Soc. 2008, 390, 1133–1156. [Google Scholar] [CrossRef]
- Steffen, J.H.; Valenzuela, O. Constraints on the angular distribution of satellite galaxies about spiral hosts. Mon. Not. R. Astron. Soc. 2008, 387, 1199–1205. [Google Scholar] [CrossRef]
- Agustsson, I.; Brainerd, T.G. Anisotropic Locations of Satellite Galaxies: Clues to the Orientations of Galaxies within their Dark Matter Halos. Astrophys. J. 2010, 709, 1321–1336. [Google Scholar] [CrossRef]
- Kang, X.; Mao, S.; Gao, L.; Jing, Y.P. Are great disks defined by satellite galaxies in Milky-Way type halos rare in ΛCDM? Astron. Astrophys. 2005, 437, 383–388. [Google Scholar] [CrossRef]
- Libeskind, N.I.; Frenk, C.S.; Cole, S.; Helly, J.C.; Jenkins, A.; Navarro, J.F.; Power, C. The distribution of satellite galaxies: The great pancake. Mon. Not. R. Astron. Soc. 2005, 363, 146–152. [Google Scholar] [CrossRef]
- Zentner, A.R.; Kravtsov, A.V.; Gnedin, O.Y.; Klypin, A.A. The Anisotropic Distribution of Galactic Satellites. Astrophys. J. 2005, 629, 219–232. [Google Scholar] [CrossRef]
- Agustsson, I.; Brainerd, T.G. The Locations of Satellite Galaxies in a ΛCDM Universe. Astrophys. J. 2006, 650, 550–559. [Google Scholar] [CrossRef]
- Libeskind, N.I.; Cole, S.; Frenk, C.S.; Okamoto, T.; Jenkins, A. Satellite systems around galaxies in hydrodynamic simulations. Mon. Not. R. Astron. Soc. 2007, 374, 16–28. [Google Scholar] [CrossRef]
- Libeskind, N.I.; Frenk, C.S.; Cole, S.; Jenkins, A.; Helly, J.C. How common is the Milky Way-satellite system alignment? Mon. Not. R. Astron. Soc. 2009, 399, 550–558. [Google Scholar] [CrossRef]
- Deason, A.J.; McCarthy, I.G.; Font, A.S.; Evans, N.W.; Frenk, C.S.; Belokurov, V.; Libeskind, N.I.; Crain, R.A.; Theuns, T. Mismatch and misalignment: Dark haloes and satellites of disc galaxies. Mon. Not. R. Astron. Soc. 2011, 415, 2607–2625. [Google Scholar] [CrossRef]
- Wang, J.; Frenk, C.S.; Cooper, A.P. The spatial distribution of galactic satellites in the Λ cold dark matter cosmology. Mon. Not. R. Astron. Soc. 2013, 429, 1502–1513. [Google Scholar] [CrossRef]
- Lovell, M.R.; Eke, V.R.; Frenk, C.S.; Jenkins, A. The link between galactic satellite orbits and sub-halo accretion. Mon. Not. R. Astron. Soc. 2011, 413, 3013–3021. [Google Scholar] [CrossRef]
- Pawlowski, M.S.; Kroupa, P. The Milky Way’s disc of classical satellite galaxies in light of Gaia DR2. Mon. Not. R. Astron. Soc. 2020, 491, 3042–3059. [Google Scholar] [CrossRef]
- Boylan-Kolchin, M. Planes of satellites are not a problem for (just) ΛCDM. Nat. Astron. 2021, 5, 1188–1190. [Google Scholar] [CrossRef]
- Zwicky, F. Multiple Galaxies. Ergeb. Exakten Naturwiss. 1956, 29, 344–385. [Google Scholar]
- Kroupa, P. Dwarf spheroidal satellite galaxies without dark matter. New Astron. 1997, 2, 139–164. [Google Scholar] [CrossRef]
- Metz, M.; Kroupa, P. Dwarf spheroidal satellites: Are they of tidal origin? Mon. Not. R. Astron. Soc. 2007, 376, 387–392. [Google Scholar] [CrossRef]
- Okazaki, T.; Taniguchi, Y. Dwarf Galaxy Formation Induced by Galaxy Interactions. Astrophys. J. 2000, 543, 149–152. [Google Scholar] [CrossRef]
- Bournaud, F. Tidal Dwarf Galaxies and Missing Baryons. Adv. Astron. 2010, 2010, 735284. [Google Scholar] [CrossRef]
- Pawlowski, M.S.; Kroupa, P.; de Boer, K.S. Making counter-orbiting tidal debris. The origin of the Milky Way disc of satellites? Astron. Astrophys. 2011, 532, A118. [Google Scholar] [CrossRef]
- Wetzstein, M.; Naab, T.; Burkert, A. Do dwarf galaxies form in tidal tails? Mon. Not. R. Astron. Soc. 2007, 375, 805–820. [Google Scholar] [CrossRef]
- Hammer, F.; Yang, Y.B.; Wang, J.L.; Puech, M.; Flores, H.; Fouquet, S. Does M31 Result from an Ancient Major Merger? Astrophys. J. 2010, 725, 542–555. [Google Scholar] [CrossRef]
- Yang, Y.; Hammer, F. Could the Magellanic Clouds be Tidal Dwarfs Expelled from a Past-merger Event Occurring in Andromeda? Astrophys. J. Lett. 2010, 725, L24–L27. [Google Scholar] [CrossRef]
- Fouquet, S.; Hammer, F.; Yang, Y.; Puech, M.; Flores, H. Does the dwarf galaxy system of the Milky Way originate from Andromeda? Mon. Not. R. Astron. Soc. 2012, 427, 1769–1783. [Google Scholar] [CrossRef]
- Barnes, J.E.; Hernquist, L. Formation of dwarf galaxies in tidal tails. Nature 1992, 360, 715–717. [Google Scholar] [CrossRef]
- Simon, J.D.; Geha, M. The Kinematics of the Ultra-faint Milky Way Satellites: Solving the Missing Satellite Problem. Astrophys. J. 2007, 670, 313–331. [Google Scholar] [CrossRef]
- Simon, J.D.; Geha, M.; Minor, Q.E.; Martinez, G.D.; Kirby, E.N.; Bullock, J.S.; Kaplinghat, M.; Strigari, L.E.; Willman, B.; Choi, P.I.; et al. A Complete Spectroscopic Survey of the Milky Way Satellite Segue 1: The Darkest Galaxy. Astrophys. J. 2011, 733, 46. [Google Scholar] [CrossRef]
- Klessen, R.S.; Kroupa, P. Dwarf Spheroidal Satellite Galaxies without Dark Matter: Results from Two Different Numerical Techniques. Astrophys. J. 1998, 498, 143. [Google Scholar] [CrossRef]
- Casas, R.A.; Arias, V.; Peña Ramírez, K.; Kroupa, P. Dwarf spheroidal satellites of the Milky Way from dark matter free tidal dwarf galaxy progenitors: Maps of orbits. Mon. Not. R. Astron. Soc. 2012, 424, 1941–1951. [Google Scholar] [CrossRef]
- Samuel, J.; Wetzel, A.; Chapman, S.; Tollerud, E.; Hopkins, P.F.; Boylan-Kolchin, M.; Bailin, J.; Faucher-Giguère, C.A. Planes of satellites around Milky Way/M31-mass galaxies in the FIRE simulations and comparisons with the Local Group. Mon. Not. R. Astron. Soc. 2021, 504, 1379–1397. [Google Scholar] [CrossRef]
- Wetzel, A.; Hayward, C.C.; Sanderson, R.E.; Ma, X.; Anglés-Alcázar, D.; Feldmann, R.; Chan, T.K.; El-Badry, K.; Wheeler, C.; Garrison-Kimmel, S.; et al. Public Data Release of the FIRE-2 Cosmological Zoom-in Simulations of Galaxy Formation. Astrophys. J. Suppl. Ser. 2023, 265, 44. [Google Scholar] [CrossRef]
- Vasiliev, E. The Effect of the LMC on the Milky Way System. Galaxies 2023, 11, 59. [Google Scholar] [CrossRef]
- Vasiliev, E. Dear Magellanic Clouds, welcome back! arXiv 2023, arXiv:2306.04837. [Google Scholar] [CrossRef]
- Förster, P.U.; Remus, R.S.; Dolag, K.; Kimmig, L.C.; Teklu, A.; Valenzuela, L.M. Planes of Satellite Galaxies in the Magneticum Pathfinder Simulations. arXiv 2022, arXiv:2208.05496. [Google Scholar] [CrossRef]
- Libeskind, N.I.; Carlesi, E.; Grand, R.J.J.; Khalatyan, A.; Knebe, A.; Pakmor, R.; Pilipenko, S.; Pawlowski, M.S.; Sparre, M.; Tempel, E.; et al. The HESTIA project: Simulations of the Local Group. Mon. Not. R. Astron. Soc. 2020, 498, 2968–2983. [Google Scholar] [CrossRef]
- Dupuy, A.; Libeskind, N.I.; Hoffman, Y.; Courtois, H.M.; Gottlöber, S.; Grand, R.J.J.; Knebe, A.; Sorce, J.G.; Tempel, E.; Tully, R.B.; et al. Anisotropic satellite accretion on to the Local Group with HESTIA. Mon. Not. R. Astron. Soc. 2022, 516, 4576–4584. [Google Scholar] [CrossRef]
- Pham, K.; Kravtsov, A.; Manwadkar, V. Spatial and orbital planes of the Milky Way satellites: Unusual but consistent with ΛCDM. Mon. Not. R. Astron. Soc. 2023, 520, 3937–3946. [Google Scholar] [CrossRef]
- Xu, Y.; Kang, X.; Libeskind, N.I. A rotating satellite plane around Milky Way-like galaxy from the TNG50 simulation. arXiv 2023, arXiv:2303.00441. [Google Scholar] [CrossRef]
- Scannapieco, C.; White, S.D.M.; Springel, V.; Tissera, P.B. The formation and survival of discs in a ΛCDM universe. Mon. Not. R. Astron. Soc. 2009, 396, 696–708. [Google Scholar] [CrossRef]
- Scannapieco, C.; White, S.D.M.; Springel, V.; Tissera, P.B. Formation history, structure and dynamics of discs and spheroids in simulated Milky Way mass galaxies. Mon. Not. R. Astron. Soc. 2011, 417, 154–171. [Google Scholar] [CrossRef]
- Springel, V.; Wang, J.; Vogelsberger, M.; Ludlow, A.; Jenkins, A.; Helmi, A.; Navarro, J.F.; Frenk, C.S.; White, S.D.M. The Aquarius Project: The sub-haloes of galactic haloes. Mon. Not. R. Astron. Soc. 2008, 391, 1685–1711. [Google Scholar] [CrossRef]
- Springel, V. The cosmological simulation code GADGET-2. Mon. Not. R. Astron. Soc. 2005, 364, 1105–1134. [Google Scholar] [CrossRef]
- Marinacci, F.; Pakmor, R.; Springel, V. The formation of disc galaxies in high-resolution moving-mesh cosmological simulations. Mon. Not. R. Astron. Soc. 2014, 437, 1750–1775. [Google Scholar] [CrossRef]
- Sawala, T.; Scannapieco, C.; White, S. Local Group dwarf galaxies: Nature and nurture. Mon. Not. R. Astron. Soc. 2012, 420, 1714–1730. [Google Scholar] [CrossRef]
- Springel, V.; White, S.D.M.; Tormen, G.; Kauffmann, G. Populating a cluster of galaxies—I. Results at z = 0. Mon. Not. R. Astron. Soc. 2001, 328, 726–750. [Google Scholar] [CrossRef]
- Klypin, A.; Kravtsov, A.V.; Valenzuela, O.; Prada, F. Where Are the Missing Galactic Satellites? Astrophys. J. 1999, 522, 82–92. [Google Scholar] [CrossRef]
- Moore, B.; Ghigna, S.; Governato, F.; Lake, G.; Quinn, T.; Stadel, J.; Tozzi, P. Dark Matter Substructure within Galactic Halos. Astrophys. J. Lett. 1999, 524, L19–L22. [Google Scholar] [CrossRef]
- Wadepuhl, M.; Springel, V. Satellite galaxies in hydrodynamical simulations of Milky Way sized galaxies. Mon. Not. R. Astron. Soc. 2011, 410, 1975–1992. [Google Scholar] [CrossRef]
- Font, A.S.; Benson, A.J.; Bower, R.G.; Frenk, C.S.; Cooper, A.; De Lucia, G.; Helly, J.C.; Helmi, A.; Li, Y.S.; McCarthy, I.G.; et al. The population of Milky Way satellites in the Λ cold dark matter cosmology. Mon. Not. R. Astron. Soc. 2011, 417, 1260–1279. [Google Scholar] [CrossRef]
- Santos-Santos, I.M.E.; Sales, L.V.; Fattahi, A.; Navarro, J.F. Satellite mass functions and the faint end of the galaxy mass-halo mass relation in LCDM. Mon. Not. R. Astron. Soc. 2022, 515, 3685–3697. [Google Scholar] [CrossRef]
- Gaia Collaboration; Helmi, A.; van Leeuwen, F.; McMillan, P.J.; Massari, D.; Antoja, T.; Robin, A.C.; Lindegren, L.; Bastian, U.; Arenou, F.; et al. Gaia Data Release 2. Kinematics of globular clusters and dwarf galaxies around the Milky Way. Astron. Astrophys. 2018, 616, A12. [Google Scholar] [CrossRef]
- Donoso, E.; O’Mill, A.; Lambas, D.G. Alignment between luminous red galaxies and surrounding structures at z∼0.5. Mon. Not. R. Astron. Soc. 2006, 369, 479–484. [Google Scholar] [CrossRef]
- Wang, Y.; Park, C.; Hwang, H.S.; Chen, X. Distribution of Satellite Galaxies in High-redshift Groups. Astrophys. J. 2010, 718, 762–767. [Google Scholar] [CrossRef]
- Gonzalez, P.; Zhao, X.; Tang, G.; Mathews, G. Are Satellite Planes Around Milky Way-Like Galaxies Just Showing Us Accretion Along The Filaments? In American Astronomical Society Meeting Abstracts; American Astronomical Society Publishing: Washington, DC, USA, 2023; Volume 55, p. 354.01. [Google Scholar]
- Cooper, A.P.; Koposov, S.E.; Allende Prieto, C.; Manser, C.J.; Kizhuprakkat, N.; Myers, A.D.; Dey, A.; Gänsicke, B.T.; Li, T.S.; Rockosi, C.; et al. Overview of the DESI Milky Way Survey. Astrophys. J. 2023, 947, 37. [Google Scholar] [CrossRef]


| Simulation | a | a | a | b | c |
|---|---|---|---|---|---|
| kpc | kpc | ||||
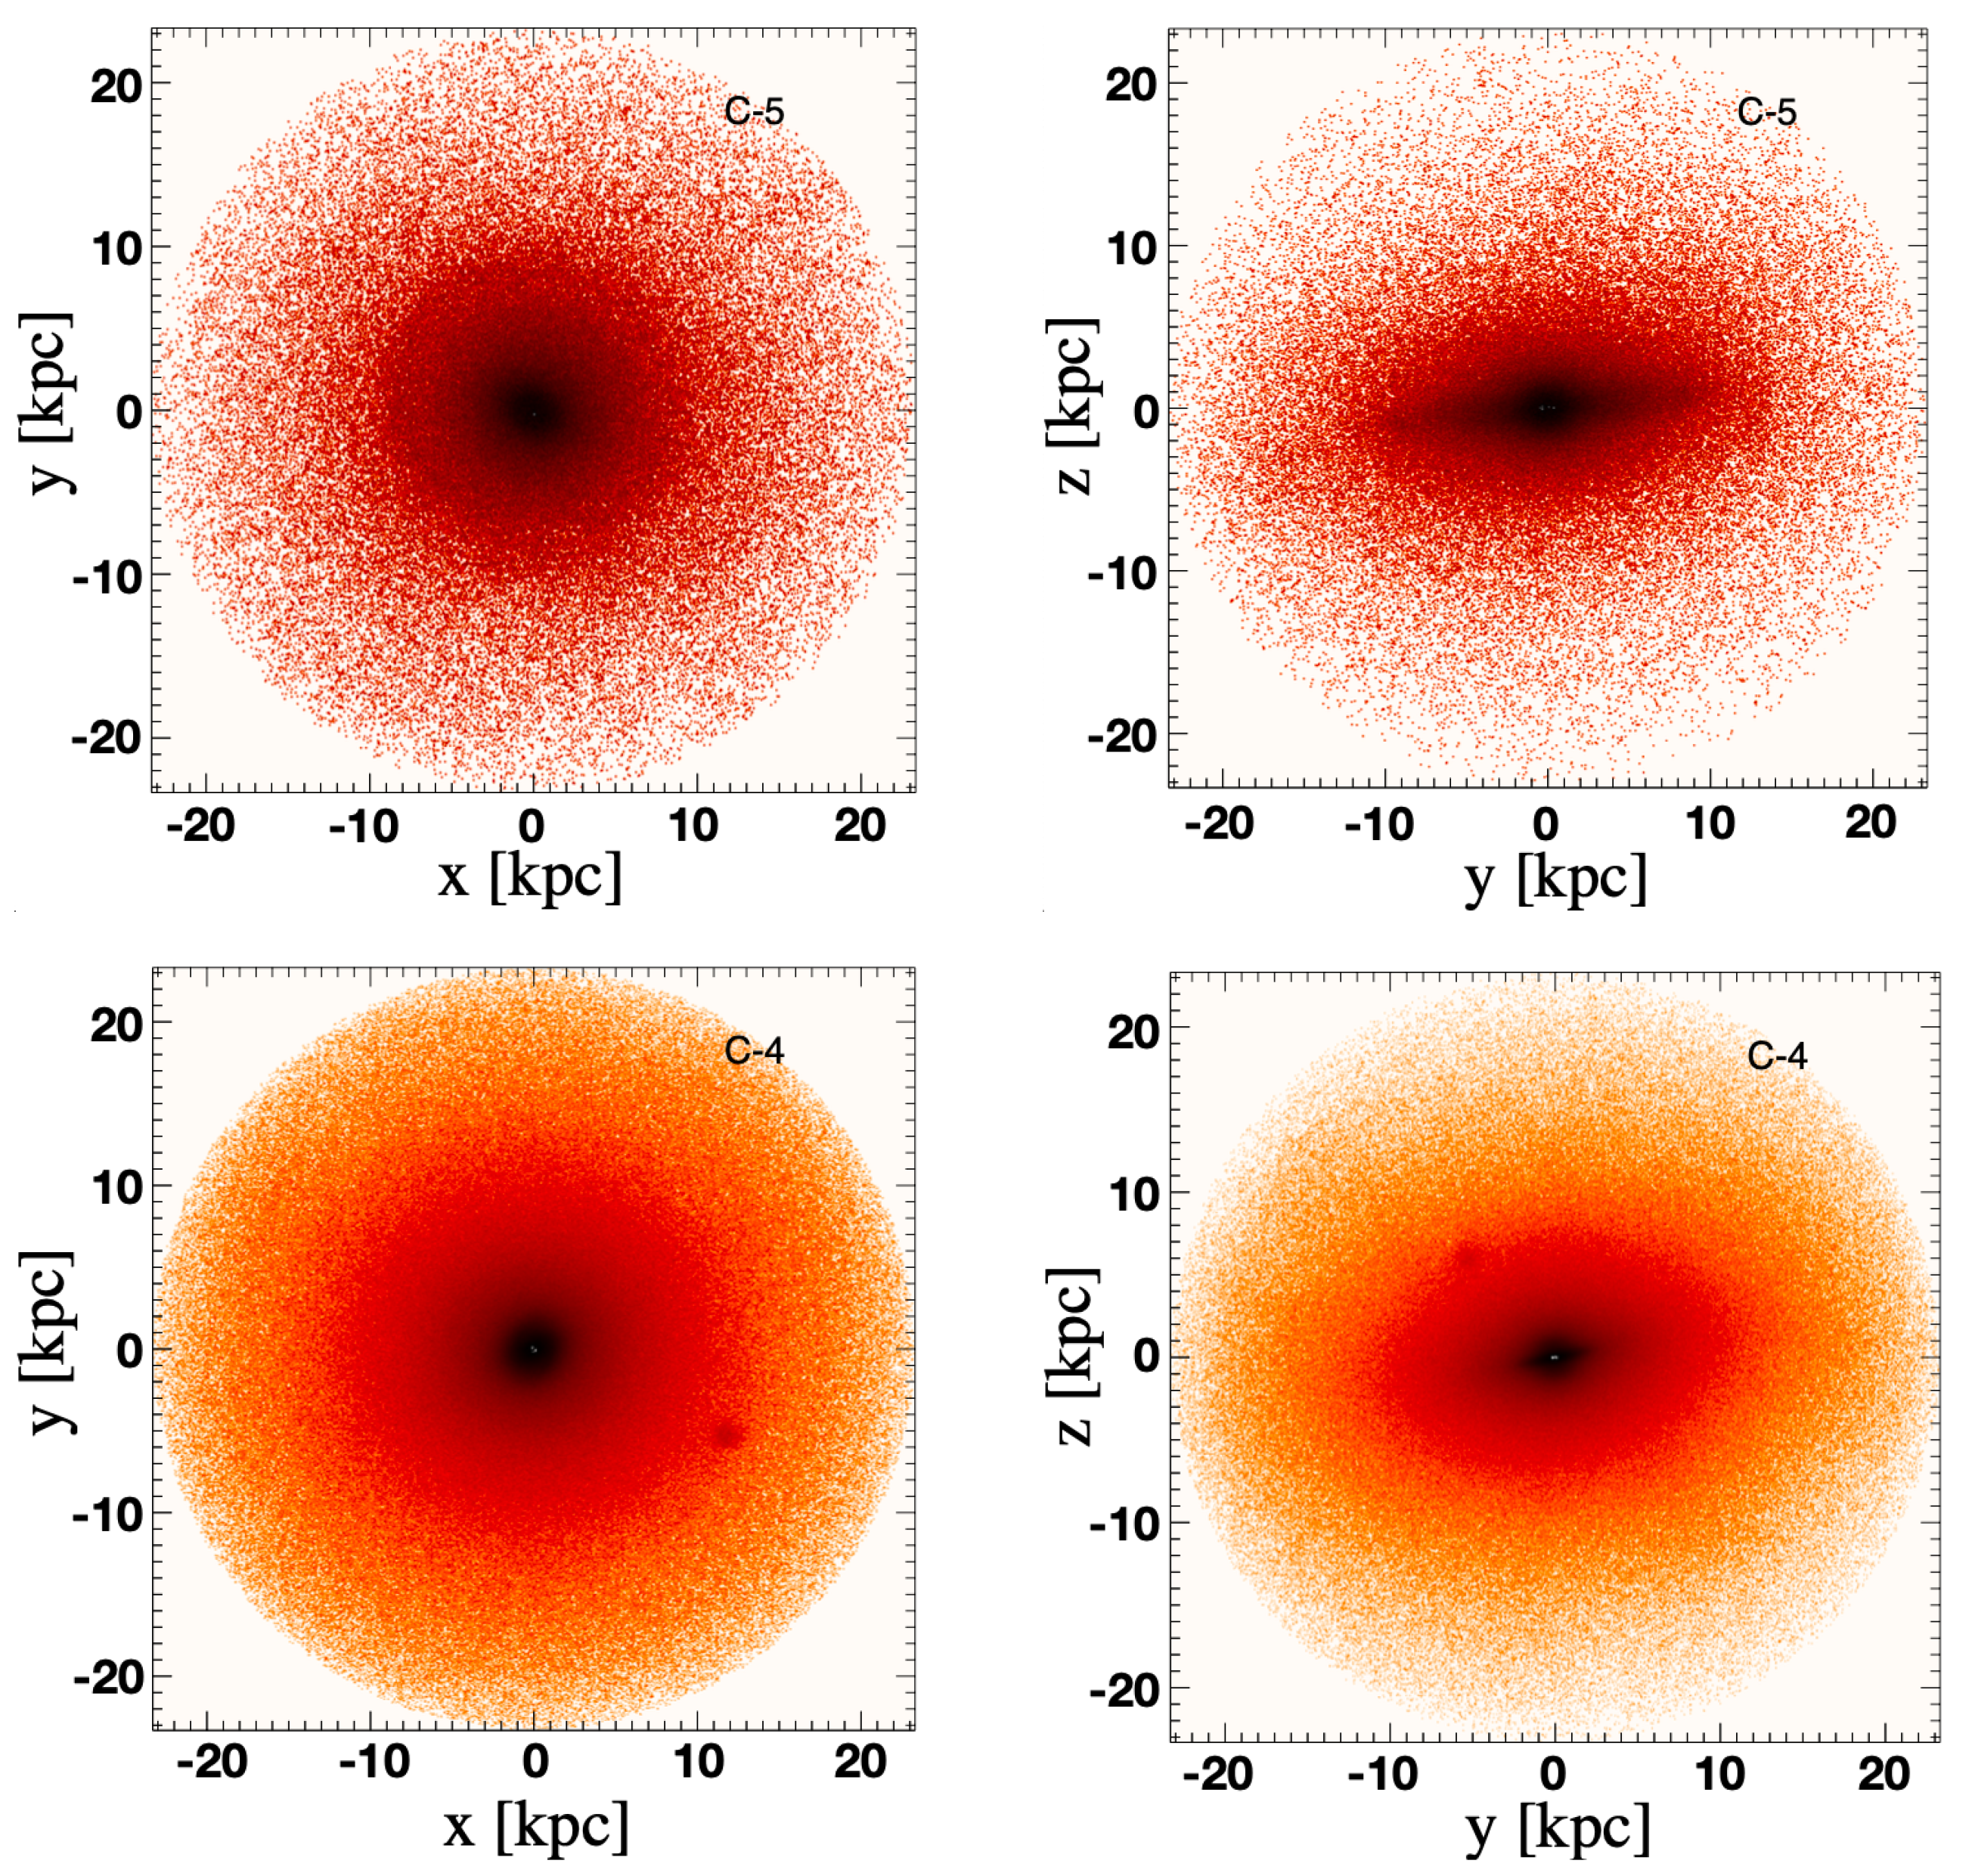
| C−4 | 2.57 | 2.70 | 2.57 | 0.342 | 233 |
| C−5 | 20.6 | 21.6 | 20.6 | 0.685 | 233 |
| d | e | e | e | f | f |
| 1.57 | 2.87 | 1.47 | 8.42 | 150 | 263 |
| 1.57 | 4.41 | 1.51 | 7.46 | 50 | 98 |
| Data Set a | b | c | l d | b e | f | g | h |
|---|---|---|---|---|---|---|---|
| [kpc] | [deg] | [deg] | [kpc] | [kpc] | |||
| C-4 Vir | 231.6 | 121 | – | −26.6 | 68.6 | 0.30 | 6.0 |
| C-4 Vir ZOA | 230.8 | 70 | – | −16.0 | 63.5 | 0.28 | 9.2 |
| C-4 1Mp | 997.4 | 214 | – | −38.8 | 152.0 | 0.15 | 6.9 |
| C-4 1Mp ZOA | 997.4 | 146 | – | −29.6 | 133.3 | 0.13 | 0.6 |
| KTB(05) MW Vir | 254 | 11 | 168 | −16 | 26.4 | 0.10 | 1.9 |
| KTB(05) MW 1Mp | 956 | 16 | 168 | −16 | 159 | 0.17 | 3.3 |
| MKJ(07) MW | 254 | 13 | 153.8 | −10.2 | 22.8 | 0.09 | 7.8 |
| MKJ(07) And. MI | 269 | 12 | 73.4 | −31.5 | 45.9 | 0.17 | 1.0 |
| MKJ(07) And. KG | 284 | 12 | 83.5 | −31.0 | 46.1 | 0.16 | 7.5 |
| MKJ(09) MW | 254 | 22 | 149.6 | −5.3 | 28.5 | 0.11 | – |
| MKJ(09) And. | 589 | 23 | 60.2 | −30.7 | 45 | 0.08 | 15.6 |
| Kroupa(10) MW | 254 | 24 | 156.4 | −2.2 | 28.9 | 0.11 | 8.2 |
Disclaimer/Publisher’s Note: The statements, opinions and data contained in all publications are solely those of the individual author(s) and contributor(s) and not of MDPI and/or the editor(s). MDPI and/or the editor(s) disclaim responsibility for any injury to people or property resulting from any ideas, methods, instructions or products referred to in the content. |
© 2023 by the authors. Licensee MDPI, Basel, Switzerland. This article is an open access article distributed under the terms and conditions of the Creative Commons Attribution (CC BY) license (https://creativecommons.org/licenses/by/4.0/).
Share and Cite
Zhao, X.; Mathews, G.J.; Phillips, L.A.; Tang, G. A Study of the Properties and Dynamics of the Disk of Satellites in a Milky-Way-like Galaxy System. Galaxies 2023, 11, 114. https://doi.org/10.3390/galaxies11060114
Zhao X, Mathews GJ, Phillips LA, Tang G. A Study of the Properties and Dynamics of the Disk of Satellites in a Milky-Way-like Galaxy System. Galaxies. 2023; 11(6):114. https://doi.org/10.3390/galaxies11060114
Chicago/Turabian StyleZhao, Xinghai, Grant J. Mathews, Lara Arielle Phillips, and Guobao Tang. 2023. "A Study of the Properties and Dynamics of the Disk of Satellites in a Milky-Way-like Galaxy System" Galaxies 11, no. 6: 114. https://doi.org/10.3390/galaxies11060114