
The Structure of Micro-Variability in the WEBT BL Lacertae Observation


Abstract
:1. Introduction
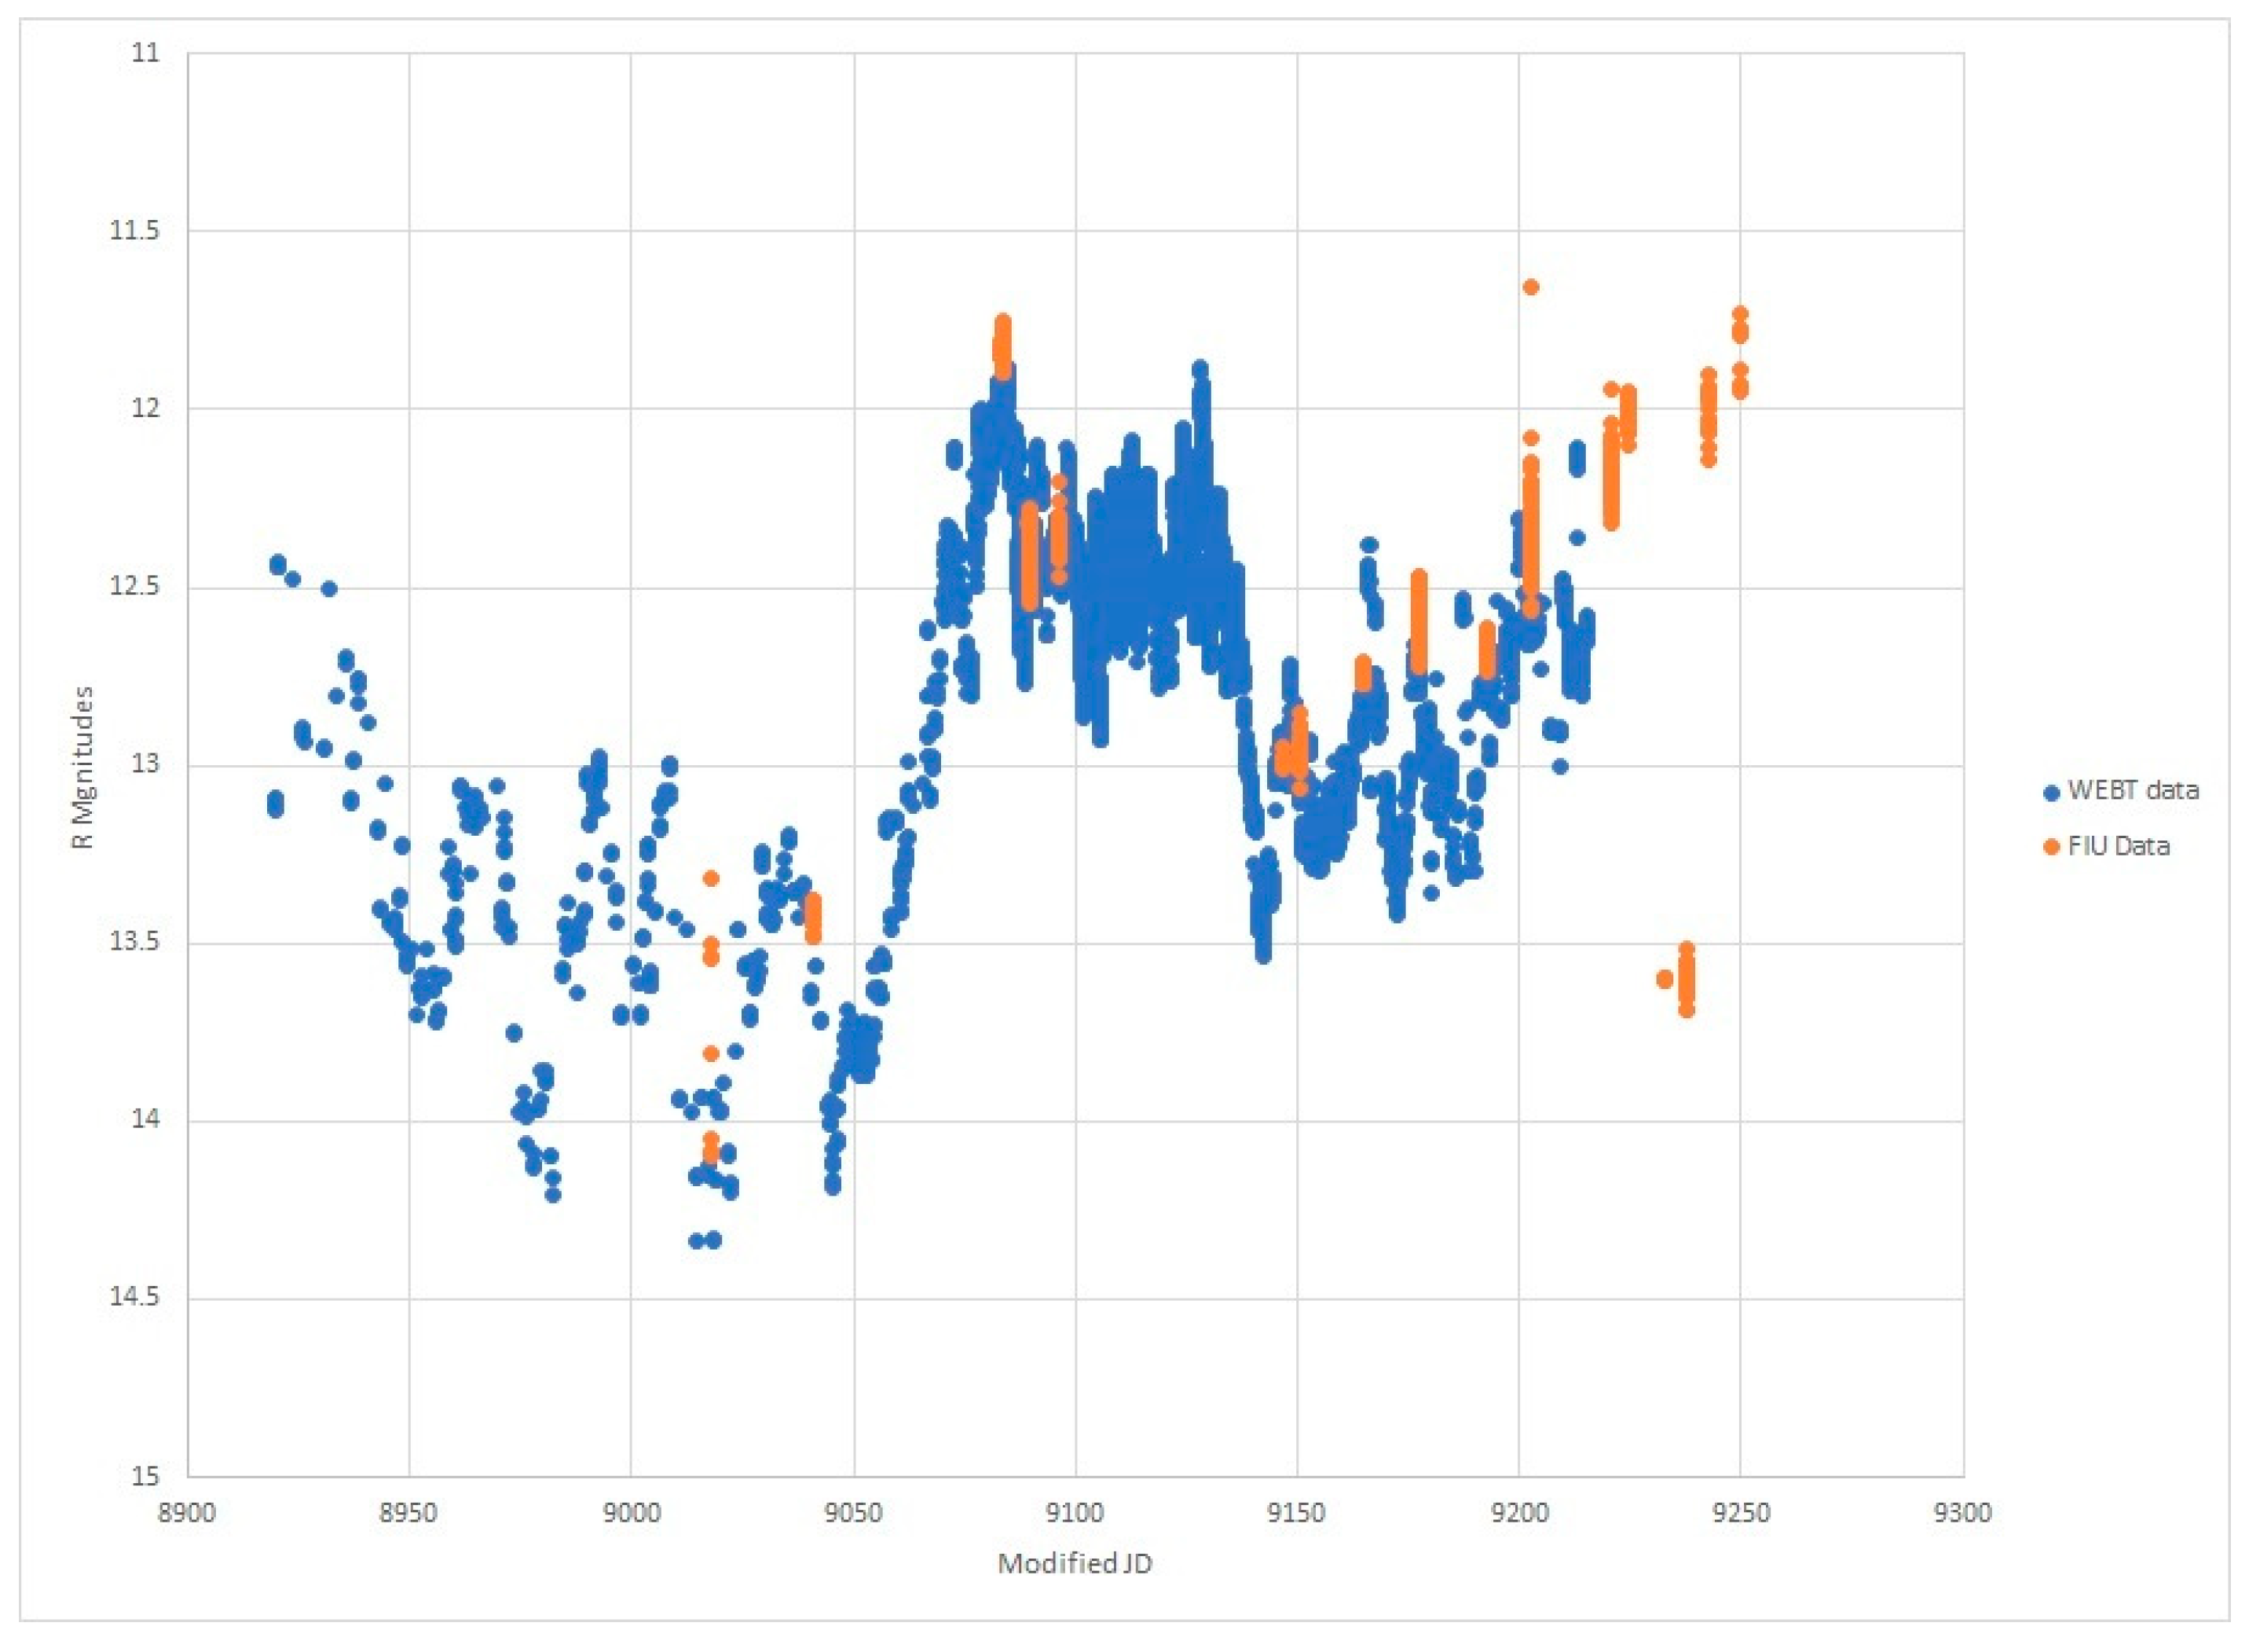
2. Observations
3. Data Analysis
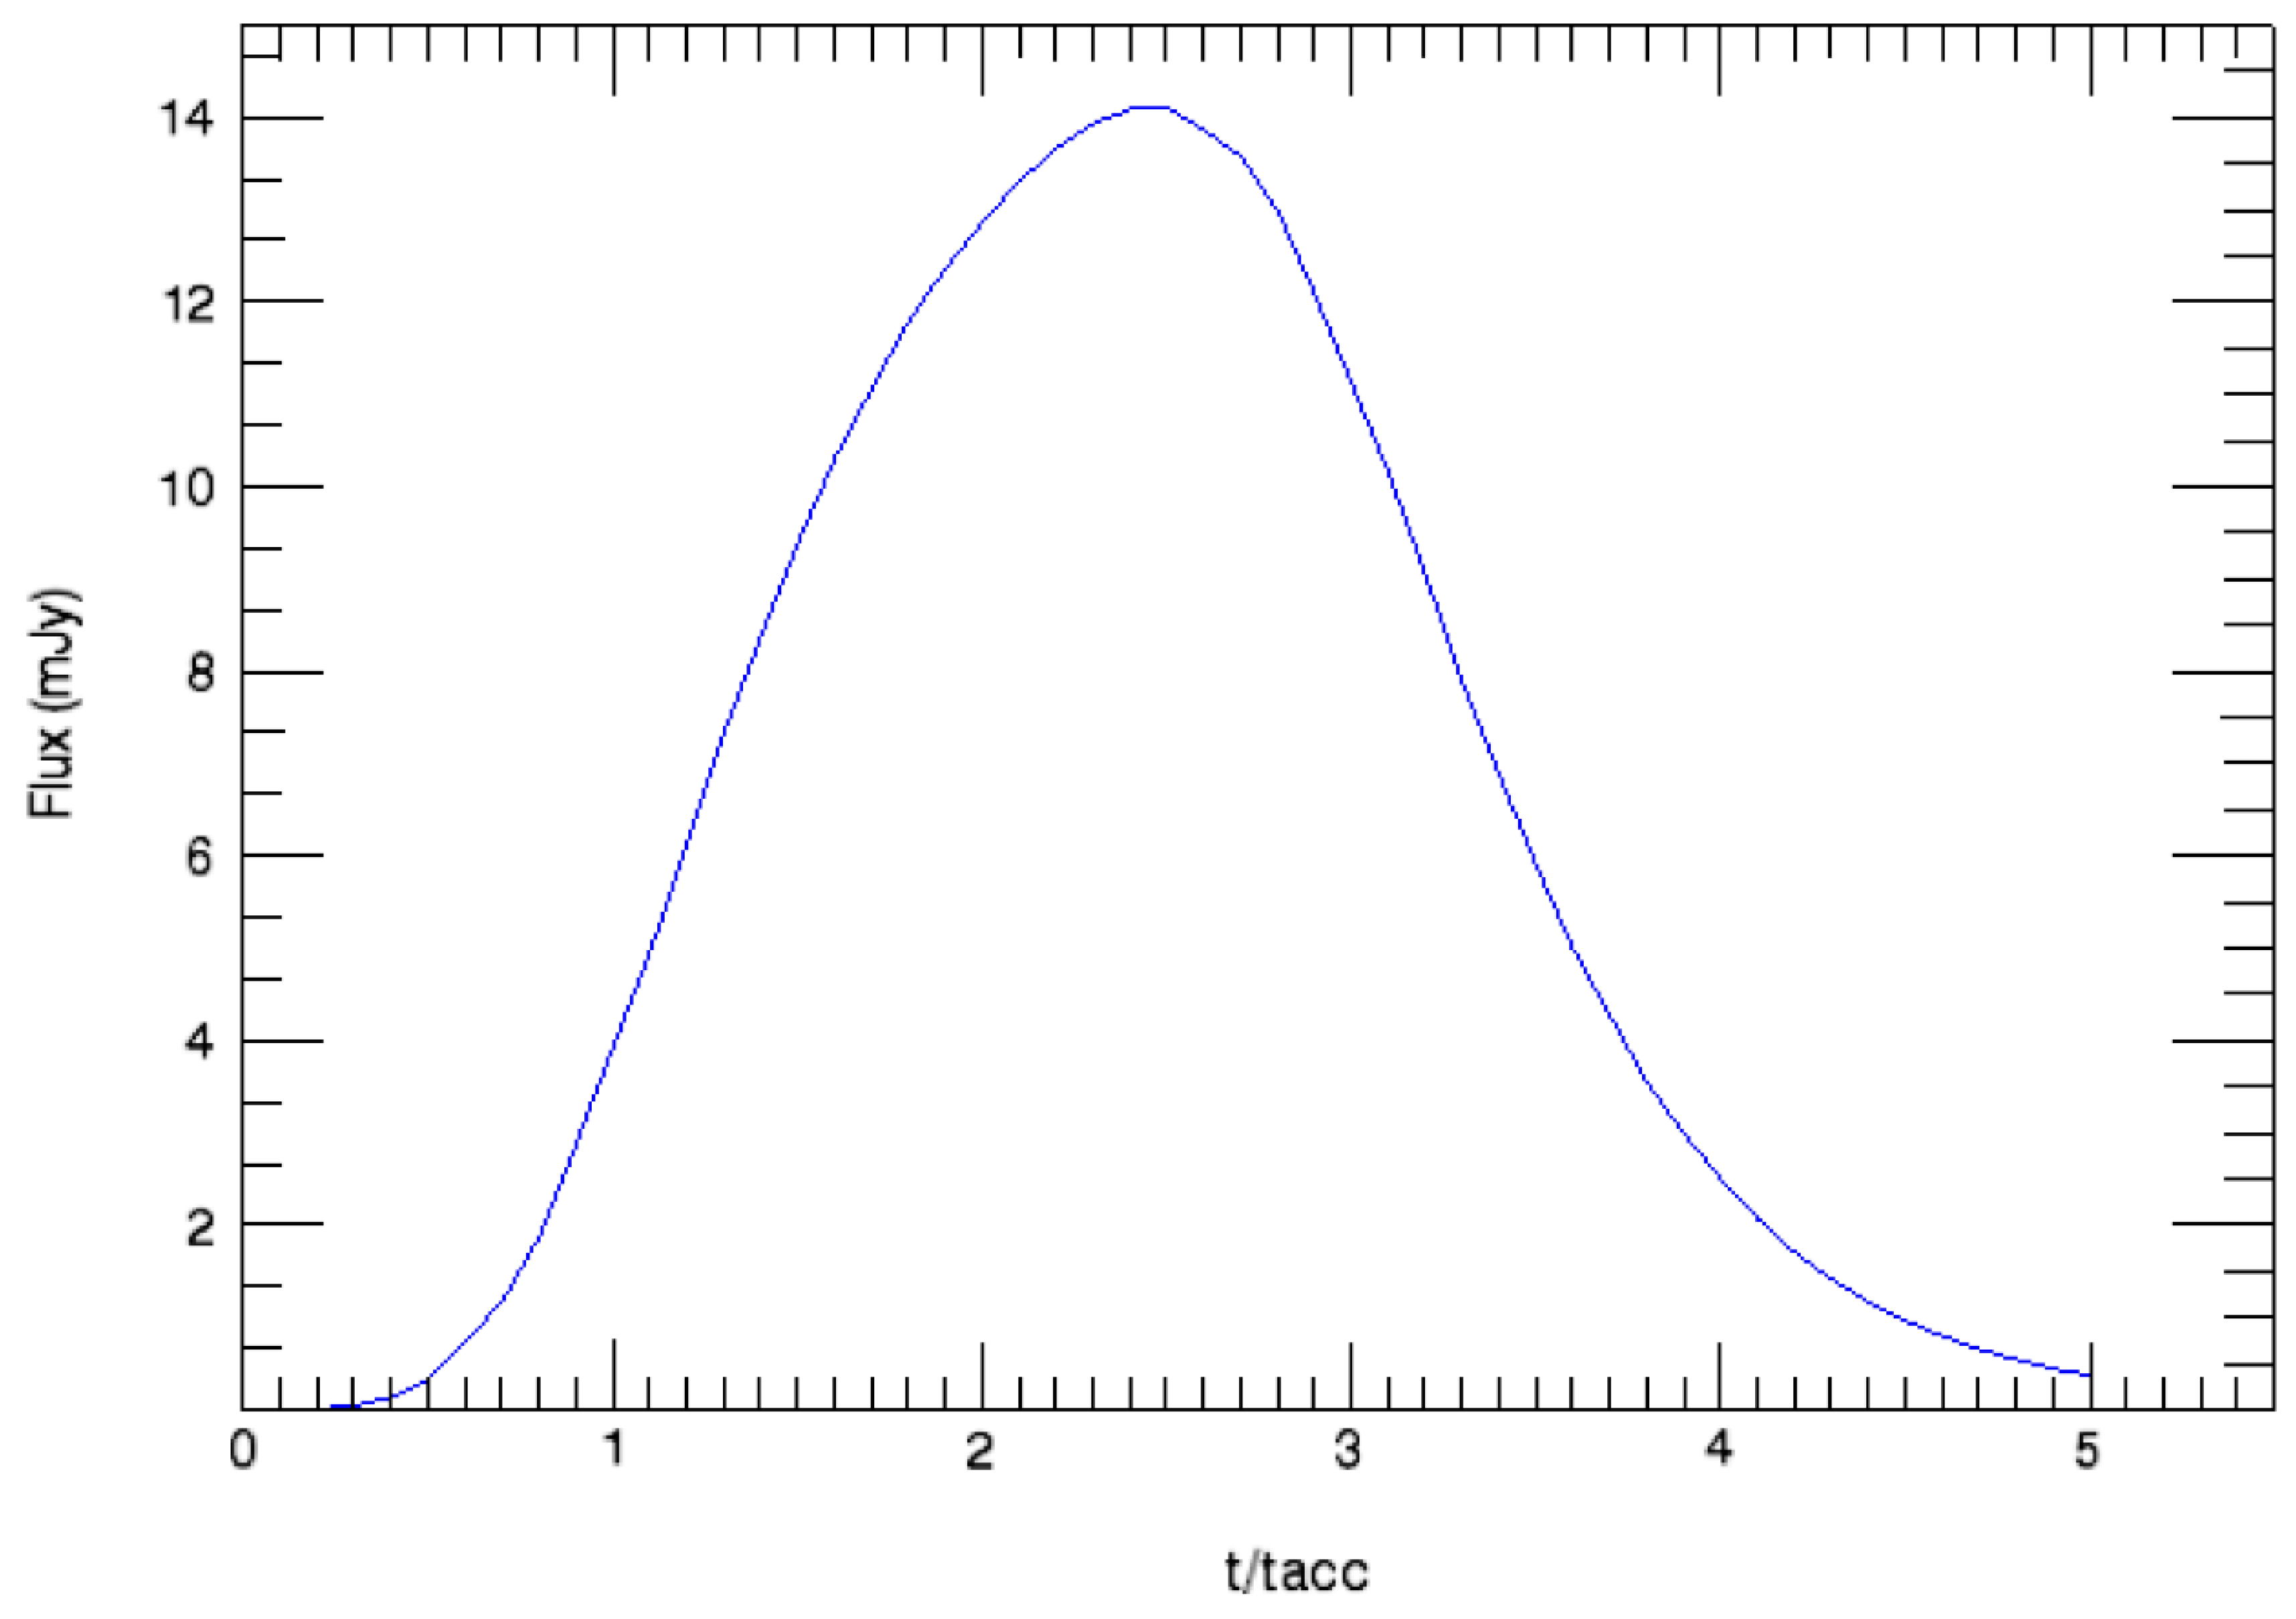
3.1. Theory of Shock Waves Encountering Turbulent Cells
3.2. IV Results: Fitting the Individual Light Curves
4. Conclusions
Author Contributions
Funding
Data Availability Statement
Acknowledgments
Conflicts of Interest
Appendix A
 |
 |
 |
 |
 |
References
- Jorstad, S.G.; Marscher, A.P.; Raiteri, C.M.; Villata, M.; Weaver, Z.R.; Zhang, H.; Chatterjee, R. Rapid quasi-periodic oscillations in the relativistic jet of BL Lacertae. Nature 2022, 609, 265–268. [Google Scholar] [CrossRef]
- Webb, J.R.; Arroyave, V.; Laurence, D.; Revesz, S.; Bhatta, G.; Hollingsworth, H.; Dhalla, S.; Howard, E.; Cioffi, M. The Nature of Micro-Variability in Blazars. Galaxies 2021, 9, 114. [Google Scholar] [CrossRef]
- Bhatta, G.; Webb, J.R.; Hollingsworth, H.; Dhalla, S.; Khanuja, A.; Bachev, R.; Blinov, D.A.; Böttcher, M.; Bravo Calle, O.J.A.; Calcidese, P.; et al. The 72-h WEBT microvariability observation of blazar S5 0716+714 in 2009. Astron. Astrophys. 2013, 558, A92. [Google Scholar] [CrossRef]
- Jones, T.W. Polarization as a probe of magnetic field and plasma properties of compact radio sources-Simulation of relativistic jets. Astrophys. J. 1988, 332, 678. [Google Scholar] [CrossRef]
- Marscher, A.P. Turbulent, Extreme Multi-zone Model for Simulating Flux and Polarization Variability in Blazars. Astrophys. J. 2014, 780, 87. [Google Scholar] [CrossRef]
- Kirk, J.; Reiger, F.M.; Mastichiadis, A. Particle acceleration and synchrotron emission in blazar jets. Astron. Astrophys. 1998, 333, 452. [Google Scholar]
- Zrake, J.; MacFadyen, A.I. Numerical Simulations of Driven Relativistic Magnetohydrodynamic Turbulence. Astrophys. J. 2012, 744, 32. [Google Scholar] [CrossRef]
- Lehto, H. 1979, Model for 1/F-TYPE Variability in Active Galactic Nuclei. In Proceedings of the 23rd ESLAB Symposium on Two Topics in X-ray Astronomy, Bologna, Italy, 13–20 September 1989; Volume 2, p. 499. [Google Scholar]
- Montagni, F.; Maselli, A.; Massaro, E.; Nesci, R.; Sclavi, S.; Maesano, M. The intra-night optical variability of the bright BL Lacertae object S5 0716+714. Astron. Astrophys. 2006, 451, 435. [Google Scholar] [CrossRef]
- Pollack, M.; Pauls, S.; Wiita, P. Variability in Active Galactic Nuclei from Propagating Turbulent Relativistic Jets. Astrophys. J. 2016, 820, 12. [Google Scholar] [CrossRef]
- Agarwal, A.; Mirov, V.; Ozdonmez, A.; Ede, E.; Slacheva-Mirova, L.; Reichartm, D.; Caton, D.; Das, A. Analysis of the Intranight Variability of BL Lacertae during Its 2020 August Flare. Astrophys. J. Suppl. Ser. 2023, 265, 51A. [Google Scholar] [CrossRef]
- Meng, N.; Wu, J.; Webb, J.; Zhang, X.; Dai, Y. Intraday optical variability of BL Lacertae. Mon. Not. R. Astron. Soc. 2017, 469, 3588–3596. [Google Scholar] [CrossRef]
- Marscher APJorstad, S.; Pressburger, L.; Weaver, Z.; Williamson, K.; MacDonald, N.; Myserlis, I.; Larinov, V.M. Time-Dependant Multi-wavelength polarization of Gamma-Ray Bright Blazars. 2020. AAS…23530502M. Available online: https://ui.adsabs.harvard.edu/abs/2020AAS...23530502M/abstract (accessed on 24 October 2023).
- Sasada, M.; Uemura, M.; Arai, A.; Fukazawa, Y.; Kawabata, K.S.; Ohsugi, T.; Kino, M. Detection of Polarimetric Variations Associated with the Shortest Time-Scale Variability in S5 0716+714. Publ. Astron. Soc. Jpn. 2008, 60, L37–L41. [Google Scholar] [CrossRef]
- Raiteri, C.M.; Villata, M. Polarimetric Properties of Blazars Caught by the WEBT. Galaxies 2021, 9, 42. [Google Scholar] [CrossRef]
- Webb, J.R.; Eikenberrry, S.; Dallier, Y.; Meng, N.; Laurence, D. Coordinated Micro-Variability CIRCE Polarimetry and SARA JKT Multi-Frequency Photometry Observations of the Blazar S5 0716+71. Galaxies 2017, 5, 77. [Google Scholar] [CrossRef]


| Mod JD | Npts | r | # Pulses | F-Test |
|---|---|---|---|---|
| 9081 | 141 | 0.949 | 5 | <0.0001 |
| 9082 | 209 | 0.9623 | 5 | <0.0001 |
| 9083 | 250 | 0.9076 | 7 | <0.0001 |
| 9084 | 161 | 0.941915 | 7 | <0.0001 |
| 9086 | 299 | 0.95053 | 8 | <0.0001 |
| 9090 | 150 | 0.902 | 6 | <0.0001 |
| 9091 | 130 | 0.966 | 5 | <0.0001 |
| 9096 | 200 | 0.937 | 6 | <0.0001 |
| 9097 | 142 | 0.852587 | 6 | <0.0001 |
| 9099 | 371 | 0.926 | 6 | <0.0001 |
| 9100 | 171 | 0.945 | 8 | <0.0001 |
| 9101 | 788 | 0.978 | 9 | <0.0001 |
| 9104 | 319 | 0.992 | 8 | <0.0001 |
| 9105 | 296 | 0.84 | 8 | <0.0001 |
| 9106 | 401 | 0.945768 | 10 | <0.0001 |
| 9107 | 481 | 0.946 | 12 | <0.0001 |
| 9108 | 361 | 0.981 | 8 | <0.0001 |
| 9109 | 289 | 0.974 | 12 | <0.0001 |
| 9110 | 287 | 0.964718 | 10 | <0.0001 |
| 9112 | 348 | 0.945862 | 10 | <0.0001 |
| 9113 | 111 | 0.952 | 9 | <0.0001 |
| 9116 | 294 | 0.982511 | 10 | <0.0001 |
| 9117 | 232 | 0.936984 | 11 | <0.0001 |
| 9119 | 390 | 0.86825 | 12 | <0.0001 |
| 9120 | 123 | 0.979 | 4 | <0.0001 |
| 9121 | 99 | 0.994588 | 8 | <0.0001 |
| 9122 | 138 | 0.975509 | 7 | <0.0001 |
| 9123 | 176 | 0.989076 | 8 | <0.0001 |
| 9124 | 227 | 0.952871 | 6 | <0.0001 |
| 9125 | 203 | 0.939568 | 7 | <0.0001 |
| 9129 | 400 | 0.971661 | 9 | <0.0001 |
| 9130 | 337 | 0.988759 | 10 | <0.0001 |
| 9131 | 355 | 0.989075 | 7 | <0.0001 |
| 9132 | 118 | 0.96131 | 5 | <0.0001 |
| 9133 | 108 | 0.961 | 7 | <0.0001 |
| 9134 | 116 | 0.969 | 6 | <0.0001 |
| 9135 | 135 | 0.96 | 6 | <0.0001 |
| 9136 | 187 | 0.935698 | 8 | <0.0001 |
| 9141 | 133 | 0.945698 | 8 | <0.0001 |
| 9170 | 146 | 0.872274 | 7 | <0.0001 |
| 9173 | 125 | 0.894287 | 7 | <0.0001 |
| Averages | 242 | 0.948 ± 0.04 | 7.884 | <0.0001 |
| amp | Width AU (vrel = 0.3 c) | Width AU (vrel = 0.9 c) | |
|---|---|---|---|
| average | 37.22 | 1.24 | 3.732 |
| min | 0.016 | 0.150618 | 0.451 |
| max | 19.27 | 4.01647 | 12.049 |
| st.dev | 3.377 | 0.77 | 2.31 |
Disclaimer/Publisher’s Note: The statements, opinions and data contained in all publications are solely those of the individual author(s) and contributor(s) and not of MDPI and/or the editor(s). MDPI and/or the editor(s) disclaim responsibility for any injury to people or property resulting from any ideas, methods, instructions or products referred to in the content. |
© 2023 by the authors. Licensee MDPI, Basel, Switzerland. This article is an open access article distributed under the terms and conditions of the Creative Commons Attribution (CC BY) license (https://creativecommons.org/licenses/by/4.0/).
Share and Cite
Webb, J.R.; Sanz, I.P. The Structure of Micro-Variability in the WEBT BL Lacertae Observation. Galaxies 2023, 11, 108. https://doi.org/10.3390/galaxies11060108
Webb JR, Sanz IP. The Structure of Micro-Variability in the WEBT BL Lacertae Observation. Galaxies. 2023; 11(6):108. https://doi.org/10.3390/galaxies11060108
Chicago/Turabian StyleWebb, James R., and Ivan Parra Sanz. 2023. "The Structure of Micro-Variability in the WEBT BL Lacertae Observation" Galaxies 11, no. 6: 108. https://doi.org/10.3390/galaxies11060108