
A Scattered Star Group in the Orion A Region of the Milky Way
 , and
, and
Abstract
:1. Introduction
2. Materials and Methods
2.1. Direct Approach
2.2. Statistical Method
2.3. Application of Clustering Algorithm
2.4. The Resulting Dataset
3. Results
4. Discussion
5. Conclusions
Author Contributions
Funding
Data Availability Statement
Acknowledgments
Conflicts of Interest
Appendix A

| Gaia DR3 Source Id. | BP-RP | RV | X | Y | Z | U | V | W | |||||||
|---|---|---|---|---|---|---|---|---|---|---|---|---|---|---|---|
| Gaia DR3 Source Id. * | * | * | * | * | BP-RP * | VR * | * | X | Y | Z | U | V | W | * | * |
| mas | mas/yr | mag | km/s | pc | km/s | mag | |||||||||
| 3010622094238648448 | 2.3744 | −1.676 | 1.072 | 11.964 | 0.756 | 50.65 | 1.12 | −326.8 | −218.8 | −150.6 | 40.5 | −23.1 | −20.1 | 0.160 | 0.086 |
| 3012148010219208832 | 2.3674 | −1.891 | 1.517 | 19.924 | 2.406 | −330.3 | −218.8 | −146.5 | |||||||
| 3013842941753415424 | 2.3719 | −2.059 | 1.126 | 19.292 | 2.823 | −328.5 | −206.6 | −164.9 | |||||||
| 3014860337903007616 | 2.4697 | −1.783 | 1.442 | 19.925 | 2.951 | −322.8 | −192.8 | −150.2 | |||||||
| 3014941426886464256 | 2.4371 | −2.109 | 1.363 | 17.614 | 2.414 | −325.1 | −191.9 | −160.7 | 0.524 | 0.318 | |||||
| 3015433488402344576 | 2.4025 | −1.734 | 1.164 | 20.785 | 1.498 | −332.6 | −208.6 | −138.2 | |||||||
| 3016010525849058304 | 2.4679 | −1.784 | 1.361 | 20.621 | 2.880 | −325.5 | −200.7 | −134.2 | |||||||
| 3016071827917538048 | 2.3365 | −2.136 | 1.365 | 12.190 | 0.799 | −2.13 | 2.33 | −346.4 | −210.1 | −138.0 | −0.2 | 5.3 | −1.8 | 0.136 | 0.074 |
| 3016111650854337408 | 2.3449 | −1.617 | 1.399 | 15.072 | 1.787 | 36.44 | 8.59 | −344.8 | −208.9 | −139.1 | 31.1 | −14.2 | −13.5 | 0.912 | 0.490 |
| 3016216856077986688 | 2.3334 | −1.828 | 1.327 | 10.461 | 0.508 | 23.57 | 3.56 | −347.7 | −209.7 | −137.0 | 20.6 | −7.7 | −9.6 | ||
| 3016825160886293120 | 2.4647 | −2.112 | 1.338 | 18.121 | 3.220 | −330.9 | −188.1 | −140.6 | 0.801 | 0.590 | |||||
| 3016900103770771456 | 2.3709 | −1.426 | 1.551 | 17.579 | 2.965 | −343.5 | −203.3 | −136.3 | 0.959 | 0.631 | |||||
| 3016913156175056768 | 2.336 | −1.782 | 1.499 | 17.912 | 3.033 | −348.9 | −205.6 | −138.9 | 1.120 | 0.741 | |||||
| 3016970536938230272 | 2.4103 | −1.893 | 1.148 | 18.730 | 3.272 | −339.1 | −197.0 | −135.4 | |||||||
| 3016987476288866048 | 2.3647 | −1.597 | 1.591 | 12.506 | 0.897 | 32.45 | 2.87 | −346.0 | −199.4 | −139.0 | 28.3 | −11.4 | −12.0 | 0.482 | 0.261 |
| 3017007198779743104 | 2.3251 | −1.818 | 1.33 | 17.705 | 3.144 | −350.7 | −206.4 | −139.2 | 1.599 | 1.013 | |||||
| 3017016475908135808 | 2.3555 | −1.821 | 1.073 | 16.903 | 2.688 | −346.9 | −203.8 | −135.5 | 0.682 | 0.433 | |||||
| 3017060215858357376 | 2.325 | −1.555 | 0.959 | 18.868 | 3.184 | −351.4 | −204.8 | −139.8 | |||||||
| 3017065580271198976 | 2.3259 | −1.615 | 1.381 | 16.306 | 2.369 | −351.7 | −203.8 | −140.0 | 0.631 | 0.376 | |||||
| 3017078465173084032 | 2.3642 | −1.594 | 1.156 | 18.411 | 3.276 | −346.4 | −199.9 | −137.6 | 1.412 | 0.964 | |||||
| 3017084443767558272 | 2.4018 | −1.637 | 1.339 | 13.737 | 1.278 | 28.94 | 2.11 | −341.4 | −196.0 | −135.6 | 25.1 | −10.0 | −11.0 | 0.382 | 0.204 |
| 3017084443767558400 | 2.3595 | −1.889 | 1.485 | 17.365 | 2.850 | −347.5 | −199.5 | −138.0 | 0.980 | 0.633 | |||||
| 3017085440199967232 | 2.413 | −2.056 | 1.39 | 15.961 | 2.266 | −340.0 | −194.9 | −134.8 | 0.986 | 0.557 | |||||
| 3017086711510771328 | 2.3399 | −1.563 | 1.332 | 17.189 | 2.785 | −350.5 | −201.9 | −137.9 | 0.761 | 0.493 | |||||
| 3017181063353045248 | 2.4852 | −1.883 | 1.238 | 17.525 | 2.868 | −329.9 | −188.2 | −132.9 | 1.021 | 0.658 | |||||
| 3017318983354345088 | 2.3651 | −1.66 | 1.534 | 14.082 | 1.499 | 17.85 | 5.22 | −349.2 | −198.0 | −132.8 | 16.4 | −4.4 | −7.1 | 1.196 | 0.642 |
| 3017327092252520448 | 2.3177 | −1.87 | 1.014 | 16.703 | 2.591 | −356.0 | −200.6 | −138.4 | 1.182 | 0.690 | |||||
| 3017341523342707968 | 2.3356 | −1.412 | 1.328 | 16.069 | 2.421 | −352.2 | −198.2 | −141.5 | 3.317 | 1.874 | |||||
| 3017370626039362048 | 2.3856 | −1.629 | 1.341 | 19.040 | 3.331 | −346.5 | −192.3 | −136.6 | |||||||
| 3017387118715416960 | 2.3319 | −2.003 | 0.882 | 13.584 | 1.357 | 36.83 | 3.52 | −355.1 | −197.7 | −136.9 | 31.4 | −13.5 | −14.4 | 1.168 | 0.637 |
| 3017390623408731520 | 2.376 | −1.493 | 1.295 | 16.828 | 2.653 | −348.7 | −193.6 | −134.6 | 0.925 | 0.566 | |||||
| 3017401515444135040 | 2.3949 | −1.575 | 1.379 | 17.759 | 3.199 | −346.1 | −190.8 | −134.7 | 1.605 | 1.038 | |||||
| 3017403920625813120 | 2.4033 | −1.629 | 1.344 | 19.188 | 3.260 | −345.0 | −190.7 | −133.2 | |||||||
| 3017406875563305728 | 2.4822 | −1.573 | 1.463 | 17.633 | 3.385 | −334.4 | −184.3 | −128.6 | 1.445 | 1.001 | |||||
| 3017407184800946944 | 2.3419 | −1.83 | 1.473 | 17.845 | 3.149 | −354.5 | −195.1 | −136.2 | 1.325 | 0.911 | |||||
| 3017407940715202816 | 2.4055 | −1.83 | 1.46 | 12.376 | 1.052 | 26.02 | 3.13 | −344.9 | −189.9 | −133.4 | 23.1 | −7.9 | −10.2 | ||
| 3023162715844336128 | 2.3736 | −1.873 | 1.44 | 14.186 | 1.526 | 62.11 | 4.96 | −349.5 | −199.1 | −125.4 | 53.1 | −25.4 | −20.4 | 0.731 | 0.396 |
| 3023275243987425792 | 2.4087 | −1.914 | 1.6 | 17.525 | 3.136 | −345.3 | −194.7 | −123.3 | 0.986 | 0.672 | |||||
| 3023354851204687744 | 2.3742 | −2.106 | 0.942 | 18.349 | 3.225 | −349.6 | −194.8 | −131.2 | 1.127 | 0.763 | |||||
| 3023411171112882816 | 2.4291 | −1.698 | 1.472 | 16.952 | 2.715 | −341.9 | −188.4 | −130.7 | 1.032 | 0.634 | |||||
| 3023413984315736704 | 2.375 | −1.786 | 1.342 | 18.463 | 3.188 | −350.0 | −192.6 | −133.1 | |||||||
| 3023413988611422720 | 2.3377 | −1.59 | 1.657 | 16.406 | 2.423 | −355.6 | −195.7 | −135.2 | 0.856 | 0.502 | |||||
| 3023496894363769216 | 2.465 | −1.878 | 1.075 | 18.390 | 3.160 | −339.4 | −187.4 | −119.5 | 1.223 | 0.849 | |||||
| 3023980305817582976 | 2.3582 | −1.564 | 0.972 | 18.820 | 2.459 | −357.6 | −192.7 | −121.6 | |||||||
| 3025392040093020800 | 2.3999 | −1.908 | 1.447 | 20.463 | 1.488 | −353.8 | −194.8 | −102.4 | |||||||
| 3025654174832036224 | 2.4849 | −1.45 | 1.117 | 20.585 | 2.221 | −343.3 | −183.7 | −101.5 | |||||||
| 3208739521035049984 | 2.4155 | −1.684 | 1.154 | 20.632 | 1.130 | −339.8 | −170.0 | −164.4 | |||||||
| 3209446854905159040 | 2.3168 | −1.647 | 1.139 | 16.348 | 2.502 | −357.0 | −194.3 | −145.2 | 3.074 | 1.706 | |||||
| 3209512275846903040 | 2.3617 | −1.714 | 1.457 | 17.833 | 3.167 | −350.9 | −188.4 | −143.8 | 1.217 | 0.810 | |||||
| 3209541687784992384 | 2.3838 | −1.846 | 1.254 | 11.204 | 1.101 | 19.71 | 5.88 | −347.2 | −188.6 | −140.9 | 17.5 | −5.1 | −8.6 | ||
| 3209555427381596928 | 2.3551 | −1.584 | 1.104 | 18.175 | 3.437 | −352.1 | −193.0 | −138.2 | 2.348 | 1.447 | |||||
| 3209556565551727232 | 2.4868 | −1.522 | 1.58 | 17.075 | 3.052 | −333.7 | −182.9 | −130.0 | 1.610 | 0.997 | |||||
| 3209557287106237056 | 2.3723 | −1.675 | 1.461 | 16.017 | 2.254 | −349.7 | −191.3 | −137.0 | |||||||
| 3209566632955057664 | 2.4965 | −1.789 | 1.536 | 17.662 | 3.052 | −333.1 | −181.7 | −128.4 | 1.517 | 0.959 | |||||
| 3209566632955057920 | 2.4742 | −1.462 | 1.511 | 17.483 | 3.043 | −336.1 | −183.3 | −129.5 | 1.637 | 1.011 | |||||
| 3209640197154658304 | 2.4987 | −2.011 | 0.879 | 16.637 | 2.542 | −333.9 | −178.5 | −129.6 | 0.559 | 0.350 | |||||
| 3209656552390066688 | 2.3708 | −1.737 | 1.393 | 13.903 | 1.333 | 26.08 | 2.66 | −352.3 | −186.4 | −137.9 | 23.2 | −7.7 | −10.2 | 0.414 | 0.223 |
| 3209776914552420480 | 2.3344 | −1.563 | 1.092 | 13.692 | 1.395 | 16.36 | 5.95 | −356.6 | −185.8 | −147.7 | 14.7 | −3.8 | −7.3 | 0.709 | 0.384 |
| 3209830756262184832 | 2.4321 | −1.434 | 1.123 | 17.845 | 3.452 | −342.9 | −179.3 | −139.1 | 3.433 | 1.917 | |||||
| 3209838418483918592 | 2.4037 | −1.914 | 1.401 | 17.296 | 2.939 | −347.3 | −183.2 | −137.5 | 0.954 | 0.633 | |||||
| 3209838899520253056 | 2.4034 | −1.749 | 1.259 | 16.283 | 2.340 | −347.5 | −183.0 | −137.5 | 0.795 | 0.460 | |||||
| 3209839002599466880 | 2.3278 | −1.895 | 1.341 | 16.870 | 2.709 | −358.7 | −189.1 | −141.8 | 0.876 | 0.549 | |||||
| 3210110302796747648 | 2.4222 | −1.815 | 1.787 | 11.638 | 0.709 | 6.75 | 0.85 | −341.0 | −175.2 | −153.1 | 7.2 | 1.6 | −3.9 | ||
| 3210144353298268160 | 2.3865 | −2.171 | 1.55 | 19.953 | 2.237 | −347.3 | −177.5 | −153.1 | |||||||
| 3210169848224432000 | 2.4599 | −1.856 | 1.328 | 20.811 | 1.586 | −335.8 | −169.8 | −153.8 | |||||||
| 3210693559355787264 | 2.4524 | −1.998 | 0.883 | 16.970 | 2.911 | −343.1 | −173.2 | −136.2 | |||||||
| 3210728984246548992 | 2.3481 | −1.649 | 1.562 | 20.887 | 2.259 | −357.9 | −177.9 | −147.2 | |||||||
| 3215628098822109824 | 2.3976 | −1.842 | 1.09 | 18.398 | 3.023 | −349.2 | −187.2 | −130.3 | 0.663 | 0.474 | |||||
| 3215676138032548224 | 2.4295 | −1.901 | 1.144 | 18.563 | 1.805 | −344.8 | −184.0 | −129.3 | 0.002 | 0.001 | |||||
| 3215676138032548480 | 2.3736 | −1.688 | 1.321 | 16.635 | 2.541 | −352.9 | −188.3 | −132.3 | |||||||
| 3215679123033701888 | 2.3796 | −1.802 | 1.195 | 18.420 | 3.259 | −352.3 | −187.6 | −131.4 | 0.596 | 0.445 | |||||
| 3215694000802887552 | 2.3718 | −1.537 | 1.283 | 17.847 | 3.060 | −353.8 | −187.2 | −132.6 | |||||||
| 3215832818437324800 | 2.3666 | −2.031 | 1.106 | 20.553 | 1.090 | −357.8 | −187.6 | −123.9 | |||||||
| 3215861057848075392 | 2.4024 | −1.587 | 1.159 | 12.062 | 0.899 | 34.55 | 5.11 | −349.1 | −183.3 | −133.3 | 30.1 | −11.9 | −12.7 | 0.228 | 0.123 |
| 3215878134638733824 | 2.4381 | −1.869 | 1.067 | 17.935 | 2.935 | −344.4 | −179.3 | −132.1 | 0.777 | 0.526 | |||||
| 3215944178351833472 | 2.42 | −1.918 | 1.344 | 18.453 | 3.313 | −347.7 | −177.0 | −136.2 | 0.943 | 0.659 | |||||
| 3215945140425054848 | 2.4134 | −1.765 | 1.448 | 11.030 | 0.582 | 28.2 | 1.08 | −348.7 | −177.1 | −136.9 | 25.1 | −8.1 | −11.0 | ||
| 3215948507678807168 | 2.3943 | −1.941 | 1.089 | 17.421 | 2.213 | −351.8 | −179.7 | −135.7 | 0.479 | 0.279 | |||||
| 3216001864056373760 | 2.4698 | −1.94 | 0.875 | 19.611 | 3.113 | −342.1 | −178.1 | −123.3 | |||||||
| 3216051513882385280 | 2.4867 | −1.676 | 1.162 | 19.388 | 3.047 | −341.3 | −174.0 | −122.4 | |||||||
| 3216054954147675392 | 2.3666 | −1.504 | 1.543 | 12.471 | 0.807 | 29.8 | 2.4 | −358.9 | −183.8 | −126.4 | 26.9 | −9.1 | −10.1 | 0.122 | 0.066 |
| 3216061443842831872 | 2.4367 | −2.206 | 1.421 | 12.277 | 0.819 | 26.94 | 3.82 | −349.1 | −177.8 | −122.4 | 24.3 | −7.4 | −10.4 | 0.194 | 0.105 |
| 3216087595899052800 | 2.4759 | −1.687 | 0.935 | 18.083 | 3.238 | −342.7 | −172.7 | −125.9 | 0.792 | 0.557 | |||||
| 3216090516476803456 | 2.3237 | −1.515 | 1.145 | 10.518 | 0.223 | 27.08 | 3.62 | −365.2 | −184.1 | −133.8 | 24.1 | −8.2 | −10.0 | ||
| 3216096632510194176 | 2.3779 | −1.621 | 1.444 | 13.134 | 1.007 | 29.46 | 1.53 | −357.5 | −179.4 | −129.7 | 26.4 | −8.7 | −10.5 | 0.179 | 0.095 |
| 3216101339793412352 | 2.4465 | −2.066 | 1.446 | 20.778 | 1.424 | −347.3 | −176.3 | −124.0 | |||||||
| 3216104049917812608 | 2.3899 | −1.98 | 1.38 | 15.187 | 1.836 | 34.97 | 9.73 | −355.6 | −179.7 | −127.8 | 31.0 | −10.9 | −12.8 | 0.344 | 0.187 |
| 3216109242534289664 | 2.4788 | −1.956 | 1.014 | 10.629 | 0.335 | 30.62 | 1.75 | −343.2 | −174.1 | −121.0 | 27.0 | −9.8 | −11.5 | 0.165 | 0.088 |
| 3216119687894593664 | 2.4151 | −1.662 | 1.271 | 19.071 | 3.253 | −352.5 | −176.9 | −126.2 | |||||||
| 3216138826268839936 | 2.3371 | −2.109 | 1.459 | 16.554 | 2.520 | −361.4 | −192.6 | −124.0 | 1.239 | 0.711 | |||||
| 3216204586512307072 | 2.3707 | −2.286 | 1.358 | 17.497 | 2.936 | −357.0 | −187.8 | −123.3 | 0.835 | 0.551 | |||||
| 3216371750933759104 | 2.3709 | −1.843 | 0.984 | 20.247 | 3.275 | −360.5 | −185.6 | −116.2 | |||||||
| 3216392023179484160 | 2.4549 | −1.649 | 0.873 | 20.671 | 1.968 | −349.1 | −180.4 | −107.3 | |||||||
| 3216437442459796992 | 2.3899 | −1.798 | 1.445 | 17.355 | 2.825 | −356.2 | −181.2 | −124.1 | 0.802 | 0.529 | |||||
| 3216442291478386688 | 2.4038 | −2.151 | 1.538 | 14.183 | 1.403 | 47.29 | 5.61 | −354.5 | −180.5 | −121.7 | 41.8 | −16.1 | −16.1 | 0.427 | 0.229 |
| 3216444387422405632 | 2.3206 | −1.995 | 1.497 | 17.121 | 2.789 | −367.4 | −187.1 | −125.3 | 0.7819 | 0.5075 | |||||
| 3216485069352710912 | 2.354 | −1.968 | 1.436 | 13.252 | 1.164 | 23.69 | 3.12 | −361.7 | −183.5 | −126.4 | 21.6 | −6.0 | −9.1 | 0.273 | 0.147 |
| 3216494312121076096 | 2.4579 | −1.761 | 1.585 | 16.866 | 2.828 | −347.1 | −175.6 | −119.3 | |||||||
| 3216526678995624448 | 2.3979 | −2.082 | 0.893 | 17.177 | 2.869 | −356.9 | −178.5 | −121.0 | |||||||
| 3216805641421533312 | 2.3677 | −2.024 | 1.261 | 17.564 | 2.980 | −358.6 | −176.5 | −136.5 | 1.118 | 0.728 | |||||
| 3216837531549482880 | 2.3564 | −1.52 | 1.149 | 13.796 | 1.261 | 45.01 | 3.67 | −360.1 | −180.6 | −133.5 | 39.3 | −15.8 | −15.7 | 0.379 | 0.203 |
| 3216838665419654912 | 2.3602 | −1.476 | 1.639 | 17.300 | -359.7 | −180.0 | −133.3 | ||||||||
| 3216843888100939008 | 2.4001 | −1.374 | 1.04 | 14.774 | 1.710 | 20.97 | 4.48 | −354.0 | −176.4 | −131.0 | 18.8 | −5.9 | −8.0 | 0.472 | 0.252 |
| 3216844437857284480 | 2.3935 | −1.448 | 0.976 | 16.754 | 1.933 | −355.2 | −176.8 | −130.9 | |||||||
| 3216850313372144000 | 2.3433 | −1.832 | 1.02 | 11.776 | 0.696 | 25.86 | 2.7 | −362.8 | −180.6 | −133.6 | 22.9 | −7.4 | −10.3 | 0.215 | 0.116 |
| 3216874051655373440 | 2.3802 | −1.865 | 1.267 | 18.976 | 3.177 | −357.9 | −178.1 | −129.1 | 0.412 | 0.323 | |||||
| 3216876254974564352 | 2.442 | −1.78 | 1.712 | 18.310 | 3.091 | −349.2 | −173.6 | −125.1 | 0.966 | 0.668 | |||||
| 3216895908744725632 | 2.4026 | −1.578 | 1.504 | 14.698 | 1.612 | −355.3 | −174.3 | −129.0 | 0.192 | 0.102 | |||||
| 3216897622436254336 | 2.3219 | −1.429 | 1.148 | 17.923 | 3.090 | −367.8 | −180.2 | −133.1 | 0.750 | 0.542 | |||||
| 3216897691155023360 | 2.3346 | −1.309 | 1.386 | 13.716 | 1.299 | −36.47 | 6.21 | −365.9 | −179.3 | −132.1 | −29.8 | 18.8 | 10.3 | 0.907 | 0.490 |
| 3216919990625228416 | 2.3749 | −1.469 | 0.967 | 11.603 | 0.669 | 30.95 | 2.81 | −359.4 | −175.7 | −131.4 | 27.3 | −9.9 | −11.3 | 0.157 | 0.084 |
| 3216937758905876352 | 2.3806 | −1.503 | 1.195 | 16.898 | 2.826 | −359.1 | −173.6 | −131.9 | 0.861 | 0.555 | |||||
| 3216947413992534272 | 2.4079 | −1.405 | 1.225 | 17.339 | 2.711 | −354.9 | −172.9 | −128.9 | 0.858 | 0.565 | |||||
| 3216954487801986048 | 2.375 | −1.525 | 1.11 | 17.818 | 3.077 | −360.4 | −175.5 | −128.9 | 0.867 | 0.592 | |||||
| 3216966518006856448 | 2.4136 | −1.706 | 1.379 | 14.287 | 1.464 | −6.73 | 5.29 | −354.6 | −171.0 | −129.0 | −4.5 | 6.6 | 0.5 | 0.507 | 0.271 |
| 3216997407412184448 | 2.3776 | −1.378 | 1.217 | 9.1413 | −0.033 | 25.69 | 26.72 | −357.0 | −171.8 | −141.3 | 22.9 | −7.2 | −9.8 | ||
| 3217028296817018752 | 2.3844 | −2.13 | 1.122 | 15.822 | 2.266 | −357.7 | −171.9 | −135.7 | 0.507 | 0.297 | |||||
| 3217274823643738752 | 2.4181 | −2.239 | 1.155 | 19.397 | 3.427 | −354.4 | −174.6 | −122.2 | |||||||
| 3217290633419229056 | 2.4771 | −1.914 | 0.824 | 18.124 | 3.134 | −346.2 | −169.0 | −120.5 | 0.638 | 0.449 | |||||
| 3217332135686020224 | 2.3468 | −2.073 | 1.093 | 17.634 | 3.019 | −365.4 | −178.0 | −128.1 | 0.818 | 0.558 | |||||
| 3217332174343645696 | 2.3647 | −2.102 | 1.152 | 10.101 | 0.233 | −362.6 | −176.5 | −127.2 | 0.743 | 0.399 | |||||
| 3217347601865296512 | 2.3729 | −2.118 | 1.15 | 11.728 | 0.884 | 29.43 | 2.52 | −361.6 | −174.5 | −128.2 | 26.3 | −8.2 | −11.5 | 0.234 | 0.125 |
| 3217347735007460992 | 2.4695 | −1.447 | 1.048 | 19.052 | 3.409 | −347.5 | −167.7 | −122.9 | |||||||
| 3217350105829476992 | 2.4141 | −1.664 | 1.135 | 16.597 | 2.848 | −355.8 | −171.3 | −125.1 | 0.774 | 0.513 | |||||
| 3217350900398106240 | 2.4929 | −1.533 | 1.55 | 16.366 | -344.6 | −165.6 | −121.4 | ||||||||
| 3217356015703988864 | 2.4253 | −1.728 | 0.995 | 8.6315 | 0.041 | 23.35 | 3.62 | −354.2 | −170.5 | −124.4 | 20.9 | −6.4 | −9.0 | 0.240 | 0.128 |
| 3217356909057734912 | 2.3663 | −1.477 | 1.147 | 17.892 | 3.153 | −363.2 | −174.5 | −127.5 | 0.663 | 0.458 | |||||
| 3217359657837224704 | 2.348 | −1.905 | 1.674 | 20.151 | 2.801 | −366.4 | −175.7 | −127.4 | |||||||
| 3217362303536988928 | 2.4148 | −1.449 | 1.301 | 18.909 | 3.352 | −356.4 | −170.0 | −124.7 | 0.238 | 0.190 | |||||
| 3217387837118879488 | 2.3891 | −1.568 | 1.45 | 14.987 | 1.723 | 18.6 | 9.11 | −360.6 | −171.9 | −124.9 | 17.4 | −3.9 | −6.9 | 0.418 | 0.223 |
| 3217391273090887168 | 2.4493 | −1.874 | 0.965 | 16.171 | 2.742 | −351.9 | −168.6 | −120.1 | |||||||
| 3217445183521903232 | 2.3292 | −1.756 | 1.103 | 13.353 | 1.920 | −22.61 | 21.67 | −371.0 | −180.9 | −118.0 | −18.5 | 13.1 | 4.2 | ||
| 3217512730471453952 | 2.485 | −1.899 | 1.308 | 16.609 | 3.007 | −348.7 | −166.5 | −112.3 | 0.718 | 0.495 | |||||
| 3217556199837262464 | 2.4392 | −2.123 | 1.253 | 16.039 | 2.339 | −353.3 | −167.2 | −123.7 | 0.686 | 0.406 | |||||
| 3217571696079288192 | 2.4314 | −1.654 | 1.358 | 12.400 | 1.098 | 28.33 | 3.74 | −354.7 | −166.4 | −125.2 | 25.6 | −7.8 | −10.1 | 0.609 | 0.330 |
| 3217581724826579072 | 2.38 | −1.559 | 1.125 | 17.524 | 2.887 | −362.6 | −171.2 | −125.6 | 0.701 | 0.472 | |||||
| 3217636395466272000 | 2.3513 | −1.416 | 0.982 | 15.764 | 2.531 | −367.5 | −168.7 | −131.9 | |||||||
| 3217640067664459520 | 2.4242 | −1.778 | 1.153 | 17.337 | 3.037 | −356.8 | −164.7 | −125.4 | 0.843 | 0.576 | |||||
| 3217651032714904576 | 2.3369 | −1.341 | 1.299 | 16.764 | 2.514 | −370.1 | −171.6 | −129.1 | 0.569 | 0.355 | |||||
| 3217691302328206080 | 2.3283 | −1.603 | 1.04 | 13.726 | 1.196 | 24.7 | 7.18 | −372.1 | −175.3 | −123.6 | 22.4 | −6.8 | −8.9 | 0.351 | 0.188 |
| 3217729269838908032 | 2.3958 | −1.836 | 1.193 | 15.106 | 1.129 | −363.2 | −170.0 | −115.7 | |||||||
| 3217746758945744256 | 2.358 | −1.642 | 1.434 | 18.410 | 3.139 | −369.5 | −171.3 | −118.3 | 0.960 | 0.686 | |||||
| 3217758608758824960 | 2.4595 | −1.888 | 0.861 | 18.022 | 2.990 | −353.1 | −162.7 | −119.0 | 0.915 | 0.624 | |||||
| 3217759295954420480 | 2.3319 | −1.691 | 1.071 | 19.570 | 3.036 | −372.4 | −171.4 | −125.8 | |||||||
| 3217761739789728896 | 2.3191 | −1.979 | 1.291 | 20.593 | −374.6 | −172.8 | −125.5 | ||||||||
| 3217767095614328960 | 2.4058 | −1.37 | 1.51 | 16.518 | 2.805 | −361.5 | −166.4 | −120.1 | 0.710 | 0.468 | |||||
| 3220106615839694848 | 2.3787 | −1.824 | 1.138 | 18.986 | 1.072 | −359.7 | −164.5 | −142.6 | 0.168 | 0.092 | |||||
| 3220310987564302592 | 2.4337 | −2.0 | 1.713 | 20.275 | 2.293 | −354.6 | −157.5 | −135.4 | |||||||
| 3220685650446800384 | 2.4248 | −1.587 | 1.073 | 12.832 | 1.079 | 19.42 | 8.12 | −358.3 | −162.3 | −123.9 | 17.8 | −4.4 | −7.5 | 0.469 | 0.251 |
| 3220687437153177088 | 2.3612 | −1.815 | 1.184 | 16.522 | 2.8894 | −368.2 | −166.7 | −126.6 | 0.793 | 0.527 | |||||
| Gaia DR3 Source Id. | BP-RP | VR | X | Y | Z | Flag | |||||||
|---|---|---|---|---|---|---|---|---|---|---|---|---|---|
| Gaia DR3 Source Id. * | * | * | * | * | BP-RP * | VR * | * | ** | *** | X | Y | Z | Flag |
| mas | mas/yr | mas/yr | mag | mag | km/s | km/s | km/s | pc | pc | pc | **** | ||
| 3216953014630150016 | 2.3064 | −1.581 | 0.719 | 14.913 | 1.761 | 39.94 | 6.26 | 27.90 | 0.93 | −371.0 | −180.7 | −132.7 | B |
| 3216953083349306240 | 2.3070 | −1.498 | 0.746 | 14.847 | 1.676 | -22.62 | 10.15 | 27.90 | 0.96 | −370.9 | −180.5 | −132.9 | B |
| 3216946310184034816 | 2.3460 | −1.330 | 1.050 | 15.746 | 2.150 | 27.90 | 0.99 | −364.4 | −177.8 | −131.3 | B | ||
| 3216949917956299648 | 2.3116 | −1.477 | 0.927 | 11.806 | 0.827 | 31.33 | 1.55 | 27.91 | 0.98 | −370.0 | −179.9 | −133.4 | B |
| 3216897691155023360 | 2.3345 | −1.308 | 1.385 | 13.716 | 1.299 | -36.47 | 6.21 | 27.90 | 0.89 | −365.8 | −179.3 | −132.0 | BO |
| 3216895908744725632 | 2.4025 | −1.578 | 1.504 | 14.698 | 1.612 | 27.90 | 0.84 | −355.2 | −174.2 | −128.9 | B | ||
| 3215983485892366976 | 2.3118 | −1.425 | 1.104 | 11.383 | 0.729 | 26.46 | 3.46 | 27.88 | 0.98 | −365.9 | −184.4 | −138.4 | G |
| 3017298401871010816 | 2.2951 | −1.563 | 1.147 | 15.813 | 2.384 | 27.70 | 0.76 | −358.7 | −202.8 | −141.2 | G | ||
| 3215918580346776832 | 2.4548 | −1.805 | 0.666 | 14.950 | 1.735 | 9.43 | 5.73 | 27.84 | 0.68 | −343.8 | −177.0 | −128.0 | G |
| 3216090516476803456 | 2.3237 | −1.515 | 1.144 | 10.518 | 0.223 | 27.08 | 3.61 | 27.87 | 0.94 | −365.2 | −184.1 | −133.7 | B |
| 3216837531549482880 | 2.3564 | −1.519 | 1.148 | 13.796 | 1.261 | 45.01 | 3.67 | 27.88 | 0.80 | −360.1 | −180.5 | −133.4 | B |
| 3215928063634719616 | 2.4235 | −1.225 | 0.720 | 15.381 | 1.920 | 27.87 | 0.72 | −346.9 | −177.8 | −135.1 | G | ||
| 3216843888100939008 | 2.4001 | −1.373 | 1.040 | 14.774 | 1.710 | 20.96 | 4.47 | 27.89 | 0.99 | −354.0 | −176.3 | −130.9 | B |
| 3215861057848075392 | 2.4024 | −1.587 | 1.159 | 12.062 | 0.899 | 34.55 | 5.11 | 27.82 | 0.93 | −349.1 | −183.3 | −133.2 | G |
| 3215898892217219200 | 2.3070 | −1.550 | 1.547 | 15.730 | 2.087 | 27.82 | 0.95 | −365.1 | −190.3 | −135.3 | G | ||
| 3215945140425054848 | 2.4133 | −1.764 | 1.447 | 11.030 | 0.582 | 28.19 | 1.07 | 27.88 | 0.81 | −348.6 | −177.1 | −136.9 | G |
| 3216109242534289664 | 2.4788 | −1.956 | 1.013 | 10.629 | 0.335 | 30.61 | 1.74 | 27.84 | 0.93 | −343.1 | −174.1 | −121.0 | B |
| 3216485069352710912 | 2.3540 | −1.967 | 1.436 | 13.252 | 1.164 | 23.68 | 3.12 | 27.83 | 0.85 | −361.6 | −183.5 | −126.3 | B |
| 3216842616790661120 | 2.3201 | −1.022 | 0.481 | 11.461 | 0.694 | 9.18 | 10.13 | 27.89 | 0.70 | −365.9 | −182.1 | −136.6 | B |
| 3216871101013663360 | 2.3021 | −1.360 | 0.669 | 13.777 | 1.332 | 20.90 | 3.24 | 27.90 | 0.91 | −370.3 | −182.0 | −135.5 | B |
| 3215637689485259904 | 2.5013 | −1.957 | 1.328 | 13.217 | 1.242 | 39.89 | 4.26 | 27.78 | 0.92 | −335.3 | −178.8 | −124.0 | G |
| 3217785104413698432 | 2.2983 | −0.955 | 1.031 | 15.864 | 2.144 | 27.94 | 0.72 | −378.9 | −172.5 | −126.1 | B | ||
| 3217771360518389888 | 2.3087 | −1.207 | 0.796 | 15.489 | 1.983 | 27.94 | 0.94 | −376.2 | −172.6 | −127.3 | B | ||
| 3215804501717947648 | 2.3595 | −1.339 | 1.514 | 11.374 | 0.594 | 29.06 | 1.76 | 27.81 | 0.89 | −357.1 | −186.8 | −130.9 | G |
| 3217778163746565248 | 2.4270 | −0.765 | 0.342 | 12.053 | 0.811 | 24.30 | 3.38 | 27.94 | 0.64 | −358.3 | −164.0 | −120.1 | B |
| 3217776342680441600 | 2.4344 | −0.695 | 0.849 | 13.524 | 1.293 | 35.21 | 5.35 | 27.94 | 0.62 | −357.2 | −162.9 | −120.5 | B |
| 3215781794227643392 | 2.3318 | −2.232 | 0.900 | 13.593 | 1.356 | 32.54 | 5.54 | 27.78 | 0.65 | −360.4 | −191.6 | −131.3 | G |
| 3209656552390066688 | 2.3707 | −1.737 | 1.392 | 13.903 | 1.333 | 26.08 | 2.65 | 27.82 | 0.89 | −352.3 | −186.4 | −137.8 | G |
| 3017300360376086912 | 2.3041 | −1.316 | 1.406 | 12.942 | 1.151 | 27.55 | 3.15 | 27.70 | 0.88 | −357.6 | −202.1 | −140.0 | G |
| 3017084443767558272 | 2.4018 | −1.637 | 1.339 | 13.737 | 1.278 | 28.94 | 2.11 | 27.67 | 0.78 | −341.3 | −196.0 | −135.5 | G |
| 3016995142807726080 | 2.3023 | −1.734 | 1.271 | 15.517 | 1.986 | 27.62 | 0.70 | −354.0 | −208.8 | −140.3 | G | ||
| 3017318983354345088 | 2.3650 | −1.659 | 1.534 | 14.082 | 1.499 | 17.85 | 5.22 | 27.68 | 0.96 | −349.1 | −197.9 | −132.8 | G |
| 3216919410805808128 | 2.3562 | −1.239 | 1.801 | 14.934 | 1.823 | 50.61 | 7.11 | 27.91 | 0.65 | −362.1 | −177.1 | −132.6 | B |
| 3216919990625228416 | 2.3748 | −1.469 | 0.967 | 11.603 | 0.669 | 30.95 | 2.80 | 27.91 | 0.94 | −359.3 | −175.7 | −131.3 | B |
| 3215847898068343936 | 2.3574 | −2.256 | 0.882 | 11.565 | 0.707 | 25.14 | 1.79 | 27.80 | 0.74 | −359.3 | −187.0 | −125.8 | B |
| 3216052445886802048 | 2.3392 | −2.194 | 0.628 | 10.628 | 0.552 | 31.72 | 1.15 | 27.83 | 0.63 | −362.9 | −185.5 | −128.7 | B |
| 3216442291478386688 | 2.4037 | −2.150 | 1.538 | 14.183 | 1.403 | 47.29 | 5.60 | 27.82 | 0.77 | −354.4 | −180.5 | −121.6 | B |
| 3217636395466272000 | 2.3512 | −1.415 | 0.982 | 15.764 | 2.531 | 27.97 | 0.93 | −367.4 | −168.6 | −131.8 | B | ||
| 3220685650446800384 | 2.4247 | −1.587 | 1.073 | 12.832 | 1.079 | 19.41 | 8.11 | 27.96 | 0.83 | −358.2 | −162.3 | −123.9 | B |
| 3220701043609564928 | 2.3717 | −1.093 | 0.849 | 13.772 | 1.339 | 24.88 | 3.60 | 27.97 | 0.91 | −366.8 | −165.1 | −126.1 | B |
| 3217626976602419712 | 2.4354 | −1.503 | 0.236 | 15.687 | 2.347 | 27.95 | 0.81 | −354.9 | −164.7 | −124.4 | B | ||
| 3217387837118879488 | 2.3891 | −1.568 | 1.449 | 14.987 | 1.723 | 18.59 | 9.11 | 27.91 | 0.75 | −360.6 | −171.9 | −124.8 | B |
| 3217649005490309120 | 2.4578 | −1.977 | 0.380 | 15.934 | 2.744 | 27.93 | 0.75 | −352.0 | −163.8 | −121.4 | B | ||
| 3217646600308651008 | 2.3759 | −1.057 | 0.951 | 14.950 | 1.663 | 50.72 | 7.58 | 27.94 | 0.88 | −363.8 | −169.5 | −126.5 | B |
| 3217595576097368576 | 2.3838 | −0.787 | 1.284 | 10.905 | 0.412 | 27.72 | 1.55 | 27.92 | 0.60 | −362.3 | −170.4 | −125.0 | B |
| 3217571696079288192 | 2.4313 | −1.653 | 1.358 | 12.400 | 1.098 | 28.33 | 3.74 | 27.94 | 0.77 | −354.6 | −166.4 | −125.1 | B |
| 3217576643881536896 | 2.4746 | −1.160 | 0.736 | 14.933 | 2.035 | 24.46 | 7.23 | 27.91 | 0.84 | −348.4 | −165.5 | −120.2 | B |
| 3217581037633478656 | 2.3349 | −1.801 | 0.711 | 12.055 | 0.835 | 31.05 | 3.82 | 27.92 | 0.84 | −369.5 | −174.6 | −127.7 | B |
| 3217666593380085376 | 2.3507 | −1.151 | 0.817 | 9.7916 | 0.113 | 22.19 | 3.51 | 27.95 | 0.95 | −368.6 | −169.7 | −127.5 | B |
| 3217673126026621440 | 2.3111 | −1.409 | 0.831 | 7.9883 | 0.005 | 28.77 | 1.50 | 27.94 | 0.97 | −375.2 | −172.6 | −128.8 | B |
| 3017085440199967232 | 2.4130 | −2.055 | 1.390 | 15.961 | 2.266 | 27.68 | 0.71 | −339.9 | −194.9 | −134.7 | G | ||
| 3016987476288866048 | 2.3647 | −1.596 | 1.591 | 12.506 | 0.897 | 32.45 | 2.86 | 27.67 | 0.63 | −346.0 | −199.4 | −138.9 | G |
| 3017407940715202816 | 2.4054 | −1.829 | 1.460 | 12.376 | 1.052 | 26.02 | 3.12 | 27.75 | 0.91 | −344.9 | −189.9 | −133.4 | G |
| 3215683697174962688 | 2.4021 | −1.317 | 0.942 | 10.886 | 0.412 | 34.20 | 3.62 | 27.80 | 0.80 | −349.3 | −185.0 | −130.5 | G |
| 3217364197618885760 | 2.4049 | −1.712 | 0.682 | 15.618 | 2.082 | 27.91 | 0.94 | −358.0 | −170.8 | −124.4 | B | ||
| 3217360207592650240 | 2.3119 | −1.816 | 0.791 | 14.876 | 2.049 | 46.20 | 9.67 | 27.91 | 0.64 | −371.7 | −178.1 | −130.7 | B |
| 3217360452407423232 | 2.3452 | −0.880 | 1.310 | 13.783 | 1.271 | 24.98 | 3.23 | 27.91 | 0.70 | −366.6 | −175.5 | −128.7 | B |
| 3217356015703988864 | 2.4253 | −1.728 | 0.995 | 8.6315 | 0.041 | 23.35 | 3.62 | 27.91 | 0.95 | −354.2 | −170.4 | −124.3 | B |
| 3217547060146911104 | 2.4208 | −1.072 | 0.811 | 15.463 | 2.035 | 96.12 | 11.55 | 27.93 | 0.92 | −355.2 | −168.8 | −126.1 | BO |
| 3217545170361327232 | 2.3627 | −1.293 | 1.026 | 14.688 | 1.568 | 42.24 | 8.03 | 27.93 | 0.87 | −363.7 | −172.9 | −130.0 | B |
| 3217350900400166144 | 2.4225 | −1.337 | 1.556 | 14.885 | 1.776 | 27.91 | 0.73 | −354.6 | −170.4 | −124.9 | B | ||
| 3217332174343645696 | 2.3647 | −2.102 | 1.151 | 10.101 | 0.233 | 27.89 | 0.74 | −362.6 | −176.5 | −127.2 | B | ||
| 3217336950346568448 | 2.3241 | −1.483 | 0.774 | 10.972 | 0.450 | 32.78 | 1.76 | 27.90 | 0.98 | −369.3 | −178.7 | −129.5 | B |
| 3217184083870448384 | 2.4404 | −0.893 | 0.921 | 10.152 | 0.151 | 23.92 | 2.64 | 27.94 | 0.86 | −352.4 | −166.2 | −126.5 | B |
| 3216969846604549376 | 2.3531 | −1.464 | 0.755 | 12.487 | 1.008 | 36.75 | 4.16 | 27.92 | 0.96 | −363.9 | −175.7 | −131.2 | B |
| 3217347601865296512 | 2.3729 | −2.118 | 1.150 | 11.728 | 0.884 | 29.42 | 2.51 | 27.91 | 0.69 | −361.5 | −174.4 | −128.1 | B |
| 3217350556802789376 | 2.3250 | −1.533 | 0.712 | 15.946 | 2.269 | 27.91 | 0.96 | −369.3 | −177.5 | −130.5 | B | ||
| 3216966518006856448 | 2.4135 | −1.705 | 1.379 | 14.287 | 1.464 | −6.72 | 5.29 | 27.92 | 0.82 | −354.6 | −171.0 | −129.0 | B |
| 3216974386386913408 | 2.3612 | −1.040 | 0.825 | 13.286 | 1.209 | 25.29 | 4.06 | 27.92 | 0.92 | −363.0 | −174.3 | −130.9 | B |
| 3217134262249922304 | 2.4019 | −0.856 | 0.560 | 9.0148 | 0.031 | 20.70 | 2.95 | 27.94 | 0.78 | −356.3 | −170.3 | −131.4 | B |
| 3017291736081784832 | 2.3040 | −1.876 | 1.323 | 11.215 | 0.552 | 30.89 | 1.83 | 27.70 | 0.77 | −356.9 | −202.0 | −141.8 | G |
| 3016216856077986688 | 2.3333 | −1.827 | 1.326 | 10.461 | 0.508 | 23.56 | 3.56 | 27.56 | 0.66 | −347.7 | −209.6 | −137.0 | G |
| 3217584615340797568 | 2.3859 | −0.797 | 1.084 | 10.149 | 0.223 | 17.83 | 3.45 | 27.91 | 0.64 | −361.8 | −171.7 | −123.4 | B |
| 3217382305201141760 | 2.3439 | −1.832 | 0.744 | 15.053 | 1.816 | 57.13 | 10.58 | 27.90 | 0.91 | −367.2 | −176.4 | −126.6 | B |
| 3217371511946673920 | 2.3136 | −1.665 | 1.416 | 15.503 | 2.159 | 27.89 | 0.76 | −372.0 | −179.2 | −127.5 | B | ||
| 3217325130596656896 | 2.2437 | −1.474 | 1.531 | 15.352 | 2.084 | 22.69 | 7.29 | 27.87 | 0.69 | −383.3 | −186.6 | −129.7 | B |
| 3217341382752766592 | 2.4127 | −1.968 | 0.674 | 15.958 | 2.244 | 27.89 | 0.78 | −356.0 | −172.7 | −123.1 | B | ||
| 3216552169628139904 | 2.5268 | −1.795 | 1.683 | 10.636 | 0.357 | 27.88 | 1.50 | 27.85 | 0.71 | −339.5 | −168.1 | −114.1 | B |
| 3217691302328206080 | 2.3283 | −1.602 | 1.039 | 13.726 | 1.196 | 24.69 | 7.18 | 27.90 | 0.65 | −372.0 | −175.3 | −123.5 | B |
| 3217765618145551616 | 2.3669 | −1.215 | 1.046 | 15.502 | 2.090 | 27.93 | 0.82 | −367.3 | −168.8 | −122.6 | B | ||
| 3217765789944254720 | 2.3988 | −0.912 | 1.155 | 15.880 | 2.160 | 27.93 | 0.62 | −362.4 | −166.6 | −120.9 | B | ||
| 3217806506234469120 | 2.3512 | −0.946 | 0.790 | 15.907 | 2.215 | 27.93 | 0.77 | −370.8 | −168.6 | −122.1 | B | ||
| 3216104049917812608 | 2.3899 | −1.979 | 1.380 | 15.187 | 1.836 | 34.96 | 9.73 | 27.85 | 0.84 | −355.5 | −179.7 | −127.7 | B |
| 1 | http://stev.oapd.inaf.it/cmd (accessed on 6 February 2023) |
| 2 | See note 1 above |
References
- Prusti, T. et al. [Gaia Collaboration] The Gaia mission. Astron. Astrophys. 2016, 595, A1. [Google Scholar] [CrossRef]
- Brown, A.G.A. et al. [Gaia Collaboration] Gaia Data Release 2. Summary of the contents and survey properties. Astron. Astrophys. 2018, 616, A1. [Google Scholar] [CrossRef]
- Castro-Ginard, A.; Jordi, C.; Luri, X.; Álvarez Cid-Fuentes, J.; Casamiquela, L.; Anders, F.; Cantat-Gaudin, T.; Monguió, M.; Balaguer-Núñez, L.; Solà, S.; et al. Hunting for open clusters in Gaia DR2: 582 new open clusters in the Galactic disc. Astron. Astrophys. 2020, 635, A45. [Google Scholar] [CrossRef]
- Castro-Ginard, A.; Jordi, C.; Luri, X.; Julbe, F.; Morvan, M.; Balaguer-Núñez, L.; Cantat-Gaudin, T. A new method for unveiling open clusters in Gaia. New nearby open clusters confirmed by DR2. Astron. Astrophys. 2018, 618, A59. [Google Scholar] [CrossRef]
- Castro-Ginard, A.; Jordi, C.; Luri, X.; Cantat-Gaudin, T.; Carrasco, J.M.; Casamiquela, L.; Anders, F.; Balaguer-Núñez, L.; Badia, R.M. Hunting for open clusters in Gaia EDR3: 628 new open clusters found with OCfinder. Astron. Astrophys. 2022, 661, A118. [Google Scholar] [CrossRef]
- Cantat-Gaudin, T.; Anders, F.; Castro-Ginard, A.; Jordi, C.; Romero-Gómez, M.; Soubiran, C.; Casamiquela, L.; Tarricq, Y.; Moitinho, A.; Vallenari, A.; et al. Painting a portrait of the Galactic disc with its stellar clusters. Astron. Astrophys. 2020, 640, A1. [Google Scholar] [CrossRef]
- Cantat-Gaudin, T.; Anders, F. Clusters and mirages: Cataloguing stellar aggregates in the Milky Way. Astron. Astrophys. 2020, 633, A99. [Google Scholar] [CrossRef]
- Kounkel, M.; Covey, K. Untangling the Galaxy. I. Local Structure and Star Formation History of the Milky Way. Astron. J. 2019, 158, 122. [Google Scholar] [CrossRef]
- Ratzenböck, S.; Meingast, S.; Alves, J.; Möller, T.; Bomze, I. Extended stellar systems in the solar neighborhood. IV. Meingast 1: The most massive stellar stream in the solar neighborhood. Astron. Astrophys. 2020, 639, A64. [Google Scholar] [CrossRef]
- Röser, S.; Schilbach, E. A census of the nearby Pisces-Eridanus stellar stream. Commonalities with and disparities from the Pleiades. Astron. Astrophys. 2020, 638, A9. [Google Scholar] [CrossRef]
- Meingast, S.; Alves, J.; Rottensteiner, A. Extended stellar systems in the solar neighborhood. V. Discovery of coronae of nearby star clusters. Astron. Astrophys. 2021, 645, A84. [Google Scholar] [CrossRef]
- Jerabkova, T.; Boffin, H.M.J.; Beccari, G.; de Marchi, G.; de Bruijne, J.H.J.; Prusti, T. The 800 pc long tidal tails of the Hyades star cluster. Possible discovery of candidate epicyclic overdensities from an open star cluster. Astron. Astrophys. 2021, 647, A137. [Google Scholar] [CrossRef]
- Brown, A.G.A. et al. [Gaia Collaboration] Gaia Early Data Release 3. Summary of the contents and survey properties. Astron. Astrophys. 2021, 649, A1. [Google Scholar] [CrossRef]
- Vallenari, A. et al. [Gaia Collaboration] Gaia Data Release 3. Summary of the content and survey properties. Astron. Astrophys. 2023, 674, A1. [Google Scholar] [CrossRef]
- Vereshchagin, S.V.; Chupina, N.V. Star Structure of the Northern Part of the Orion Sword Region. Astron. Rep. 2023, 67, 336–392. [Google Scholar] [CrossRef]
- Großschedl, J.E.; Alves, J.; Meingast, S.; Herbst-Kiss, G. 3D dynamics of the Orion cloud complex. Discovery of coherent radial gas motions at the 100-pc scale. Astron. Astrophys. 2021, 647, A91. [Google Scholar] [CrossRef]
- Alves, J.; Bouy, H. Orion revisited. I. The massive cluster in front of the Orion nebula cluster. Astron. Astrophys. 2012, 547, A97. [Google Scholar] [CrossRef]
- Caballero, J.A.; de Burgos, A.; Alonso-Floriano, F.J.; Cabrera-Lavers, A.; García-Álvarez, D.; Montes, D. Stars and brown dwarfs in the σ Orionis cluster. IV. IDS/INT and OSIRIS/GTC spectroscopy and Gaia DR2 astrometry. Astron. Astrophys. 2019, 629, A114. [Google Scholar] [CrossRef]
- Röser, S.; Schilbach, E.; Piskunov, A.E.; Kharchenko, N.V.; Scholz, R.D. A deep all-sky census of the Hyades. Astron. Astrophys. 2011, 531, A92. [Google Scholar] [CrossRef]
- Kharchenko, N.V.; Piskunov, A.E.; Schilbach, E.; Röser, S.; Scholz, R.D. Global survey of star clusters in the Milky Way. I. The pipeline and fundamental parameters in the second quadrant. Astron. Astrophys. 2012, 543, A156. [Google Scholar] [CrossRef]
- Spina, L.; Ting, Y.S.; De Silva, G.M.; Frankel, N.; Sharma, S.; Cantat-Gaudin, T.; Joyce, M.; Stello, D.; Karakas, A.I.; Asplund, M.B.; et al. The GALAH survey: Tracing the Galactic disc with open clusters. Mon. Not. R. Astron. Soc. 2021, 503, 3279–3296. [Google Scholar] [CrossRef]
- Bressan, A.; Marigo, P.; Girardi, L.; Salasnich, B.; Dal Cero, C.; Rubele, S.; Nanni, A. PARSEC: Stellar tracks and isochrones with the PAdova and TRieste Stellar Evolution Code. Mon. Not. R. Astron. Soc. 2012, 427, 127–145. [Google Scholar] [CrossRef]
- Sapozhnikov, S.; Kovaleva, D. Application of clustering algorithm to wide stellar pairs for unsupervised search of parts of disrupting clusters. Open Astron. 2021, 30, 191–202. [Google Scholar] [CrossRef]
- Ester, M.; Kriegel, H.P.; Sander, J.; Xu, X. A Density-Based Algorithm for Discovering Clusters in Large Spatial Databases with Noise. In Proceedings of the Second International Conference on Knowledge Discovery and Data Mining, KDD’96, Portland, OR, USA, 2–4 August 1996; pp. 226–231. [Google Scholar]
- Lindegren, L.; Klioner, S.A.; Hernández, J.; Bombrun, A.; Ramos-Lerate, M.; Steidelmüller, H.; Bastian, U.; Biermann, M.; de Torres, A.; Gerlach, E.; et al. Gaia Early Data Release 3. The astrometric solution. Astron. Astrophys. 2021, 649, A2. [Google Scholar] [CrossRef]
- Vereshchagin, S.V.; Tutukov, A.V.; Chupina, N.V. Scenario of OB-associations evolution. INASAN Sci. Rep. 2019, 3, 302–310. [Google Scholar] [CrossRef]
- Getman, K.V.; Feigelson, E.D.; Kuhn, M.A.; Garmire, G.P. Gaia stellar kinematics in the head of the Orion A cloud: Runaway stellar groups and gravitational infall. Mon. Not. R. Astron. Soc. 2019, 487, 2977–3000. [Google Scholar] [CrossRef]
- Contreras Peña, C.; Naylor, T.; Morrell, S. Determining the recurrence time-scale of long-lasting YSO outbursts. Mon. Not. R. Astron. Soc. 2019, 486, 4590–4611. [Google Scholar] [CrossRef]
- Chumak, Y.O.; Rastorguev, A.S. Analysis of the structure and dynamics of the stellar tails of open star clusters. Astron. Lett. 2006, 32, 157–165. [Google Scholar] [CrossRef]
- Jerabkova, T.; Boffin, H.M.J.; Beccari, G.; Anderson, R.I. A stellar relic filament in the Orion star-forming region. Mon. Not. R. Astron. Soc. 2019, 489, 4418–4428. [Google Scholar] [CrossRef]
- Bovy, J. galpy: A python Library for Galactic Dynamics. Astrophys. J. Suppl. Ser. 2015, 216, 29. [Google Scholar] [CrossRef]
- Vereshchagin, S.V.; Tutukov, A.V.; Chupina, N.V.; Postnikova, E.S.; Sizova, M.D. Binary Clusters: Theory and Observations. Astron. Rep. 2022, 66, 361–386. [Google Scholar] [CrossRef]
- Taylor, M.B. TOPCAT & STIL: Starlink Table/VOTable Processing Software. In Proceedings of the Astronomical Data Analysis Software and Systems XIV, Pasadena, CA, USA, 24–27 October 2004; Shopbell, P., Britton, M., Ebert, R., Eds.; Astronomical Society of the Pacific: San Francisco, CA, USA, 2005; Volume 347, p. 29. [Google Scholar]
- Wenger, M.; Ochsenbein, F.; Egret, D.; Dubois, P.; Bonnarel, F.; Borde, S.; Genova, F.; Jasniewicz, G.; Laloë, S.; Lesteven, S.; et al. The SIMBAD astronomical database. The CDS reference database for astronomical objects. Astron. Astrophys. Suppl. Ser. 2000, 143, 9–22. [Google Scholar] [CrossRef]


| Parameter | Mean_A | Error_A | Mean_B | Error_B | Mean_B0 *** | Units |
|---|---|---|---|---|---|---|
| −351 | 1 | −360 | 1 | – | pc | |
| ** | 52 | – | 48 | – | 54 | pc |
| −184 | 1 | −178 | 1 | – | pc | |
| ** | 61 | – | 48 | – | 60 | pc |
| −132 | 1 | −129 | 1 | – | pc | |
| ** | 63 | – | 28 | – | 9 | pc |
| U | 21.6 | 2.5 | 24.9 | 1.8 | – | km/s |
| V | −7.1 | 1.2 | −8.7 | 0.9 | – | km/s |
| W | −9.4 | 1.0 | −10.2 | 0.6 | – | km/s |
| N | 150 | – | 83 | – | – | – |
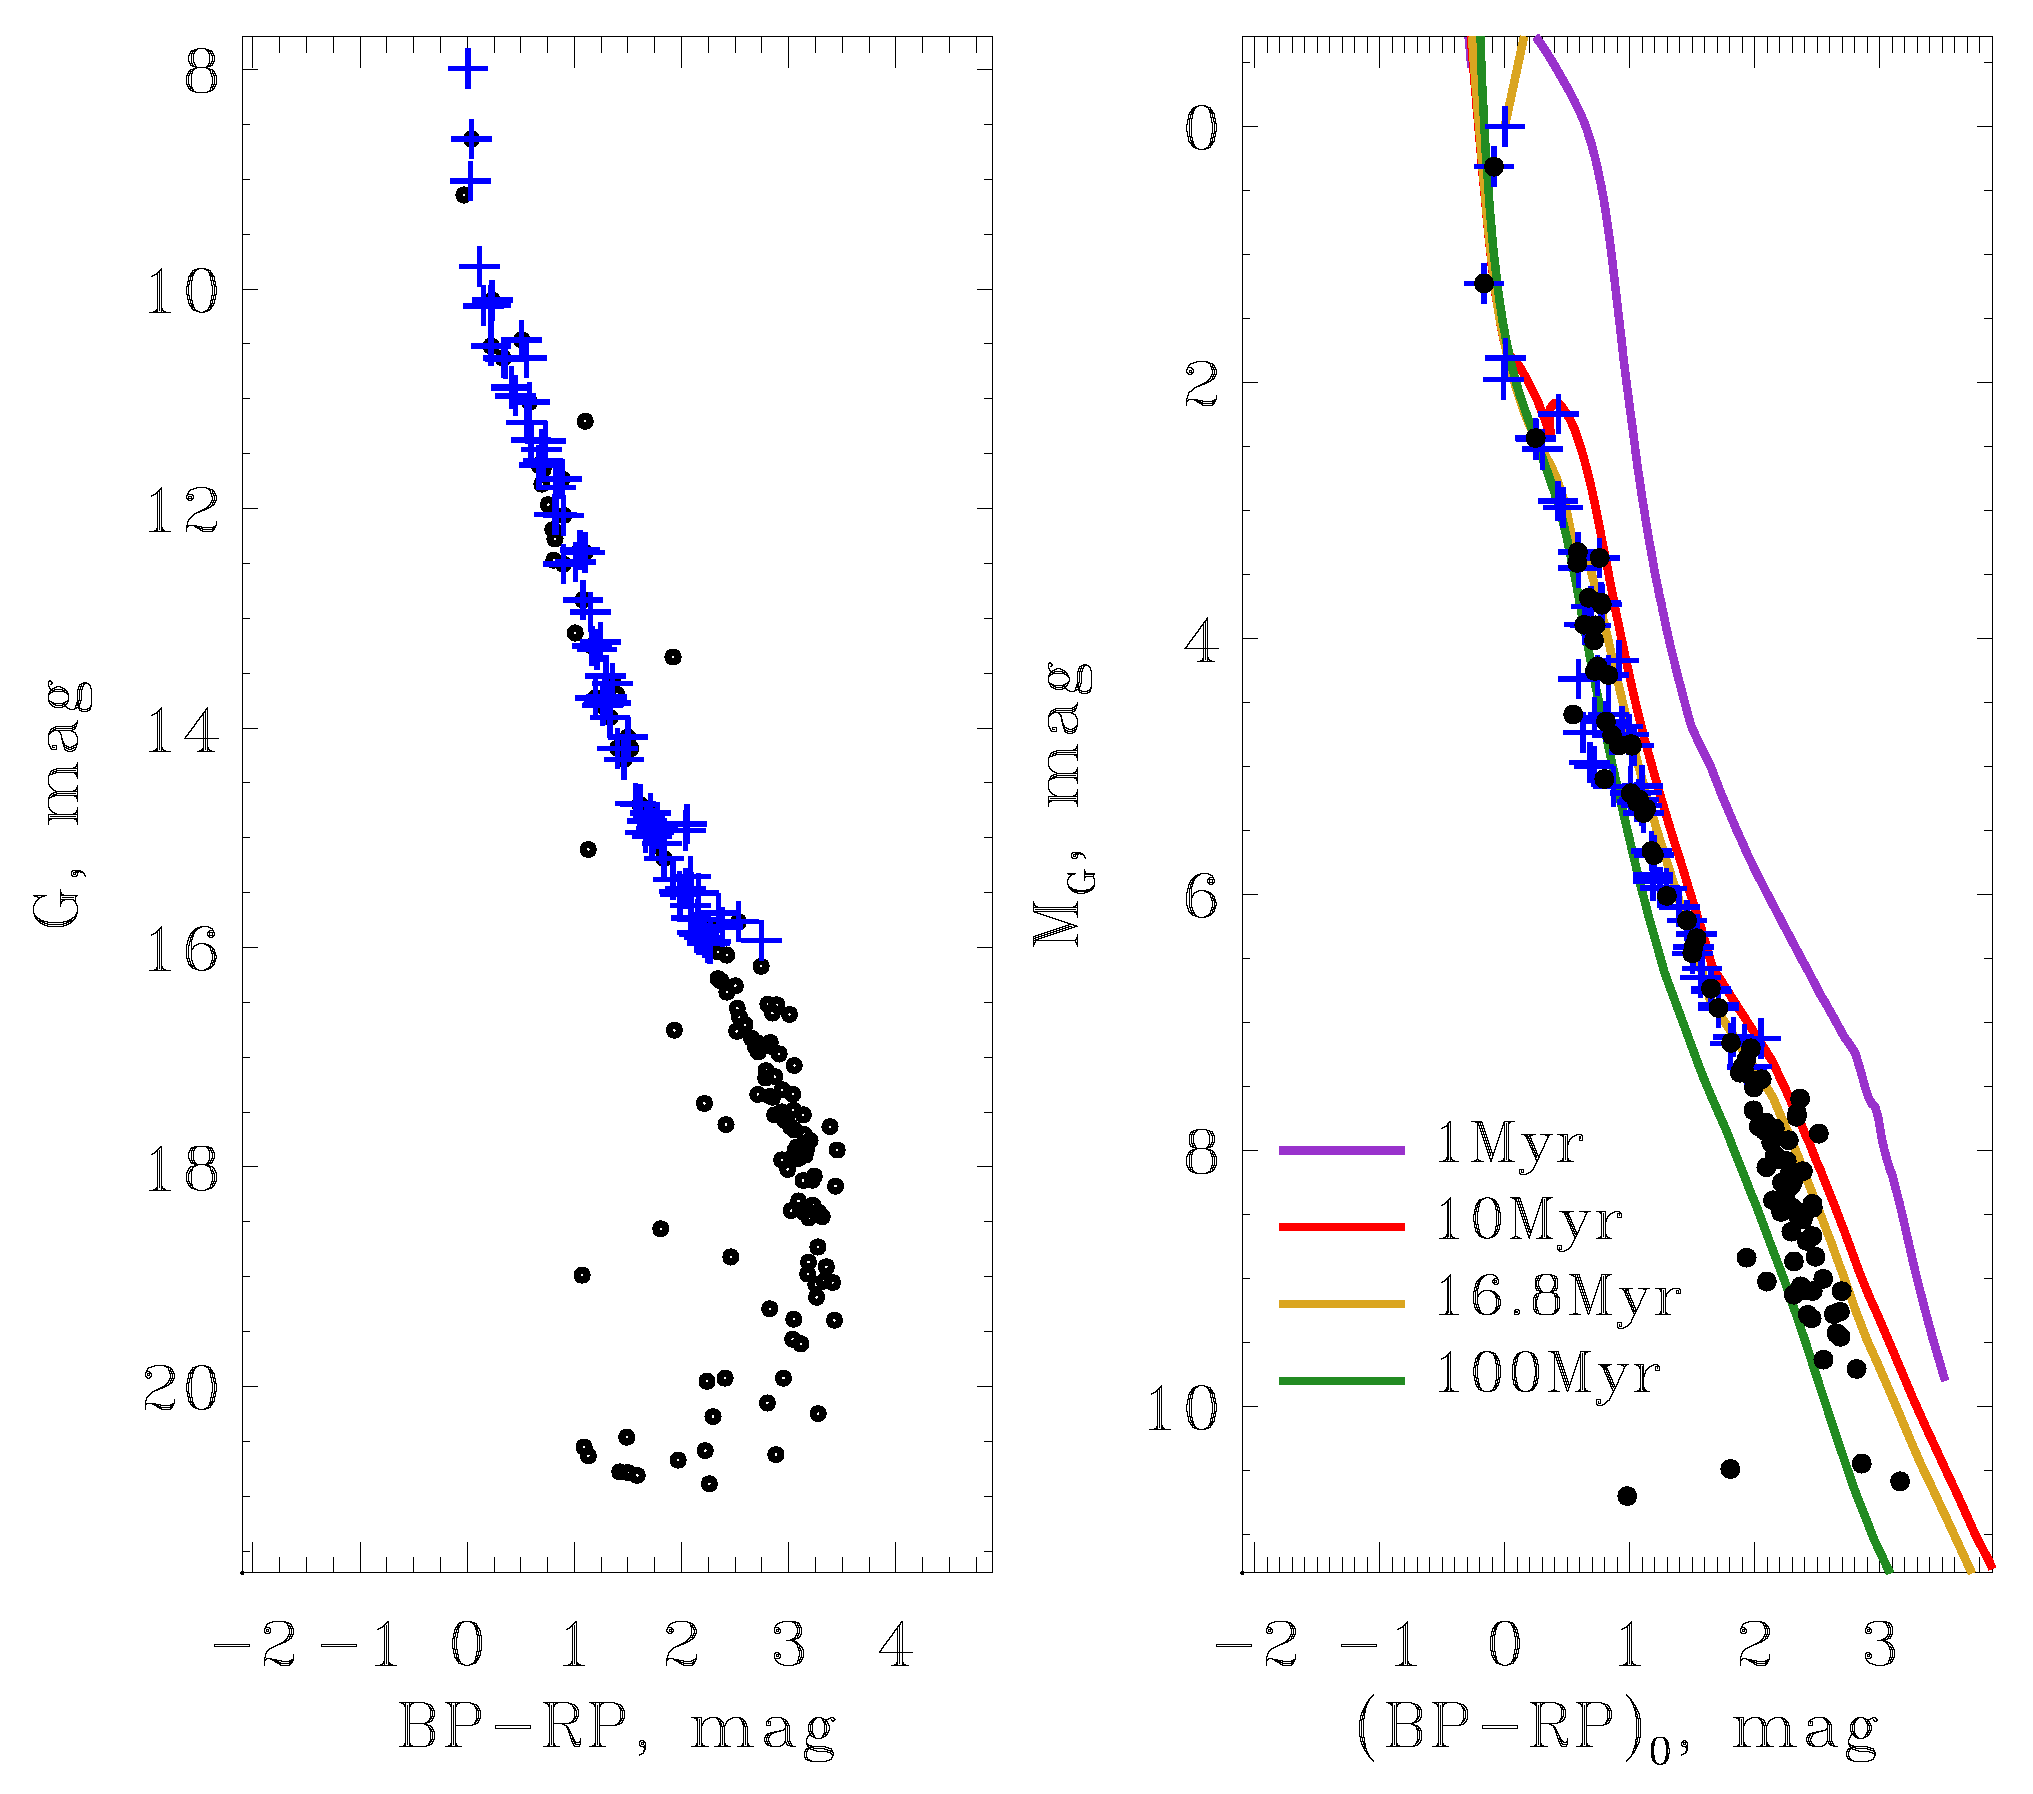
| Age | 16 | 16 **** | – | – | Myr |
| Parameter | Dataset * | Dataset * | Units |
|---|---|---|---|
| 84.28 ± 0.12 | 83.95 ± 0.06 | deg | |
| −4.73 ± 0.24 | −1.71 ± 0.09 | deg | |
| 2.370 ± 0.011 | 2.372 ± 0.007 | mas | |
| −1.669 ± 0.055 | −1.449 ± 0.050 | mas/yr | |
| 1.263 ± 0.057 | 0.995 ± 0.042 | mas/yr | |
| 27.98 ± 1.7 | 27.99 ± 2.1 | km/s |
| Dimension, pc | Present ** | −16 Myr ** |
|---|---|---|
| * | 12 ± 2 | 5 ± 38 |
| * | −17 ± 2 | −6 ± 19 |
| * | −8 ± 1 | 6 ± 11 |
| Distance | 22 ± 3 | 10 ± 44 |
Disclaimer/Publisher’s Note: The statements, opinions and data contained in all publications are solely those of the individual author(s) and contributor(s) and not of MDPI and/or the editor(s). MDPI and/or the editor(s) disclaim responsibility for any injury to people or property resulting from any ideas, methods, instructions or products referred to in the content. |
© 2023 by the authors. Licensee MDPI, Basel, Switzerland. This article is an open access article distributed under the terms and conditions of the Creative Commons Attribution (CC BY) license (https://creativecommons.org/licenses/by/4.0/).
Share and Cite
Vereshchagin, S.; Chupina, N.; Lyzenko, K.; Kalinkin, A.; Kondratev, N.; Kovaleva, D.; Sapozhnikov, S. A Scattered Star Group in the Orion A Region of the Milky Way. Galaxies 2023, 11, 99. https://doi.org/10.3390/galaxies11050099
Vereshchagin S, Chupina N, Lyzenko K, Kalinkin A, Kondratev N, Kovaleva D, Sapozhnikov S. A Scattered Star Group in the Orion A Region of the Milky Way. Galaxies. 2023; 11(5):99. https://doi.org/10.3390/galaxies11050099
Chicago/Turabian StyleVereshchagin, Sergei, Natalya Chupina, Kristina Lyzenko, Anatoly Kalinkin, Nikolay Kondratev, Dana Kovaleva, and Sergei Sapozhnikov. 2023. "A Scattered Star Group in the Orion A Region of the Milky Way" Galaxies 11, no. 5: 99. https://doi.org/10.3390/galaxies11050099