

A Walk through AGN Country—For the Somewhat Initiated!
Department of Physics, University of California, Santa Barbara, CA 93106-9530, USA
Galaxies 2023, 11(5), 102; https://doi.org/10.3390/galaxies11050102
Submission received: 4 July 2023
/
Revised: 30 August 2023
/
Accepted: 9 September 2023
/
Published: 30 September 2023
(This article belongs to the Special Issue The Symbiosis between Radio Source and Galaxy Evolution)
Abstract
:Key issues in AGN and galaxy formation are discussed. Very successful Unified Models explain much of the variety of AGN with orientation effects; the ingredients are shadowing by a dusty “torus” and relativistic beaming. A spinoff result is described which is important for the formation of massive elliptical galaxies, the most spectacular and unequivocal AGN feedback phenomenon known. This is the so-called “alignment effect” in powerful radio galaxies at z ≳ 1. One of them is
a BAL radio galaxy! Next, I explain a very robust derivation of the reddening law for nuclear dust,
which reveals a dearth of small grains on parsec scales. Then, the quasistatic thin accretion disk
model, thought by many to explain the energetically dominant optical/UV continuum, is thoroughly
debunked. Much of this was known when the model was proposed 35 years ago. A new argument
is provided that trivially falsifies a huge superset of such models. I then show that it is possible to
see the central engine spectrum with the atomic and dust emission surgically removed! Few have
noticed this breakthrough work. Finally, the far IR dust emission in Cygnus A is 10% polarized; to
date, high nuclear dust polarization has been seen in all radio loud objects and no radio quiet ones.
1. Introduction
In his book The Burdens of Skepticism (1987), Carl Sagan wrote:
“In science it often happens that scientists say, ‘You know, that’s a really good argument; my position is mistaken’, and then they actually change their minds and you never hear that old view from them again. They really do it. It doesn’t happen as often as it should, because scientists are human and change is sometimes painful. But it happens every day. I cannot recall the last time that happened in politics or religion”.[The Skeptical Inquirer 12, 1, 1987]
This is not a report on new research or a review paper. It is an idiosyncratic essay strongly emphasizing the author’s own work, and a critical commentary on certain key topics in the literature. It is my opinion that the greatest limitation in this field, and probably science generally, is not intelligence, perseverance, instrumentation, computer power, or even imagination. The limiting factor is poor critical thinking and a great tendency to go along with the crowd. This is why science progresses largely in paradigm shifts, and especially at funerals. We can do much better. We can make much faster progress and have more fun doing it if people would do less, think more, fetishize critical thinking, make intellectual honesty our religion, and stop thinking magically.
The first two parts of this essay derive from a meeting presentation, my task being to tell the origin story of the AGN spectroscopic unified model and comment on various aspects of its development. There is a second aspect involving geometrical unification of accreting supermassive black holes by relativistic beaming. Beaming unification, a compelling and necessary idea, was plagued with statistical anomalies until Peter Barthel found the solution by “cheating”! He read outside his field. He read our optical polarization papers, and suddenly underwent a religious conversion and started the Unification Church. I joined the Church right away, and we preached that spectroscopic unification married Beaming Unification and the two live happily together today.
I recount some of the sad and almost unbelievable history of modeling the energetically dominant Big Blue Bump continuum component in Quasars and other Type 1 AGNs. The story is sad because vast theoretical effort has gone into modeling this Big Blue Bump continuum with optically thick, geometrically thin, and quasistatic accretion disks, despite the gross inconsistency of such modeling with the data. Cognitive dissonance was part of the model from the very beginning in the 1980s; it was pointed out explicitly at that time that the variability and polarization were comically at variance with predictions. Over the 40 years (and counting) of its “development”, additional profound discrepancies have been discovered, not least of which is measurement of the surface brightness of the emitter with microlensing, which is an order of magnitude less than the value for any opaque material that can fit the spectral energy distribution.
References for the variability, polarization, and surface brightness are Alloin et al., 1985 [1]; Antonucci 1988 [2], Antonucci, Kinney and Ford 1989 [3]; and Dexter and Agol 2011 [4].
My experience has been that when I argue for the rough validity of the Unified Models my audience finds me persuasive, tending to adopt it as a very helpful approximation and to acknowledge its prodigious predictive power.
By contrast, I have had a great many opportunities in papers and talks to detail the profound falsification of the “standard” disk model. In this case, while my listeners appear to be similarly moved by the force of the arguments, they revert their views within at most about three days. They relax back into Magical Thinking. I have measured that time constant at meetings. Two or three days and their heads are back in the sand. They resume the nearly universal practice of synonymously referring to “the accretion disk” and the Big Blue Bump (BBB) optical/UV continuum component. I now stop reading when I reach such a statement in a paper; it means that the authors are unaware or uninterested in the observations.
I have made clear from my first critiques in the 1980s that accretion by black holes is almost certain to be the energy source for AGNs, and that I would bet my car that there is a flat isodensity contour somewhere in the inner accretion flow. Alas, we are not looking at the photosphere of a disk which remotely resembles the standard version that almost everyone accepts, nor are the implied scaling relations seen.
Very fundamentally, the standard disk model predicts a proportionality between the characteristic temperature and the product . This is required of any model with thermal radiation from a fixed region set by (that is, ). This has been utterly falsified multiple times. In fact, in the present paper I explain how the reader can exclude such models with a figure perfect for a T-shirt. A mighty river of theory papers flowing for 40 years is negated by a simple observation based on published literature. An enterprising person can disprove the dependence on M and L…, or anything else!
Instead of forcing my content to fit a structure, I will take you on a walk through AGN country and tell you about some things that interest me. In keeping with the intent of this volume, I will remind you of a precious opportunity to separate the radiative from the dynamical effects of an accreting massive black hole on its host. I draw attention to a spectacular body of knowledge about giant elliptical galaxy star-formation in powerful radio galaxies at redshifts 1 ≲ z ≲ 4, which illustrates feedback in the clearest possible way
and at the greatest possible scale. This is the radio/optical “alignment effect”. Tim Heckman
tells me galaxy formation people pay no attention to this incredible phenomenology,
because they labor under the illusion that the extended optical light is just scattered from
hidden quasars! I provide seemingly powerful testable arguments that something akin to
a latter-day monolithic collapse event (or cooling flood) occurs in certain of these powerful radio galaxies. I highlight a literal Broad Absorption Line (BAL) radio galaxy, not a quasar, which
is surely the most spectacular Galactic Wind ever seen! Yet, these amazing aspects of
AGN feedback are known to very few people in the field, presumably due to the usual
balkanization by subspeciality that holds back all fields of science.
I introduce the reader to the five extant quasar spectra, freed of the awful contamination from surrounding reprocessed emission in the various emission line regions and the dust torus. While these spectra do not look like the spectra of quasars which you have seen, they do look very much like each other!
I will prove that many AGNs are heavily absorbed by dust, which is gray in the UV. If you do not believe this result, you must then give up at least one of the axioms which may be dear to you.
Finally, recent and quite unexpected results are discussed regarding the wonderful Cygnus A radio galaxy and a very intriguing apparent difference between radio-loud and radio-quiet AGNs, tentatively indicating that they differ systematically in terms of their magnetic fields on pc scales!
2. How I Became Mister Doughnut—The Spectroscopic Unified Model
The AGN Mesoscale is my name for the region around the dust sublimation radius through (say) the Narrow Line Region, where the AGN is still in the driver’s seat.
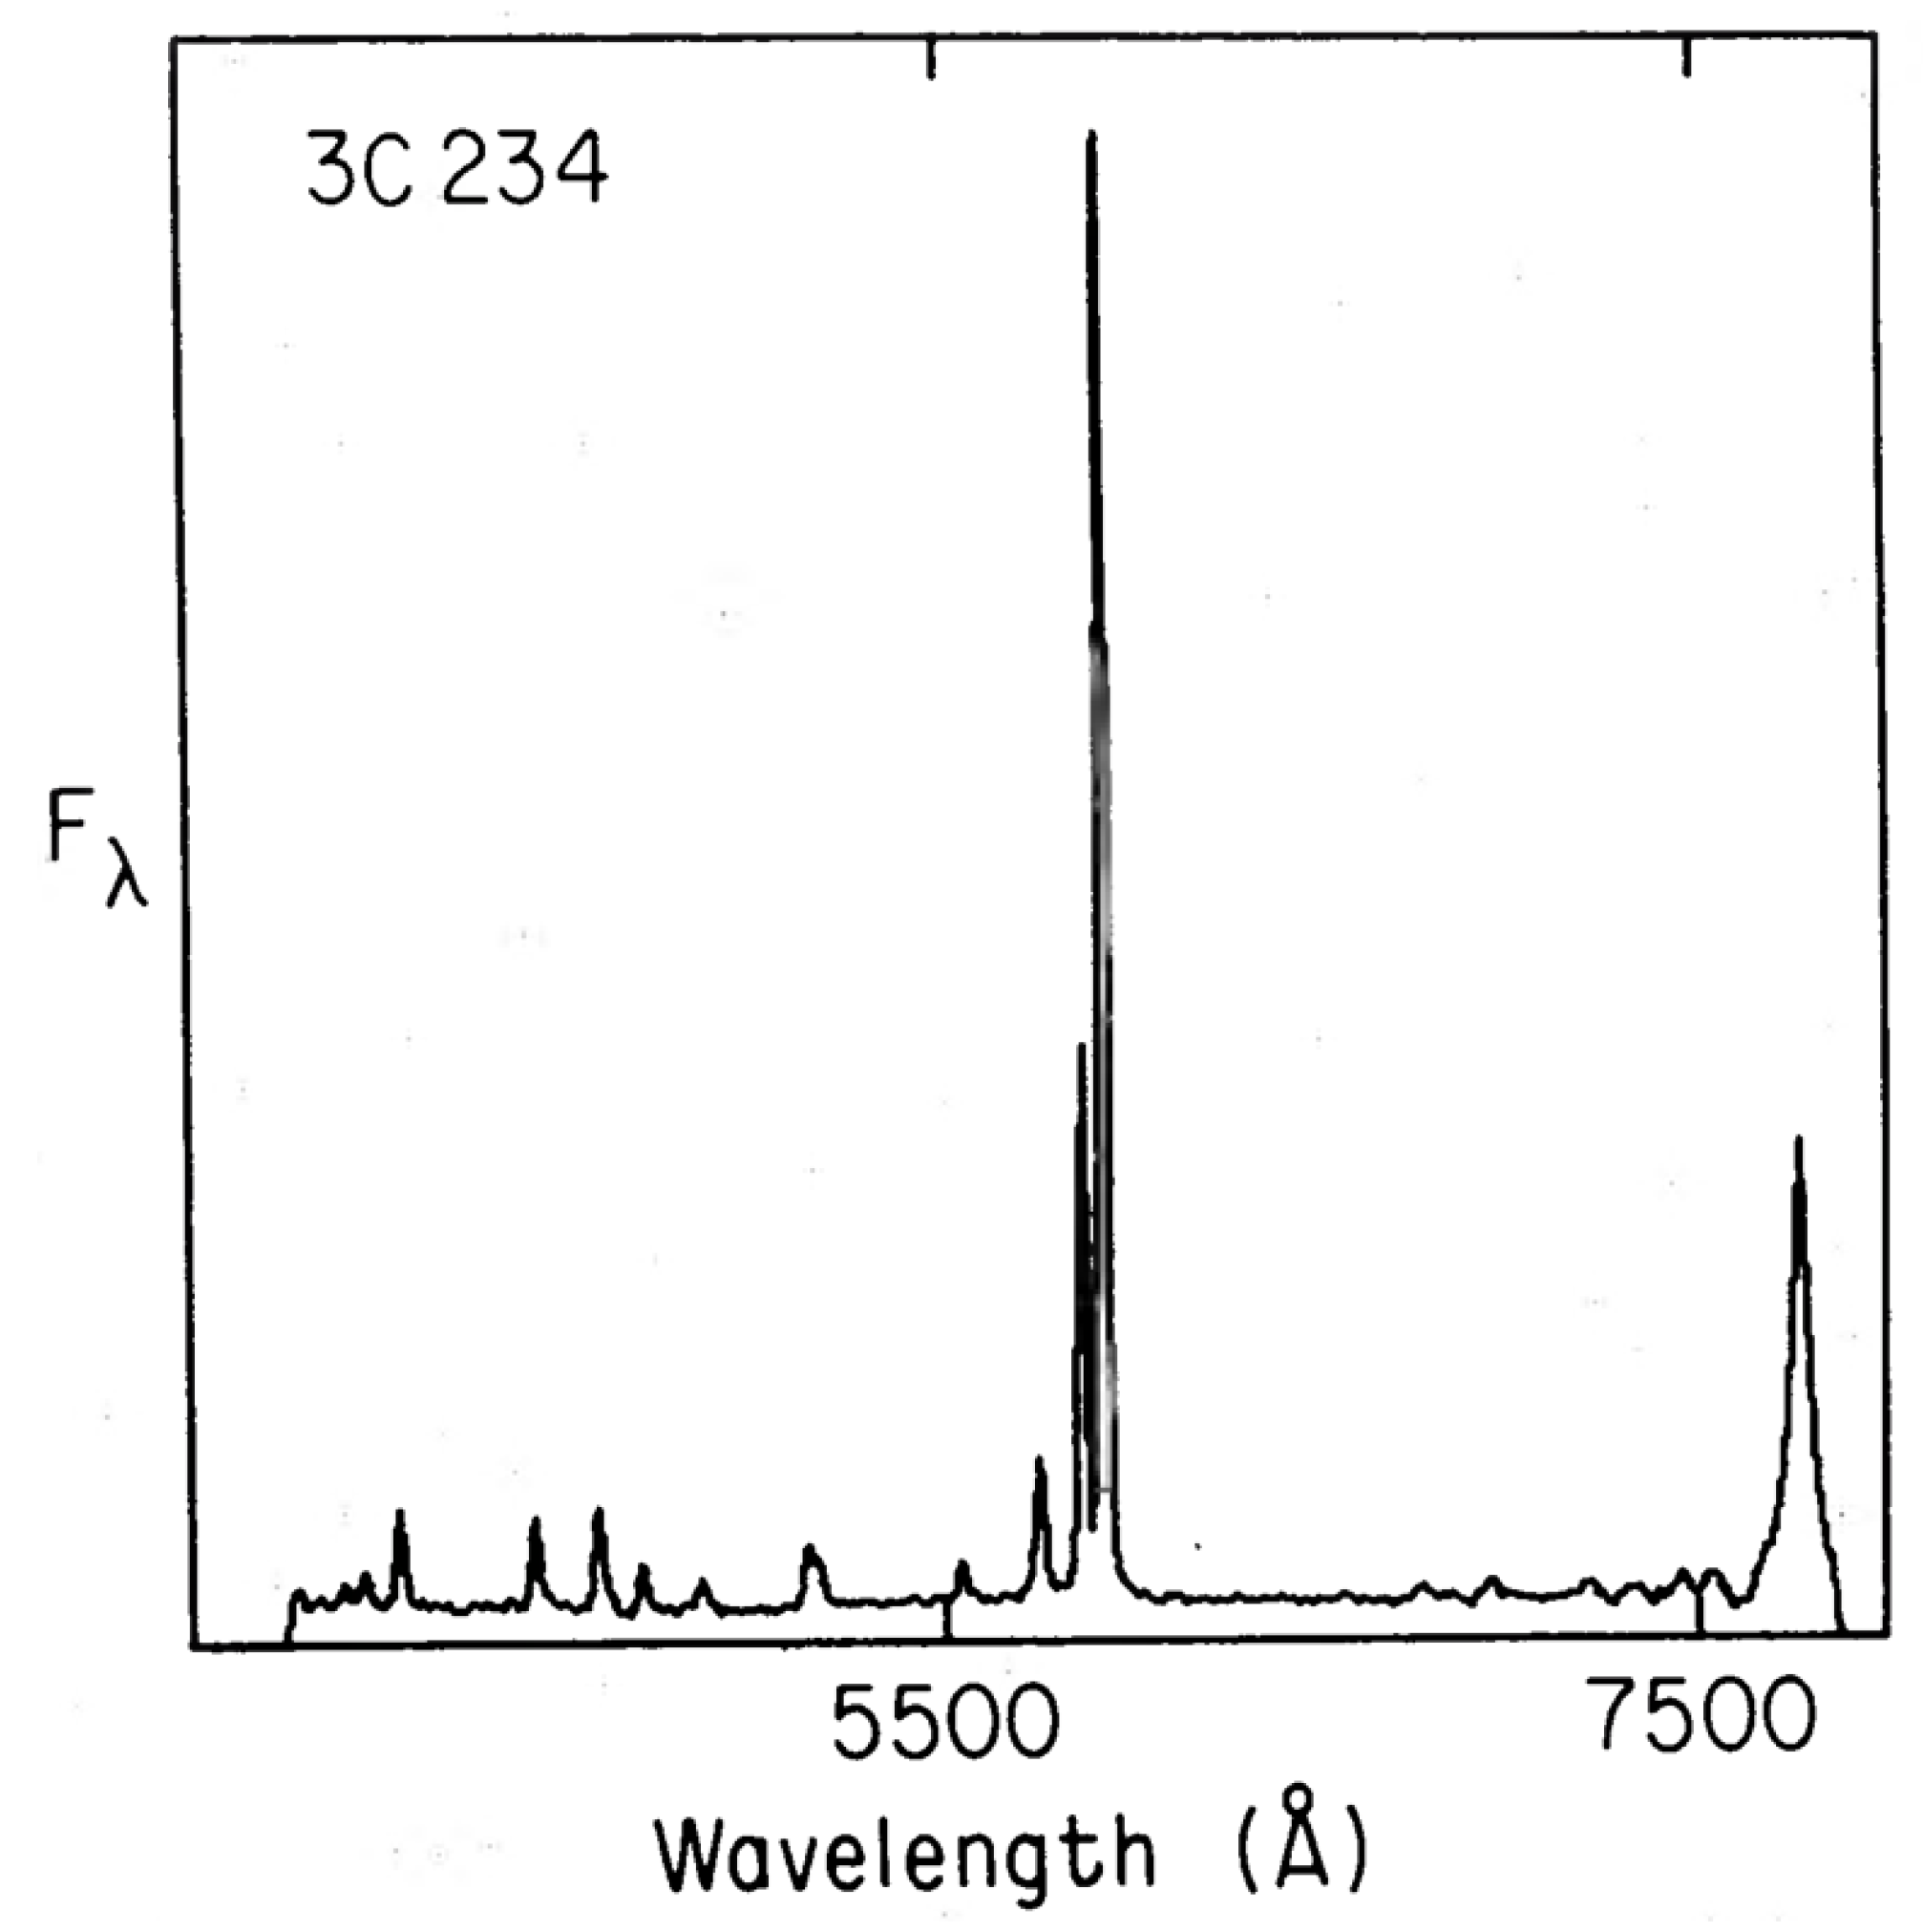
The discovery of the first hidden Type 1 nucleus with polarimetry, the Narrow Line Radio Galaxy 3C234, follows below.
2.1. “Take Out the Dark Slide”
After I published the first hidden Type 1 spectrum in 1984, I met a fellow at a conference who excitedly and correctly described my paper, saying that he had discussed it in his journal club and he was sorry he did not remember the name of the author. When I confessed I was the author, he said, “Really? You’re Mister Doughnut?” Well, here is how I found the doughnuts with the Type 1 nuclei inside.
When I was a grad student at UC Santa Cruz in the late 1970s, my eventual advisor, J.S. Miller, along with postdoc Gary Schmidt, were building an instrument that could sort photons by polarization as well as by wavelength. At that time, there had been very little spectropolarimetry of AGN. Perhaps it was considered overkill to obtain a high spectral resolution, as AGN polarization was known only for identifying broadband processes such as synchrotron emission and scattering; and so many photons would need to be collected! In fact, polarimetry was considered by most to be an esoteric fringe field.
I had been considering asking Miller to take me on as a graduate student when I attended an AAS meeting and heard a talk by the director of Kitt Peak National Observatory, the famous Geoffrey Burbidge. His topic was the wonders that might be revealed by a truly giant telescope (say, 8 m). On Burbidge’s grand agenda for the futuristic telescope, the last sub-sub-sub-topic was “Astrometry and polarimetry”. Burbidge may have devoted a dependent clause of his talk to these two despised specialities, but I think it was really rather a grunt.
I knew that aside from the well-explored blazar class of synchrotron emitters, the percent polarizations of AGN are discouragingly low; 1% is considered to indicate an attractive target. For spectropolarimetry, I knew that to achieve the same SNR in polarized light as in total light with 1% polarization would take an exposure longer by a factor of at least 20,000.
I wondered whether such low polarization might be due to “weather”, in which case it would carry no important information. Then, in 1979, Stockman et al. (1979) [5] reported that the optical polarization “vector” in lobe-dominant radio quasars tends very strongly to align parallel with the ∼300 kpc radio axis. This was electrifying to me, because it meant that the very small optical polarizations were not meaningless weather; instead, they were something fundamental that connects the tiny optical region of perhaps a few a.u. to the giant radio lobes on scales billions of times larger. The rough axisymmetry is maintained from relativistic scales to intergalactic scales!
Joe took me on. I had no talent or interest in instrumentation or software, and when he showed me the precious incubating instrument, I could only nod and smile uncomfortably. It looked just like any other gray metal box of parts to my glazed eyes. I was no great observer, either. I prepared hugely and relied on incredibly detailed checklists. For example, before beginning an exposure I read aloud solemnly, “Step 1. Open Dark Slide”. Miller and Schmidt were both very intuitive at the telescope and I later learned that after that first run, Gary told Joe, “You’ve got to get rid of this guy. Did you see he had to read his checklist to figure out you have to open the dark slide?”
With linear polarimetry, you have three of the four Stokes’ Parameters; instead of just I, Q and U can be measured simultaneously with only slight loss of light. Joe and I, and I guess Gary, had a personality trait in common. We all wanted a free lunch. A stairway to heaven! We had little assurance that Q and U encoded a ton of interesting information, but we were all…optimistic guys.
2.2. Pay Dirt: The Spectroscopic Unified Model with Obscuring Torus and Polar Periscopic Mirror
Joe suggested Radio Galaxies for my thesis topic, which I eagerly accepted. We observed almost every dark run at the modest 3 m telescope of Lick Observatory. The site was poor, and the quantum efficiency was low by today’s standards. When I expressed anxiety about the SNR situation, Joe said, “Think of it this way. We have a big telescope, only it’s in series instead of parallel”. Our “Image Dissector Scanner” was a real Rube Goldberg device, but devilishly clever in using slightly persistent phosphors on the back of an image tube, which allowed the single channel detector to zip around, steered magnetically, and visit all the wavelength channels before they stopped glowing. The fact is, Lick was eating everyone else’s lunch with that thing. It was before CCDs.
During each run we included a few of my radio galaxies, and it was discouraging work. A series of them showed P consistent with zero, or with just the polarization due to dichroic absorption in the Milky Way galaxy. The dominant signal was from stars in the host galaxies.
One advantage of that crazy instrument was that it truly counted photons, unlike CCDs, and you could see each one cause an increment in the flux in some wavelength channel in real time. The spectra for each polarization position angle were displayed on a small round green oscilloscope screen. Finally, we observed 3C234 and saw the photons come in, sometimes to the Ordinary Ray spectrum and sometimes to the Extraordinary Ray. Any difference meant that polarization was detected.
We sensed a possible detection such that the 0° (=180°) ray was stronger than 90°. I recall that we watched the photons barrel in and be counted, incrementing the displayed spectra. Ordinary. Ordinary. Extraordinary. Then, we (or at least I) started rooting aloud for each +Q (0°) photon, while cursing those at 90°.
The ordinary ray of the Q Stokes Parameter was getting farther ahead!
Finally Joe said calmly, “Pay dirt”.
Because until that moment, we had nothing for my thesis.
The 3C234 radio galaxy has a jet position angle of 68° degrees, to which I had assigned an uncertainty of 5°, which was somewhat arbitrary and a bit generous. We measured a polarization position angle of , almost exactly orthogonal to the radio axis, and eventually established a “perpendicular” class of AGN, meaning that the optical polarization position angle in this group is perpendicular to the radio axis. That was opposite to the discovery of parallel polarization in quasars by Stockman et al. The magnitude of P was at least ten times higher in the perpendicular group. It became clear that they were none other than the Type 2 spectral class members.
The total flux spectrum of 3C234 is shown below in Figure 1.
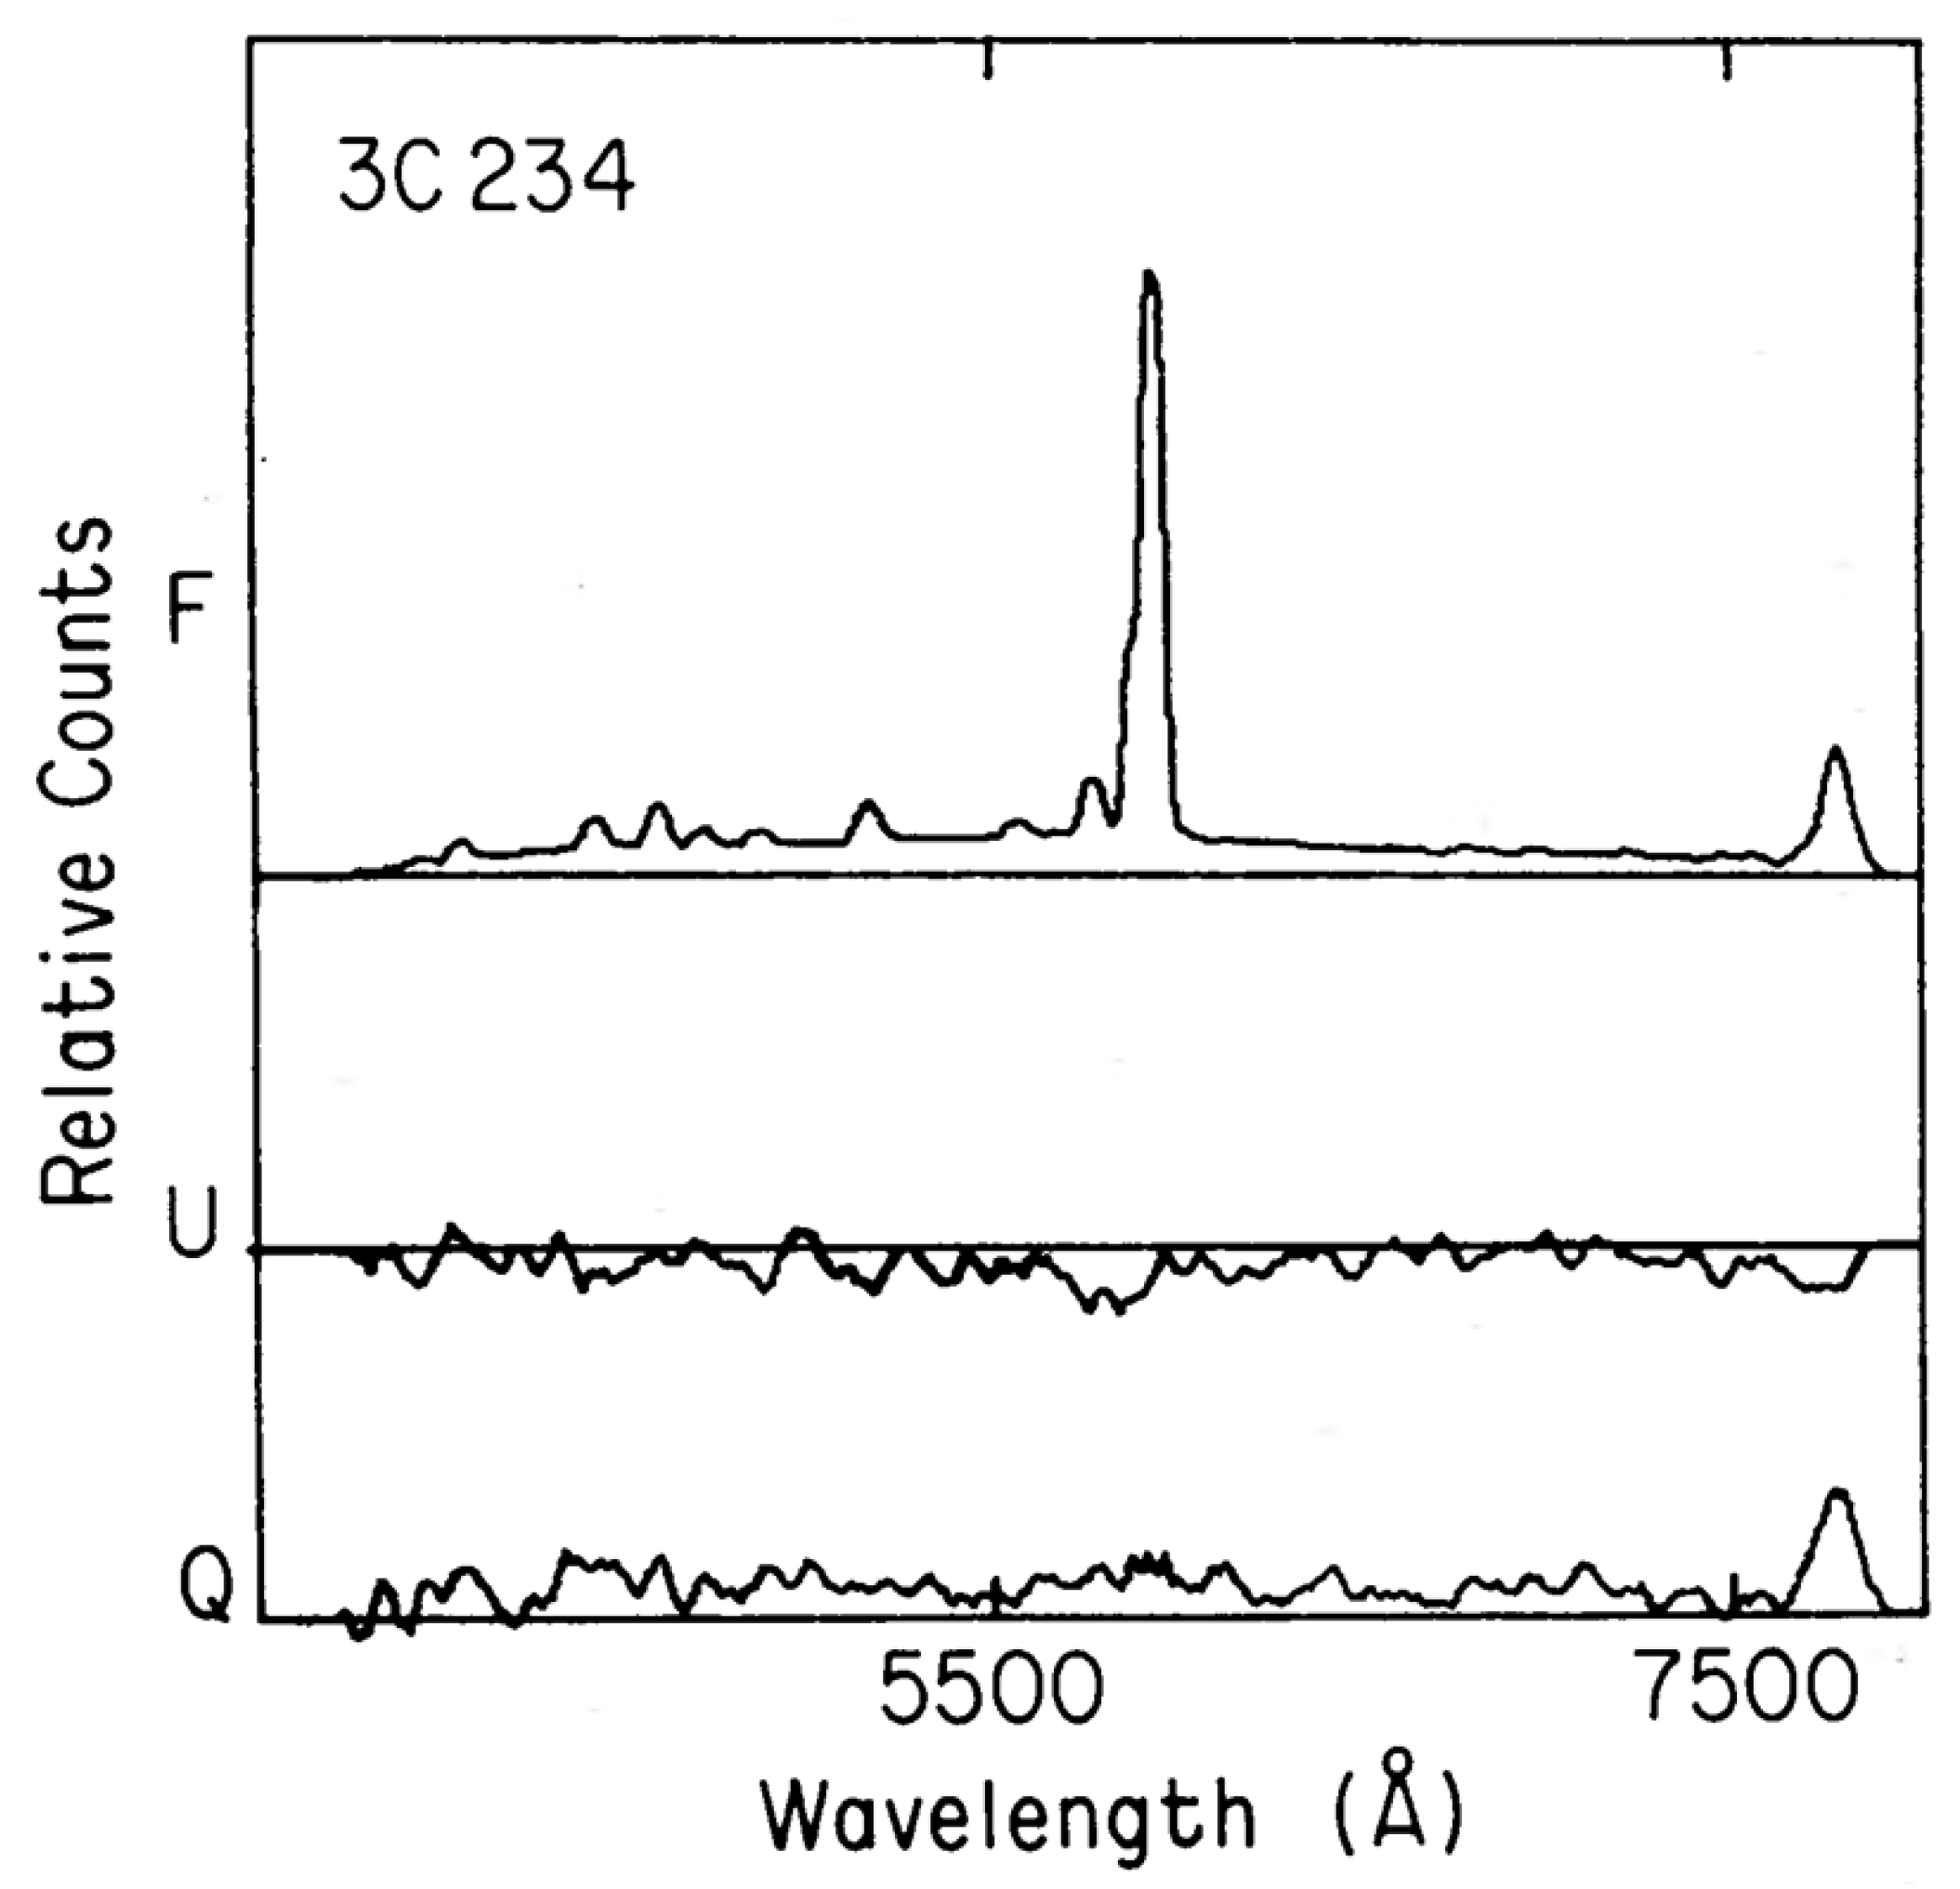
At home, I made the Figure 2, which shows the ordinary minus extraordinary ray, i.e., Stokes Q, then the same for U. As a reminder, this un-normalized Q is the flux at 0° (ordinary) minus that at 90° (extraordinary); U is the same, except that the 45° ray is compared to the 135° ray.
While the Stokes spectra have obviously been smoothed, it is very clear that the forbidden [O III] 5007 Å line hardly shows up in the difference spectrum, and as such is unpolarized. However, the H line behaves differently! It is highly polarized; accounting for unpolarized narrow components and starlight, the broad component polarization is a whopping ∼20%.
Because emission lines are only intrinsically polarized in very special circumstances, I realized that this meant we were looking at a hidden broad line region (high density; permitted lines only) through a periscopic mirror!
In scattering polarization, physics tells us that the perpendicular to the position angle is the direction of the photon’s last flight before being scattered into the line of sight. Thus these photons could have escaped the hidden nucleus only if they were travelling parallel to the radio axis. Because line emission is intrinsically quite isotropic, it follows that the other directions, the equatorial directions, must be blocked; that is, an opaque equatorial structure must be hiding the Type 1 nucleus. A correlary is that astronomers in those regions of the universe with polar views of 3C234 believe it is a Type 1 object, a Broad-Line Radio Galaxy.
If this were to be generic, it would explain how radio galaxies could produce radio lobes without a visible central engine. Both spectral types do have the engine, and which type of object one sees is an accident.1
I may not know instrumentation, but I know about data and systematic errors. Our setup symmetrized everything in time with respect to light paths, modulating at about 1 Hz, and the data from that instrument were clean. Furthermore we were meticulous about correcting for dichroic interstellar polarization contamination.
I gathered clues about the wide applicability of the 3C234 scenario. While the spectropolarimetry paper did not come out until 1984, I had published a short paper in Nature asserting the existence of a class of radio galaxies with high perpendicular polarization two years earlier in 1982 [7]. I reported a parallel class related to the radio quasars in Stockman et al.(1979) [5], and the following year I did the same for Seyferts. In the Seyfert case, the competition missed the parallel and perpendicular polarization alignment groups, as they combined Types 1 and 2 and took insufficient care with spurious signals due to interstellar polarization. In fact, I only used their published data to find the alignments; I just analyzed it more carefully.
The geometry thus described “unified” the broad-line (Type 1) and narrow-line (Type 2) objects, both radio-loud and radio-quiet (the language is unhelpful here, as the broad line-objects actually have the narrow component as well). The term “unified” was used very specifically; we asserted that if we changed our viewing angle relative to the AGN axis, the appearance and classification would change as well. Thus, there may only be one physical class to try to understand. The Broad-Line or Type 1 radio galaxies can be considered simply as low luminosity radio quasars; today, the community recognizes that even powerful quasars are often observed in the Type 2 orientation. We did not use the term “obscuring torus”, instead using “thick disk” in order to avoid any implication regarding the outer boundary of the structure, or for that matter of any particular physics at all. However, I have fallen into the common usage of “torus” here. Keep in mind that the AGN torus is defined as the structure that blocks photons from the nucleus which are emitted in the equatorial directions based on the radio axes, and nothing else at all. The torus-like shadowing can be realized by a variety of physical and kinematical models. The term is used loosely in the literature, at times leading to imaginary paradoxes.
2.3. NGC1068, the Radio Quiet Prototype—Why It Is Good to Know Nothing
We turn our attention now to radio-quiet AGNs. We discovered the nature of the prototypical radio-quiet Type 2 NGC1068 in two steps. This was necessary because certain properties made the interpretation less obvious than for 3C234, though in retrospect the differences were very superficial. While smarter astronomers would not have been confused by this, alas, the task fell to us. In step 1, published in 1983, we showed that the very strong host contribution caused the percent polarization to be very low in the optical, with a lot of structure. The sharp rise towards the UV2 simply resulted from the dilution of nuclear light by an old stellar population.
Correcting for the effects of the host produced a quasi-power law nuclear spectrum with constant 16% polarization. A very similar result was shown soon afterwards by McLean et al. (1983) [8]. I was fixated on one tiny bump in the percent polarization in the uncorrected P spectrum, just redward of H, that could not be explained by the “upside-down” stellar absorption lines or by dilution due to low-polarization narrow emission lines. It was clearly present in the McLean et al. data as well, though they did not mention it and concluded that the whole polarized continuum was due to synchrotron emission. In our 1983 paper, we mentioned the possibility but hedged and favored Thomson scattering. Just as we had found a big telescope by using our little one in series, we did the same with our brains, and published the polarized flux showing the Seyfert 1 only in 1985.
In almost all cases, huge host contamination makes life harder; however, this was an exception. The excess in the bump in the UN-corrected percent polarization spectrum is due to a redshifted broad and highly polarized H line component. It only showed up in the uncorrected P spectrum, because it reduced the starlight fraction at that wavelength. After starlight correction, this scattered broad H has the same polarization as the nuclear continuum, and is entirely invisible; indeed one might assume the p is due to synchrotron radiation. Why was this “phantom” feature only conspicuous on the red side of narrow H? Because the scattered line is redshifted by the moving mirror effect. The mirror gas must be moving away from the nucleus at about 400 km/s, while the narrow line peaks are blueshifted by km/s relative to the systemic redshift.
Thus: (1) look at your data carefully in every form you can think of, and (2) never get tired of staring at each bump and wiggle until you understand it.
When one looks through a cosmic mirror with polarimetry, the question arises as to the nature of the scatterers. The practical possibilities are dust grains and free electrons. In a sense, the former has greater plausibility because “dust has orders of magnitude higher cross-section than electrons, per gm of diffuse matter.” Fortunately, I was not so steeped in this folklore, which is somewhat dubious anyway. It says that in fully ionized gas with a normal complement of standard Milky Way grains, dust would greatly dominate the scattering in the optical/UV region. However, that is not a common situation; in hot or strongly irradiated media the dust is absent, and the mirror in NGC1068 is like that. Without going into all the arguments, I simply note that scattering by a mix of grain sizes like that in our Galactic disk scatters short wavelengths much more efficiently than long wavelengths, and can introduce albedo features as well, especially in the Å region.
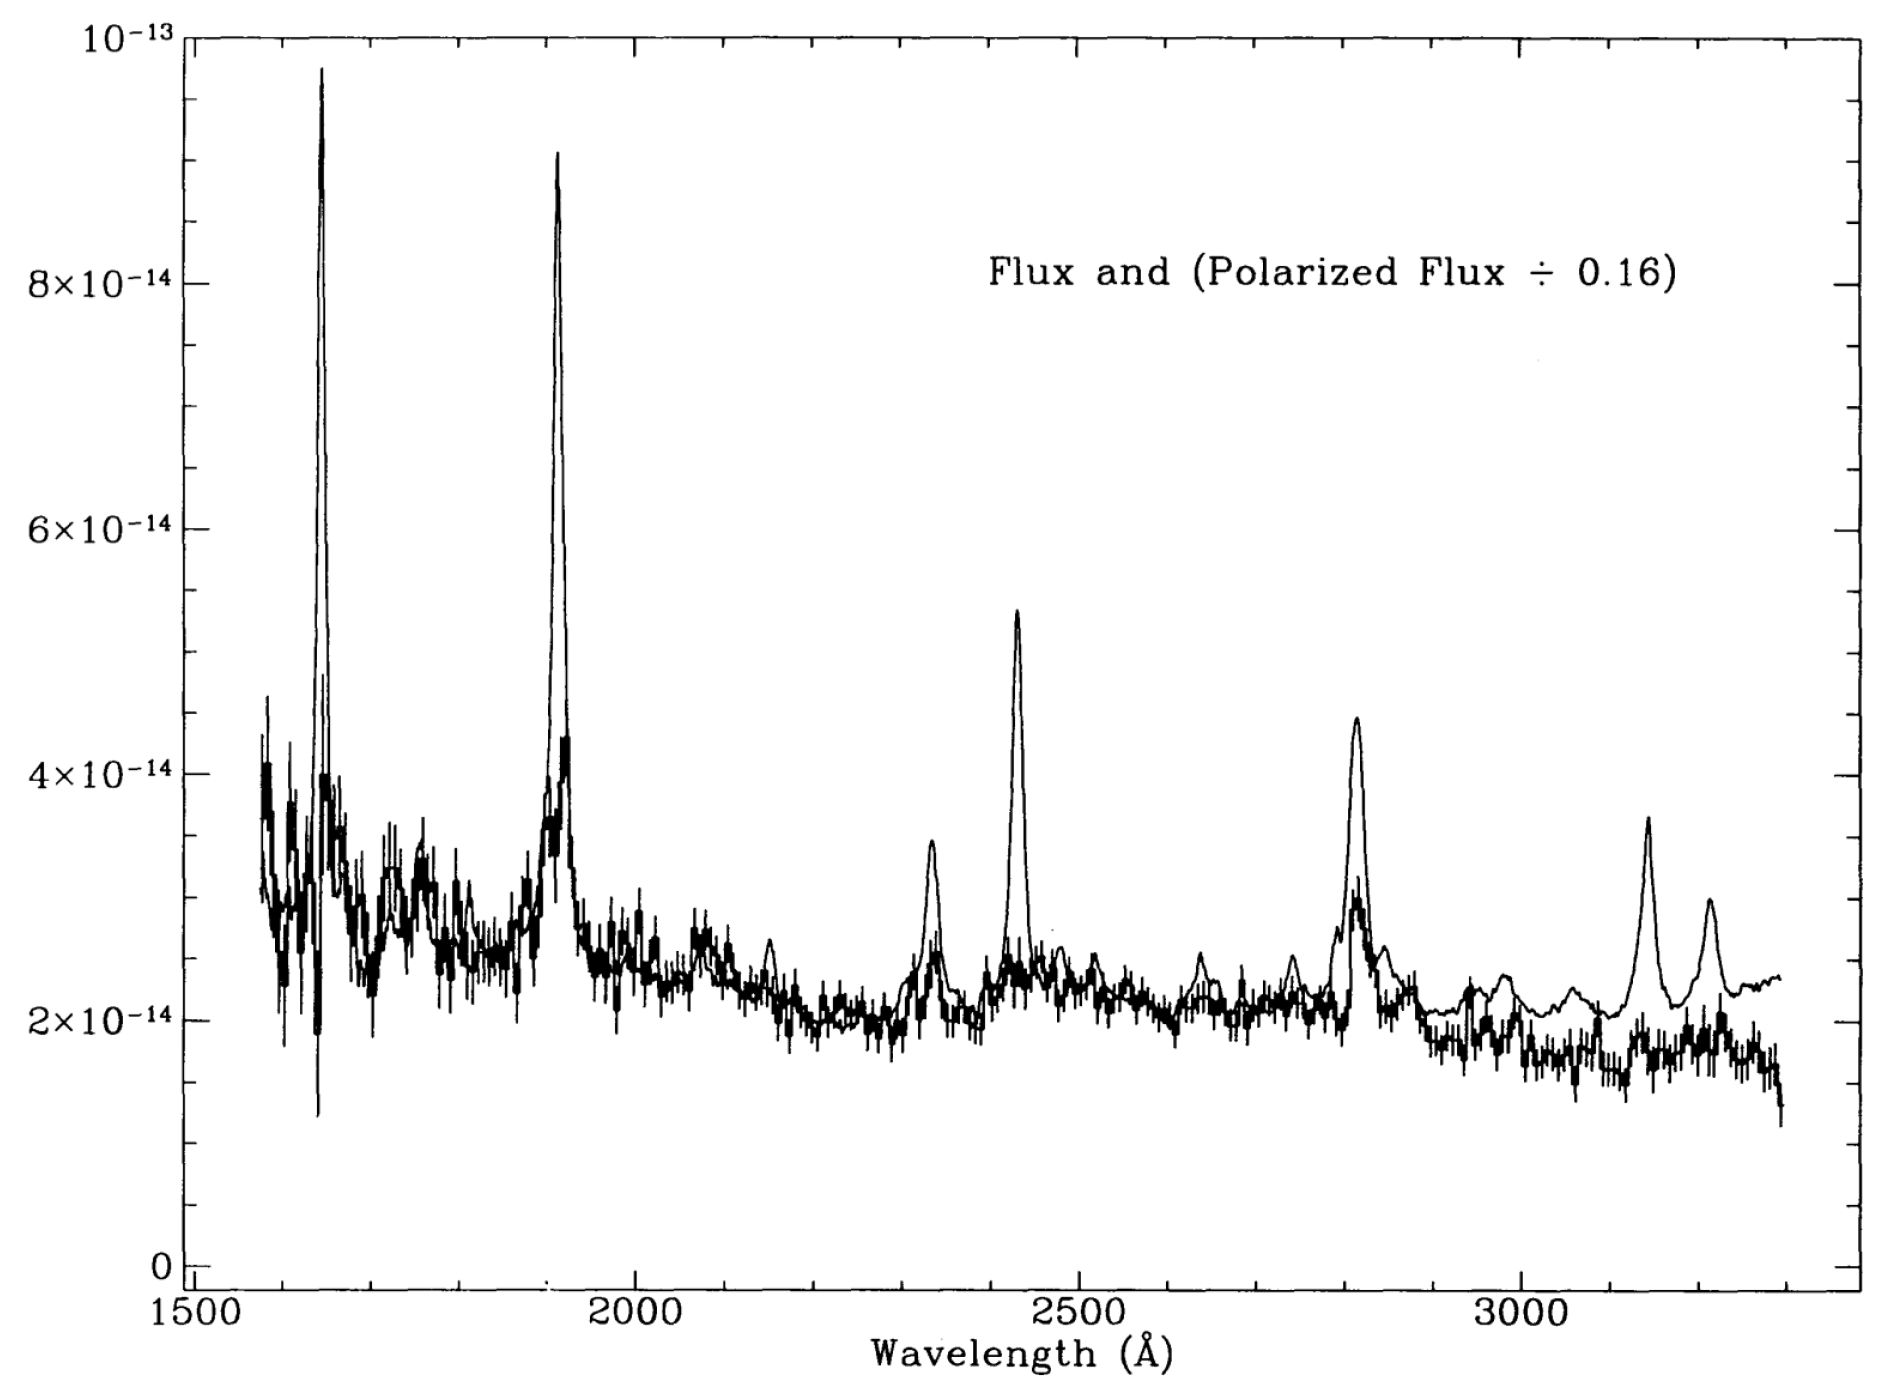
In NGC1068, all the evidence favors Thomson scattering in the central hundred pc, as we found in Miller and Antonucci (1983) [9] and Antonucci and Miller (1985) [10]. The former paper shows that while the observed percent polarization is low in the optical in ground-based apertures and rising steeply into the UV, careful correction of the effects of the unpolarized host galaxy leads to a nuclear continuum with wavelength-independent P at a much higher value, namely, 16%. We must have done a fantastic job of correcting the optical light for host starlight, because HST observations in the UV past the starlight show exactly this behavior (Figure 3). Note the overlay of the polarized UV flux divided by 0.16, and the total flux [10], on top of the measured UV polarized flux. The match is perfect, even without any normalization.
That is a signature of electron scattering, and in fact the polarized light looks exactly like a typical Type 1 with no shape changes. In science, however, one would prefer to prove things at least ten ways, and other strong arguments can be brought to bear. As suggested by the “proof” of beaming unification below, a direct argument is better than a consistency check. We suggested electron scattering for NGC1068, which raised a flag for another reason. This process normally dominates the opacity only at very high temperatures, with “normally” here referring to the common case of collisional ionization equilibrium. However, we knew that the putative scattering electrons could not be very hot, or they would scatter-broaden any emission lines beyond recognition. We set a very conservative upper limit on their temperature of a million degrees, though even a hundred thousand would have been justified.
Krolik and Kallman (1987) [11] then showed that the electron temperature could be low enough to fit the data, though only if the mirror gas were highly photoionized. The same was concluded in Miller et al. (1991) [12], thanks to the wonderful late Bill Mathews. In the 1987 case, the authors said that there must be an enormous ∼keV equivalent-width Fe K line, the energy of which would indicate extremely high ionization. This was a very dramatic prediction, as nothing like that had ever been seen before. Conversely, they pointed out that if that prediction came true, then the gas producing the Fe lines would necessarily have significant Thomson scattering optical depth! Their predicted line strength was later raised further by Dave Band et al. (1990) [13], who added the contribution of resonant scattering. The prediction was gloriously confirmed by subsequent X-ray observations. Even better, in a landmark paper by Ogle et al. (2003) [14], observations and analysis were presented from the Chandra CCD spectrometer; the high spatial and spectral resolution resolved the X-ray narrow-line region very well. Detailed analysis showed that the emitting clouds indeed must have about the anticipated product of Thomson depth and solid angle. Best of all, by their energy width the radiative recombination continua directly indicated that the electron temperature was quite consistent (i.e., as low as) that required by the data.
After I left Santa Cruz, Miller and Bob Goodrich performed some very elegant and important observations, written up with a big assist by theorist Bill Mathews. The broad-line profile in polarized flux from the nucleus must be a convolution of the intrinsic one and the electron thermal velocity distribution, and we did not know how big an effect the latter factor was; that is, we did not know whether our mirror was hot or cold. Thus, Joe and Bob decided to look at the nucleus as scattered by dust clouds a few hundred pc away. They knew dust scattering would reveal the true line profile. They succeeded in measuring it from three different off-nuclear dust clouds. The line was clearly narrower, as expected, and the polarized flux was much bluer than from the region where we identified electron scattering! Their amazing paper [12] is called “Multidirectional Views of the Active Nucleus of NGC1068”.3
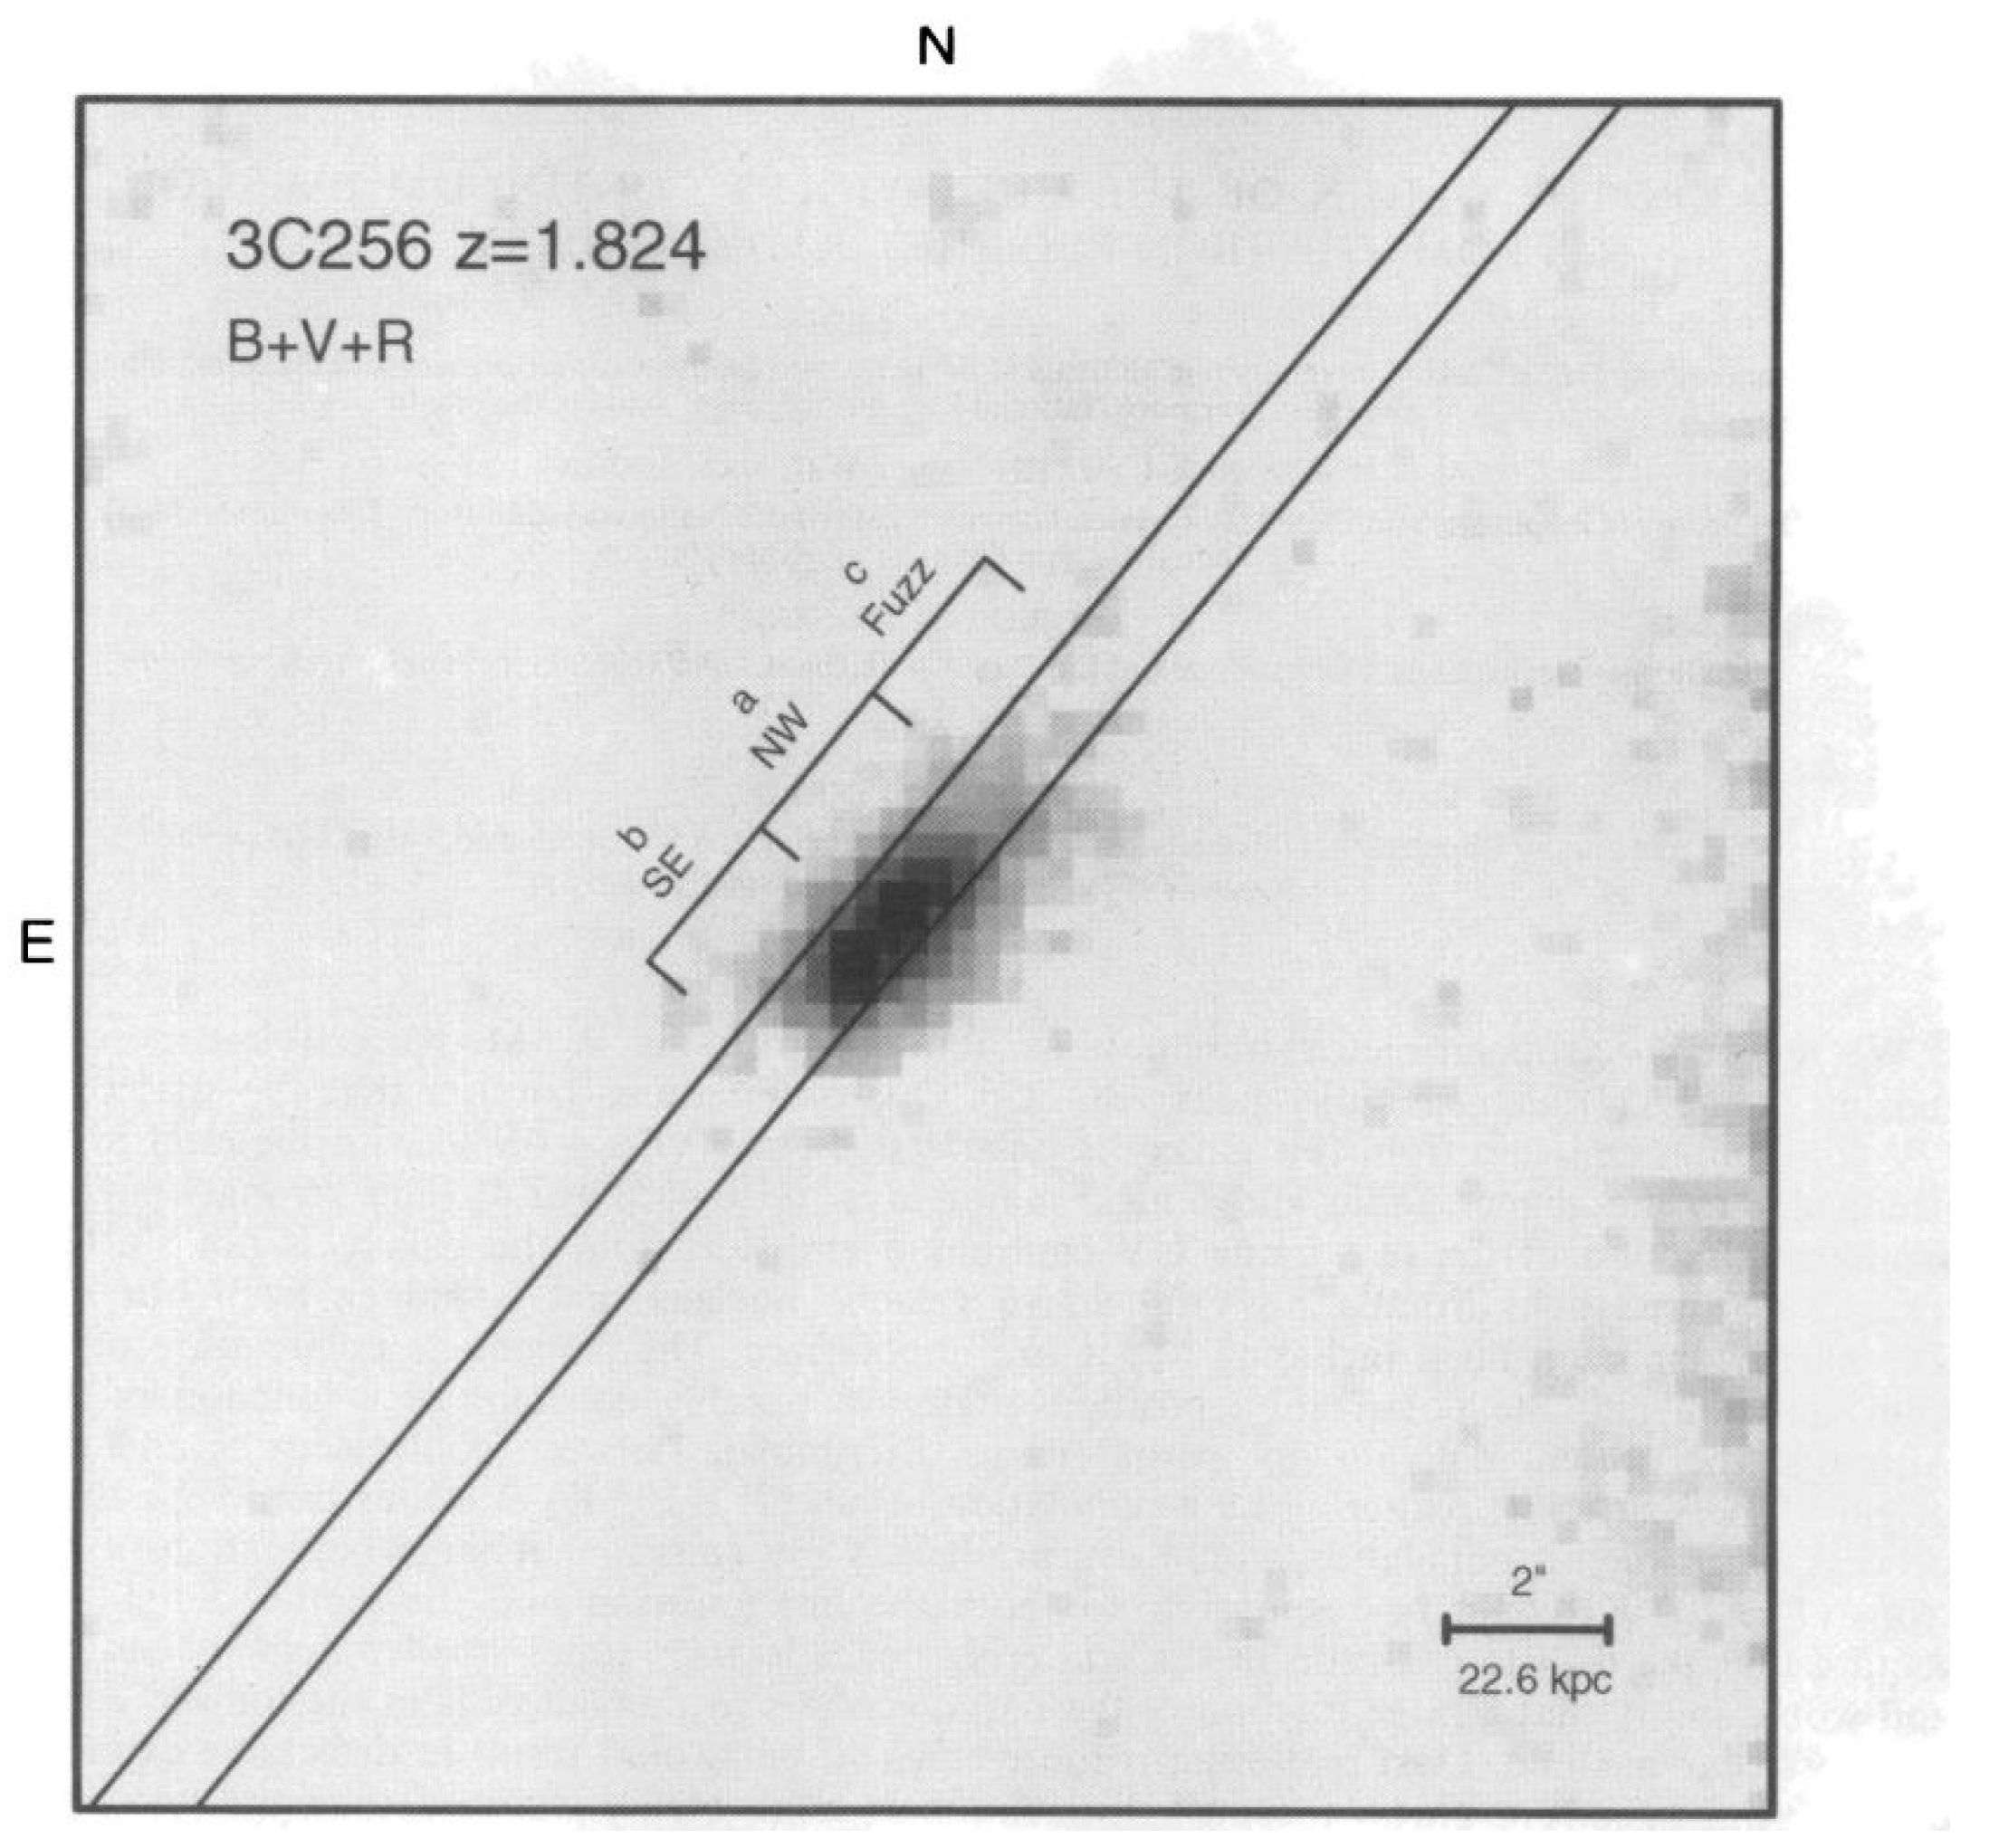
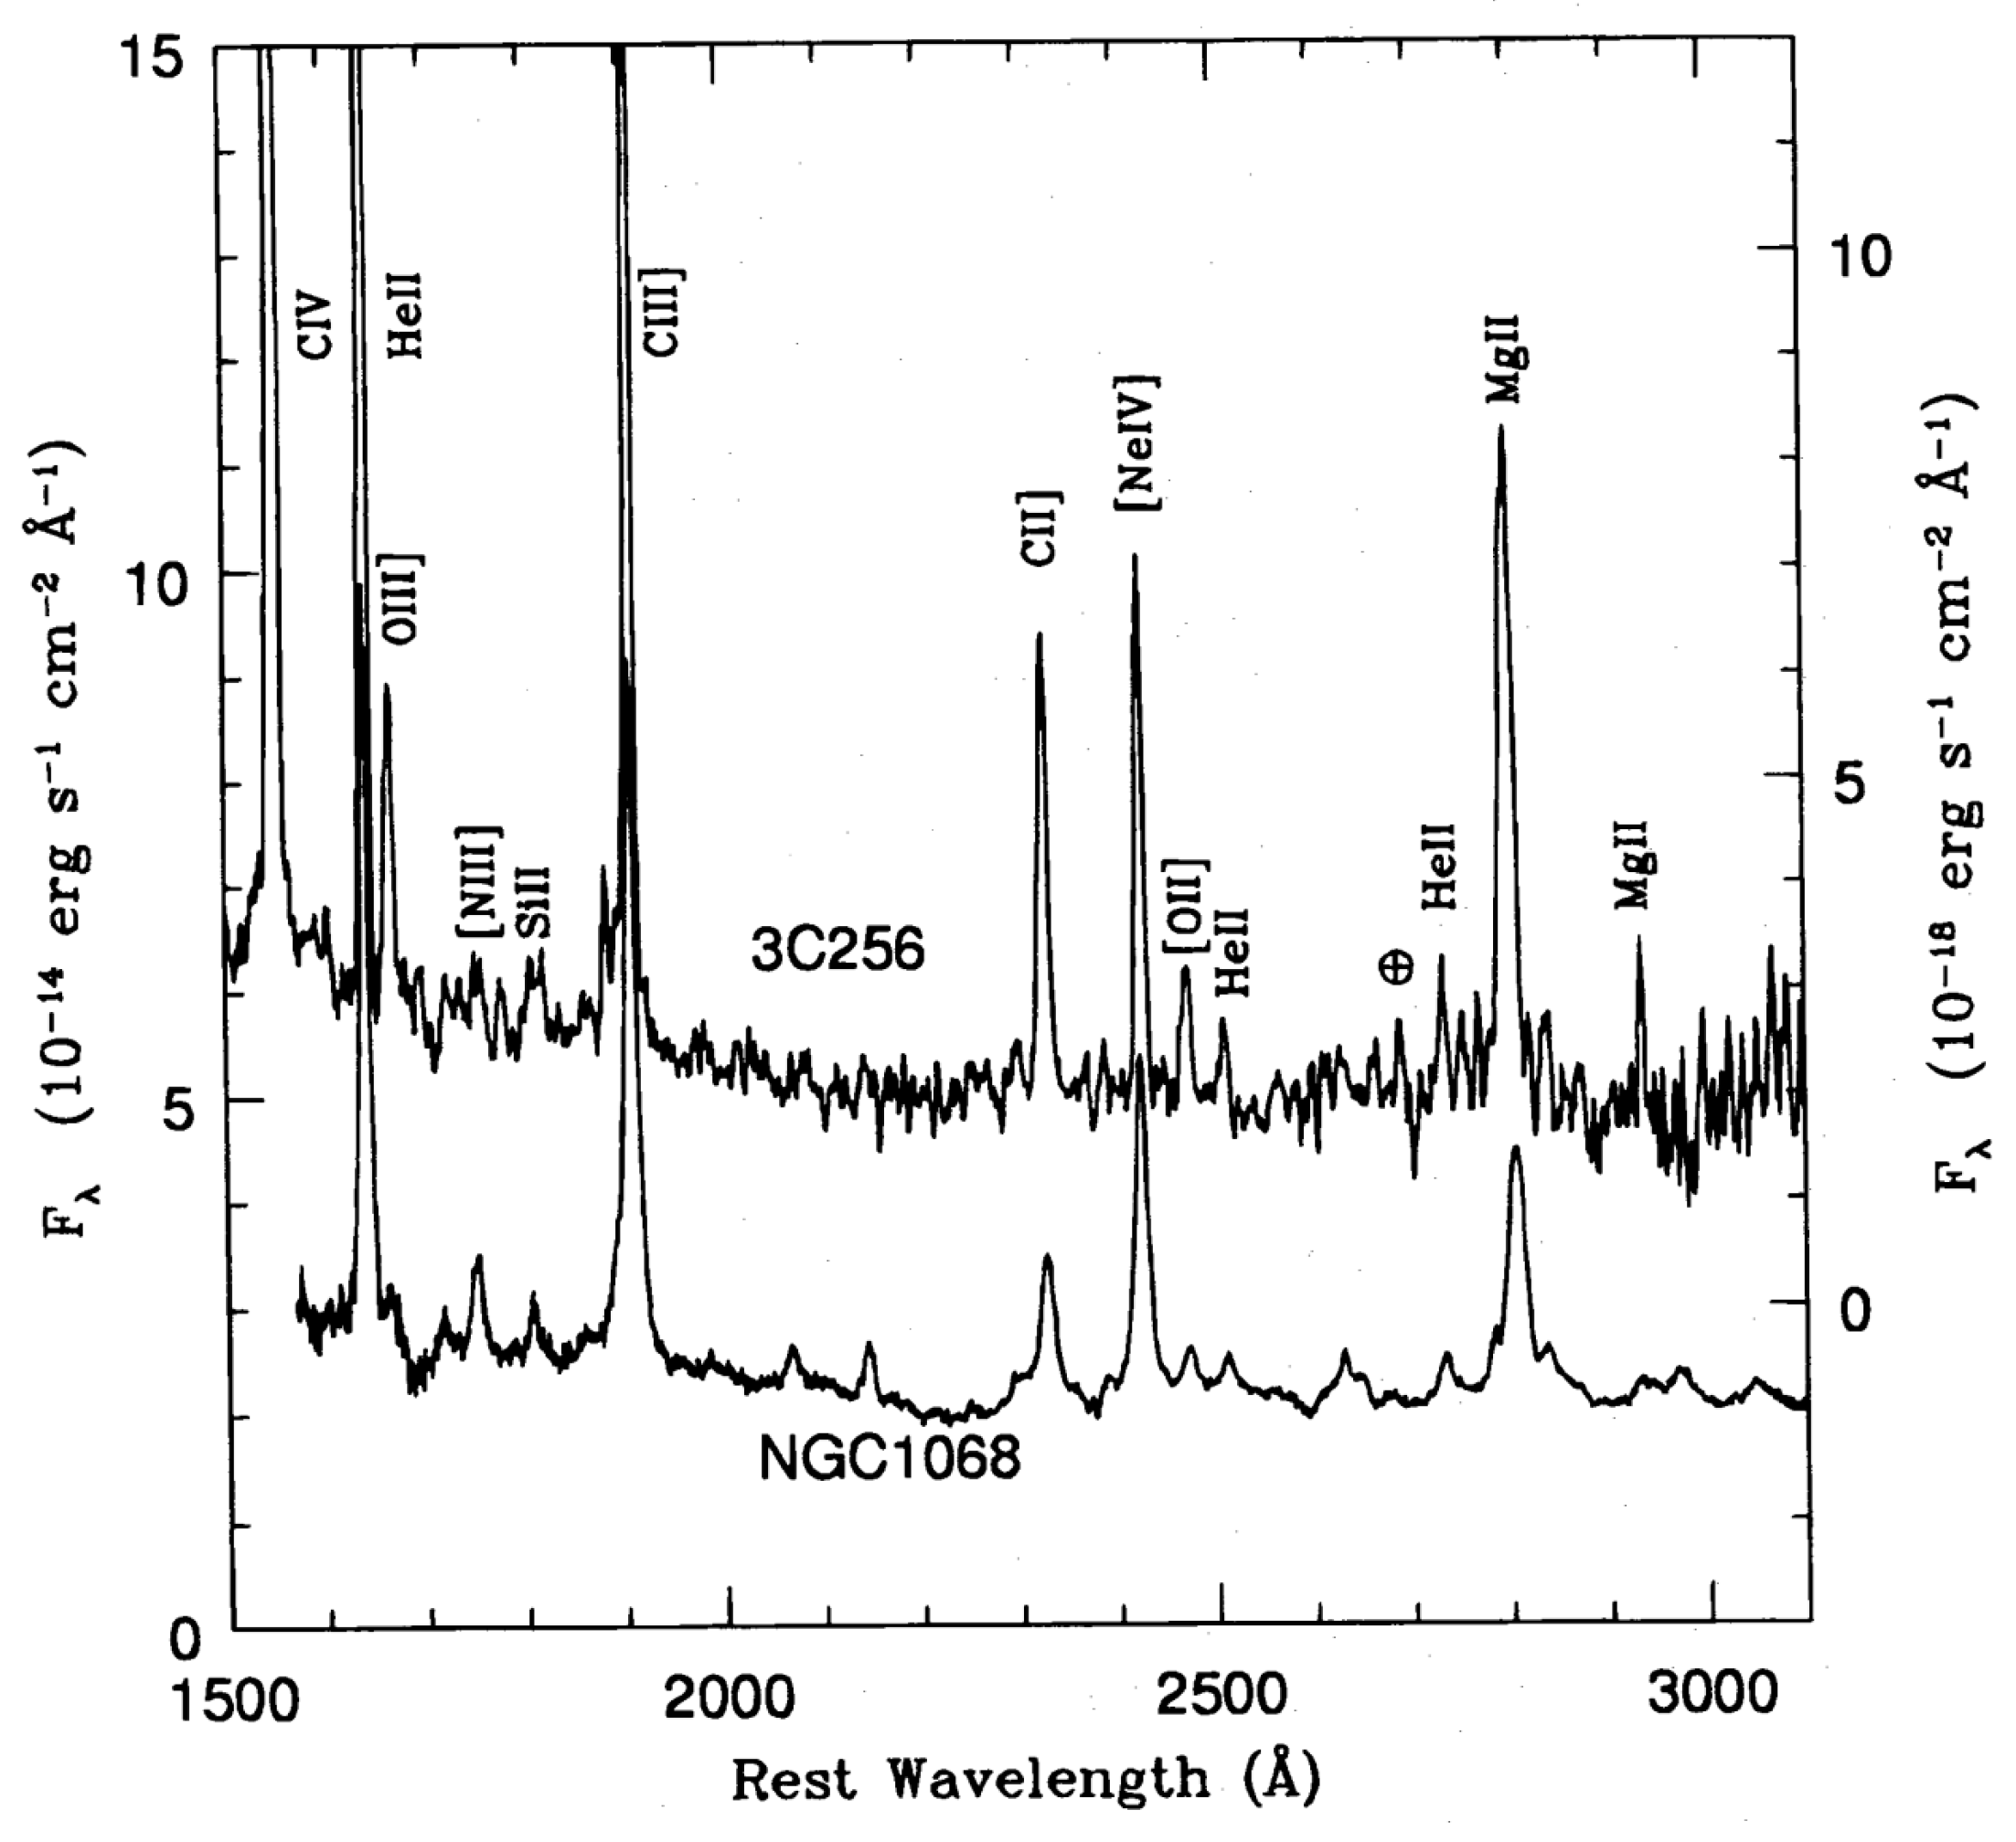
While the electron-scattering mirror in NGC1068 is interesting and exotic, much more amazing is that at least some mirrors associated with powerful radio galaxies at 1 < ~z < ~4 behave indistinguishably (see Figure 4 for an optical image). Figure 5 shows a near-perfect match between 3C256 and NGC1068; not shown in the figure is the Type 1 nucleus of NGC4151, which is crucially indistinguishable from either of them. In the case of 3C256, the tiny electron scattering cross-section is consequential, as these mirrors are 10 s of kpc in size, and such a mirror needs to have an enormous mass on the order of M. It is especially interesting because we argue with regard to 3C256 (Dey et al., 1996 [15]) that the enormous mass of baryons is too cool for hydrostatic support. There is no rotational support either; thus, one wonders whether all the mass is undergoing a kind of monolithic collapse. Notably, this galaxy differs from the other “alignment-effect” radio galaxies in lacking a massive old stellar population. The leaders of this excited series of papers were A Cimatti and A Dey; it was initiated by W van Breugel.
If I had been more sophisticated, I would have discounted electron scattering in both NGC1068 and 3C256.
3. Unification of Radio-Loud AGNs by Relativistic Beaming
In this section: how the Spectral Unified Model saved the Beaming Unified Model and then the two lived happily ever after, with two “proofs”.
3.1. Self-Calibration, Diffuse Emission, and “Proof” of Unification by Relativistic Beaming
When I was starting out in the 1970s, one of the many attractions in the field of AGN was superluminal motion. In low-frequency radio surveys of the sky, most of the extragalactic objects found turn out to be giant kpc double-lobed sources. Their steep radio spectra reflect the optically thin synchrotron emission from the lobes.
A few, however, are quite different, only showing point sources on the arc-second resolution maps of the day. These tiny, very bright little guys show flat spectrum (self-absorbed) synchrotron emission, inviting examination via VLBI networks. Typically, this reveals a stationary core and a string of dots on one side. Shockingly, re-observation a year later (say) in the rest frame revealed that the dots had apparently moved transversely outward by perhaps ten light years; often, a new dot was seen near the core.
Such behavior is reproducible without actual superluminal space motion in a special geometry; the dots have to be traveling along a line pointing nearly, though not exactly, at the Earth, and doing so at ∼0.99 c. The effect has nothing to do with relativity; it is simply that the light travel time of the dots for the second epoch is almost a year less, and as such the activity seems to be speeded up.
This hypothesis seemed extravagant to some, particularly because none of these “blazars” could be interpreted as highly misaligned objects, which would be seen to move much more slowly. Blandford and Rees (1978) [17] explained4 that the misaligned sources would appear much fainter (which is partly special relativity), and in fact were identical to the tiny pc-scale relatively faint cores of the giant doubles. After all, something must be feeding plasma and energy into those powerful lobes. In the early days, the jets (feeding tubes) could not be clearly seen in the images.
One can see that in this case the superluminals would have giant lobes as well, one perhaps projected on the other. When radio astronomers rudely pointed out (e.g., after Blandford spoke at the famous Pittsburgh meeting in 1978) that this was manifestly not the case, the theorists replied: get some dynamic range!
According to special relativity, the jets pointed at us are greatly boosted in flux, neatly accounting for their very high incidence at high flux levels. Because interferometer maps of the day were severely limited in terms of dynamic range, it was quite possible that rather bright lobes were present on arcsecond scales in association with the pc-scale blazar cores. They could have been lost in the poorly subtracted sidelobes of the greatly boosted compact jets. The boost can be very high, as special relativistic aberration directs the radiation into a solid angle on the order of the inverse square of the bulk gamma factor of ten or thereabouts; moreover, that factor (actually the similarly-valued Doppler factor) comes in two more times, via the photon arrival rate and the photon kinematic blueshift.
The low dynamic range was mostly the result of the ever-changing air column densities over, for example, the 27 VLA dishes. This introduced 54 scalar functions of time for the effects on amplitudes and (especially) the phase delays over each dish. Radio astronomers are by far the champions at mustering the fortitude required to address data systematics with sophisticated software.5
It sounds bad that there are ∼54 unknown scalar functions required to correct for the effect of the ever-changing atmospheric columns above each VLA dish. However, the total number of measured complex fringe visibilities (baselines) is on the order of per integration record, not . This confers massive redundancy, which can be exploited in favorable cases. The self-calibration algorithm was very rapidly being developed around 1980, and largely eliminated the dynamic range limitation. Several groups began to look for diffuse emission associated with the superluminals, including a major effort by myself and J. Ulvestad. We observed or reprocessed data on all the blazars6 known at this time, generally detecting the expected diffuse emission. With strong arguments, we convinced a lot of people of this Beaming Unified Model. An important part of our paper was citing and debunking the various counter-arguments in the air at the time, an essential step shamefully and consistently skipped by generations of accretion disk proponents, as we will see below.
As an aside, it is fortunate that this self-calibration algorithm is a highly iterative process, as it greatly prolonged the pleasure of discovering the diffuse emission in each source. You have all sat in the optometrist’s chair while s/he interrogated you with questions such as: “Now which is clearer…image A…? …or B…?” while slipping in or out, say, a quarter of a diopter of correction.
The first several iterations of the self-calibration map of very highly point source-dominated objects show you nothing except that point source. If you do reduce such data, be careful, because this program wants to please you. You start with a point source model and the program tweaks the phases to give it back to you. If you are not careful, it will simply erase all the diffuse emissions, thinking that is what you want. Truly, interferometry is an art, and the optimal operation of these powerful complex nonlinear algorithms differs depending on everything from the source structure, to the Fourier components sampled, to the phase stability over the antennas as a function of separation, etc. It is a wonder it works at all. The only near-certainty is that some SNR is needed on every baseline time record, or the result will be garbage. Yet, vast experience speaks to the consistency and fidelity of the results in most cases, as long as a skillful astronomer is piloting the algorithm.
I previously had begun to boast above about my 1985 paper with Ulvestad. I recently had occasion to re-read that paper carefully, and felt a mixture of pride together with the certain knowledge that forty more years of practice have not made me a better astronomer.
Apart from general consistency of the detected diffuse emission matching expectations for projected double lobes, we claimed we could prove that the Beaming Unification idea is true. Our proof convinced at least the present writer. You might say I underwent a religious conversion, and have never since doubted its qualitative correctness.
We said that our proof has two axioms. First, the fluxes from the superluminal cores are in fact greatly boosted in our direction. This largely follows from special relativity and the linear superluminal VLBI sources, and few wanted to give up that axiom. The second was that the diffuse emission we detected was not highly directional. Most people were fine with that axiom as well. Optically thin synchrotron emission from a multi-zone source is not intrinsically highly anisotropic. It would be hard to imagine such giant diffuse clouds moving at near light speed, and often the diffuse emission is two-sided. It hardly seems that both diffuse components would be moving so relativistically in the same direction.
In most cases the diffuse emission we detected was not extremely bright because, after all, the blazars were picked up mostly from their core flux. However, several had sufficiently diffuse flux that the objects would have made it into our low-frequency flux-limited catalogs even without their bright cores.
It would make no sense for all such objects to be pointing very nearly towards Earth. A number on the order of a hundred times more would not be aimed so perfectly.7 Thus, for each object among the several referred to in the previous paragraph, there should be ∼100 intrinsically similar objects pointed away.
According to our two hypotheses, misdirected equivalents of these blazars with bright diffuse emission would have much weaker radio cores by Axiom 1; however, the second Axiom assures us that they would have the same diffuse flux and would have been included in the catalog anyway.
All such misdirected blazar equivalents are in the catalog, so let us look at what they could be. The entire 3C list, for example, only has around 500 sources, and many are Galactic objects. The other entries are, simplifying slightly, none other than the giant double quasars and radio galaxies! In fact, we said “many or most” of the others would have to be misdirected blazars.
All was not quite well in radio-astronomer-land however, as we shall see.
3.2. The Great Depolarization Asymmetry! Another Proof of Beaming, but Be Careful What You Wish for; Trouble with the Cosmological Principle; Peter Barthel Feels Uncomfortable
Or, how the spectral Unified Model had to save the Beaming Unified Model, and the two lived happily ever after. This is a story I told in Antonucci 2012 [6], and it would be pointless to rewrite it here.
Peter Barthel worked mostly on VLBI observations of superluminal sources in the 1980s, and he knew well that the beam model explained many properties such as superluminal motions and jet sidedness qualitatively. However, he was (according to the title of his rumination for a conference [19]) “Feeling Uncomfortable” because one had to assume that a paradoxically large fraction of these sources in quasar samples have jet axes fortuitously close to the line of sight.8 A couple years layer, after a short trip to Damascus, Barthel wrote a famous paper (Barthel, 1989 [20]) entitled “Are All Quasars Beamed?” suggesting that those quasars with axes that lie near the sky plane somehow fall out of quasar samples, and (inspired by the spectropolarimetry) in fact are classified as radio galaxies.
The general idea of beaming to explain superluminal motions and one-sided jets was accepted by most doubters as a result of two key back-to-back discovery papers in Nature reporting on the so-called Lobe Depolarization Asymmetry: Laing (1988) [21] and Garrington et al. (1988) [22]. This was spectacular and inspired work. The wonderful astronomer and human being Peter Scheuer (1987) [23] described it in a section of a (basically unavailable) conference paper called “Why Relativistic Beaming is True”; we would know a lot more about radio sources today if Peter had been granted a reasonable time on Earth.
Giant double radio quasars are rather similar to giant double radio galaxies, although there are differences. Quasars tend to show one-sided fairly bright arcsecond-scale (>kpc) jets. Radio galaxy jets are hard to see, and when they are detected they are more similar in flux on the two sides. Both the Laing (1988) and Garrington et al. (1988) papers studied samples of double-lobed quasars.
An extremely clever person designed the VLA to work in scaled configurations. The standard radio bands are separated in terms of frequency by factors of three. The 27 antennas are laid out logarithmically along railroad tracks and periodically moved outward en masse by factors of three in terms of distance from the center. Thus, to make reliable images of spectral slopes or depolarization one can use (for example) the 20 cm band in the largest configuration (∼30 km) and compare the result to mapping at a frequency in the 6 cm band with a one-third scale array! Of course, with interferometry we just measure a finite sample of Fourier components of the image brightness distribution, and only these components inform what is seen in the image plane. With this plan, the maps at the two frequencies will be based on nearly the same Fourier components (the CLEAN algorithm tries to guess what the unmeasured components would have been.)
The following sounds implausible, not only because of the powerful result but because of various coincidences too weird to explain. These papers showed that in the 6 cm band observed with the more compact array configuration, in all cases (I think), both lobes were shown to be highly polarized.
Sit down for this, though. In all (or perhaps nearly all) cases the 20 cm images showed that only one lobe is highly polarized in each quasar. It was always on the “jetted” side, and the nearly inevitable interpretation was that this proves the jetted side to be in fact the near side (which is a commonplace now). It lies in the foreground of some polarization-angle scrambling medium, while the far side is almost completely depolarized due to Faraday rotation measure gradients within each synthesized beam (the angular resolution element). Aside from the breakthrough information, this suggests to me that the deity or deities possess a very jolly sense of humor to put the effect exactly in the accessible parameter space observed, and in virtually every case s/he/it/they designed the sources with the VLA in mind to delight only us on Terra. I cannot prove it, but I have heard that the former Astronomer Royal warned us that it would be really funny if nothing funny ever happened; however, there is a limit to my credulity.
To recap and blend in something else that delights me, there is a very strong tendency for one radio lobe in double-lobed radio quasars to be depolarized at low frequencies, say, the VLA A Configuration at 20 cm, by Faraday rotation within the observing beam; however, only on the sides of the (single-jet) sources which lack the jet (Laing 1988; Garrington et al., 1988) [21,22]. Most people have accepted that the depolarized lobe must be the more distant one, located behind a large-scale depolarizing magneto-ionic medium; thus, the polarized lobe is on the near side, meaning that the jet is on the near side as well, just as expected for the beam model.
Church bells rang out…but be careful what you wish for. The effect is much too strong. The first paper of the pair has this disclaimer: “The sources observed here must then be oriented within about 45° of the line of sight…to generate sufficient asymmetry in path length” to fit the depolarization data.9
Notably, neither these authors nor the referees asked themselves what happened to the quasars oriented close to the sky plane! They were apparently blissfully unaware that we knew from optical spectropolarimetry that the high-inclination “quasars” are simply masquerading as FR II radio galaxies, which would have dropped out of samples restricted to quasars, as explained by Barthel (1989) [20]. Barthel had read outside his field, and found our polarization papers. There are many mysteries in one’s field which simply cannot be resolved without reading outside it.
Finally, I add a few important implications of these results for normal galaxies and clusters. As I explained at the end of my 2012 review paper, there are many radio galaxies which look similar on large scales, of which only some have the hidden Type 1 nucleus. This can help us to separate the effects of the nuclear radiation on the host galaxy from that of the powerful expanding lobes. Also it seems to me that the beam depolarization can be resolved into rotation fluctuations, which would indicate the magnetic field topology in the volume-filling X-ray gas. Magnetization fluctuations strongly suppress conduction, and are key to modeling the hot gas.
4. The Peculiar AGN Nuclear Reddening Law
Using only hard data, special relativity, and the Copernican principle, we derived an extinction curve for radio quasars. We claim this to be the most robust determination of the law and mention a number of consequences, including the equally robust derived anisotropy as a function of wavelength throughout the electromagnetic spectrum. We need to reassess the broad Hydrogen line spectra as well, in particular the very large Balmer to Ly ratios. This type of extinction totally dominates that of most radio loud objects, and plays a major role in most quiet ones, although those often have more standard reddening from dust outside the nucleus as well.
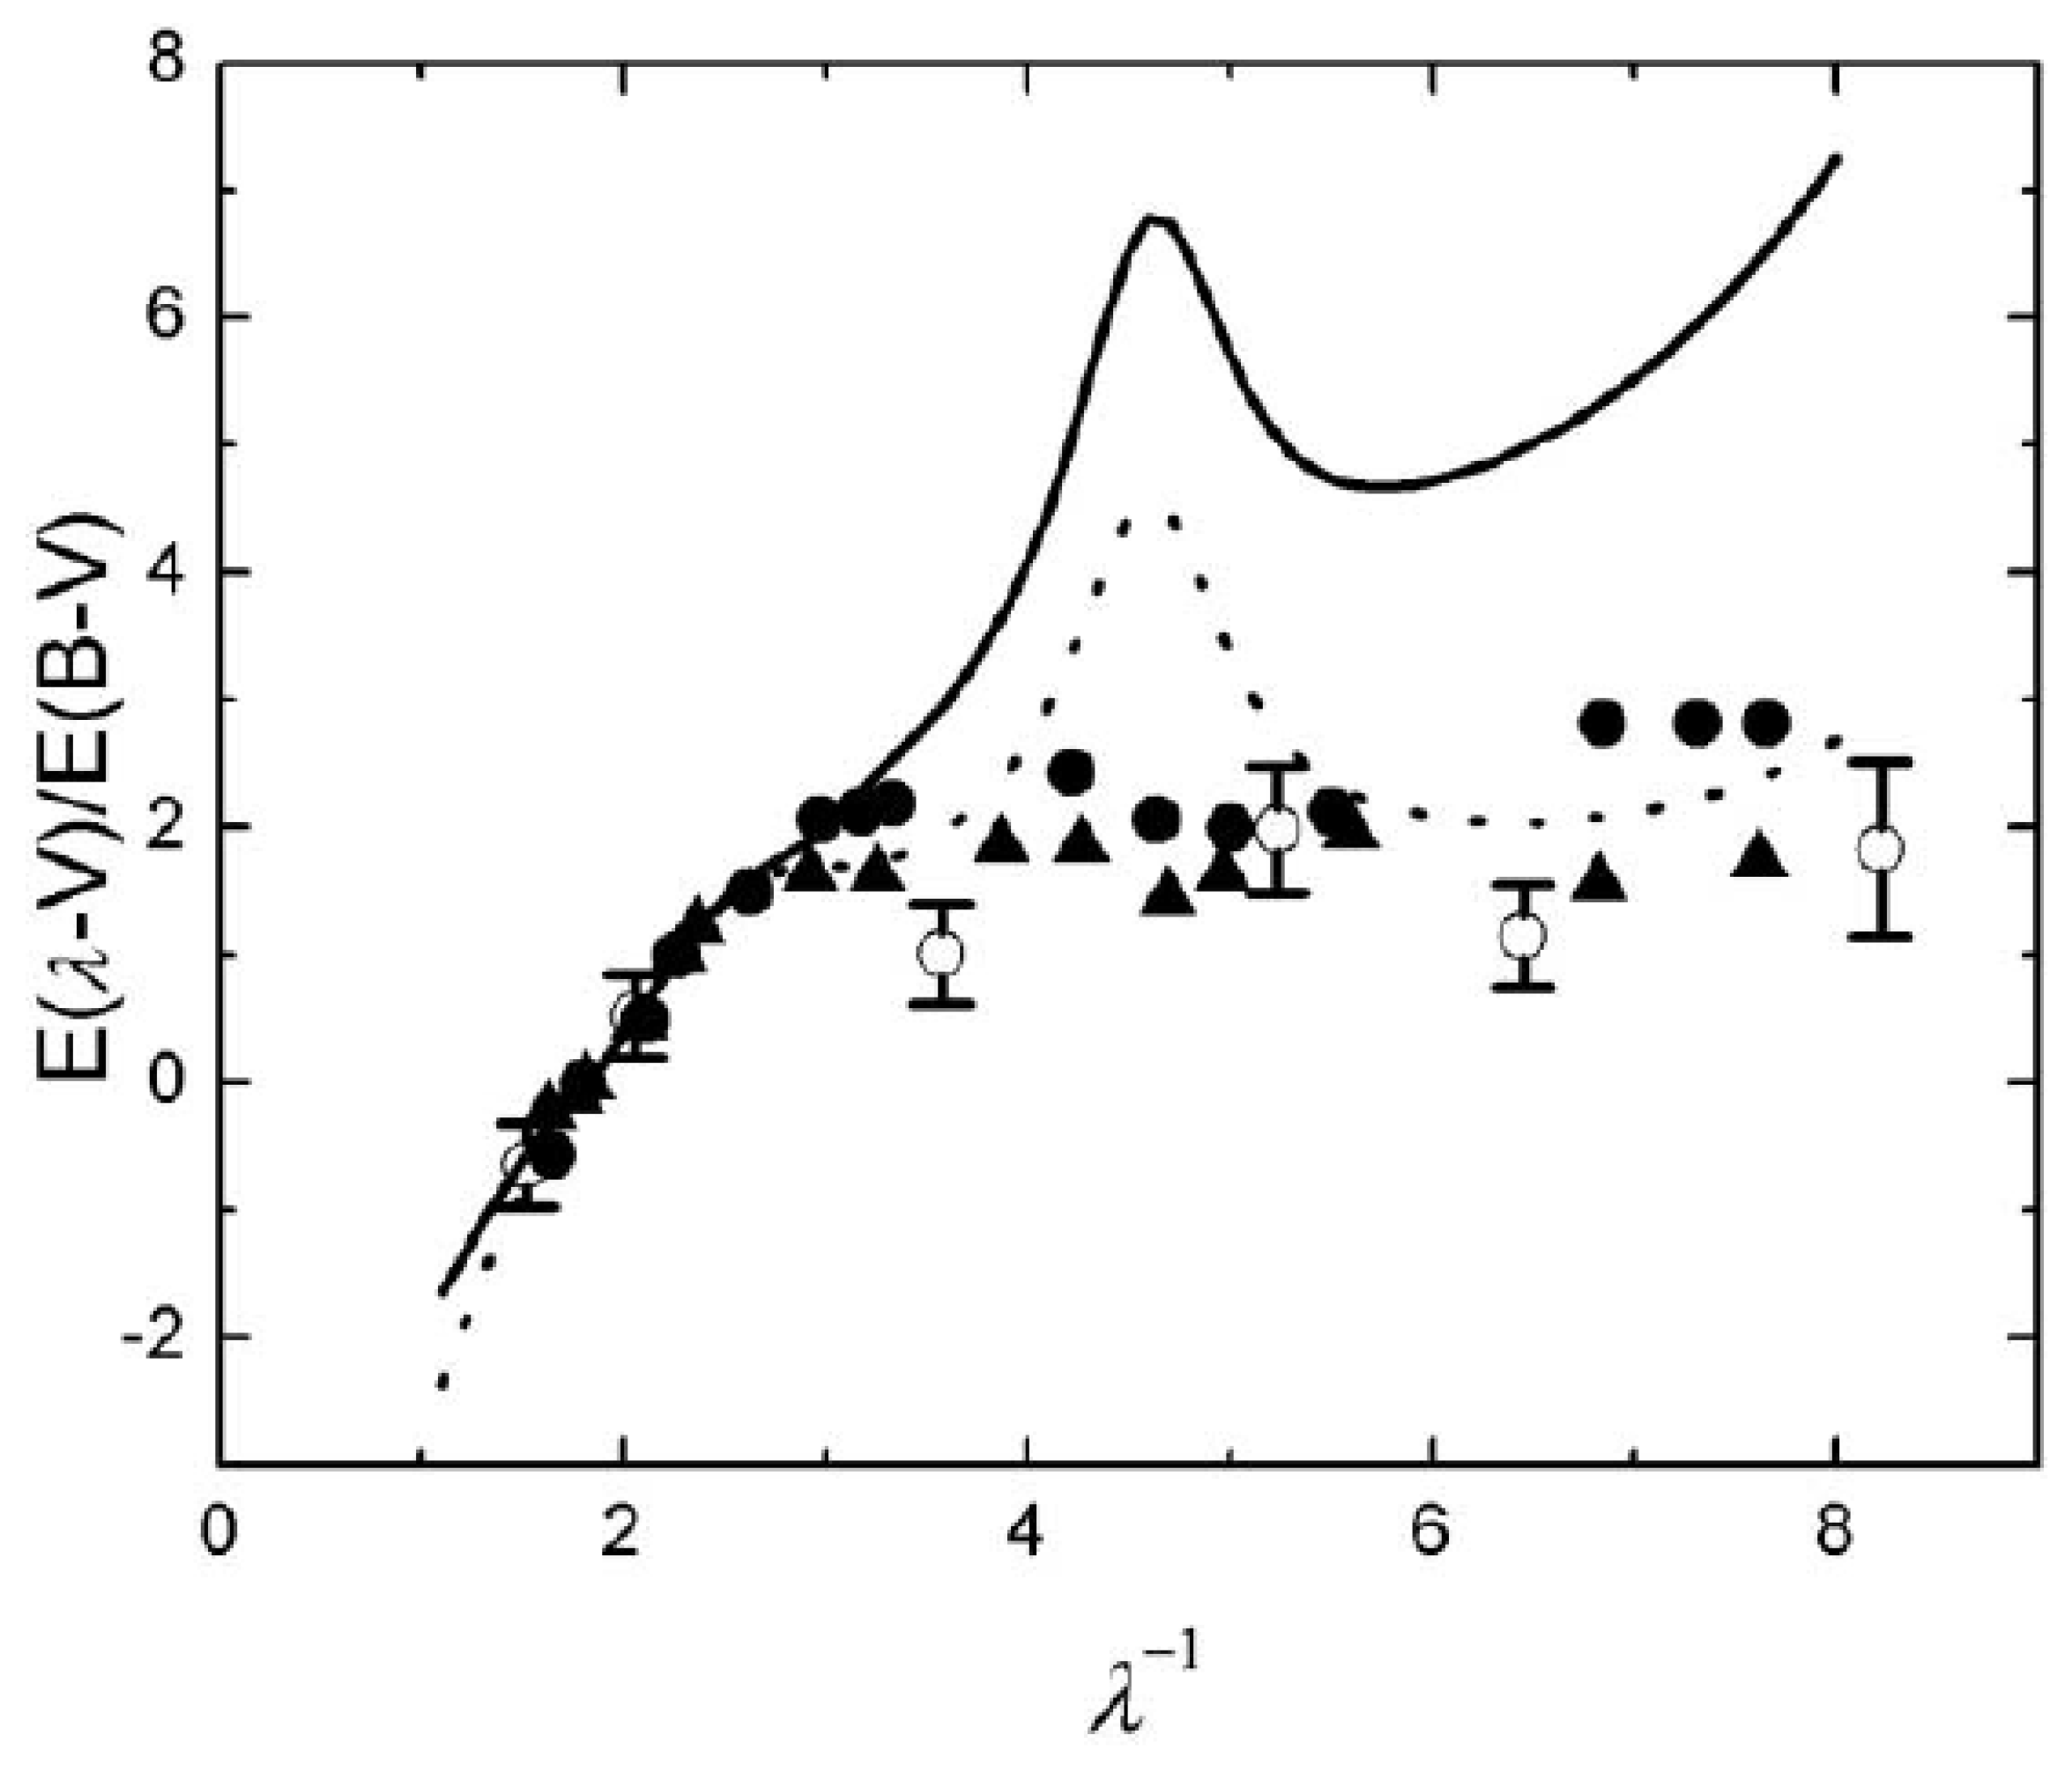
One can make a robust extinction curve by dividing the spectral energy distributions (SEDs ) of objects of different extinction if the comparison is between sources known to be intrinsically identical. This is the key feature of the curve from Gaskell et al. 2004 [24] and reproduced here as Figure 6. Though you need not believe our conclusion, I will specify the axioms that must be given up in that case.
In Gaskell et al. 2004 [24], we reported on a study which was so well-designed that its dramatic result depended logically only on hard data, special relativity, and the Copernican principle. We studied a complete lobe-selected quasar sample.10 The fluxes from the radio lobes are manifestly at least approximately isotropic. In this situation, aside from small statistical effects, if a giant reorients a member of the sample it will have the same lobe flux and necessarily look like another member of the sample. The power of this idea is additionally shown by the very strong conclusions reached for high-z 3Cs by Marin and Antonucci (2016) [26].
In the 2004 sample, there was of course a wide range in core dominance. Quasars with strong radio cores show linear superluminal jet up to the first order. Special relativity says that the fluxes from such cores are highly boosted in our direction. The Copernican principle says that there are many other quasars not as specially oriented which must comprise (at least a subset of) the sample members with lower core dominance.
Thus, to determine the polar diagram or the anisotropy or extinction curve of any component, one need only divide those with weak cores by those with strong cores. The result is an extinction curve that is quite selective in the optical region and quite flat in the near-UV. Small grains are evidently severely depleted.
We tested this curve as follows. Due to the wonderful work of Joanne Baker, with advisor Richard Hunstead in a supporting role, we had up to six measured emission lines going from Ly to H for every quasar. We divided these in the same way according to core dominance to derive an independent line extinction curve.
This was identical in shape and normalization to the continuum curve.
Most AGN reddening curves are only suggestive, as there is no assurance the comparison objects are intrinsically identical. Following our papers, authors citing reddening curves in the literature list ours among the others, all of which are of the latter type. There is no recognition that ours is the robust one. In fact, some perceive that, e.g., the SDSS curve supercedes or even disproves ours.
Subsequently, our reddening curve has proven both its plausibility and its worth.
I have come to realize that the AGN torus is almost certainly a winnowing machine. Every grain has a different sublimation radius, and physics tells us that only the large grains, being better radiators, reach and define the inner edge of the dusty torus. Thus, I do not consider the dearth of small grains required for our extinction curve to be a stretch; in fact, it’s a key feature.
There is another qualitative point of consistency. A major result from mid-infrared interferometry is that we tend not to resolve the tori in the equatorial direction, which is as expected for a pc-scale dusty gas with Av ∼1000 (Krolik and Begelman 1986, 1988) [27,28]. More often, we resolve the Narrow Line Region in the polar direction (e.g., Bock et al. (2000) [29], which did not require interferometry for NGC1068). Although this emission is optically thin, it lacks the usual silicate emission features due to small silicate grains. This suggests the dust has passed through the torus crucible, losing small grains, and perhaps the Si grains more generally [30].
It was known to the ancients that the ratios of Balmer (Ba) line strengths to Ly are far above case B, and that only a curve shaped like ours could account for this while mostly retaining the physics of Case B. Martin Gaskell et al. (2017) [31] has shown how well this works for the integrated line fluxes. He argued that the wings, which are said to be energetically insignificant, can be explained by a small Case C contribution. While this is my optimistic broad-brush description, there are many details about line profiles and transfer functions which must be considered. What I can defend is this: our extinction curve is manifest in the continuum and line spectra of AGN and changes both significantly. Correction greatly reduces the anomalously high Balmer to Ly ratios. A piece of the puzzle which has yet to be rigorously incorporated is the energy budget and the infrared dust emission.
5. The Tragicomic Story of AGN Accretion Disk Modeling
It has been absolutely routine for the past forty years to assert that accretion disk models can account for the optical/UV continua of AGN.11 In a recent example in Science magazine, C.J. Burke et al. (2021) [34] open their article as follows: “Accretion disks are present around growing supermassive black holes (SMBHs) found in active galactic nuclei (AGNs). Standard theory of radiatively-efficient accretion disks can reproduce the broad-band emission from AGNs.”12
Yet, one of the authors, when writing alone, states in a public funding application that “In marked contrast to models of accretion disks around stellar mass black holes, neutron stars, and in cataclysmic variables, existing theoretical models of accretion disks around supermassive black holes do a very poor job of explaining, never mind predicting, the observed properties of luminous active galactic nuclei (AGNs) [35].”
What is going on here? The prestigious Science paper with the same author says the opposite. That paper very strongly implies that with the presented model tweak, the theory applies to AGN as well. There is no mention of the many other counterarguments, such as the surface brightness measured by microlensing being too low by a factor of 10 (e.g., Dexter and Agol 2011) [4].
The Science paper purports to address just one of the many contradictions, and fails at that, though the authors do not say so. It attempts to explain the extremely rapid variability via an opacity/convection argument that applies only locally in the disk, which does not help at all, as the “problem” appears equally throughout the entire continuum supposedly produced by the model, covering several orders of magnitude in frequency. Finally, their Figure 1 from Ref. [34] is proposed as compelling, but is in fact a terrible fit.
Perhaps the most fundamental prediction of the standard disk model is that the characteristic temperature is proportional to the one-fourth power of L and the inverse square root of M. We have methods of estimating M, and can obtain the approximate BBB luminosity from observation. These scaling relations have been tested implicitly in many papers, and explicitly in at least three: Courvoisier and Clavel (1991) [36], Bonning et al. (2007) [37], and Davis et al. (2007) [38]; see also Reimers (1989) [39]. No sign of the predicted behavior is seen ! The latter two groups even tried comparing the models to the BBB as inferred from emission line ratios, in case we are seeing a non-representative sight line, but to no avail.
These papers had no noticeable effect on the consensus, however.
I note that when Courvoisier and collaborators debunked the disk model, they followed up with several very nice modeling papers based on generic shock cascades, which would be consistent with the variability as well.
Let us now return to the BBB spectral energy distribution.
- Of course, we are generally unable to observe much past 1 Rydberg, and when we can, the data are affected by intergalactic absorption.
- Wavelength-dependent extinction is common, as shown above for radio-loud quasars, and cannot be corrected reliably in individual objects.
- Often, the host galaxy contributes, and it is difficult to subtract its contribution unambiguously.
Notably, all of these problems are avoided by the T-shirt method described in Section 6 below!
Let us now back up to my start in science. When I started out in the 1980s, I realized that quasar continuum spectra carry very little interpretable information. They are only rather generic-looking broad convex lumps.13 Many authors had already noted their generic nature, perhaps starting with Ward et al. (1987) [41].
Following the insights of Lynden-Bell (1969) [42], most workers agreed that to provide the luminosities observed in quasars and the energies contained in radio lobes, black hole accretion was the only game in town. It was well said, probably by M. Rees, that accreting supermassive black holes are by far the least amazing idea that fit the facts.
Following the suggestion of Shields (1978) [43], this idea was instantiated in the simplest possible way as quasistatic geometrically thin and optically thick accretion disks. The potential gradient was used to predict the temperature as a function of radius, and thereby the SED. Soon, as pioneered by M. Malkan (1983) [44], models incorporating these ideas were fitted to observations of AGN.
From the get-go, this paradigm required major cognitive dissonance. While the quasistatic assumption is crucial to the models, it was known to be comically violated by the speed and extremely broadband nature of their flux variations. This discrepancy is by several orders of magnitude, as discussed, for example, by Alloin et al. (1985) [1]. Those authors explained that their observations of NGC1566 showed that the H emission line and the optical continuum vary on timescales of days, with a very tight upper limit on any temporal offset between the two time series. This means that the ionizing continuum and the optical continuum vary extremely rapidly and closely in phase, which is utterly inconsistent with any viscous quasistatic flow.
Also in the 1980s, I pointed out that these models necessarily produce significant polarization in the disk plane. Because the radio jets (including the little ones in Seyferts) lie parallel to the polarization, essentially every thin disk model in the mighty river of such models that continues to flow today have an essential feature in common: the requirement that the jets emerge from the sides of the disks! Such is the level of scholarship in my chosen field.
I have discussed these and other horrible and palpable contradictions in Antonucci et al. (1989) [3], and many subsequent papers. Almost no one cares.
Those of you who have had the pleasure of knowing the late great Bill Mathews of UC Santa Cruz will appreciate this story. I was complaining to him that this obviously erroneous model was accepted instantly and nearly universally, and told him about my commentaries and ongoing tests. He obviously agreed, but cut me off soon with the interjection: “Oh, you can’t stop that!”.
The main topic of that 1989 paper was a search for the Lyman continuum absorption feature predicted by Kolykhalov and Sunyaev (1984) [45] for the standard disk. In a carefully designed plan, we showed that quasars lack that feature.14
Blackbody accretion disks predict a spectral slope of plus one-third over a wide frequency range. With slightly more realistic atmospheres, the spectral index remains positive. Because almost all quasars actually have negative spectral indices, Malkan fit the models not to the observed spectra but to the residual spectra after subtracting a notional steep power law extrapolated from the near infrared. However, universal minima at and reverberation mapping show that the near-IR is dust re-radiation of the primary continuum, which must drop like a stone shortward of . The community was convinced of this largely by a famous paper by Barvainis (1987) [46]; see also Clavel et al., 1989 [47]. Thus, the extrapolation under the optical was…not legitimate.
Malkan obtained about the same temperature for each object, evidently because he was interpreting an atomic feature as the exponential cutoff expected at the innermost stable circular orbit.
The next attempt I studied closely was by A. Laor, and I found it very instructive in multiple ways. He fit a larger sample, crucially finding it advantageous to assume maximal spin. He concluded that the majority fit the models in the sense. It was an odd criterion, as I am sure that, having examined a solar spectrum with great intrinsic SNR and high resolution, I could use the same method to rule out the G star model.
A cursory look at the analysis confirmed that the quasars that fit the criteria were basically the ones with low SNR. Nonetheless, I wondered how the luminous objects, necessarily those with high mass and low temperature, managed to pass muster. As I read on, I silently predicted and quickly confirmed that they were strongly biased towards a very high inclination to the line of sight. That combination of maximal spin and near-90° inclination results in highly blueshifted light being beamed towards the observer! Thus, the quasistatic disk model was saved at the wee cost of the Copernican principle. It was slightly worse than that in the sense that, if aligned with the matter accreting through the AGN torus, they would have been observed as Type 2 objects and not quasars anyway.
Thus, I saw that the lack of any sign of the expected relation could easily be subsumed into the many nuisance parameters such as spin, inclination, host subtraction, reddening, etc., not to mention the ever-ready designer Comptonization.
It now becomes a lot worse. Laor and colleagues Netzer and Piran were apparently aware that the polarization of quasars was inconsistent with the high disk values based on the expected scattering dominated atmospheres, though only that the observed polarization was too low, and not that it was in the wrong direction!
They adjusted the atmospheric densities such that the optically emitting annuli would be absorption-dominated and produce low polarization, which would then rise strongly into the UV, which would be dominated by hotter annuli.
Malkan had noticed the sadly low observed percent polarization as well, and argued that the unified model censorship of edge-on quasars helped a lot by removing those which would have had the highest percent polarization; then, the magnitude distribution would supposedly be as predicted by the disk model.
None of these authors seemed to be aware that, as I had pointed out in papers in the 1980s, the polarization was in the wrong sense for a disk atmosphere, and they were consequently wedded to the prediction that the jets emerge from the sides of the disks. This remains true of models being published today, though theorists do not mention it. Of these, some are aware of it, as I bring it to their attention; however, they seem not to deem it worthy of mention in their papers. A random example is Mitchell et al., 2022 [48]. These particular authors comically crow that they have discovered some wee problem with their quasistatic disk theory, while hiding the fact that much more powerful arguments which falsify a huge superset of models, including theirs, have been published and spoken about at meetings for forty years. I think it is important to note all counterarguments when presenting a model.
As I knew that Joe Miller understood the situation with regard to the erroneous polarization sign of disk models, I said to him (with tongue in cheek), “We know the polarization has the wrong sign, but all these authors have shown that it has the correct magnitude.”
I knew his sardonic facial expression by that time. He just shook his head and said, “That doesn’t help when you’re balancing your checkbook.”
Digression: I noted in print (Antonucci (1988); Antonucci et al.(1989) [2,3]) that the polarization direction in most quasars and other Type 1 objects, being parallel rather than perpendicular to the axis measured by radio, negates the disk model. Next, Laor et al. (1990) [49] used the parallel polarizations as though they were perpendicular, an egregious error negating their whole study.
Next, I pointed out their error in eight papers and in multiple private communications, starting with Antonucci 1993 [50] and including Kishimoto et al. (2004) [51].
However, I read this recently in Capetti, Laor, Baldi, Robinson, and Marconi (2021) [52]: “In contrast with our conclusion that the continuum and BLR polarization are produced by a single scattering medium, Kishimoto et al. (2004) suggest that the optical polarization in quasars is produced by electron scattering within the accretion disk atmosphere…however, this interpretation is inconsistent with the PA of a disk atmosphere scattering, which is predicted to be perpendicular to the radio axis, rather than parallel, as observed.”
They literally reversed history, stating that we had made the error. That same paper misrepresents the work I described in two equally epic ways.
They added two additional arguments, attributed them to our paper, and refuted them as well! One stated a completely fallacious reason for our attribution of the polarization to electron scattering, and another did the same for our identification of the Ba edge feature. These arguments were made up out of whole cloth.
We wrote to the editor, who passed our letter on to the authors. While the authors admitted that they had presented the history exactly backwards, they did not provide any explanation of why they did this, and simply refused to publish an erratum or to take any other corrective actions.
I must add the recent results from the tiny but amazing X-ray mission called IXPE. I just mention that for NGC4151, the few-keV X-rays show polarization parallel to the jet, extinguishing the popular lamppost model for those continuing to entertain it [53]. The same is true for the first black hole binary star, Cygnus X-1 [54]. Thus, the vast literature on spins deriving from the K- line is negated. Actually, the spin cannot be derived even from theoretical K- lines, where the physics is known because the physical processes have been put in by hand; see [55]. The reason for this is that the Eddington ratio, not the spin, largely determines the line profile.
In my opinion, the most essential reference for interpreting X-ray spectra is Yaqoob, et al. (2023) [56]. These authors explained both the physical processes and the historical development of the theory, in the process illustrating the complete irrelevance of the relativistic disk/lamppost model.
6. The Naked Central Engine Spectrum of Quasars
Polarimetry has allowed us to objectively remove all atomic and dust emissions to reveal the true central engine spectra from to in the rest frame. It has attracted virtually no interest. This is probably the best thing I have done, and I say that with the disclaimer that my then-postdoc Makoto Kishimoto actually did virtually everything. Thus, this is not really a boast.
Considering the fiasco of first principles theory, I felt that a more phenomenological approach was in order for both observations and theory. I thought a good starting point was to check the assumption of optically thick thermal emissions. We know that stars are optically thick, with higher temperatures inside, because wavelengths of high opacity are seen in absorption. For quasars in which mildly relativistic motions and gravitational redshifts are expected, line features would be smeared out. Therefore, we pursued the Lyman continuum absorption feature, which was indeed predicted to be deeply in absorption (Kolykhalov and Sunyaev 1984) [45], though that model was a combination of results from the available stellar atmospheres with the lowest surface gravity, not a definitive calculation.
Alas, quasars show no features of any kind at all at this location. We designed a powerful series of observations to maximize sensitivity to highly broadened edges using 8” slit widths for accurate photometry. We obtained high-resolution spectra of the edge positions in order to be sure to distinguish smoothed atmospheric edges from the associated Lyman limit systems, as well as of the Lyman region, as a true atmospheric edge would not produce a strong sharp Lyman absorption line. Later attempts by others failed to take these precautions, and unbeknownst to their authors produced only false positives.
It is possible that Lyman edges are inconspicuous because of heavy scattering and broadening as they arise deep in the potential well. Additionally, these thin disk models are famously unstable in the relevant inner region annuli where they arise. We designed our observations to detect even quite broad features. Nevertheless, extreme broadening could, at least in principle, hide the feature. Thus, we decided to check the behavior at the Ba edge position, which arises from much more distant annuli, alleviating all these concerns.
My philosophy throughout decades of testing both standard and nonstandard disk models has been to give the models the benefit of every doubt, bacause it seems so attractive and natural. It would seem impossible to most people to check for Ba continuum absorption, as at that very wavelength one observes enormous Ba continuum emission from the broad-line region. Perhaps, however, the magic of polarization could save the day.
Quasars generally tend to have a slight polarization which is parallel to the radio symmetry axis, and which is wavelength-independent (Antonucci (1988), Schmidt and Smith (2000), Kishimoto et al. (2003, 2004, 2008) [2,51,57,58,59]). The broad-line polarizations can be similar or somewhat different, with structure inside the profiles. We sought and found five examples in which no polarization at all was detected in the lines. The slight ≲ 1% polarization in the continuum is exactly wavelength-independent to the attainable accuracy.
We proposed and then showed that this slight polarization is due to scattering. There are
two powerful arguments that this scattering is produced by free electrons rather than dust
grains. The first is the precise wavelength-independence of the percent polarization in the
continuum, meaning that the continuum polarized flux is identical in shape to the total flux.
The second is that the scattering takes place interior to the broad line region, as the broad
lines are unpolarized. This places it well inside the sublimation radius, and by definition in
a dust-free region.
Again, we sought and found these five precious quasars; by design, their redshift placed the desired Ba limit wavelength at the most convenient location in the observed frame, which happened to have the slight polarization in the continuum only. The polarized flux spectra are nothing other than a noisier version of the total flux with the emission lines and bound free continua magically removed (see Kishimoto et al. (2003, 2004) [51,58]).
Thus, we produced the first ever spectra of the quasar central engine isolated from all contaminating atomic emission. Virtually no one showed interest in these precious and unprecedented spectra. We found that in all five cases the central engine spectra show the Balmer continuum in absorption, that is, they somewhat resemble the spectra of A stars. This is an extremely important result, proving that at least some of the central engine optical continuum arises in optically thick material with a normal temperature (or source function) gradient (i.e., hotter on the inside).
Later, we performed the same trick to find out what the central engine spectrum does in the near-IR, heretofore completely inaccessible underneath the dust emission which is ubiquitous longward of in the rest frame. Again, all five quasars behave the same way; a slope change occurs such that, whereas the spectral index of a fit to is almost always negative in the optical/UV, in the near IR it breaks to .
These are arguably the only known spectral features in the central engine spectrum, and constitute a major advance. Together with all the other constraints (such as the microlensing surface brightness), it tells us a great deal about the emitter. At least part of the optical light comes from optically thick gas with heat deposited at large optical depth. And recall that the microlensing constraints at shorter wavelength require that if resulting from optically thick emission, its source must have effectively only of order 10% areal filling factor, with dark regions in between in the spirit of Dexter and Agol 2011 [4].
This is about all that I know about the quasar optical–UV continuum today. The nearly generic shape of the Big Blue Bump, the two localized features just described, the Ba continuum absorption, the near-IR turnover, and the grossly sub-blackbody surface brightness from microlensing. There is sometimes a slope change near 1000 Å as well, though this is probably due to absorption by wind [60].
A way forward?
There is, however, a clue from a generic feature of the AGN SEDs. We recognized the emission mechanism for the infrared light in part due to the fact that it has a feature (really two) which is fixed in wavelength. Virtually every total-flux spectrum has a conspicuous minimum when plotted in energy () vs. log frequency at . Thus, the IR emission cuts off sharply at . This is just what one would expect for dust emission, because the most abundant dust species sublimate at around 1500 K. (Similarly though not as precisely, the dust bumps terminate in the sub-mm region. This is quite understandable because dust anywhere is the host galaxies would be heated to a few tens of degrees.)
What is the analogy for the Big Blue Bump? Prior to the polarization work described above, the low frequency turnover was an open question because the BBB could not be traced past due to the contaminating dust emission. However, as explained above, we now know that the optical slope, approximately , breaks15 to +0.35 in the near-IR. Thus, the BBB becomes energetically insignificant past that region, the slope being +1.35.
Thus, it is fair to say that the BBB begins around the same location that the dust emission ends. The very narrow range of wavelength for the minimum is suggestive of this as well, as otherwise the drop in the dust spectrum might not define it quite as well.
Where does the BBB end at high frequencies? The answer to this question is very remarkable, as it is closely consistent from object to object. From the X-ray point of view, one generally observes an excess of soft X-rays, that is, the flux below ∼1 keV in energy is usually well above the extrapolation from higher energy. If fitted with a black body, whether or not physically appropriate, this excess provides a temperature of x∼10 K with very little dispersion.
Thus, the BBB extends primarily from (∼1 eV) to a break at (say) 300 eV. Such behavior strongly suggests that the controlling element is atomic physics rather than global conditions. Why this range is generic is not known at present. Of course, efforts have been made to use this valuable clue; however, to date none have been completely successful.
Rapid broadband variability is a key property of AGNs; it is wise to make this a part of the model rather than making the false and manifestly disastrous quasistatic assumption! To support the role of shocks, I note that tidal disruption events are precious examples of supermassive black hole accretion, and shocks are very likely essential in this context. On this point, two key recent references have dealt with simulating the prompt emission of TDEs: Huang et al. (2023) [62] and Ryu et al. (submitted 2023) [63]. For a more qualitative description of how shock cascades might account for all of the accretion radiation, see Courvoisier and Türler (2005) [64].
It would be worthwhile, even today, to read the discussion from our 1989 paper on the Lyman limit region, because other mysteries are discussed therein as well. For example, every quasar shows an enormous Ba continuum emission from the BLR; an epic number of free electrons combine to the orbital.
However, no electrons in any object detectably combine directly to . That jump has a much higher capture cross-section. What do you think of that? While optical depth effects can weaken the Lyman emission feature, extensive experimentation fails to reveal any modeled cases in which the continua are as perfectly smooth across 912 Å as any quasars.16
It gets worse; photon counting arguments lead to a covering factor for recombination line-producing BLR clouds of at least 30% if the Ly line or the Balmer lines have strong contributions from that process. (The latter are much stronger relative to Ly than for Case B recombinations. Thus, other processes probably occur and non-standard reddening plays a major role; see Gaskell et al. (2004) [24] and Gaskell et al. (2017) [31]). Nevertheless, a substantial covering factor is required for clouds that are opaque at the Lyman edge. If such clouds are larger than the 1 Ryd-emitting continuum region, at least a large minority of quasars should show spectral cutoffs there. If the clouds instead comprise a fine mist, then composite spectra should show a robust partial absorption at 912 Å. Yet, of the countless thousands of edge locations examined I am unaware of a single intrinsic Lyman continuum absorption edge which can be identified with a BLR cloud. What do you think of that?
I can only assume that those objects in which our sightline passes through recombination line-producing clouds simply drop out of the sample and are not called Type 1 AGNs. A moment of reflection identifies the only candidate for their observed properties, namely, that they must be classified as Type 2; that is, every such sight line must pass through the torus as well. Thus, as seen from the nucleus, the solid angle covered by recombination clouds must be a subset of that covered by the torus. Various colleagues have convinced me that the outer boundary of the recombination BLR is continuous with the inner boundary of the torus, largely from the reverberation transfer functions. And ionizing photons incident on the torus would produce recombination lines. I can only conclude that these BLR clouds are simply the name we assign to the part of the torus which extends inside the sublimation radius. This is all discussed in Antonucci et al. (1989) [3], with further considerations in Maiolino et al. (2001) [65].
7. Disproof of the Accretion Disk and Related Models Suitable for Illustration on a T-Shirt—How to Beat a Dead Horse
I have written many papers over the decades pointing out robust falsifications of the disk model, and in this enterprise I have been largely alone and largely ignored17. I am sure that will not change with the following “T-shirt argument ”, which I have made before. Yet, I claim that it can disprove any model involving optically thick thermal emission from a fixed area. That includes a huge superset of the standard disk models. This T-shirt model is presented here in qualitative form in the hope that a more industrious person will carry it out. Nevertheless, if you are well acquainted with the data you too may find it striking.
My hot dust lag argument is extremely valuable because it avoids all of the limitations of direct observation of the BBB enumerated in Section 4! True, it does not provide the shape of the BBB; however, it tells us something incredibly valuable: it covers the entire BBB, and is immune to both reddening and host galaxy contamination! From the point of view of the innermost surviving dust grains, this tells us that the shape is extremely generic, making it quite independent of M and L, or indeed much of anything else! Certainly, the standard disk model, along with any optically thick thermal model in which the radiating area is proportional to , would not have this property.
Many excellent papers have presented reverberation distances between the BBB source and the hottest dust emission. The distances follow , just as one would expect from radiative equilibrium and sublimation. However, the dispersion in the relation is interestingly low. The relation is so tight that this correlation provides an excellent standard candle for cosmology; see the VEILS project simulation in Hönig et al. (2017) [66].
In Koshida et al. (2014) (their Figure 10) [67], which covered a luminosity range of around a factor of 300 in , the authors quoted a dispersion in hot dust lags in the K band of 0.13 in the log. They assessed the measurement uncertainty at 0.11, and noted that there are several other sources of dispersion which must be present. Thus, no intrinsic dispersion was detected, even though they set a very generous upper limit at 0.10. This is indeed conservative, because subtracting 0.11 in quadrature leaves 0.07. That is not yet the dispersion in the bolometric correction (discussed below) from to , as the remaining error budget must accommodate those introduced from V band variability, anisotropy of the BBB emission, extinction, host correction, the geometry and inclination of the torus, etc. In the disk model, the anisotropy alone would easily contribute that much (I think), leaving none (or less than none) for the effects of T.
The next paper in the series, Minezaki et al. (2019) [68], extended the luminosity range to four powers of ten(!) without a noticeable increase in dispersion; however, no value was quoted. Figure 5 from Minezaki et al. (2019) [68] is suitable for a T-shirt, and they show that using the mid-IR or X-ray instead of the V band (less susceptible to anisotropy, reddening, host subtraction, etc.) tightens the noose.18
The tiny lag dispersion is very remarkable, and has two implications. First, the innermost hottest dust has extremely similar physical properties from object to object. The sublimation radius is very sensitive to both the composition of the grains and their sizes (and consequently the radiative efficiency). The exact cutoff in the spectrum depends sensitively on grain size in another way as well: aside from the effect on T, small grains are not only hotter in a given radiation field, they deviate from blackbody emission at a given T as well.
Why does the emission radius follow so perfectly? I think it is easy to understand why the grain properties are very generic. Far from the inner edge of the torus, there is a great variety of grain size and composition, and each grain has its own Rsub. However, the torus is a winnowing machine; as the grains work their way inward, only those with the smallest Rsub survive. The inner region must be made of the largest and most refractory grains, and these may well be the same in all objects. The closest grains are the toughest, and consist only of those large enough to emit with near-blackbody efficiency.
I think this very likely explains the special AGN nuclear extinction curve deduced from the exceptionally well-designed study of Gaskell et al. (2004) described previously [24]; that study compared the spectra of radio quasars from complete samples of isotropically (radio lobe) selected objects as a function of core dominance. In light of the VLBI properties, it matches objects subject only to the validity of special relativity and the Copernican principle. In fact, very remarkably, it is shown in the above-mentioned paper that the spectral shape differences are truly due to reddening, as one can make curves based on comparing six emission lines from Ly to H which match the curves from the continua in both shape and normalization!
Now the fun really begins. None of the reverberation lag papers actually plots lag vs. BBB luminosity! Instead, a convenient proxy is used for the latter: the (rest) magnitude! This is not reasonable in principle, and the tiny dispersion in the relation must mean that the bolometric correction from to must itself have a very small dispersion!
The V band indicates the flux at the very bottom of the BBB, very far from the peak in . Suppose the BBB arises as optically thick thermal radiation from a fixed area, and the characteristic temperature depends sensitively on the black hole mass and Eddington ratio of the luminosity, that is, . Then, the bolometric correction from V to BBB depends very sensitively on the characteristic temperature.
Thus, for models of the type described above, a very small dispersion would require an unrealistically small range in at any given . I have not proven quantitatively here that this leads to a contradiction, and instead leave it as an exercise.
8. Cygnus A Keeps on Giving: Recent Results on Our Glorious Prototype
We are so fortunate to have such a prize as Cygnus A! Without checking the folklore again, I will tell you only that the following is very likely at least roughly true:
- Despite the volume element and strong cosmological evolution, you would need to reach a redshift of 1 to find another example of its radio luminosity. The redshift of Cygnus is only 0.056. It is claimed that in only one of 10,000 realizations of our universe would we be this lucky. Cygnus A is an overachiever in the radio band because of its rich environment (Barthel and Arnaud 1996) [72].
- A slightly inebriated expert assured me that this legend is true: if Cygnus is above the horizon, you can map it in a VLA sidelobe, independent of the pointing. Even before the upgrade!
In this little section, I recount results from our group over the past several years. First, our leader at the late SOFIA airborne observatory, Enrique Lopez-Rodriguez, has helped build the only sensitive far-IR polarimeter this planet has ever deployed, then heroically and repeatedly soared into the stratosphere to make various discoveries, not least that the far-IR emission of Cygnus is 10% polarized. This is an unprecedented result in the field, and the interpretation came as a surprise to many.
Certainly, one’s first thought might be synchrotron emission, and the IR SED had been modeled as such in multiple papers. I was not convinced by these models, because though physically possible they were not physically plausible. They required extreme homogeneity and fortuitous global parameters to fit the very sharp sub-mm rise and the decline from the mid-IR to the near-IR. With the far-IR polarization measurement, it became clear that this is really emission from dust grains aligned by a globally coherent magnetic field. In the submillimeter region the polarized flux of Cygnus A rises extremely steeply with frequency similar to the total sub-mm flux, that is, the signature of dust emission.
The near-IR polarization is similar in magnitude and somewhat dissimilar in position angle, in fact falling exactly perpendicular to the radio jet. It seems very likely, especially considering the analogous behavior in other objects, that the point-like near-IR polarization is none other than the result of polar scattering of the unified model. This is true of the optical as well, where Ogle et al. 1997 [73] have revealed enormously broad lines in polarized flux. The optical scattering is only seen on scales of several arcsecs.
While that large-scale scattering component is not seen easily in the near-IR, the polar (perpendicular) scattering is detectable with very high surface brightness on sub-arcsec scales at because this light penetrates a big kpc-scale dust lane, very similar to the situation in Centaurus A. These examples are discussed together with a third very similar case, 3C223.1, in Antonucci and Barvainis 1990 [74].
We (Enrique) have gone on to observe a heterogeneous handful of AGNs, both radio-quiet and radio-loud, thus far finding a perfect correspondence between these types and the detection and magnitude of polarization of the far dust emission polarization [75]. This remarkable result must be explored further to characterize it more fully and accumulate definitive statistics; despite the loss of SOFIA, prospects for this are bright. The reason is that mighty ALMA can cover enough of the crucial sub-mm range in many objects to look for the extremely rapid rise in polarized flux that proves the origin to be dust emission.
This powerful discovery, if verified fully, is arguably our major clue to the reason for the radio-loud vs. radio-quiet classes. Our theoretical colleagues were sufficiently motivated to explore the interpretations in our second paper [75]. It is logically possible that the globally magnetized accretion flow on pc scales ultimately manifests in a relativistic jet. The opposite is also possible; perhaps jet currents magnetize the dusty gas. There is much exciting work here to do for all.
Next, we are close to settling the nature of the gas in the ∼ cm X-ray column, a typical value for Type 2 objects. Of course the X-rays primarily really measure the heavy elements, and much of that column resides in the dust grains themselves. Nonetheless, we must ask whether the accompanying gas in the atomic or molecular phase.
Struve and Conway 2010 [76] have published beautiful and fascinating results from HI 21 cm observations with VLBI. The innermost counter-jet continuum component, just 45 milliarcsec (or ∼50 pc) from the core, shows very strong HI absorption, with an equivalent width sufficient to equal for the X-ray column density, for a reasonable spin temperature of K. However, the absorption in front of the radio core is nearly two orders of magnitude smaller, and is unable to account for the X-ray columns unless the T-spin is K, which would be impossible to explain in our view. Yet this is what the X-ray column measures for the core itself!
For many reasons, most importantly that such high columns are only observed in Type 2 AGNs, it is thought that the high X-ray columns are associated with the torus-like obscurer of the UM rather than, say, atomic gas inside the sublimation radius. Thus, absent a sufficient atomic hydrogen column, we turn to the possibility of a molecular torus as the default possibility. This must involve some exotic conditions, however, because low-J CO rotational absorption lines against the core in the millimeter region have long been sought without success. The most recent limits come from ALMA observations at the position of the to transition at the rest frame frequency of 230 GHz (Carilli et al., 2022 [77], and pc). No absorption is seen, however, and if the excitation of the low J states were thermal it would be very conspicuous.
It has been suggested based on much poorer limits that the low J states are depopulated as the gas is driven to extremely high rotation temperatures by the radiation of the radio core itself (Maloney et al. (1994) [78]). This would also drive stimulated emission to cancel abortion in the low J regime. Great compactness is required, with almost the entire column within a few pc of the very compact 1.3 mm core. For comparison, the sublimation radius for black body grains which evaporate at 1500 K is estimated at pc. Again, we think that ALMA can test this with a search for absorption in a CO line near the atmospheric opacity cutoff, as at that frequency the solid-angle averaged brightness temperature is much reduced relative to that at 230 GHz.
9. Summary
That was an arduous trek, but we will take the bus back.
Spectroscopic Unification
The polarization properties of narrow line (Type 2) radio galaxies. Torus and mirror.
This Spectroscopic Unification seems to apply to most or all Seyfert galaxies and quasars, including radio-loud ones. However, at low to medium radio luminosity there are plenty of radio galaxies which lack signs of copious real-time accretion, namely, the Big Blue Bump continuum and the Broad Emission Lines. The best guess is that these “non-thermal" radio galaxies are tapping black hole rotational energy [80].
Beaming Unification by Orientation in Radio-Loud Objects
Many properties of radio-loud AGNs, especially those of the blazar class, are very nicely explained by an orientation-based Unified Model and bulk relativistic motion. Those with directly visible or hidden BBB/BLR comprise one (“thermal”) group, and those would comprise a nonthermal group. The many nuances are described systematically throughout the entire electromagnetic spectrum in Antonucci 2012.
The Peculiar AGN Nuclear Reddening Law
Direct arguments are provided that lobe-dominant radio quasars and radio galaxies must be intrinsically the same as matched core-dominant quasars, only differing in orientation. Selecting a complete sample based on (∼isotropic) lobe flux, we can then unify the sample objects of the various subtypes with high confidence.
Dividing the composites as described produces an anisotropy due to extinction, which is highly chromatic in the visible and quite flat in the UV. This indicates a dearth of small grains, as expected qualitatively from the winnowing action of the torus.
This reddening curve is confirmed in a spectacular and independent way, showing that by using the six emission lines from Ly to H, a a new curve can be drawn that is identical in shape and normalization to the continuum curve!
None of this precludes additional reddening by more normal dust in the host, for which we find much evidence, especially in radio-quiet Seyfert galaxies, in keeping with their spiral hosts.
The Accretion Disk Model for the Big Blue Bump: Epic Magical Thinking.
The standard thin accretion disk model was proposed in the late 1970s and 1980s to account for the Big Blue Bump continuum component, which dominates the luminosity of AGNs.
Cognitive dissonance was part of this model from its first being proposed. For example, the quasistatic assumption is comically at variance with observations. Similarly, a scattering atmosphere of a thin disk with internal dissipation produces a polarization perpendicular to the radio jet, opposite to what we see. It was soon demonstrated that actual data show no sign whatsoever of the basic expectation that the maximum disk temperature is proportional to the one-fourth power of the luminosity and the negative square root of the mass. While other powerful arguments followed, the non-viable disk model bandwagon meant that nobody noticed!
The Spectrum of the Central Engine with Atomic and Dust Emissions Removed
There is little correlation between my own assessment of my papers and the attention they receive. This is the most remarkable example: while the BBB is energetically dominant, over most of its wavelength range, from the near-IR to the EUV, it is contaminated by reprocessed emission. We removed these over much of that range, and our method can be extended. The work received virtually no notice. M. Kishimoto deserves the lion’s share of the credit.
Luckily, the polarization in most quasars is wavelength-independent in the continuum, and we identified cases in which the reprocessing features are unpolarized. Therefore, the polarized flux closely resembles a noisy version of the total flux, except without the contamination which heretofore prevented us from observing the bare central engine spectrum. The results are rather amazing, and our five clear examples all behave the same way qualitatively, showing a broad absorption feature starting at exactly the right location for the Balmer jump. This strongly implies a contribution from an optically thick emitter with a source function gradient like those in stars, indicating dissipation at large optical depths.
We then looked in the near-IR to try to find out what the BBB is doing under the ubiquitous hot dust emission. In all five cases, the polarized flux turns downward to reach by in the rest frame. The only noncontrived explanation is that the dust is unpolarized, as could be expected for Type 1 (at low inclination), and that the BBB turns over at these wavelengths. This is another intrinsic spectral feature of the BBB (Kishimoto et al. (2008)) [59].
Recall, though, that microlensing observations indicate a surface brightness an order of magnitude lower than is required. If these observations at much shorter rest wavelengths than the Balmer jump are from optically thick thermal radiation, it must be the case that the effective areal covering factor is much less than one.
Negating a Mighty River of Theory with a Figure Suitable for a T-Shirt.
The relationship between hot dust lags relative to BBB fluctuations has been demonstrated to have very small dispersion. It follows the expected relationship of the lag time, being proportional to the square root of luminosity; more important here, however, is the remarkably small dispersion.
Because cannot be measured, the observers used as a proxy! This worked extremely well, which is completely unexpected for a huge superset of the standard disk models. It precludes any scenario in which the characteristic temperature is set by . In fact, in most cases the “temperature” cannot depend much on anything at all!
I consider this to be a profound result; however, I leave the execution as an exercise for the reader.
The Magnificent Radio Galaxy Cygnus A: Recent Developments.
We have learned many new things about Cygnus A beyond its glorious and extremely energy-rich radio lobes.
This prototype source fulfills all aspect of unified models, with high perpendicular polarization of scattered light, a Type 1 spectrum in polarized flux, and beautiful bicones of polarized UV flux from HST. We now know that the dust emission is highly polarized indicating a coherent magnetic field, and tentatively this is true only in radio loud AGN.
Other recent gossip is reported.
Funding
This research received no external funding.
Data Availability Statement
No new data were created or analyzed in this study; therefore, data sharing is not applicable to this article.
Acknowledgments
Many astronomers provided comments on earlier versions of this paper. These people suffered the most: R. Barvainis, P. Ogle, E. Lopez-Rodriguez, A. Bagul, and M. Gaskell. A. Bagul kindly prepared most of the figures. D.L. Ceder made the paper much more intelligible.
Conflicts of Interest
Authors have no conflict of interest to declare.
Abbreviations
The following abbreviations are used in this manuscript:
| AAS | American Astronomical Society |
| AGN | Active Galactic Nucleus |
| a.u. | Astronomical Unit(s) |
| Ba | Balmer |
| BAL | Broad Absorption Line |
| BBB | Big Blue Bump |
| BLR | broad-line region |
| CCD | Charge-Coupled Device |
| HST | Hubble Space Telescope |
| IR | Infrared |
| PA | position angle |
| SDSS | Sloan Digital Sky Survey |
| SED | spectral energy distribution |
| SMBH | Supermassive black hole |
| SNR | Signal-to-Noise Ratio |
| TDE | tidal disruption event |
| UC | University of California |
| UV | Ultraviolet |
| VLA | Very Large Array |
| VLBI | Very-long-baseline interferometry |
| 1 | We will see below that while this is the whole story for very luminous radio sources, many weaker radio galaxies do not participate in this scheme. Very detailed information can by found in a major review by Antonucci (2012) [6]. |
| 2 | When I first showed Joe Miller that starlight heavily dilutes the polarization and strongly affects the wavelength dependence, he pointed out to me that there were bumps in percent polarization corresponding to the stellar absorption lines due to reduced dilution compared to neighboring wavelengths. He said the percent polarization plot “looks like a galaxy spectrum plotted upside down”. |
| 3 | I had the pleasure of showing their data at a meeting in 1986; afterwards Chris McKee said to me, “I didn’t know telescopes were that powerful!”. |
| 4 | To be a bit more historically accurate, in 1978 there was little direct imaging evidence for fast superluminal motion, and these authors argued powerfully for the scenario using physical arguments based on data at other wavelengths as well. |
| 5 | To this day, most X-ray astronomers show uncalibrated count spectra because they are too lazy to deconvolve their line spread functions. They believe in X-ray Exceptionalism, and so only they are prevented from obtaining proper flux calibration The published count spectra mainly show the “effective area” curve, and diabolically conceal the physical information. X-ray astronomers publish pages of these uninformative count spectra. |
| 6 | The fast superluminal radio sources are approximately the same objects that optical astronomers call blazars, based on their beamed synchrotron core emission, which can swamp even the optical spectrum of the AGN. I do not make an explicit distinction in this conversational condensed essay, though this is of course not adequate for research; the subtleties are discussed in, e.g., Antonucci and Ulvestad (1985), Wills et al. (1991), and my 1993 and 2012 reviews. The net effect here, however, is to diminish work by others, e.g., Browne et al. (1983), who used selection by VLBI speed. In general, the present paper uses very incomplete and self-serving referencing, for which the author expects to pay in Purgatory. My major reviews of 1993 and 2012 are much better in this regard. |
| 7 | At this time, a theory paper by Blandford and Königl (1979) [18] made me worry that these statistical arguments might be too naive due to a possible large intrinsic beaming angle resulting from non-collinear motions. However, all the data in hand suggested to me that if I did otherwise, I would be too sophisticated. |
| 8 | Note, though, that he did not entitle his paper “Do all radio galaxies contain hidden quasars?” He did not make that superficially similar statement because he is a very smart guy. The answer to that question would be no, while the answer to the question he posed is basically yes. |
| 9 | The selection criteria in Laing (1988) [21] and Garrington et al. (1988) [22] only slightly favored low-inclination sources. Ulvestad and I did not have the problem of missing radio galaxies, because we knew about the polarimetry, and did not “know” that quasars should be considered separately from radio galaxies. In fact, this surprising result alone unifies quasars with radio galaxies, unless you are willing to give up the Copernican Axiom; or perhaps you can think of a different explanation for the essential ubiquity of the lobe depolarization asymmetry in quasars. |
| 10 | We treated radio-quiet quasars as well, though necessarily less rigorously; certain quasars, especially among the radio-quiet ones, have roughly SMC-like additional reddening from the host. See Gaskell and Benker (2007) [25]. |
| 11 | |
| 12 | We will see below that the disk model or anything resembling it is completely at odds with the spectral energy distribution. |
| 13 | Remarkably Barvainis (1993) [40] has shown that observed SEDs can be fitted as well, and with fewer parameters, with just the Bremsstrahlung emissivity formula. |
| 14 | After our paper was published, another paper claimed to see absorption in the Lyman continuum consistent with an origin in a disk atmosphere in a couple quasars. The authors carelessly omitted a key test to distinguish edges from disk atmospheres from “associated” Lyman Limit Systems from foreground gas; kinematic and gravitational broadening would completely disguise the accompanying narrow absorption lines that a cloud would produce. We used that test to rule out the disk explanation for our candidates. Then, Kinney and I later checked these others; alas, they all showed the accompanying narrow absorption lines. |
| 15 | This break cannot be identified with the so-called self-gravity radius of an accretion disk, which would be at longer wavelengths; in fact it is unclear how such a cutoff would arise in the accretion process, though self-gravity breakup would make sense if the disk ran backwards ! While gas can break up due to self-gravity, gravitating objects such as stars would not obviously decompose and turn into a gas disk on the way in (see Goodman (2003) [61]). |
| 16 | This information comes to me mostly from a lifetime of challenging Gary Ferland to make “Cloudy" models that look like quasars in this part of the spectrum. |
| 17 | An important exception is the work of Courvoisier and collaborators, starting with Courvoisier and Clavel (1991) [36]. Again, these strong papers attracted no attention. |
| 18 | An anonymous referee points out yet more impeccable lag measurements, raising the luminosity range covered with tiny dispersion relative to , another order of magnitude, for a total of five. It would be absurd to entertain a theory for the Big Blue Bump in which its “temperature” scales with any macro-level parameters [69,70,71]. The last of these is a masterful review of the whole field of dust distance measurements. |
References
- Alloin, D.; Pelat, D.; Phillips, M.; Whittle, M. Recent spectral variations in the active nucleus of NGC 1566. Astrophys. J. 1985, 288, 205–220. [Google Scholar] [CrossRef]
- Antonucci, R.; Kafatos, M. Polarization of Active Galactic Nuclei and Quasars. In Proceedings of the Third George Mason Astrophysics Workshop, Fairfax, VA, USA, 14–16 October 1986; p. 26, ISBN 0-521-34246-5. [Google Scholar]
- Antonucci, R.R.J.; Kinney, A.L.; Ford, H.C. The Lyman Edge Test of the Quasar Emission Mechanism. Astrophys. J. 1989, 342, 64. [Google Scholar] [CrossRef]
- Dexter, J.; Agol, E. Quasar Accretion Disks are Strongly Inhomogeneous. Astrophys. J. Lett. 2011, 727, L24. [Google Scholar] [CrossRef]
- Stockman, H.S.; Angel, J.R.P.; Miley, G.K. Alignment of the optical polarization with the radio structure of QSOs. Astrophys. J. 1979, 227, L55–L58. [Google Scholar] [CrossRef]
- Antonucci, R. A panchromatic review of thermal and nonthermal active galactic nuclei. Astron. Astrophys. Trans. 2012, 27, 557–602. [Google Scholar]
- Antonucci, R.R.J. Optical polarization position angle versus radio source axis in radio galaxies. Nature 1982, 299, 605–606. [Google Scholar] [CrossRef]
- McLean, I.S.; Aspin, C.; Heathcote, S.R.; McCaughrean, M.J. Is the polarization of NGC1068 evidence for a non-thermal source? Nature 1983, 304, 609–611. [Google Scholar] [CrossRef]
- Miller, J.S.; Antonucci, R.R.J. Evidence for a highly polarized continuum in the nucleus of NGC 1068. Astrophys. J. 1983, 271, L7–L11. [Google Scholar] [CrossRef]
- Antonucci, R.R.J.; Miller, J.S. Spectropolarimetry and the nature of NGC 1068. Astrophys. J. 1985, 297, 621–632. [Google Scholar] [CrossRef]
- Krolik, J.H.; Kallman, T.R. Fe K Features as Probes of the Nuclear Reflection Region in Seyfert Galaxies. Astrophys. J. 1987, 320, L5. [Google Scholar] [CrossRef]
- Miller, J.S.; Goodrich, R.W.; Mathews, W.G. Multidirectional Views of the Active Nucleus of NGC 1068. Astrophys. J. 1991, 378, 47. [Google Scholar] [CrossRef]
- Band, D.L.; Klein, R.I.; Castor, J.I.; Nash, J.K. Iron K-Shell Emission from NGC 1068. Astrophys. J. 1990, 362, 90. [Google Scholar] [CrossRef]
- Ogle, P.M.; Brookings, T.; Canizares, C.R.; Lee, J.C.; Marshall, H.L. Testing the Seyfert unification theory: Chandra HETGS observations of NGC 1068. Astron. Astrophys. 2003, 402, 849–864. [Google Scholar] [CrossRef]
- Dey, A.; Cimatti, A.; van Breugel, W.; Antonucci, R.; Spinrad, H. On the Origin of the Ultraviolet Continuum Emission from the High-Redshift Radio Galaxy 3C 256. Astrophys. J. 1996, 465, 157. [Google Scholar] [CrossRef]
- Antonucci, R.; Hurt, T.; Miller, J. HST Ultraviolet Spectropolarimetry of NGC 1068. Astrophys. J. 1994, 430, 210. [Google Scholar] [CrossRef]
- Blandford, R.D.; Rees, M.J. Some comments on radiation mechanisms in Lacertids. In Proceedings of the Pittsburgh Conference on BL Lac Objects, Pittsburgh, PA, USA, 24–26 April 1978; A79-30026. pp. 328–341. [Google Scholar]
- Blandford, R.D.; Königl, A. Relativistic jets as compact radio sources. Astrophys. J. 1979, 232, 34–48. [Google Scholar] [CrossRef]
- Barthel, P.D. Feeling Uncomfortable. In Proceedings of the Workshop on Superluminal Radio Sources, Pasadena, CA, USA, 28–30 October 1986; Cambridge University Press: Cambridge, UK, 1987; pp. 148–154. [Google Scholar]
- Barthel, P.D. Is Every Quasar Beamed? Astrophys. J. 1989, 336, 606. [Google Scholar] [CrossRef]
- Laing, R.A. The sidedness of jets and depolarization in powerful extragalactic radio sources. Nature 1988, 331, 149–151. [Google Scholar] [CrossRef]
- Garrington, S.T.; Leahy, J.P.; Conway, R.G.; Laing, R.A. A systematic asymmetry in the polarization properties of double radio sources with one jet. Nature 1988, 331, 147–149. [Google Scholar] [CrossRef]
- Scheuer, P.A.G. Tests of beaming models. In Proceedings of the Workshop on Superluminal Radio Sources, Pasadena, CA, USA, 28–30 October 1986; A88-39751. Cambridge University Press: Cambridge, UK, 1987; pp. 104–113. [Google Scholar]
- Martin, G.C.; Goosmann, W.; Antonucci, R.J.; Whysong, D.H. The Nuclear Reddening Curve for Active Galactic Nuclei and the Shape of the Infrared to X-ray Spectral Energy Distribution. Astrophys. J. 2004, 616, 147–156. [Google Scholar] [CrossRef]
- Gaskell, C.M.; Benker, A.J. AGN Reddening and Ultraviolet Extinction Curves from Hubble Space Telescope Spectra. Astrophys. J. 2007, submitted.
- Marin, F.; Antonucci, R. A Robust Derivation of the Tight Relationship of Radio Core Dominance to Inclination Angle in High Redshift 3CRR Sources. Astrophys. J. 2016, 830, 82. [Google Scholar] [CrossRef]
- Krolik, J.H.; Begelman, M.C. An X-ray heated wind in NGC 1068. Astrophys. J. Part Lett. Ed. 1986, 308, L55–L58. [Google Scholar] [CrossRef]
- Krolik, J.H.; Begelman, M.C. Molecular Tori in Seyfert Galaxies: Feeding the Monster and Hiding It. Astrophys. J. 1988, 329, 702. [Google Scholar] [CrossRef]
- Bock, J.J.; Neugebauer, G.; Matthews, K.; Soifer, B.T.; Becklin, E.E.; Ressler, M.; Marsh, K.; Werner, M.W.; Egami, E.; Blandford, R. High Spatial Resolution Imaging of NGC 1068 in the Mid-Infrared. Astrophys. J. 2000, 120, 2904–2919. [Google Scholar] [CrossRef]
- Almeida, C.R.; Ricci, C. Nuclear obscuration in active galactic nuclei. Nat. Astron. 2017, 1, 679–689. [Google Scholar] [CrossRef]
- Gaskell, C.M. The case for cases B and C: Intrinsic hydrogen line ratios of the broad-line region of active galactic nuclei, reddenings, and accretion disc sizes. Mon. Not. R. Astron. Soc. 2017, 467, 226–238. [Google Scholar]
- Lawrence, A. The UV peak in active galactic nuclei: A false continuum from blurred reflection? Mon. Not. R. Astron. Soc. 2012, 423, 451–463. [Google Scholar] [CrossRef]
- Lawrence, A. Quasar viscosity crisis. Nat. Astron. 2018, 2, 102–103. [Google Scholar] [CrossRef]
- Burke, C.J.; Shen, Y.; Blaes, O.; Gammie, C.F.; Horne, K.; Jiang, Y.F.; Liu, X.; McHardy, I.M.; Morgan, C.W.; Scaringi, S.; et al. A characteristic optical variability time scale in astrophysical accretion disks. Science 2021, 373, 789–792. [Google Scholar] [CrossRef]
- Blaes, O. Accretion Disks around Supermassive Black Holes with Realistic Opacity; NASA proposal id 21-ATP21-96; NASA: Washington, DC, USA, 2021. [Google Scholar]
- Courvoisier, T.J.-L.; Clavel, J. Observational constraints on disc models for quasars and Seyfert galaxies. Astron. Astrophys. 1991, 248, 389–394. [Google Scholar]
- Bonning, E.W.; Cheng, L.; Shields, G.A.; Salviander, S.; Gebhardt, K. Accretion Disk Temperatures and Continuum Colors in QSOs. Astrophys. J. 2007, 659, 211–217. [Google Scholar] [CrossRef]
- Davis, S.W.; Woo, J.-H.; Blaes, O.M. The UV Continuum of Quasars: Models and SDSS Spectral Slopes. Astrophys. J. 2007, 668, 682–698. [Google Scholar] [CrossRef]
- Reimers, D.; Clavel, J.; Groote, D.; Engels, D.; Hages, H.J.; Naylor, T.; Wamsteker, W.; Hopp, U. The luminous quasar HS 1700+6416 and the shape of the “big bump” below 500 A. Astron. Astrophys. 1989, 218, 71–77. [Google Scholar]
- Barvainis, R. The Case for an Optically Thin Thermal Big Blue Bump. Astrophys. J. 1993, 412, 513. [Google Scholar] [CrossRef]
- Ward, M.; Elvis, M.; Fabbiano, G.; Carleton, N.P.; Willner, S.P.; Lawrence, A. The Continuum of Type 1 Seyfert Galaxies. I. A Single Form Modified by the Effects of Dust. Astrophys. J. 1987, 315, 74. [Google Scholar] [CrossRef]
- Lynden-Bell, D. Galactic Nuclei as Collapsed Old Quasars. Nature 1969, 223, 690–694. [Google Scholar] [CrossRef]
- Shields, G.A. Thermal continuum from accretion disks in quasars. Nature 1978, 272, 706–708. [Google Scholar] [CrossRef]
- Malkan, M.A. The ultraviolet excess of luminous quasars. II. Evidence for massive accretion disks. Astrophys. J. 1983, 268, 582–590. [Google Scholar] [CrossRef]
- Kolykhalov, P.I.; Sunyaev, R.A. Radiation of accretion disks in quasars and galactic nuclei. Adv. Space Res. 1984, 3, 249–254. [Google Scholar] [CrossRef]
- Barvainis, R. Hot Dust and the Near-Infrared Bump in the Continuum Spectra of Quasars and Active Galactic Nuclei. Astrophys. J. 1987, 320, 537. [Google Scholar] [CrossRef]
- Clavel, J.; Wamsteker, W.; Glass, I.S. Hot Dust on the Outskirts of the Broad-Line Region in Fairall 9. Astrophys. J. 1989, 337, 236. [Google Scholar] [CrossRef]
- Mitchell, J.A.; Done, C.; Ward, M.J.; Kynoch, D.; Hagen, S.; Lusso, E.; Landt, H. The SOUX AGN sample: Optical/UV/X-ray SEDs and the nature of the disc. Mon. Not. R. Astron. Soc. 2023, 524, 1796–1825. [Google Scholar] [CrossRef]
- Laor, A.; Netzer, H.; Piran, T. Massive thin accretion discs. II—Polarization. Mon. Not. R. Astron. Soc. 1990, 242, 560–569. [Google Scholar] [CrossRef]
- Antonucci, R. Unified models for active galactic nuclei and quasars. Annu. Rev. Astron. Astrophys. 1993, 31, 473–521. [Google Scholar] [CrossRef]
- Kishimoto, M.; Antonucci, R.; Boisson, C.; Blaes, O. The buried Balmer-edge signatures from quasars. Mon. Not. R. Astron. Soc. 2004, 345, 1065–1092. [Google Scholar] [CrossRef]
- Capetti, A.; Laor, A.; Baldi, R.D.; Robinson, A.; Marconi, A. Spectropolarimetry of low redshift quasars: Origin of the polarization and implications for black hole mass estimates. Mon. Not. R. Astron. Soc. 2021, 502, 5086–5103. [Google Scholar] [CrossRef]
- Gianolli, V.E.; Kim, D.E.; Bianchi, S.; Agís-González, B.; Madejski, G.; Marin, F.; Marinucci, A.; Matt, G.; Middei, R.; Petrucci, P.-O.; et al. Uncovering the geometry of the hot X-ray corona in the Seyfert galaxy NGC 4151 with IXPE. Mon. Not. R. Astron. Soc. 2023, 523, 4468–4476. [Google Scholar] [CrossRef]
- Dovciak, M. The IXPE view on the accreting stellar-mass Black Holes: Measurement of Cyg X-1 X-ray polarization properties in its hard state. In Proceedings of the 31st Texas Symposium on Relativistic Astrophysics, Prague, Czech Republic, 12–16 September 2022. [Google Scholar]
- Kinch, B.E.; Schnittman, J.D.; Noble, S.C.; Kallman, T.R.; Krolik, J.H. Spin and Accretion Rate Dependence of Black Hole X-ray Spectra. Astrophys. J. 2021, 922, 270. [Google Scholar] [CrossRef]
- Yaqoob, T.; Tzanavaris, P.; LaMassa, S. NGC 4388: A test case for relativistic disc reflection and Fe K fluorescence features. Mon. Not. R. Astron. Soc. 2023, 522, 394. [Google Scholar] [CrossRef]
- Schmidt, G.D.; Smith, P.S. Evidence for Polarized Synchrotron Components in Radio-Optical Aligned Quasars. Astrophys. J. 2000, 545, 117–128. [Google Scholar] [CrossRef]
- Kishimoto, M.; Antonucci, R.; Blaes, O. A first close look at the Balmer-edge behaviour of the quasar big blue bump. Mon. Not. R. Astron. Soc. 2003, 345, 253–260. [Google Scholar] [CrossRef]
- Kishimoto, M.; Antonucci, R.; Blaes, O.; Lawrence, A.; Boisson, C.; Albrecht, M.; Leipski, C. The characteristic blue spectra of accretion disks in quasars as uncovered in the infrared. Nature 2008, 454, 492–494. [Google Scholar] [CrossRef]
- Laor, A.; Davis, S.W. Line-driven winds and the UV turnover in AGN accretion discs. Mon. Not. R. Astron. Soc. 2014, 438, 3024–3038. [Google Scholar] [CrossRef]
- Goodman, J. Self-gravity and quasi-stellar object discs. Mon. Not. R. Astron. Soc. 2003, 339, 937–948. [Google Scholar] [CrossRef]
- Huang, X.; Davis, S.W.; Jiang, Y.F. A Bright First Day for Tidal Disruption Event. arXiv 2023, arXiv:2303.17443. [Google Scholar] [CrossRef]
- Ryu, T.; Krolik, J.; Piran, T.; Noble, S.; Avara, M. Shocks Power Tidal Disruption Events. arXiv 2023, arXiv:2305.05333. [Google Scholar]
- Courvoisier, T.J.-L.; Tüler, M. Cascades of shocks in active galactic nuclei and their radiation. Astron. Astrophys. 2005, 444, 417–424. [Google Scholar] [CrossRef]
- Maiolino, R.; Salvati, M.; Marconi, A.; Antonucci, R.R.J. The Ly-edge paradox and the need for obscured QSOs. Astron. Astrophys. 2001, 375, 25–29. [Google Scholar] [CrossRef]
- Hönig, S.F.; Watson, D.; Kishimoto, M.; Gandhi, P.; Goad, M.; Horne, K.; Shankar, F.; Banerji, M.; Boulderstone, B.; Jarvis, M.; et al. Cosmology with AGN dust time lags-simulating the new VEILS survey. Mon. Not. R. Astron. Soc. 2017, 464, 1693–1703. [Google Scholar] [CrossRef]
- Koshida, S.; Minezaki, T.; Yoshii, Y.; Kobayashi, Y.; Sakata, Y.; Sugawara, S.; Enya, K.; Suganuma, M.; Tomita, H.; Aoki, T.; et al. Reverberation Measurements of the Inner Radius of the Dust Torus in 17 Seyfert Galaxies. Astrophys. J. 2014, 788, 159. [Google Scholar] [CrossRef]
- Minezaki, T.; Yoshii, Y.; Kobayashi, Y.; Sugawara, S.; Sakata, Y.; Enya, K.; Koshida, S.; Tomita, H.; Suganuma, M.; Soki, T.; et al. Reverberation Measurements of the Inner Radii of the Dust Tori in Quasars. Astrophys. J. 2019, 886, 150. [Google Scholar] [CrossRef]
- Lyu, J.; Rieke, G.; Smith, P.S. Mid-IR Variability and Dust Reverberation Mapping of Low-z Quasars. I. Data, Methods, and Basic Results. Astrophys. J. 2019, 886, 33. [Google Scholar] [CrossRef]
- Yang, Q.; Shen, Y.; Liu, X.; Aguena, M.; Annis, J.; Avila, S.; Banerji, M.; Bertin, E.; Brooks, D.; Burke, D.; et al. Dust Reverberation Mapping in Distant Quasars from Optical and Mid-infrared Imaging Surveys. Astrophys. J. 2020, 900, 58. [Google Scholar] [CrossRef]
- Lyu, J.; Rieke, G. Infrared Spectral Energy Distribution and Variability of Active Galactic Nuclei: Clues to the Structure of Circumnuclear Material. Universe 2022, 8, 304. [Google Scholar] [CrossRef]
- Barthel, P.D.; Arnaud, K.A. Anomalous radio-loudness of Cygnus A and other powerful radio galaxies. Mon. Not. R. Astron. Soc. 1996, 283, 45–49. [Google Scholar] [CrossRef]
- Ogle, P.M.; Cohen, M.H.; Miller, J.S.; Tran, H.D.; Fosbury, R.A.E.; Goodrich, R.W. Scattered Nuclear Continuum and Broad Hα in Cygnus A. Astrophys. J. 1997, 482, L37–L40. [Google Scholar] [CrossRef]
- Antonucci, R.; Barvainis, R. Narrow-Line Radio Galaxies as Quasars in the Sky Plane. Astrophys. J. Lett. 1990, 363, L17. [Google Scholar] [CrossRef]
- Lopez-Rodriguez, E.; Kishimoto, M.; Antonucci, R.; Begelman, M.C.; Globus, N.; Blandford, R. On the origin of radio-loudness in active galactic nuclei using far-infrared polarimetric observations. Astrophys. J. 2023, 951, 31. [Google Scholar] [CrossRef]
- Struve, C.; Conway, J.E. An H I absorbing circumnuclear disk in Cygnus A. Astron. Astrophys. 2010, 513, A10. [Google Scholar]
- Carilli, C.L.; Perley, R.A.; Perley, D.A.; Dhawan, V.; Decarli, R.; Evans, A.S.; Nyland, K. A 4 kpc Molecular Gas Lane in Cygnus A. Astrophys. J. 2022, 937, 106. [Google Scholar] [CrossRef]
- Maloney, P.R.; Begelman, M.C.; Rees, M.J. Radiative Excitation of Molecules near Powerful Compact Radio Sources. Astrophys. J. 1994, 432, 606. [Google Scholar] [CrossRef]
- Bagul, A.; Ogle, P.; Antonucci, R.; Maloney, P.; Lopez Rodriguez, E. Cygnus A Obscuring Torus: Ionized, Atomic or Molecular? Mon. Not. R. Astron. Soc. 2023, submitted.
- Blandford, R.; Globus, N. Ergomagnetosphere, ejection disc, magnetopause in M87—I. Global flow of mass, angular momentum, energy, and current. Mon. R. Astron. Soc. 2022, 514, 5141–5158. [Google Scholar] [CrossRef]
Figure 1.
Total flux spectrum of the narrow-line radio galaxy 3C234.

Figure 2.
The smoothed unnormalized Stokes parameters and count spectrum of 3C234.

Figure 3.
NGC1068 ultraviolet polarized flux scaled by 1/0.16 and plotted over total flux; see text.
Figure 3.
NGC1068 ultraviolet polarized flux scaled by 1/0.16 and plotted over total flux; see text.

Figure 4.
Broadband image of 3C256 obtained by S. Djorgovski and H. Spinrad; see Dey et al. (1996) [15] for details.
Figure 4.
Broadband image of 3C256 obtained by S. Djorgovski and H. Spinrad; see Dey et al. (1996) [15] for details.

Figure 5.
Comparison of the rest frame UV continuum spectra of 3C256 and NGC1068 (from Antonucci, Hurt, and Miller, 1994 [16]). The ordinate is labeled with the flux density scales for NGC1068 and 3C256 on the left and right axes, respectively. Note that the spectrum of 3C256 is sampled in a aperture (), whereas the spectrum of NGC1068 is from a nuclear region of size (). See Dey et al. (1996) [15] for additional details.

Figure 6.
Reddening curves from Gaskell et al. (2004) [24] for composite spectra of various values of radio-core dominance. The filled triangles are from comparing with , and the filled circles are from comparing with CSS. The open circles represent average BLR extinction values between face-on and edge-on (; CSS) objects. Theoretical reddening curves derived from CCM89 for and 3.1 are shown as dashed and solid curves, respectively.

Disclaimer/Publisher’s Note: The statements, opinions and data contained in all publications are solely those of the individual author(s) and contributor(s) and not of MDPI and/or the editor(s). MDPI and/or the editor(s) disclaim responsibility for any injury to people or property resulting from any ideas, methods, instructions or products referred to in the content. |
© 2023 by the author. Licensee MDPI, Basel, Switzerland. This article is an open access article distributed under the terms and conditions of the Creative Commons Attribution (CC BY) license (https://creativecommons.org/licenses/by/4.0/).
Share and Cite
MDPI and ACS Style
Antonucci, R.R.J. A Walk through AGN Country—For the Somewhat Initiated! Galaxies 2023, 11, 102. https://doi.org/10.3390/galaxies11050102
AMA Style
Antonucci RRJ. A Walk through AGN Country—For the Somewhat Initiated! Galaxies. 2023; 11(5):102. https://doi.org/10.3390/galaxies11050102
Chicago/Turabian StyleAntonucci, Robert R. J. 2023. "A Walk through AGN Country—For the Somewhat Initiated!" Galaxies 11, no. 5: 102. https://doi.org/10.3390/galaxies11050102
Note that from the first issue of 2016, this journal uses article numbers instead of page numbers. See further details here.