1. Introduction
In modern gamma ray astronomy, the instruments are advanced enough to let us reliably associate gamma ray emissions with astronomical sources and model the processes that lead to said gamma ray emissions. Experiments offer a high degree of precision not only in determining the spatial origin of the high-energy photons but also their energies. We can probe some of the most violent processes in the universe such as active galactic nuclei (AGN) and supernovae for properties such as their morphology and energy spectra.
Since huge amounts of energy are required to accelerate charged particles to ultra-relativistic energies and to produce the cosmic and gamma rays detectable at cosmological distances, the astrophysical processes required to generate high-energy (HE) and very-high-energy (VHE) gamma rays are extremely violent in nature—in many cases unimaginable amounts of energy (> ergs) are released in relatively short periods of time. A significant fraction of the kinetic/gravitational energy released (sometimes explosively) is transferred into non-thermal particles. Some examples of processes and astrophysical objects responsible for such phenomena are gamma-ray-bursts (GRBs), fast radio bursts (FRBs); novae and supernovae; flares from sources such as AGN; magnetars; and microquasars.
Such sources showing variability in the intensity of their emissions over short time scales are called transients. For some phenomena such as GRBs, it took decades, but in the end, lower-energy counterparts were found, and in many cases, they can now be associated with a host galaxy, leading to a better understanding of these events [
1]. Unlike GRBs [
2,
3], there are no known VHE counterparts to transients such as FRBs as of now, even though the rate of FRBs expected in the entire sky per day is estimated by the CHIME/FRB telescope to be
[
4]. In this context, especially of interest are short-timescale phenomena associated with compact objects such as neutron stars, with the short timescales corresponding to their small size of
, and TeV-scale counterparts are predicted by some models, e.g., Ref. [
5].
The limited amount of telescope observation hours available per year means that observing a potential transient source for hours in hopes of catching a millisecond signal is an inefficient strategy. Moreover, a single telescope (or array of telescopes) by itself has neither a field of view that is large enough to justify such observations nor a fast enough telescope slew speed (pointing towards a new position takes from tens of seconds up to a few minutes) to react and observe such signals in time, since the bursts are already over by the time an alert is received.
Recent advances in gamma ray astronomy have led to ground-based telescopes such as Imaging Atmospheric Cherenkov Telescopes (IACTs) with high spatial resolutions and hardware that can collect data fast enough to allow an analysis of individual photons on microsecond timescales [
6], as well as space-based experiments such as the Fermi gamma ray space telescope with a relatively high uptime [
7]. Follow-up programs established among different experiments allow observations in scenarios that previously would have gone unnoticed—such as the one that allowed follow-up observations of an actively flaring magnetar by H.E.S.S after it was detected through Swift-BAT and CHIME/FRB [
8].
The short (millisecond) timescales associated with phenomena such as FRBs, combined with the high likelihood of observing them serendipitously, mean that archival searches are the best way of looking for them. Using the appropriate methods, we can thus search for clusters of gamma photons corresponding to the above transients on millisecond to hundred-second timescales. There are already some different methods that have been developed to search for clusters of events, for both wide fields of view [
9] and Cherenkov telescopes [
10].
In this context, a more general transient search tool
1 was developed to search data from different gamma ray telescopes for transient phenomena over arbitrary timescales— it recursively scans a given field of view for clusters of photons within user-defined time and angular-separation intervals. It is based on the open-source python package
Gammapy (V1.0) [
11,
12], which was developed to read, analyze, and simulate gamma-ray telescope data. For these reasons and the simple framework it provides for reading and analyzing data from many different telescopes (which translates to the tool being compatible with them as well),
Gammapy was chosen to serve as the foundation for the transient search tool. The main features and methodology of the developed tool are presented in this work, along with an analysis of open gamma ray telescope data performed using it. An advantage of using
Gammapy is that a tool based on it will work with a majority of gamma ray telescopes without requiring any system-specific modifications, as long as the data are available in the appropriate format [
13].
2. Transient Search Tool
Note that the burst-like emission that is of interest here has an inherently different origin from the gamma ay emission from a steady gamma ray source. We would therefore expect the emissions from short-timescale transients to be detectable in the form of correspondingly short-timescale clusters of photons from the source. The easiest variant of this would be to simply look at the gamma ray doublets, i.e., the time differences and angular separations between consecutive events of the event list in question. While this method is applicable for detecting some burst-like signatures, a more generalized method, including e.g., clusters with a higher number of events, allows us to search for a larger variety of short transient signatures. Such clusters will henceforth be referred to as multiplets, or
N-multiplets, where
N is the total number of events in the cluster.
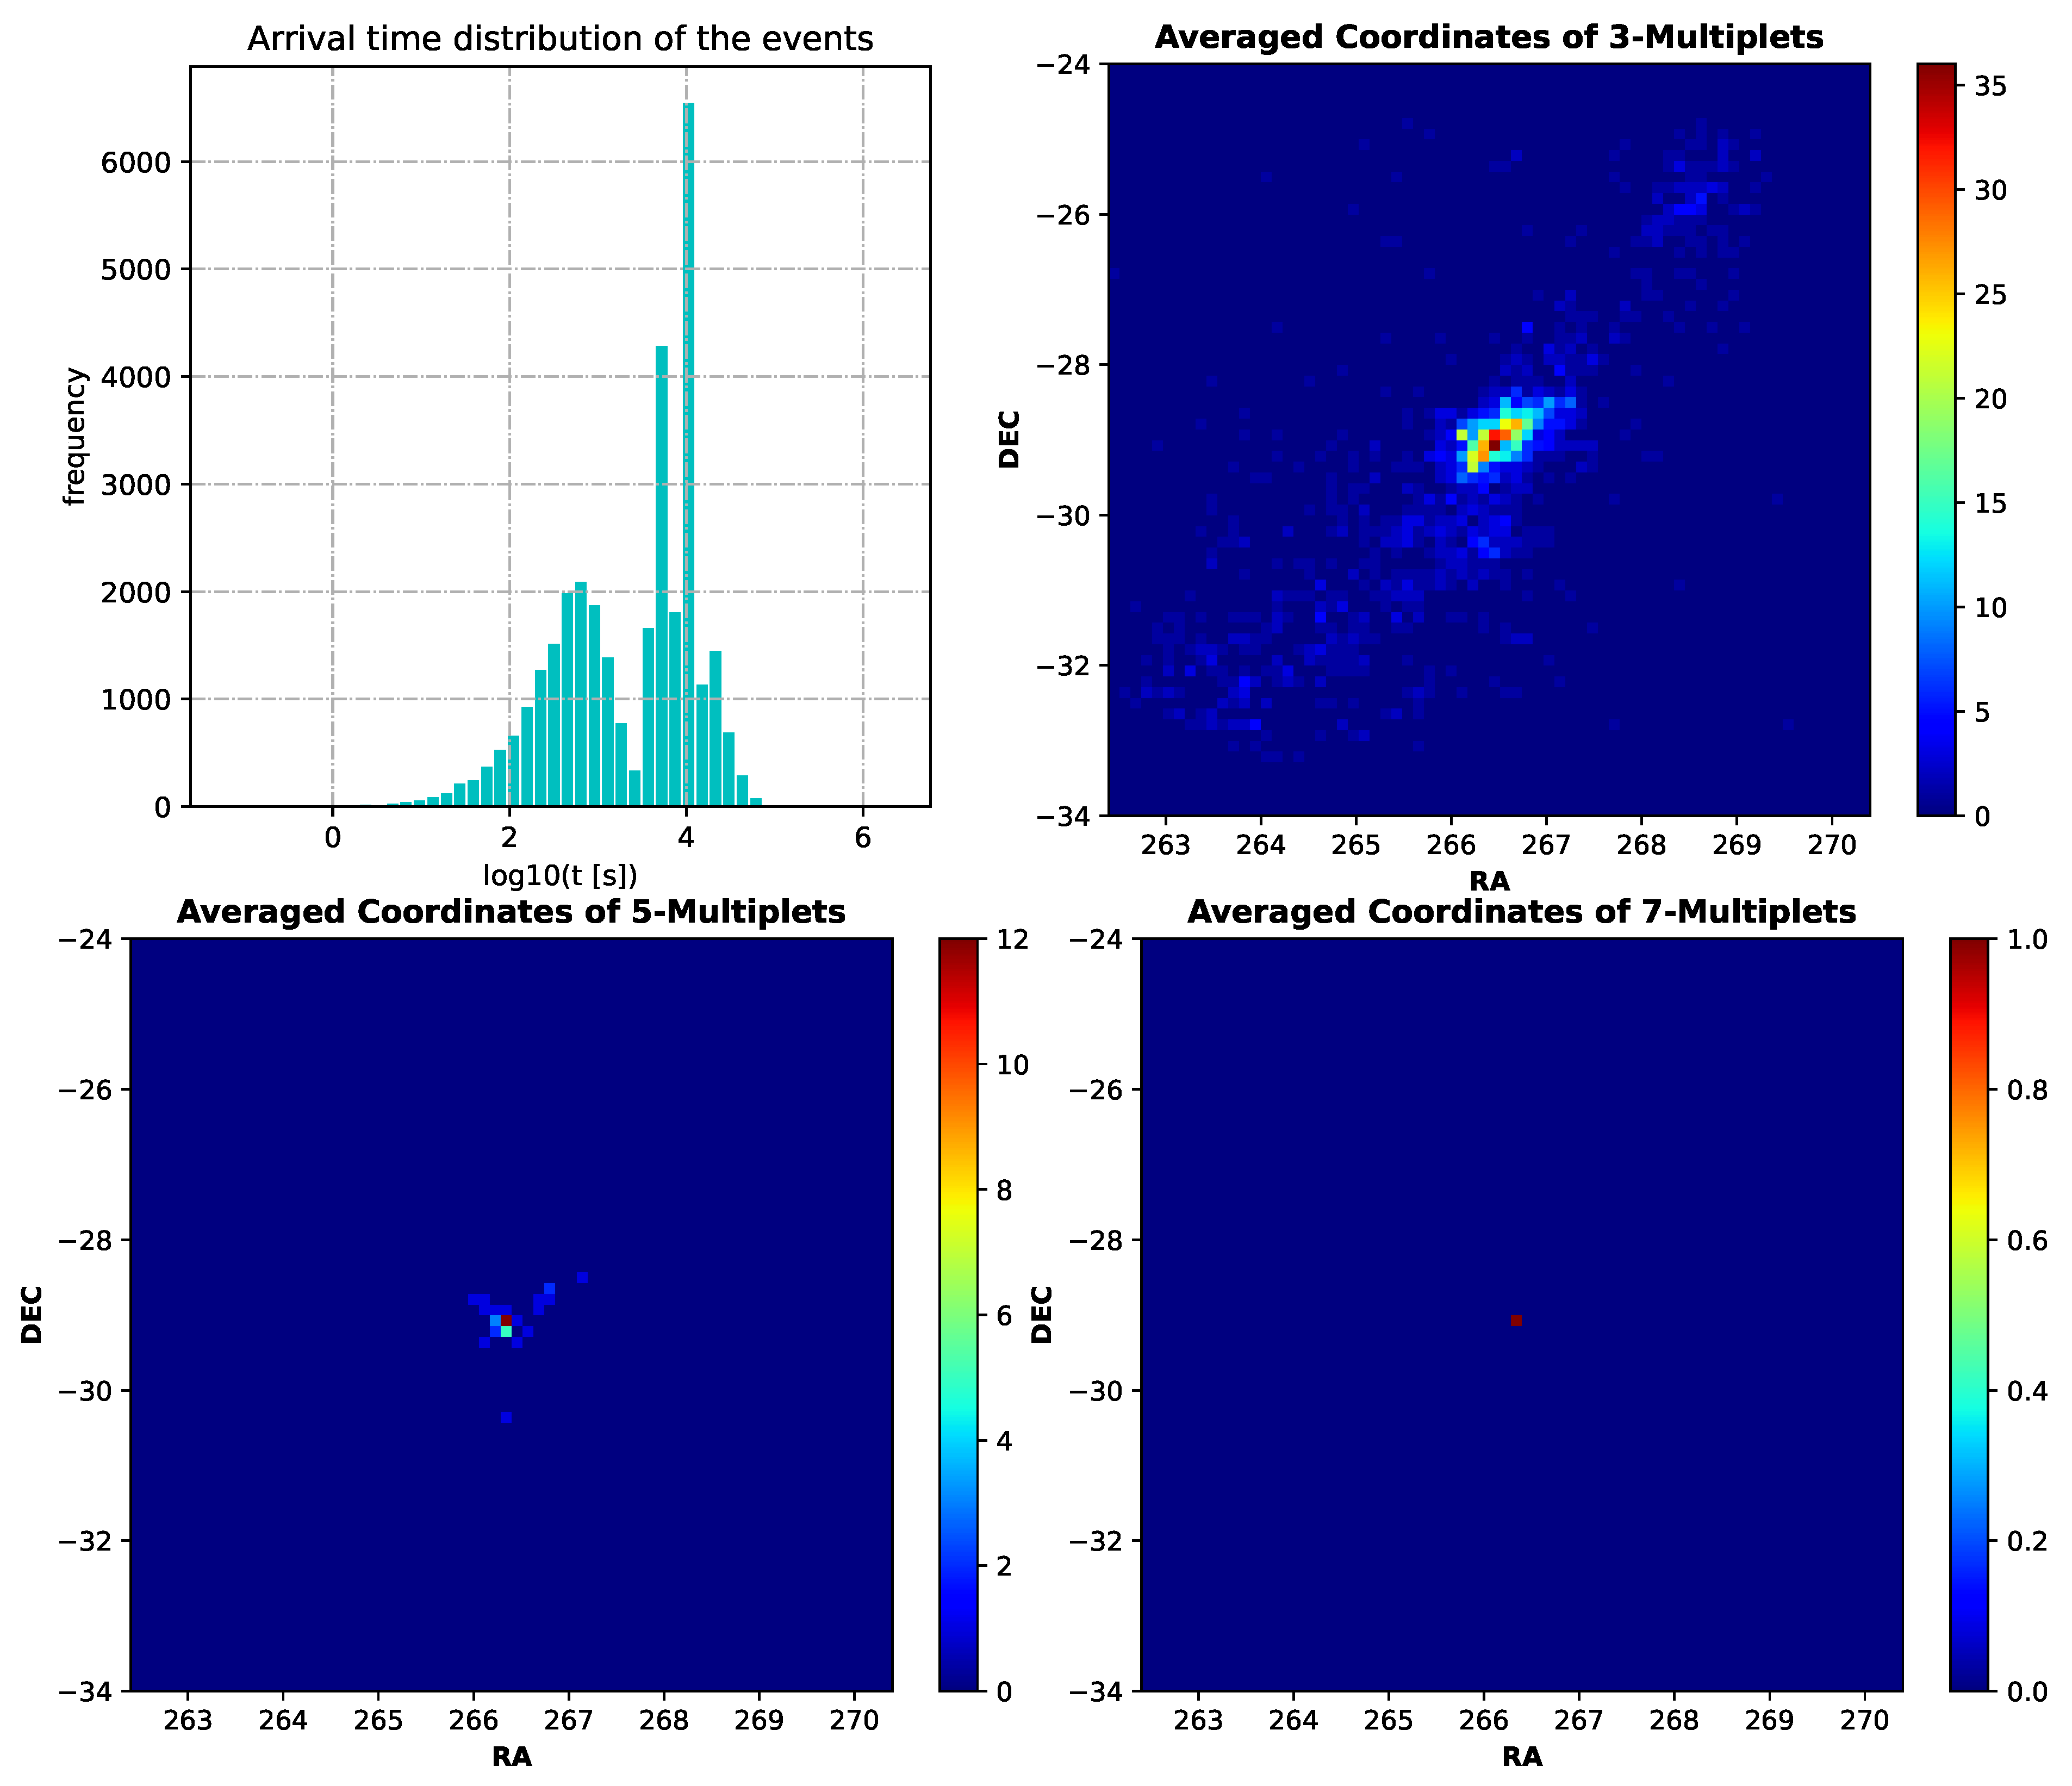
Figure 1 shows some examples for multiplet distributions in the Fermi-LAT 3HFL dataset around the Galactic center.
2.1. The Concept
Since we are only interested in photons from the transient, any gamma quanta (and clusters thereof) not originating from it are considered to be from the background, which can be approximated as multiple stacked Poissonian sources. A method generalized to N-multiplets also has the added benefit of being more robust against such background fluctuations—since larger N-multiplets (e.g., 4-multiplets compared to doublets) are expected less often than smaller ones when considering a Poissonian background. The tool described here can search for clusters of an arbitrary number of photons over similarly arbitrary timescales and angular-separation scales. The following aims to give an overview of the transient search algorithm:
We begin by selecting all events within a specified radius of the source/pointing coordinates. This gives a filtered list of gamma events with many features—we are, however, only interested in the timestamps and coordinates of the events. The list is ordered by time, and two vectors, and , are extracted for the timestamps and event coordinates respectively.
We use the
and
to generate two matrices:
and
. Each element of these matrices corresponds to the time difference and angular separation between a pair of events, respectively—the matrices contain this information for all pairs of events in our list.
where
represents the coordinates of the
i-th event and
represents the angular separation between events
i and
j. As the matrices are anti-symmetric about the diagonal, we can consider only their upper triangular parts without any loss of information, reducing the amount of computer memory necessary in the case of large lists.
We select the elements such that and . If we were searching for doublets, we have extracted them now as pairs of events. and are the user-defined time and angular separation thresholds.
If looking for higher
N multiplets, each doublet is compared with each event taking place after its second constituent event—giving us candidates for triplets. Each candidate is evaluated such that
and the diameter
of the smallest circle enclosing (drawn according to [
14]) all three constituent events fulfills
. This is repeated till all triplets are found.
The last step is repeated recursively (i.e., from doublets to triplets to 4-multiplets and so on) till all N-multiplets with the user-specified N-value are found. The results are recorded in a table.
2.2. Simulating Background Multiplets
The temporal and spatial distributions of the candidate events in the field of view must be modeled in order to simulate multiplets arising from background fluctuations for a given field of view. The temporal part of this problem is handled as follows: the arrival time distribution of gamma-like cosmic ray background events that pass all selection cuts and are included in the event list is assumed to be Poissonian—an appropriate assumption provided the background rate is steady. In situations that can be described by a Poisson distribution, the time difference
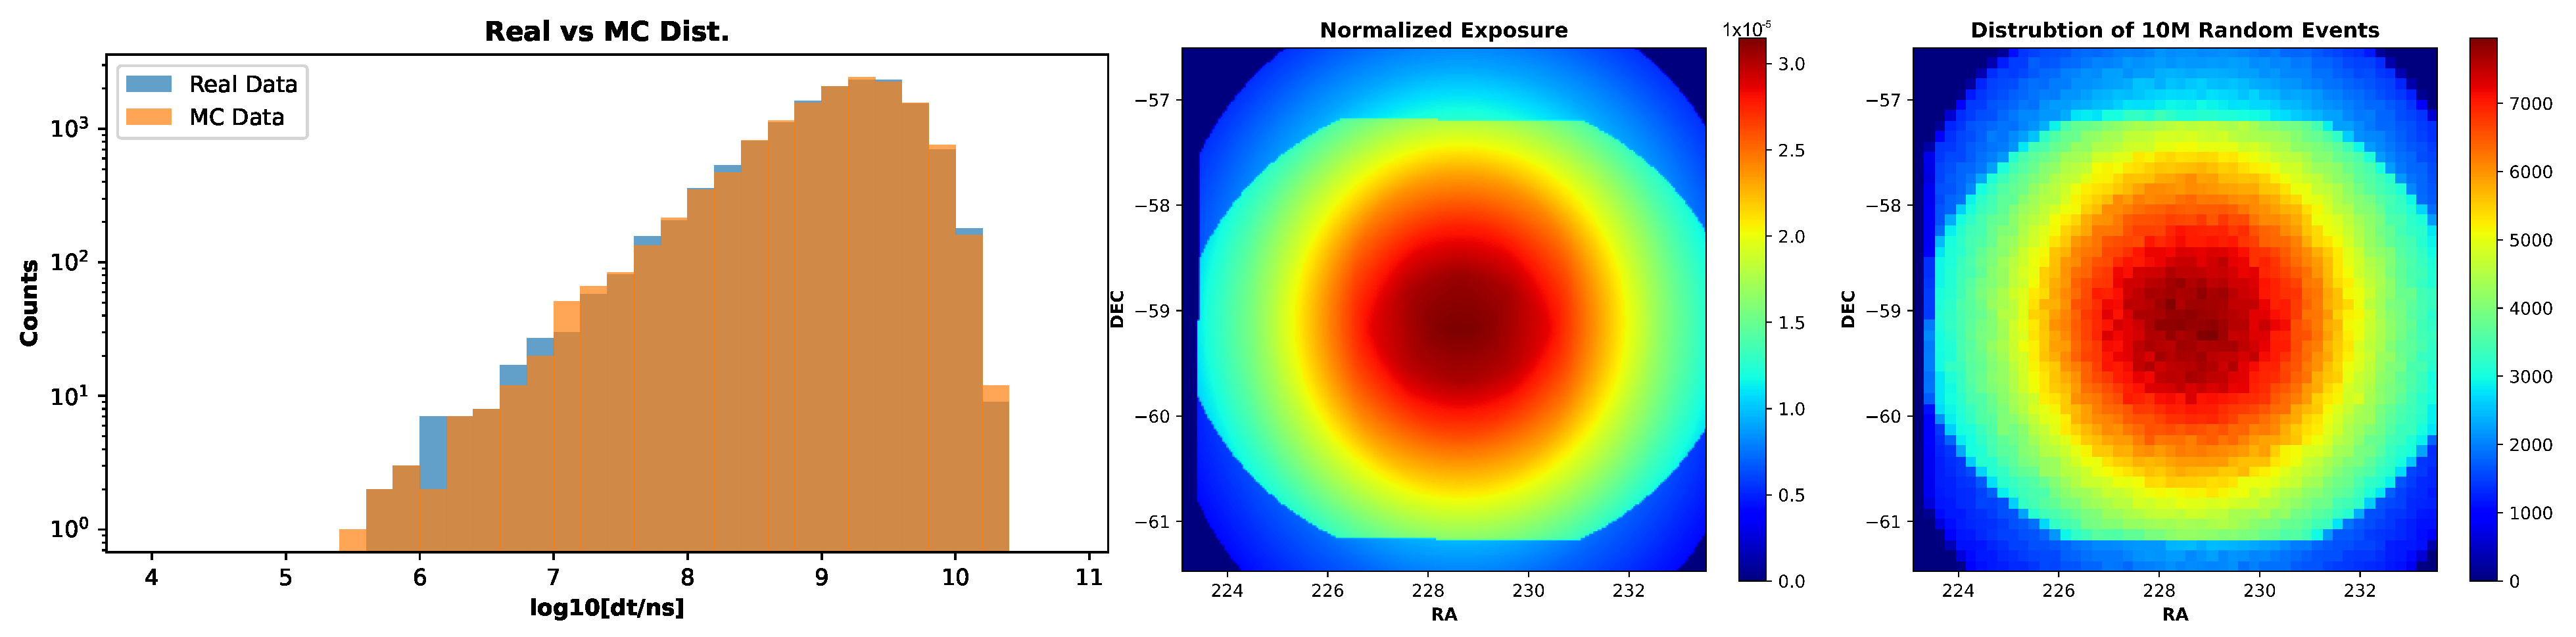
between consecutive events follows an exponential distribution; hence, we can then simply fit an exponential distribution to the
-distribution of our real data. Once the fit parameters have been calculated, we can generate samples with an arbitrary number of timestamps according to this distribution. An example plot comparing these distributions can be seen in
Figure 2. Note that we can simulate multiplets from only the background this way since simulating multiplets from gamma ray sources requires one to consider the source spectrum and morphology—a work currently in progress.
The spatial coordinates for the simulated events are generated using the exposure map for the source. Gammapy produces exposure maps that give the effective area multiplied by the observation time for each pixel in the field of view. The exposure map is thus normalized and interpreted as a probability-distribution function for the individual events’ coordinates, with the higher values corresponding to higher probabilities of events being situated there. Then, we can use rejection sampling over this 2D distribution to generate lists of simulated event coordinates of the desired size.
Now, we may combine the generated timestamps and coordinates to obtain simulated event lists. In order to be consistent with the real data, the number of “observation” runs in the simulated dataset is the same as that for the real data, and each simulated run contains the same number of events as the corresponding real run. We may then generate a few thousand simulated datasets and use the transient search tool on them, using search parameters similar to that for the real multiplets we are interested in. Once the scan for each dataset is completed, we store the (i) total time elapsed () and the (ii) diameter of the minimum enclosing circle () for the recorded multiplets.
Finally, the collected data are combined in 2D histograms to give us the
vs.
distribution of the simulated multiplets. Dividing the values of each bin in said histograms with the number of total simulated datasets will then give us a histogram where the value of each bin—denoted
—corresponds to the number of multiplets with that bin’s
and
values expected to be observed by random chance. We may also integrate over the
and
bins, giving us a histogram where the values of a bin correspond to the
number of multiplets expected with
and
values less than or equal to that of the bin.
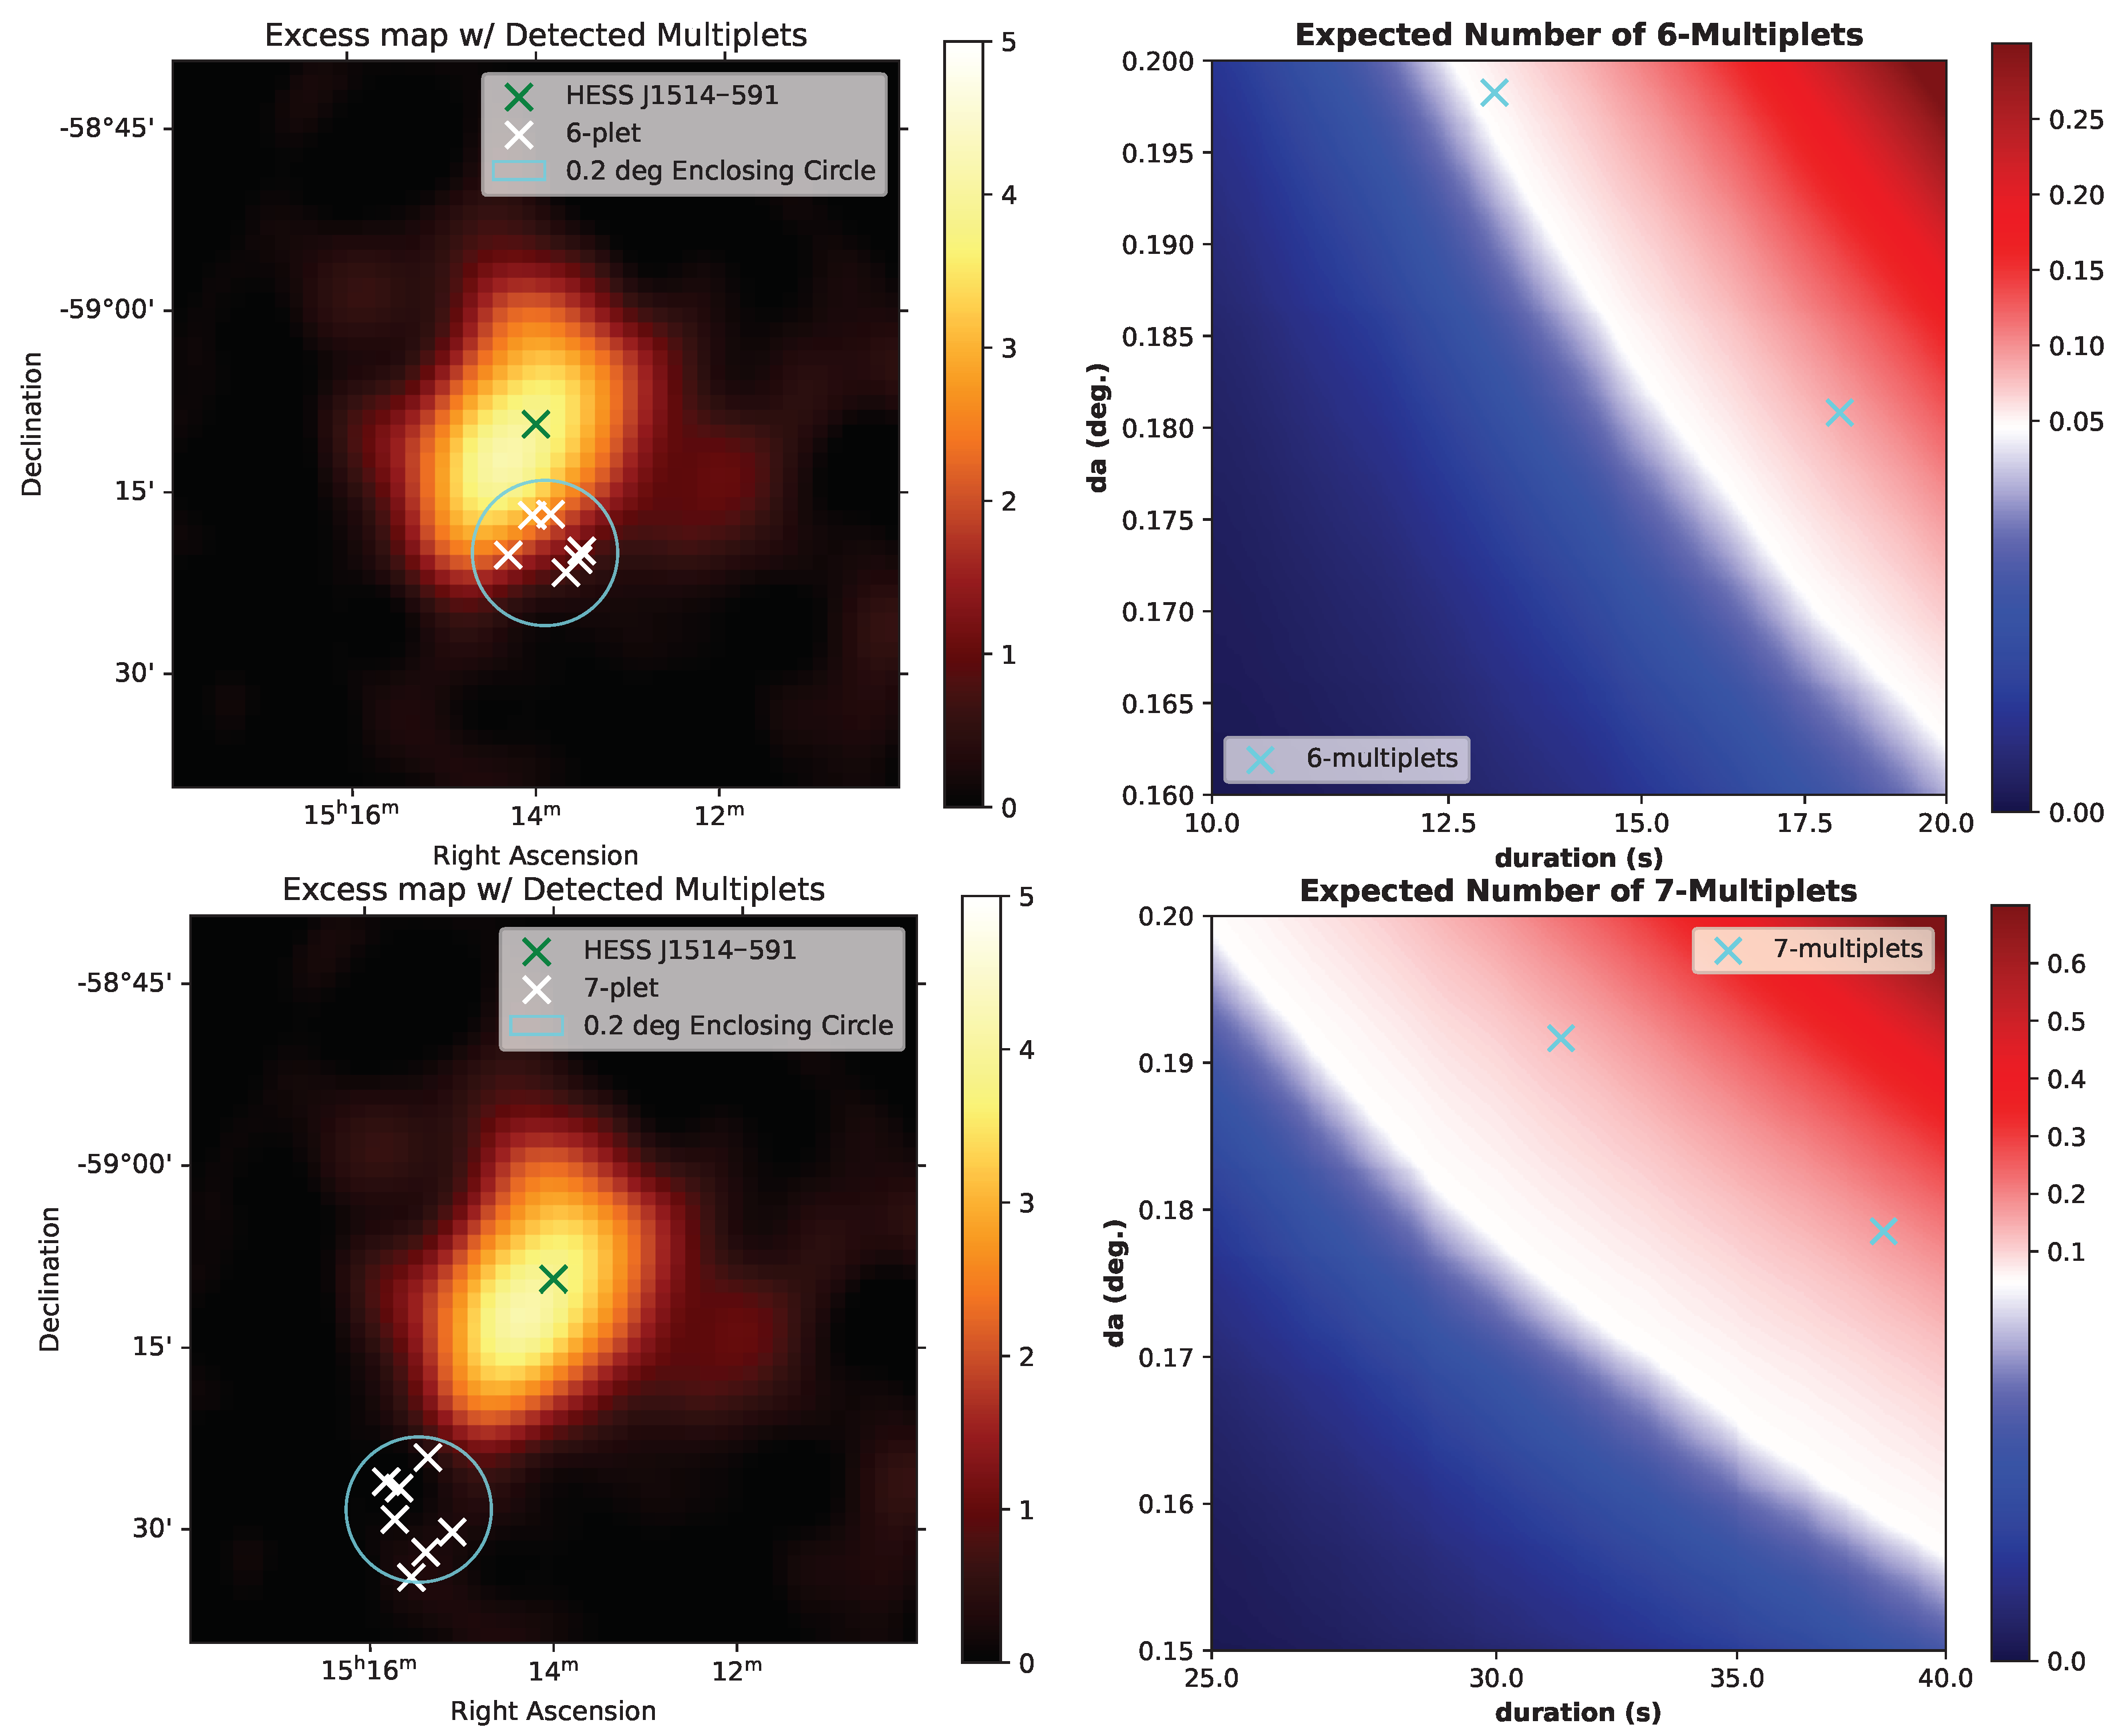
Figure 3 shows two examples of these histograms for a couple of multiplet search configurations.
If we consider the distribution of the number
N of multiplets of a given multiplicity as a function of the chosen time and angular separation thresholds
and
, respectively, then
and
are defined as:
The probability can be estimated as the fraction of simulations in which at least one multiplet with and values less than that of the real multiplet is recorded. Note that the final significance should be estimated with proper trial correction.
2.3. A Simple Estimate for Multiplet Significance Using Poissonian Probability
To estimate the chances of multiplets arising from fluctuations, we assume the arrival times of background events are Poisson-distributed and similarly that the arrival time of the photons from the region of interest follows Poisson statistics as well. The probability of finding a burst with at least an
-multiplet is then given by
where the expected rate
, defined as a rate of gamma quanta
after normalization using burst waiting time. The rate of gamma quanta
can be derived from the counts map produced by the
Gammapy analysis of the corresponding observation run, assuming that the source’s (non-burst) emission has been constant in its rate for the whole observation run. If the resulting probability is low, the multiplet exhibits a large deviation from the expected background rate.
It is worth noting that the probability of bursts with duration is estimated with large uncertainty, since waiting can be defined in a different way, as just , or as with padding proportional to the average times between events, which give probabilities varying in orders of magnitude. In our framework, we chose a conservative approach and add padding equal to the waiting time for events before and after the burst.
Based on this approach, we can automate a method of finding the most significant multiplet present in the observation data for the user-specified time and angular-distance thresholds. It is summarized here in a schematic way:
Use the transient search tool to scan the event list and find the highest order of multiplets within the thresholds and chosen as input parameters.
Perform a Gammapy analysis on the observation runs that contain the interesting multiplets. Derive from the Gammapy excess map produced, namely the average rate of gamma quanta that have arrived in the selected radius in the specific run.
Calculate the probability of the multiplets found to be generated by a background fluctuation using Equation (
3).
Scan the event list with decreasing N and in order to search for lower-order multiplets with an even lower probability of occurring from simple fluctuations.
Repeat the procedure, while at each step calculating the corresponding probability of the multiplet with the shortest duration.
Using this simple framework, we can make a selection of candidates with high pre-trial significance for further investigation using the Monte Carlo approach.
3. Example Results
This sections aims to demonstrate the usage of the tool in two different scenarios relevant to the search for gamma ray transients: the Fermi-LAT [
7], a space telescope with a lower gamma-photon rate and spatial accuracy but also a much lower background, and H.E.S.S., a ground-based IACT with better spatial accuracy but a much higher background. We analyze sample data from the two different experiments and search for the multiplets arising from background fluctuations using the methods described above.
Note that this analysis is only intended as a proof of concept for the developed tool and does not aim to claim any detections. The tool is intended to be used with data that have been properly processed by the appropriate analysis pipelines, including but not limited to reconstruction, data-quality cuts, background rejection of both gamma- and hadron-like events, etc.
3.1. Fermi-LAT 3HFL Galactic Center
A prepared dataset
2 corresponding to the Fermi-LAT 3FHL analysis [
16] was analyzed with the tool, and some example results are presented here. It contains 32,843 gamma-photons with energies from 10 GeV to 2 TeV, with an average event rate of 0.1 mHz.
Examples of the multiplets found by the tool within
of the source and for different search configurations are plotted on 2D histograms of their sky coordinates in
Figure 1. Triplets, 5-multiplets, and 7-multiplets are shown in the top right, bottom left, and bottom right panels respectively, all of them found with
and
s.
Even though only one 7-multiplet was found for this parameter choice, its statistical significance was not evaluated. In fact, since the Fermi-LAT dataset does not come in observation runs, it is not suitable for the statistical analysis described in
Section 2.3. The distribution of the waiting time of the events shown in the top left panel of
Figure 1 is clearly bimodal, which implies a lack of constant exposure to the galactic center. This is due to the orbiting of the satellite (e.g., interruptions due to occultation from the Earth, flying over the South Atlantic Anomaly, the precession of the orbit), the dead time of the instruments, and bad time intervals. Therefore, in order to perform a statistical analysis of the multiplets found, one would need to split the data in order to correctly derive the rate of gamma quanta detected by the instrument, while in the given dataset, the observational time for the galactic center is not homogeneous.
While it is not in the purpose of this work to split the Fermi-LAT 3FHL dataset to perform such analysis, the aim of showing how the tool works with data coming from different gamma ray telescopes is already achieved with the example shown above.
3.2. H.E.S.S. DL3 DR1 Data
The H.E.S.S. collaboration publicly released a small dataset to facilitate the establishment of open-source, high-level data [
15]. Basic methods were used for event reconstruction and gamma–hadron separation when generating this dataset [
17], such that the spatial accuracy is lower (and the point spread function larger) than the actual H.E.S.S. telescope and background contamination is likely. However, this is perfectly acceptable for demonstrating how the tool would work with properly prepared data from an IACT. Here, we analyze data consisting of 20 observation runs of the source HESS J1514–591 (MSH 15–52) as an example of IACT data compatible with the transient search tool. We present example results using the search configurations (i) 6-multiplets within 20 s and (ii) 7-multiplets within 40 s, with both searches limited to a maximum enclosing circle of diameter
corresponding to the (relatively high) point spread function of the open dataset.
As an example of a transient analysis, we consider two examples, the shortest 6- and 7- multiplets found in the dataset. The method discussed in
Section 2.2 was used to estimate the probability of the multiplets arising from background fluctuations, with
simulations performed corresponding to each multiplet’s search configuration:
A six-multiplet in 13 s, with a
of
. At least one multiplet with
and
values less than that of this “real” multiplet is recorded in 3.91% of the simulations. This is visualized in the upper panel of
Figure 3. Using the method described in
Section 2.3, we calculate the probability of observing this number of photons in the multiplet’s region and duration from background fluctuations to be less than 5.2% before trial correction.
A seven-multiplet in 31.3 s, with a
of
. At least one multiplet with
and
values less than that of this “real” multiplet is recorded in 11.5% of the simulation. This example is visualized in the lower panel of
Figure 3. Using the method described in
Section 2.3, we calculate the probability of observing this multiplet from background fluctuations being less than 9.7% before trial correction.
4. Discussion
Modern gamma ray telescopes, including IACTs, operate at high temporal resolutions and have large enough fields of view to in principle allow the detection and analysis of millisecond-timescale transient events such as magnetar flares. Recent advancements in the field, such as (i) the detection of GeV burst activity via Fermi-LAT [
18] and (ii) the establishment of trigger and follow-up programs among different telescopes (such as the one that allowed follow-up observations of an actively flaring magnetar by H.E.S.S after it was detected by Swift-BAT and CHIME), respectively, for reference demonstrate the potential of gamma ray astronomy to contribute to our knowledge of the physics behind such short-timescale phenomena. The areas with the larger detection of next-generation experiments such as CTA [
19] will allow us to probe the gamma-ray emission from such transients with much better sensitivity.
Although great software packages such as Gammapy are available for analyzing gamma-ray telescope data, there is a lack of tools specializing in the analysis of transient events. In this context, a transient search tool based on Gammapy was developed. To summarize, it searches for clusters (called multiplets) of photons such that all photons lie within a user-specified time interval and angular separation with respect to each other. Since the processing of each observation run is independent, simultaneous parallel processing of observation runs has also been implemented.
To estimate the probability of detecting such multiplets from background fluctuations by random chance, a simple method for simulating background multiplets was developed: the real data’s time distribution is estimated using an exponential fit, and their spatial distribution is approximated by rejection sampling of coordinates from the exposure map. Since this method is based on the exposure maps neglecting the spectrum and morphology of the source, it will have a tendency to overestimate multiplet probabilities when analyzing especially strong gamma-ray sources. It is therefore only valid for regions with potential sources featuring low signal-to-noise ratios; both conditions are usually fulfilled in extra-galactic fields of view. Thus, the tool may already be used for the analyses of extragalactic regions in its current stage of development. In order to simulate background multiplets from a strong source, the sources themselves must be modeled using their known morphology and energy spectra, for example, using the spatial and spectral models available with
Gammapy3.
Note that the method presented here is only intended to search large datasets for burst-like clusters of events and find the candidates worth further study, using the probability of their originating from background fluctuations as a criterion. Systematic errors of the instruments themselves are not taken into account—the analyses presented above used the average of the telescopes’ point-spread function (PSF) as the diameter of the smallest circle enclosing all events. The PSF is optimal for this because (i) if the maximum diameter of the smallest enclosing circle is chosen to be much smaller than the PSF, only part of the burst’s events will be contained in it, and (ii) if the maximum diameter is too big, then we are effectively integrating over the background as well. Taking the exact PSF into account (e.g., by convolution), however, would slow down the search process due to increased computation complexity, which is intended to be as fast as possible. Furthermore, the PSF is not necessarily symmetric, in which case it cannot be simply parametrized as an analytical function as energy. A possible approach to taking systematics into account and obtaining a localization contour of the multiplet is presented in Ref. [
18].
The methodology outlined above was used to perform a short-timescale analysis of public data from the Large Area Telescope onboard the Fermi satellite and H.E.S.S. DL3 DR1 data as a proof of concept. Two multiplets found in the H.E.S.S. data were subsequently compared with simulations to estimate the probability of observing them from background fluctuations. The results for the multiplet candidates we present are consistent with background fluctuations.
Future applications of the tool include blind sky searches for FRBs and magnetar bursts, short-timescale analyses of galactic magnetars, and searches for bursts from strong VHE gamma-ray emitters like the galactic center and the crab nebula. The appearance of bugs and issues cannot be avoided at the initial stages of a project such as this, and the issues tracker in github can be used to facilitate communication with the tool’s first adopters. Future versions of the tool will aim to resolve some of the limitations mentioned above and better integrate the tool into the framework of Gammapy.


