
Discovering New B[e] Supergiants and Candidate Luminous Blue Variables in Nearby Galaxies
 , , , , and
Abstract
:1. Introduction
2. Materials and Methods
2.1. Galaxy Sample
2.2. Target Selection
2.3. Observations
2.4. Spectral Classification
3. Results
3.1. Statistics
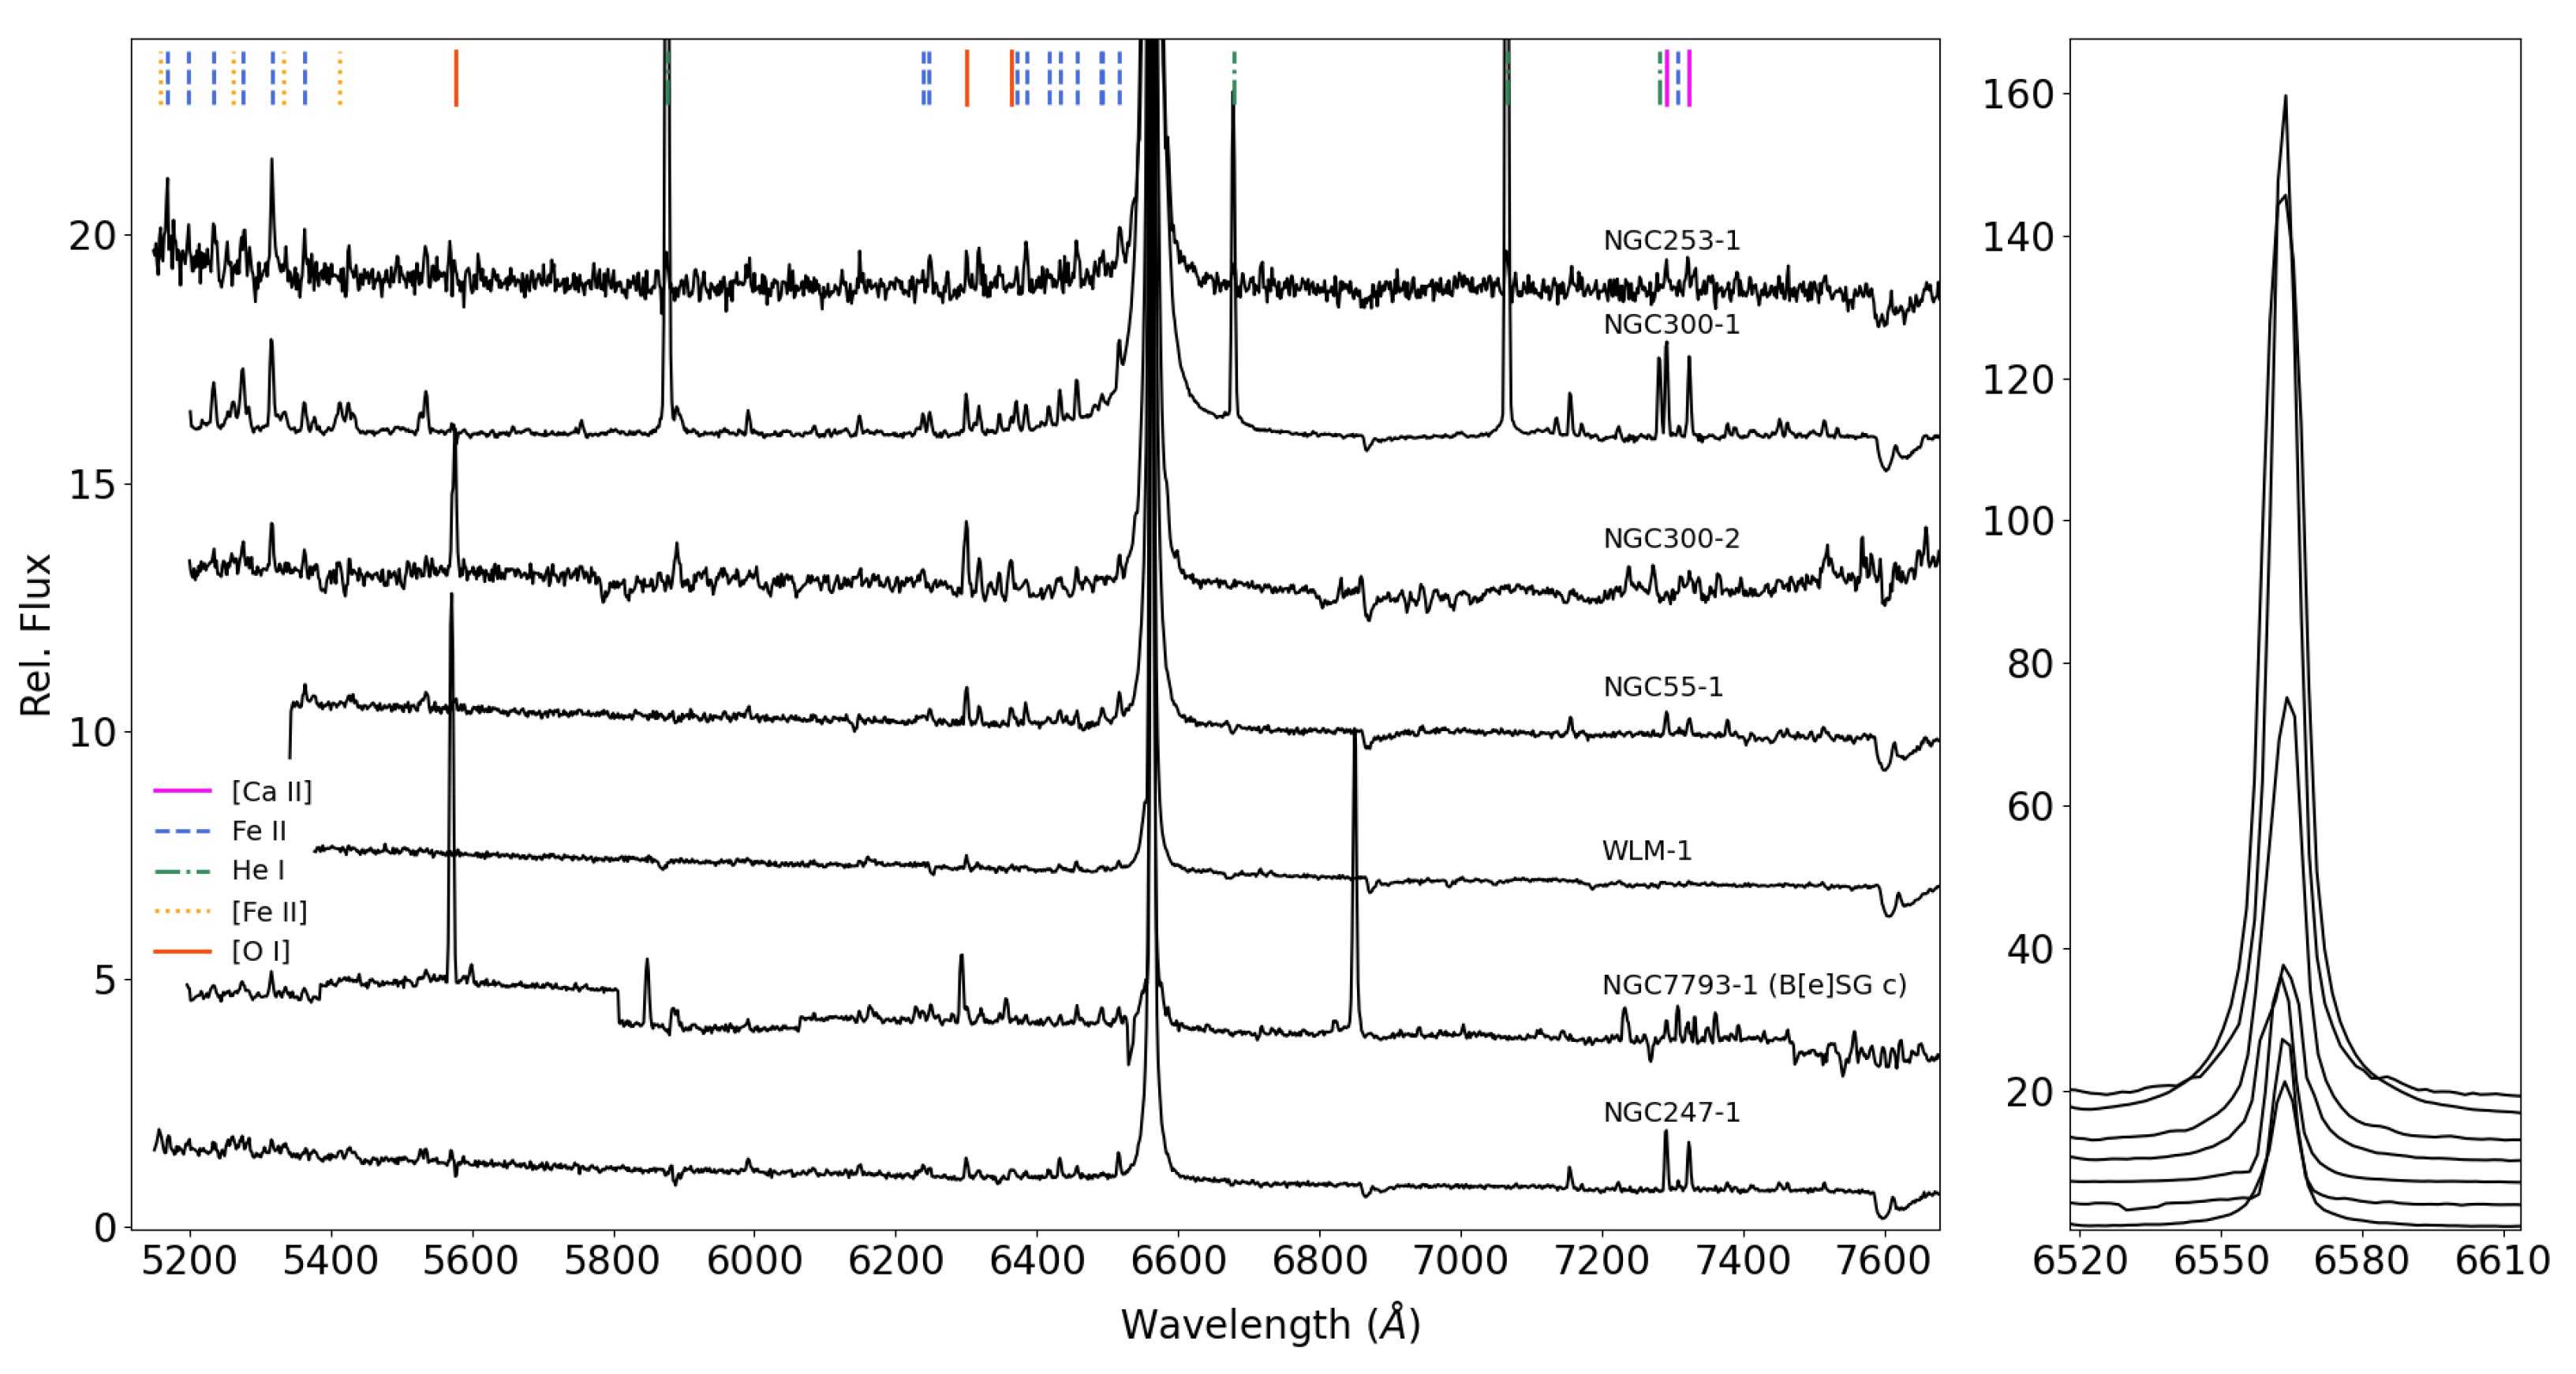
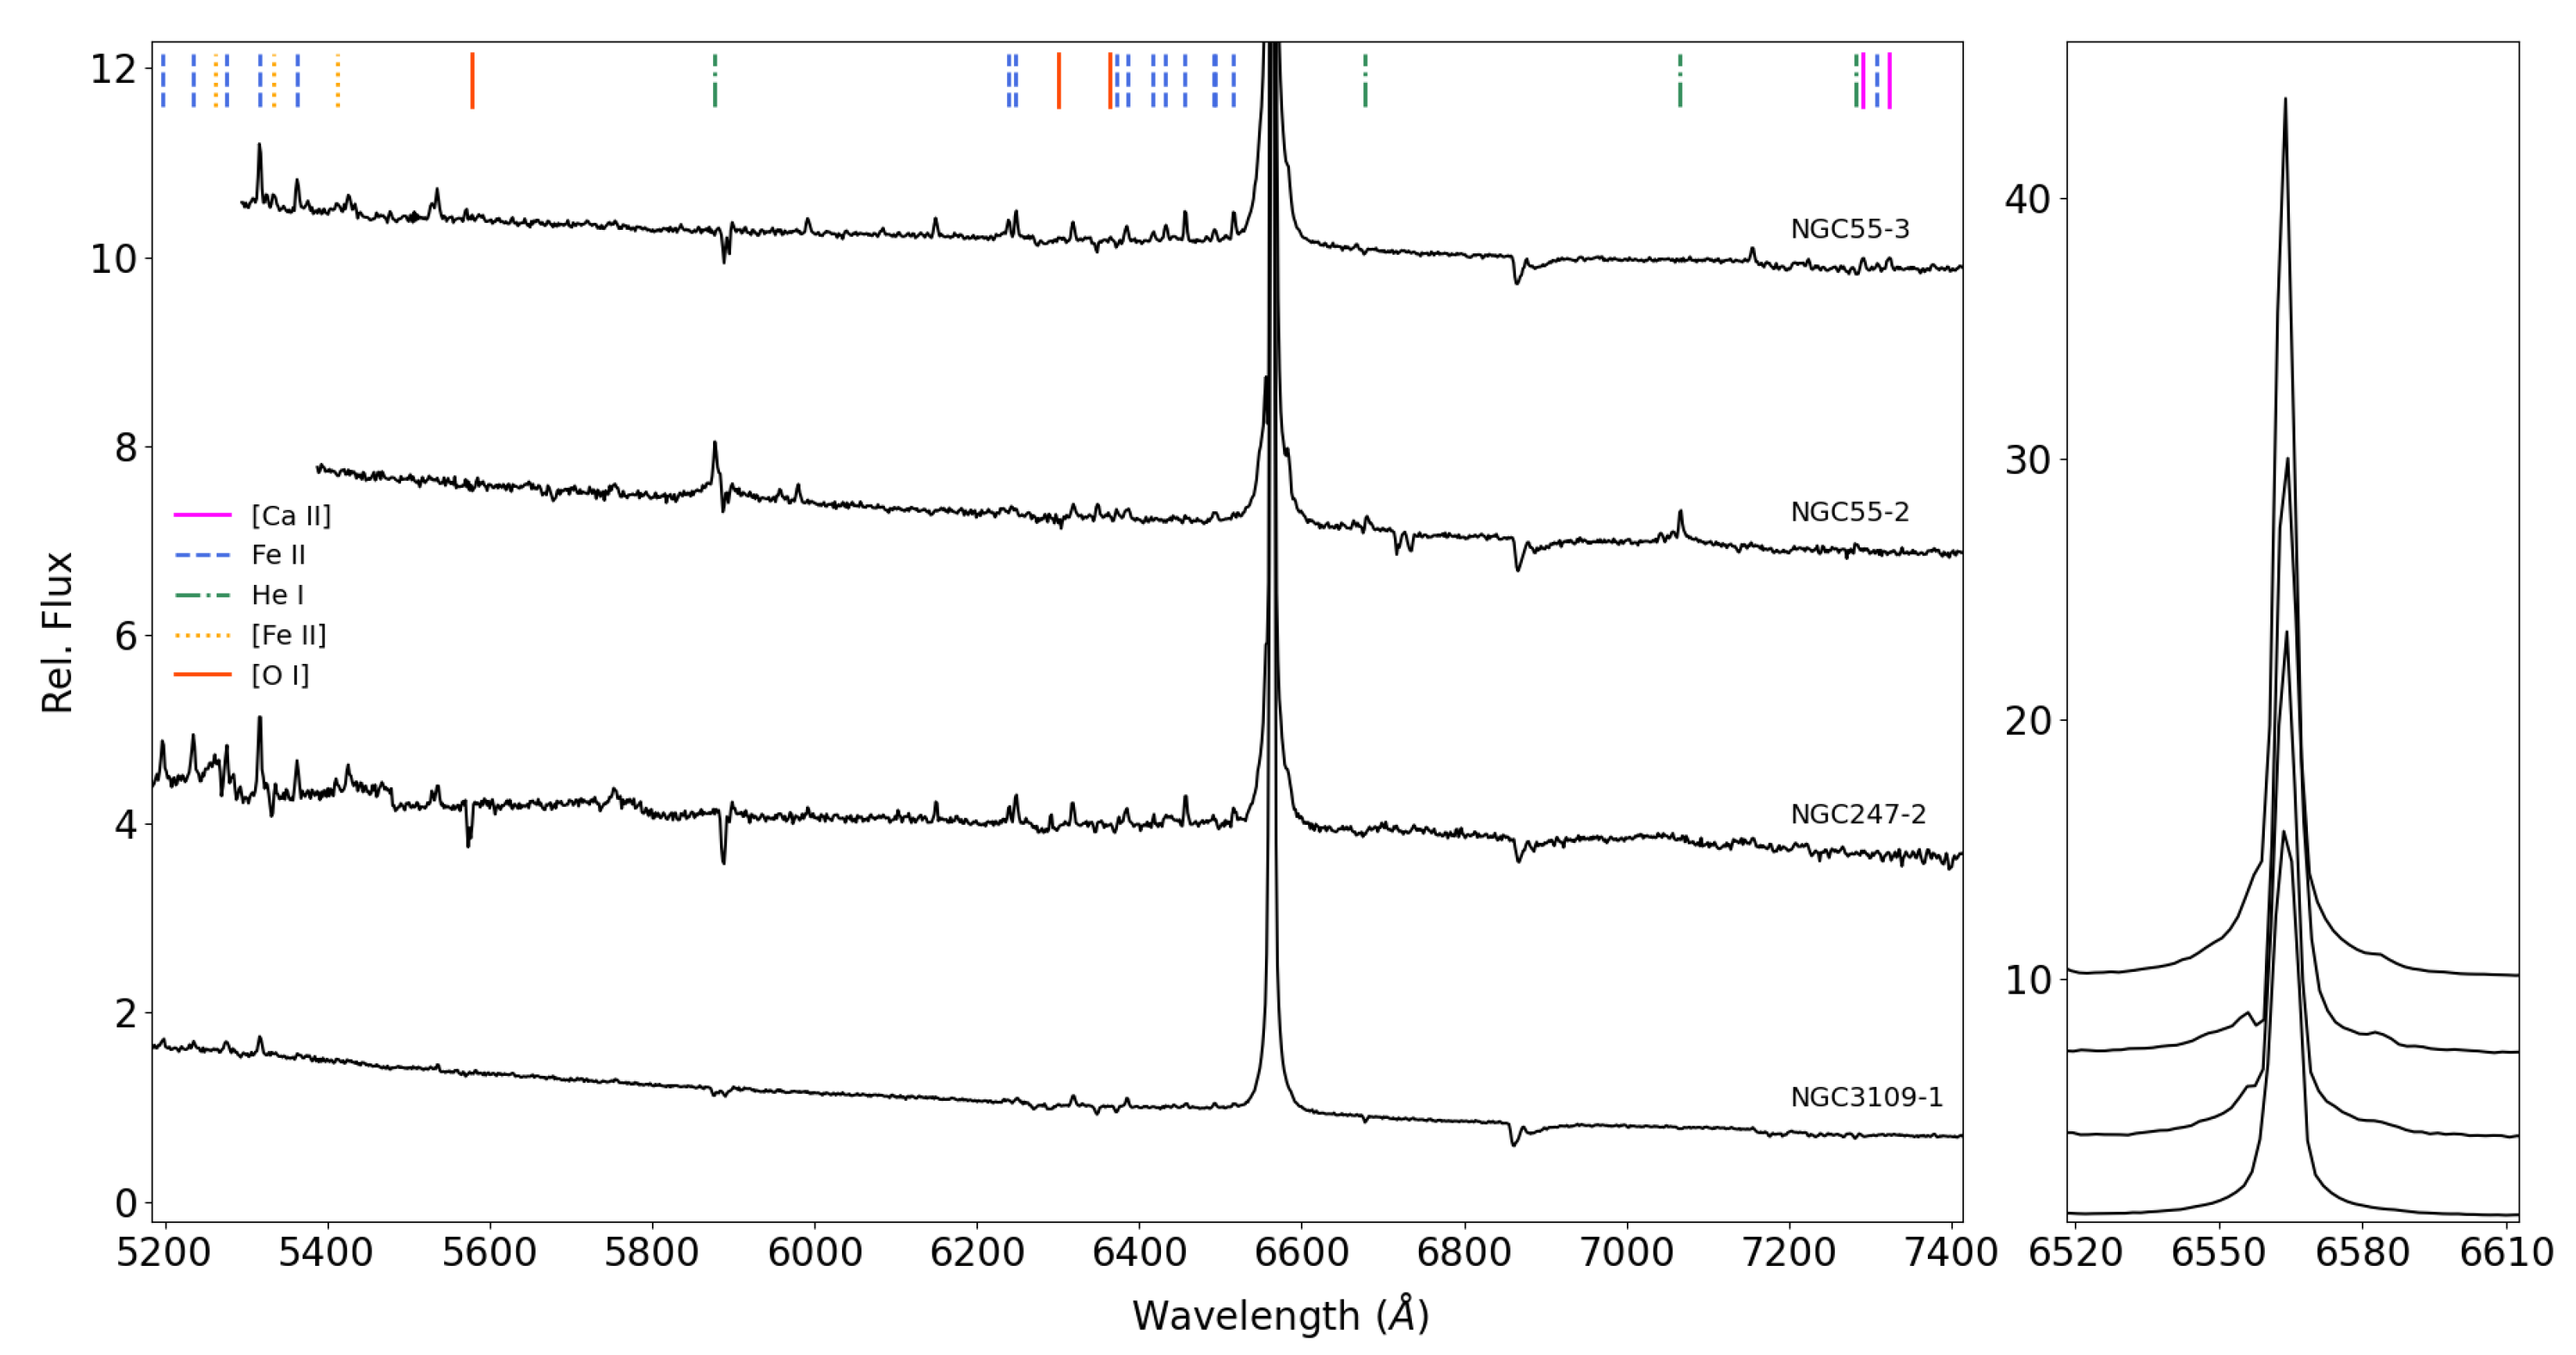
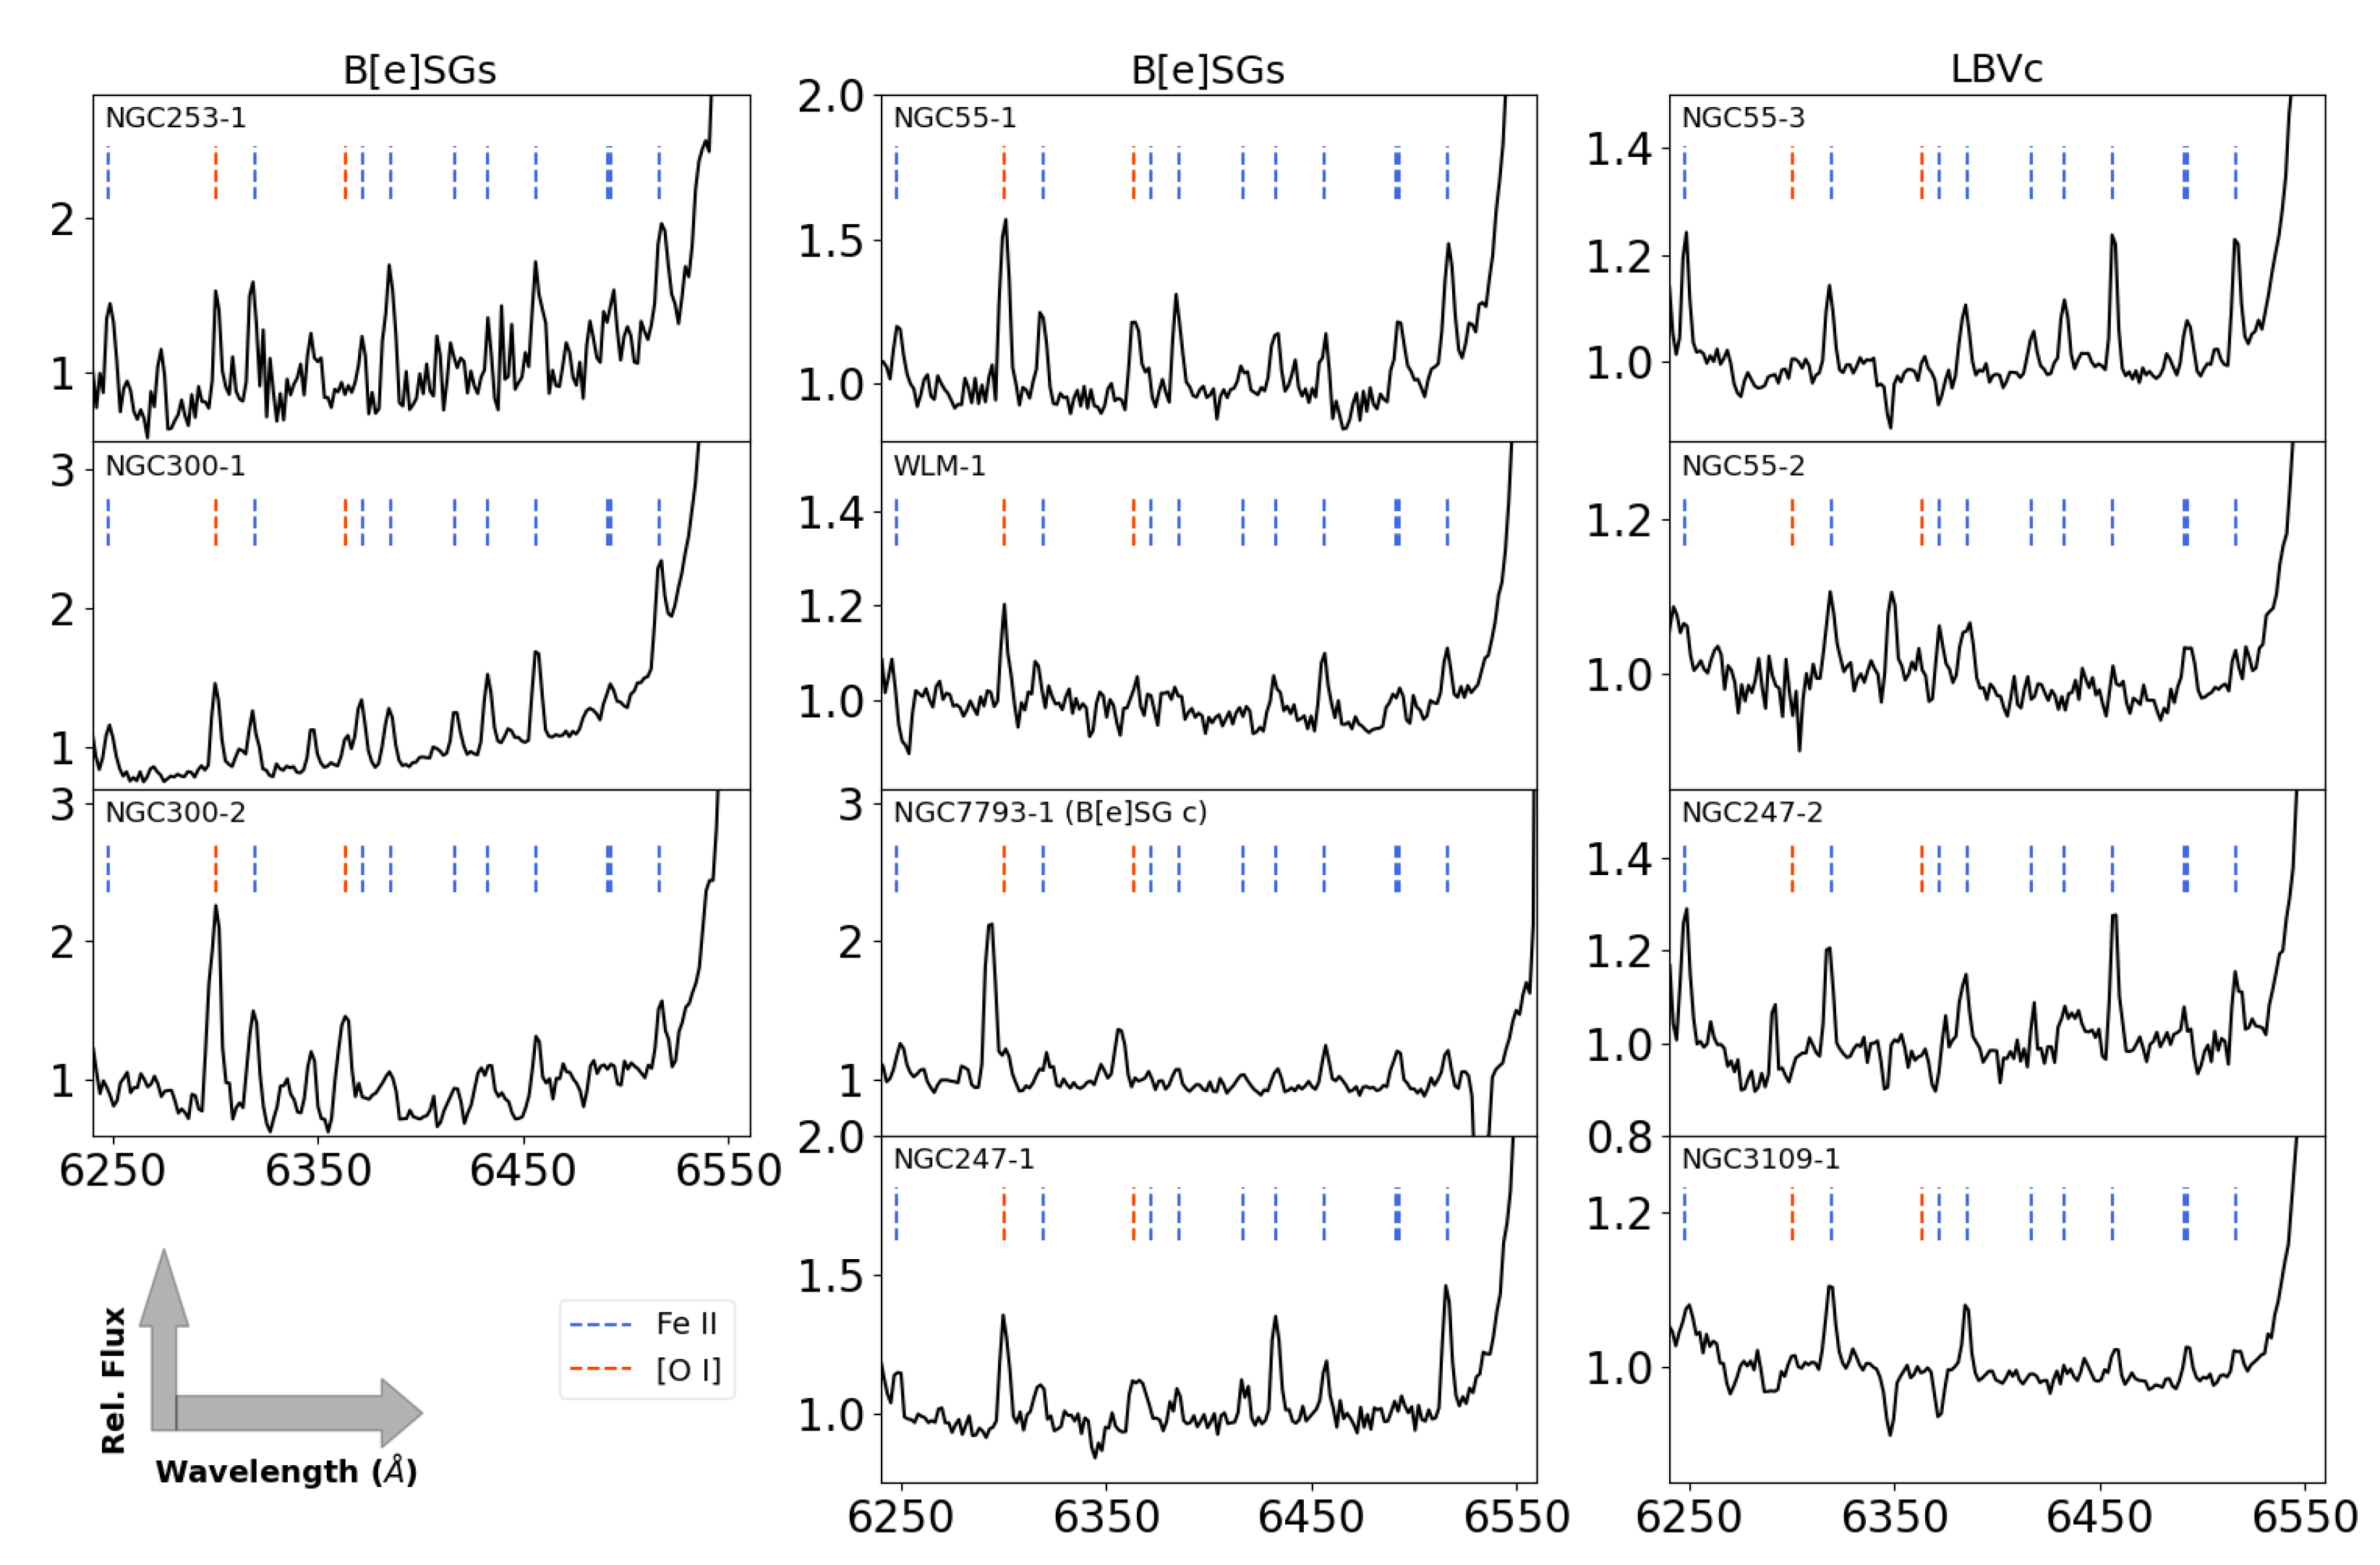
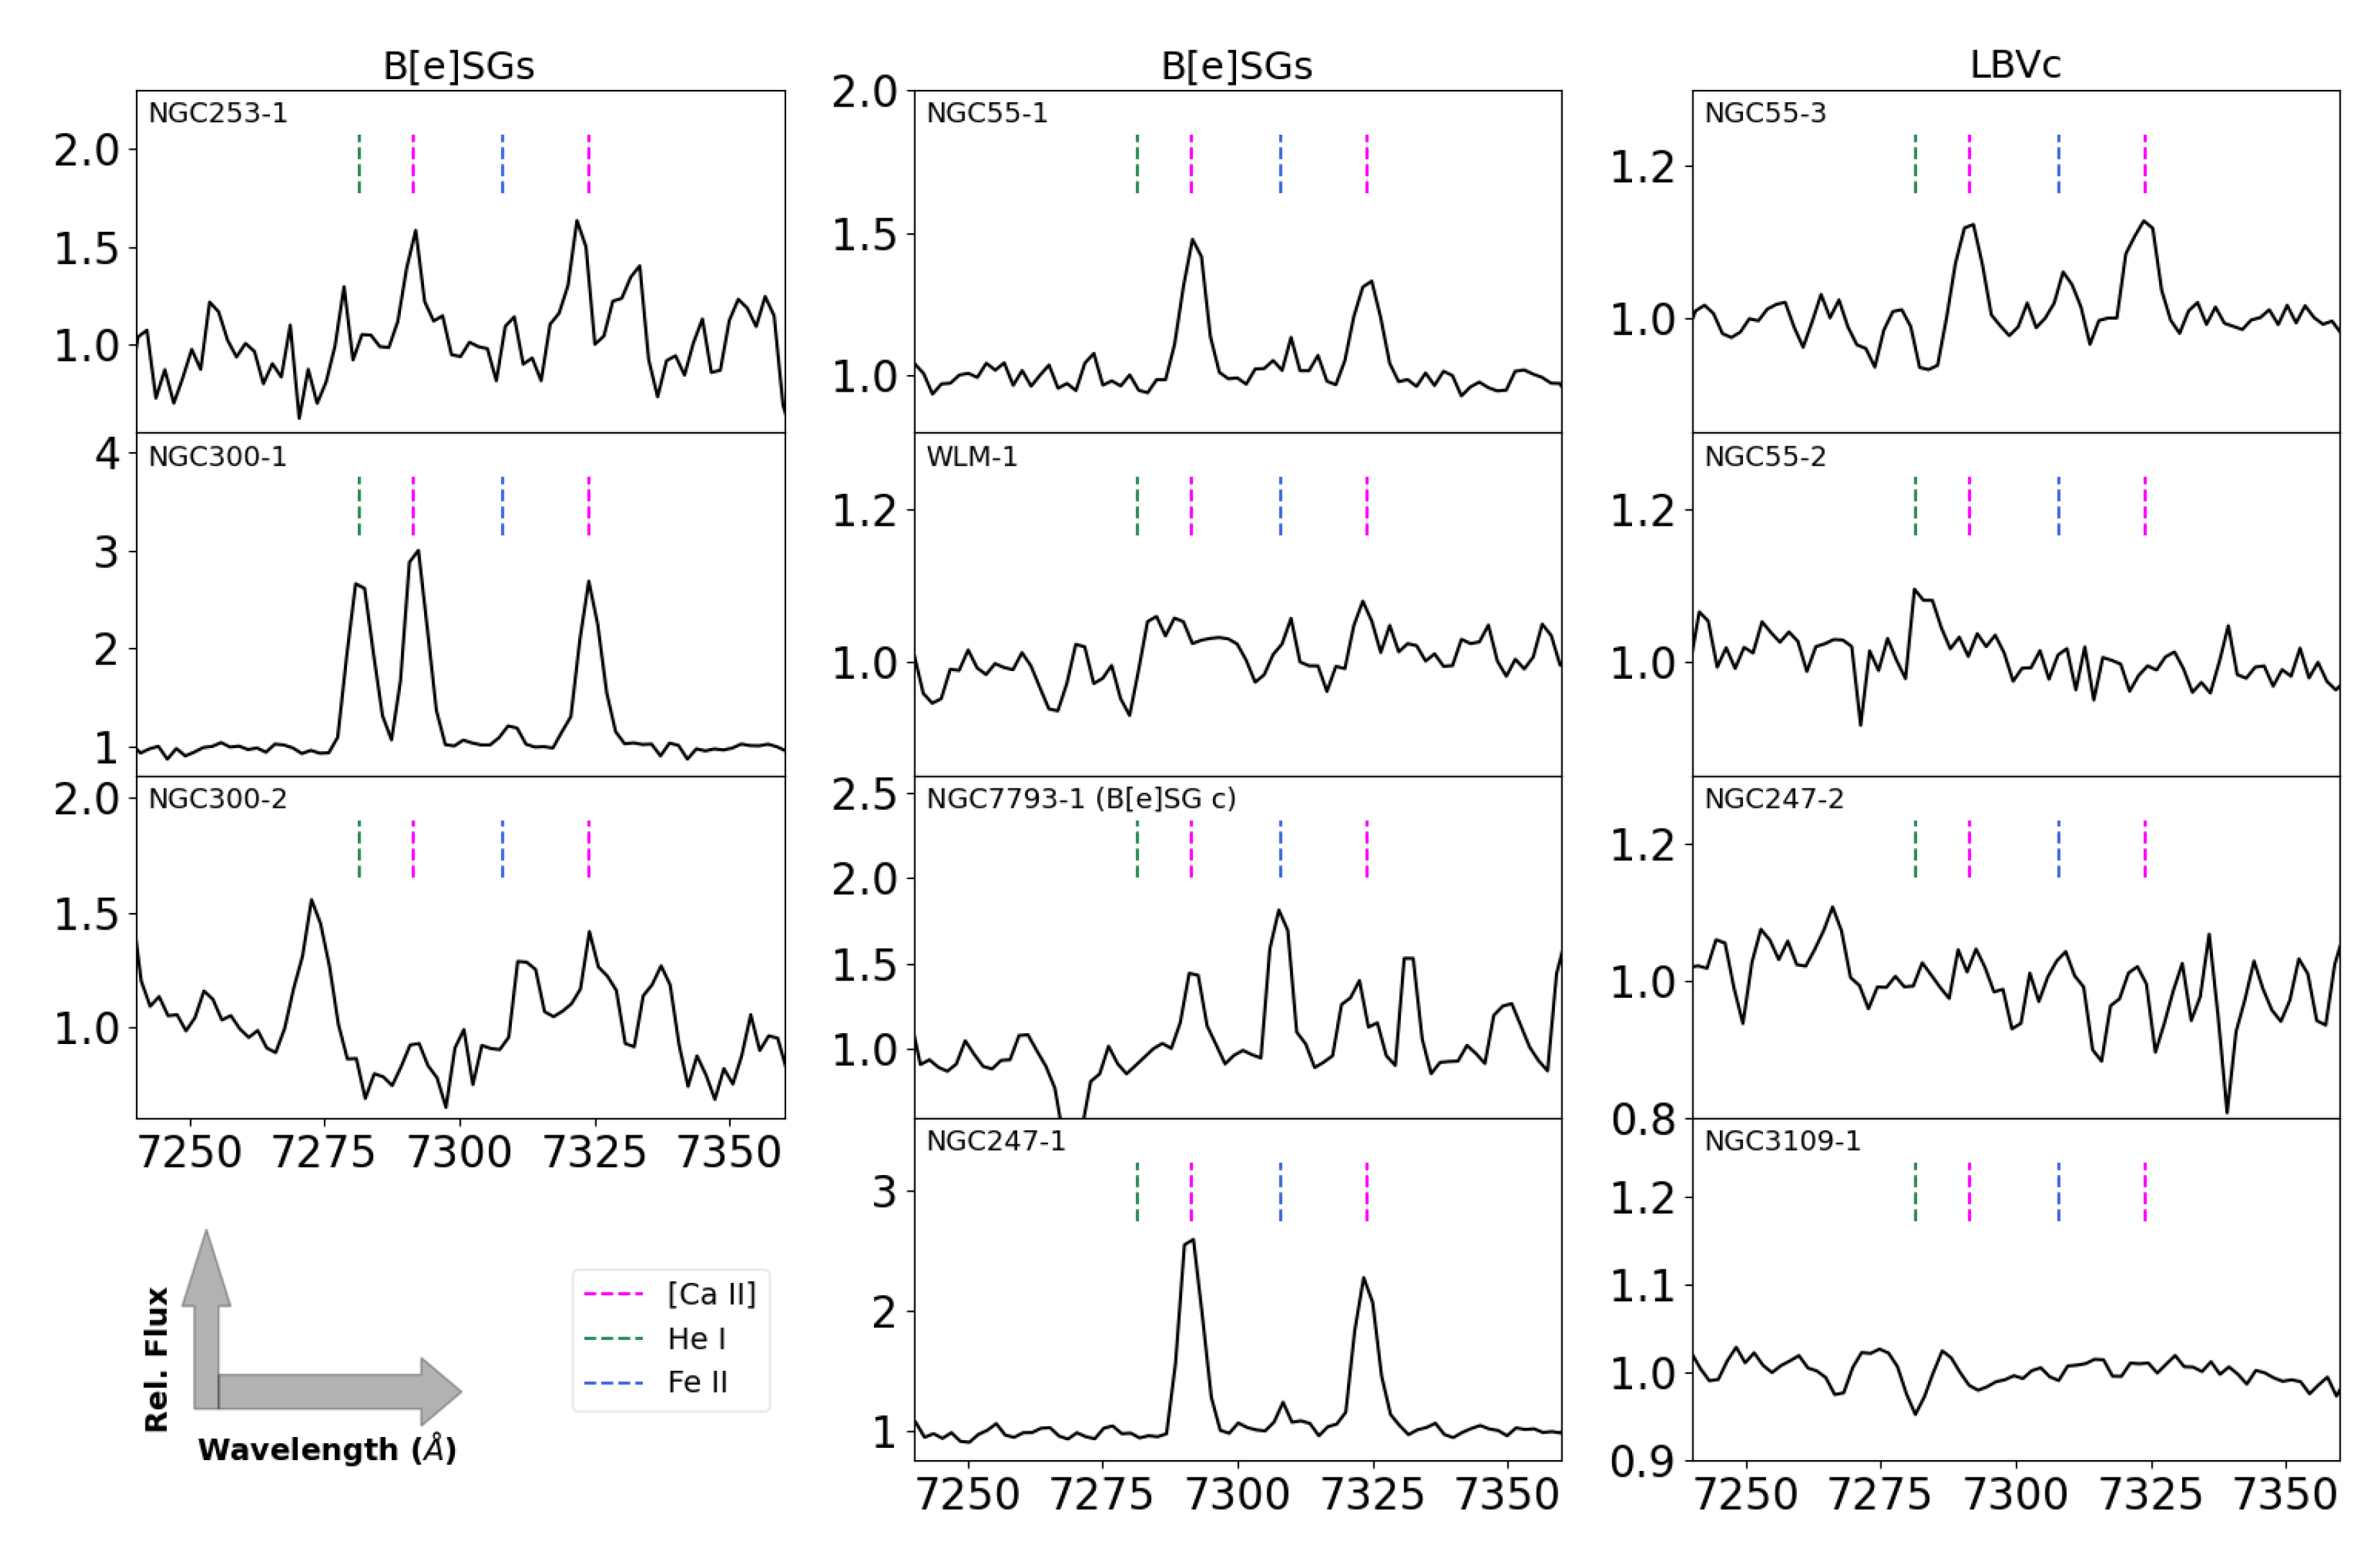
3.2. Spectra
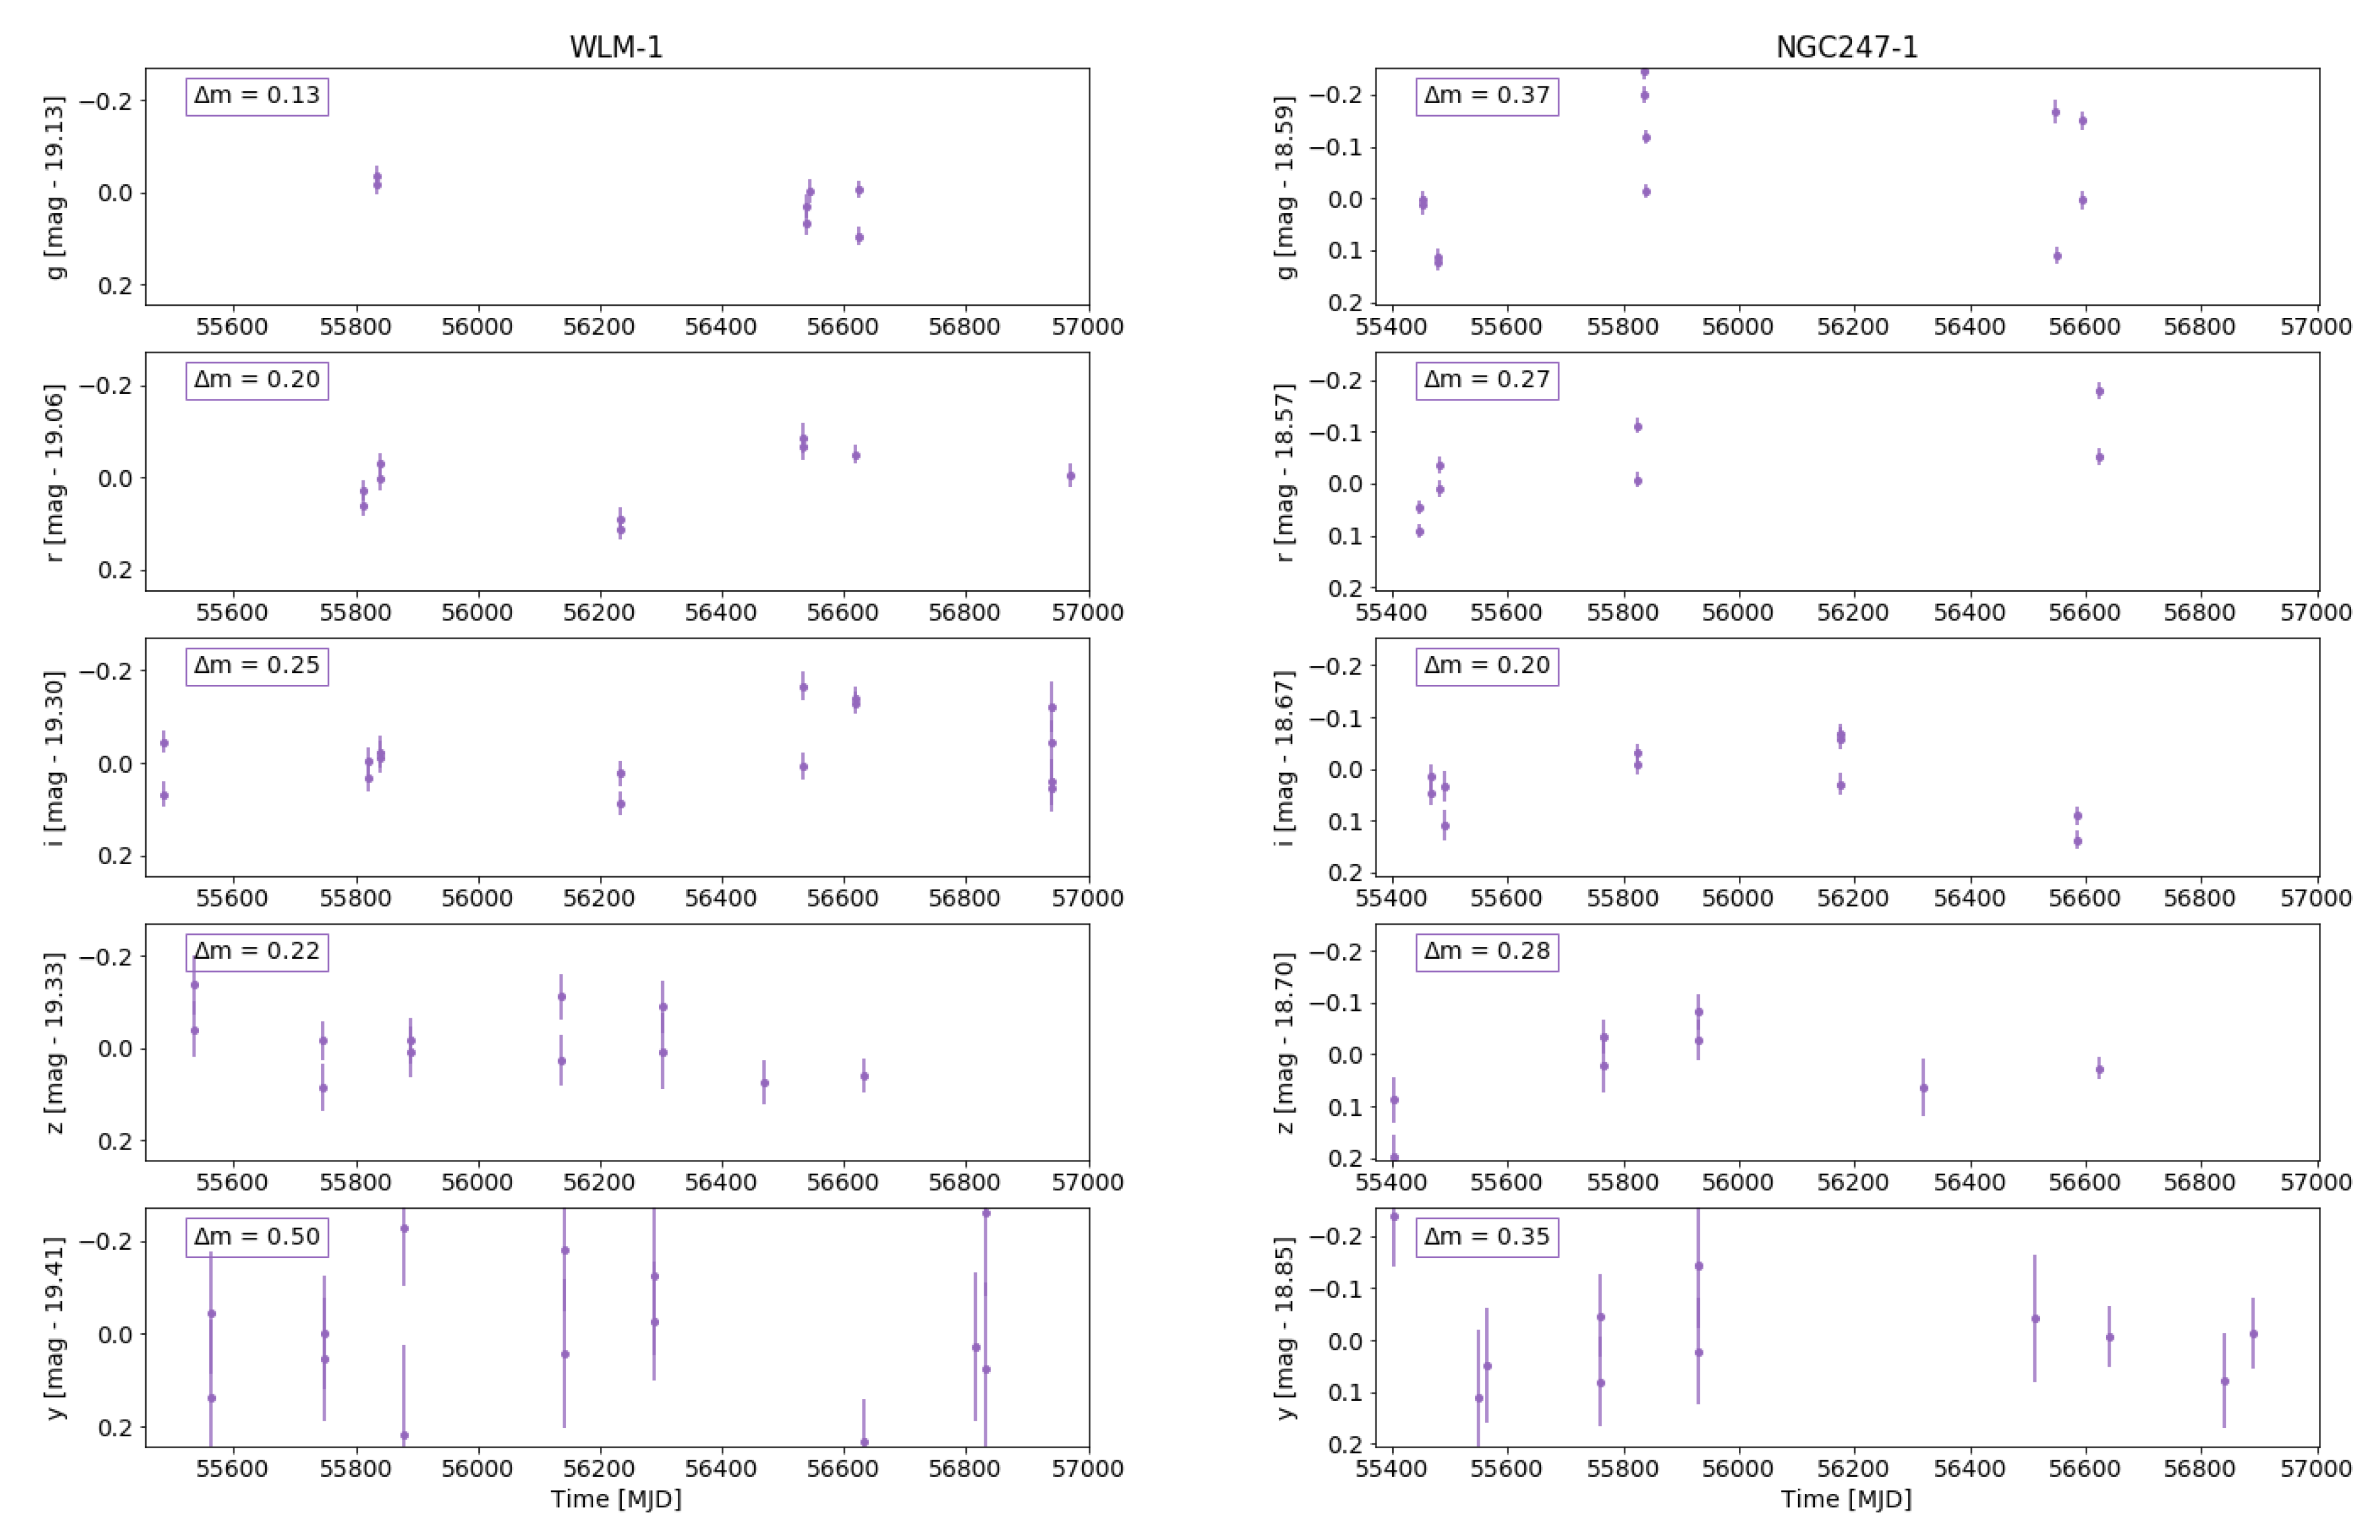
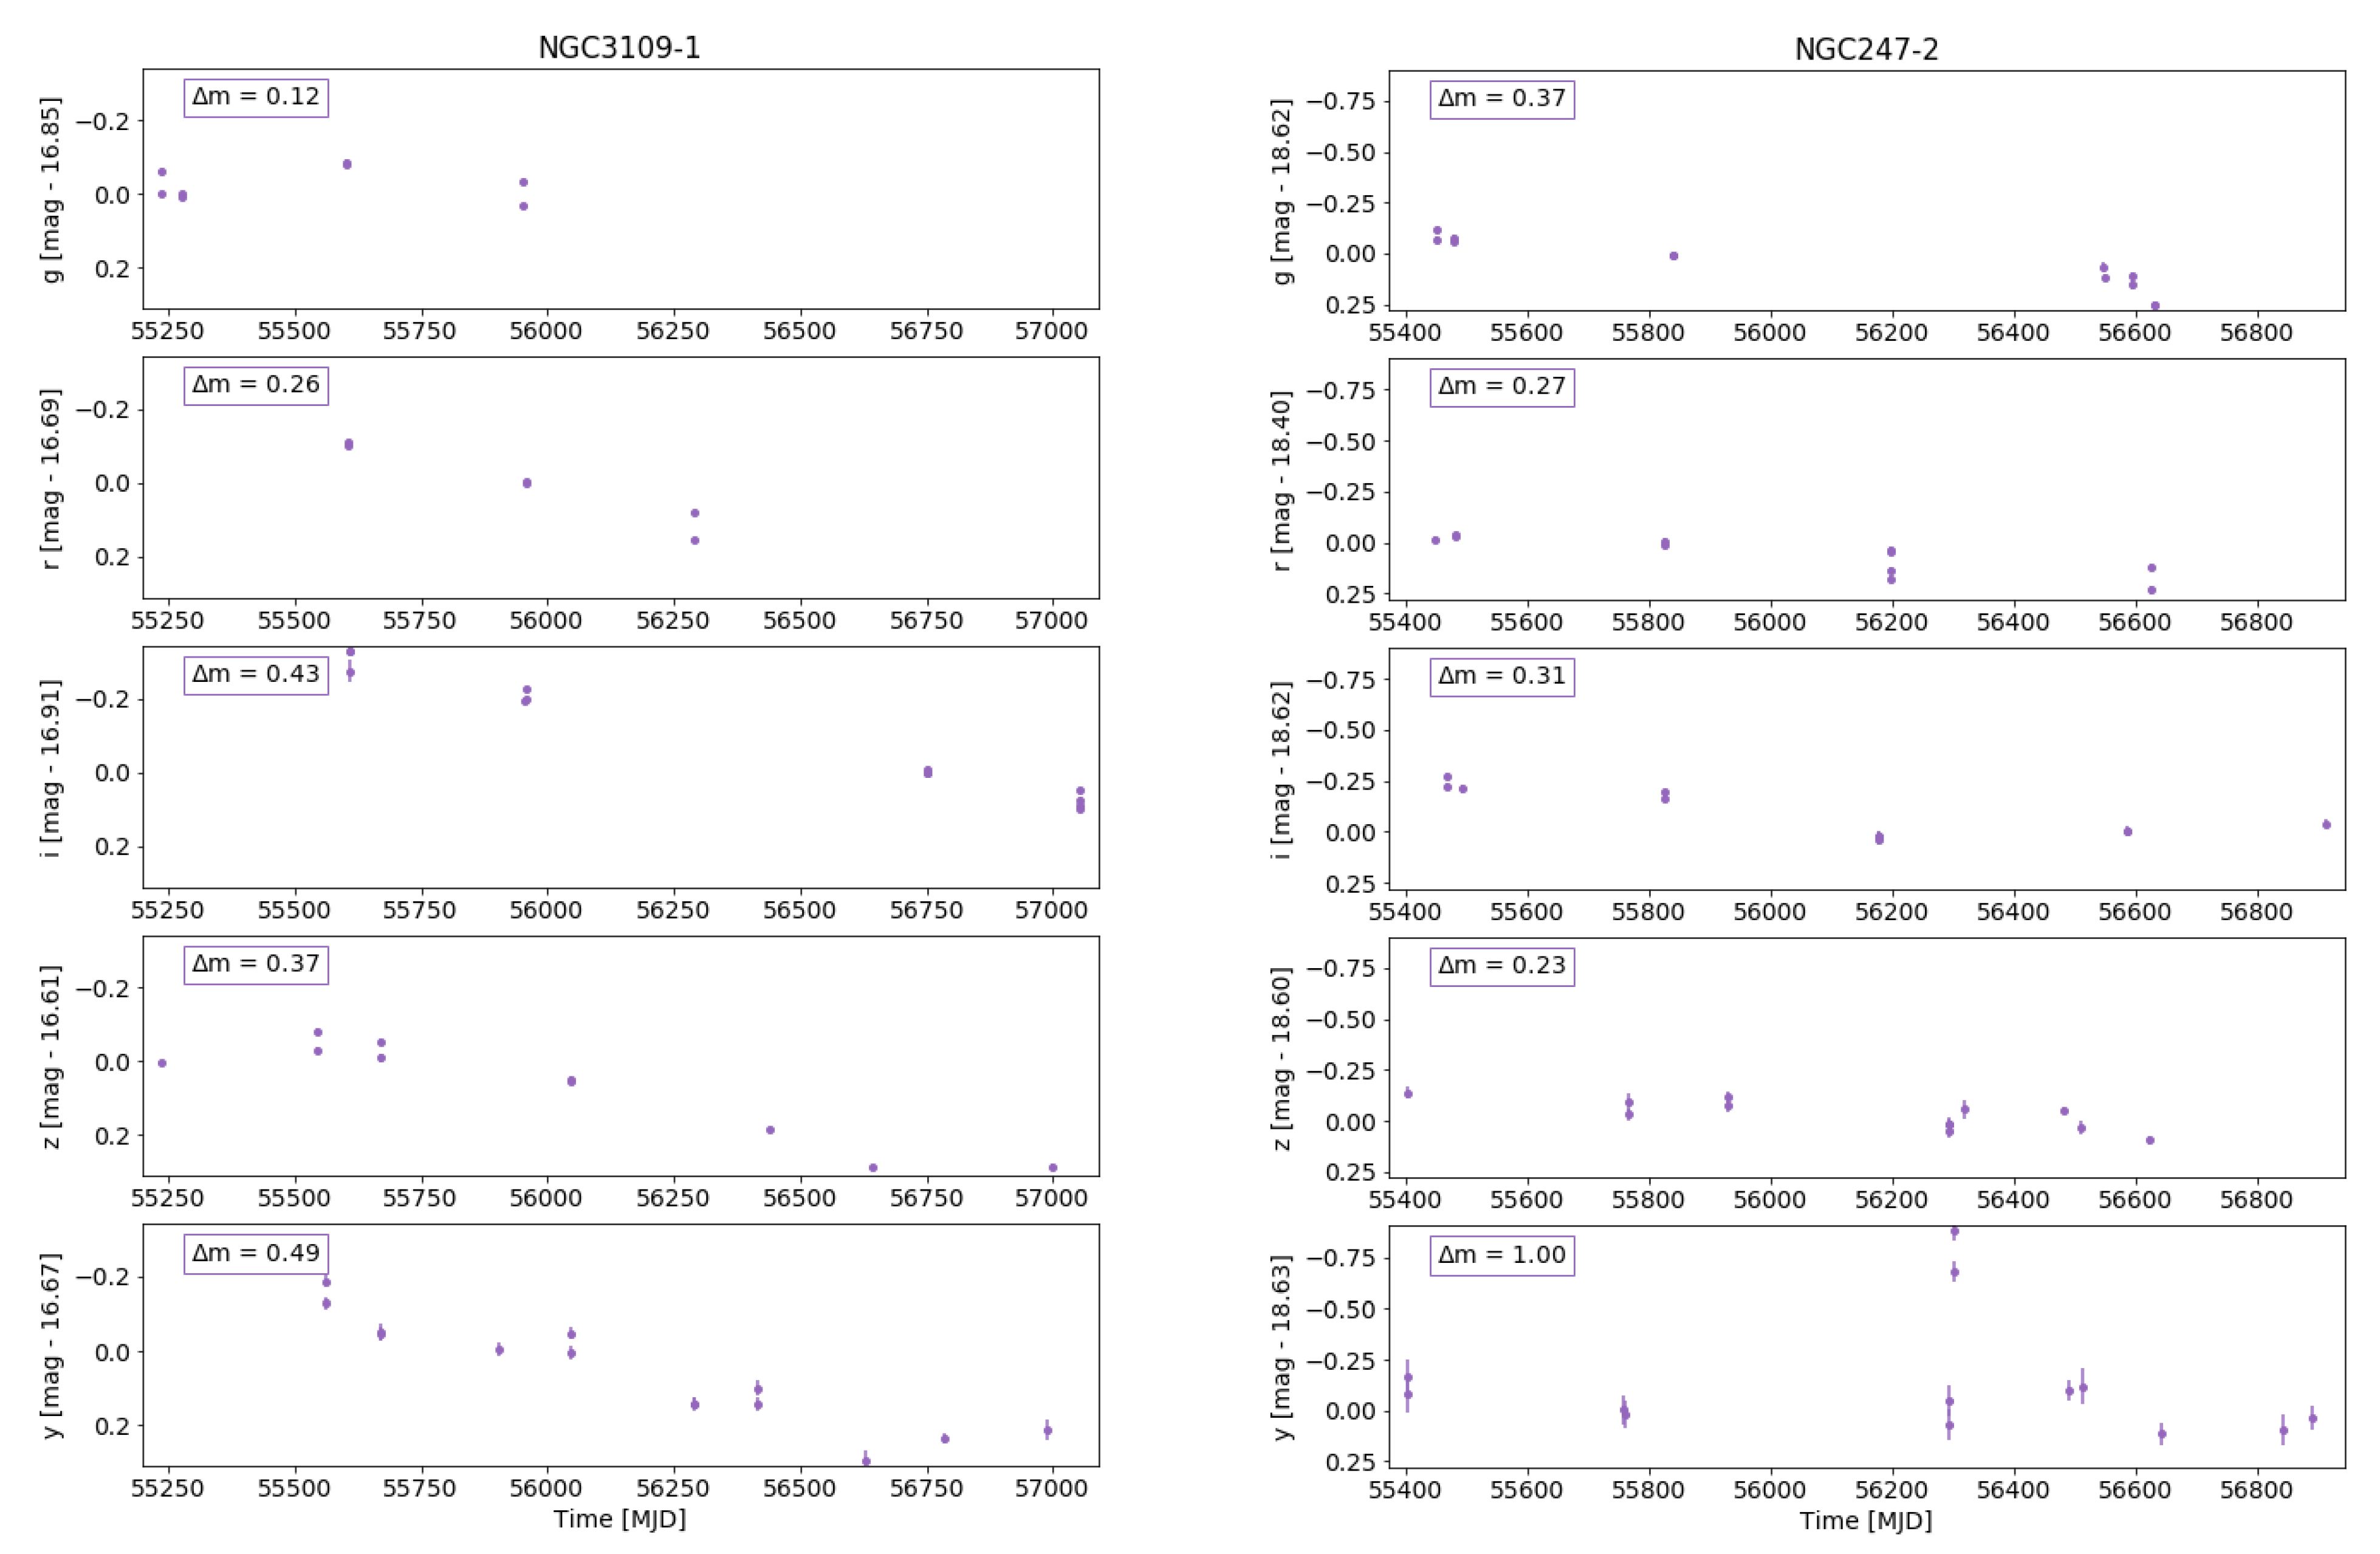
3.3. Light Curves and Variability
4. Discussion
4.1. Demographics
4.2. Comparison with Previous Classifications
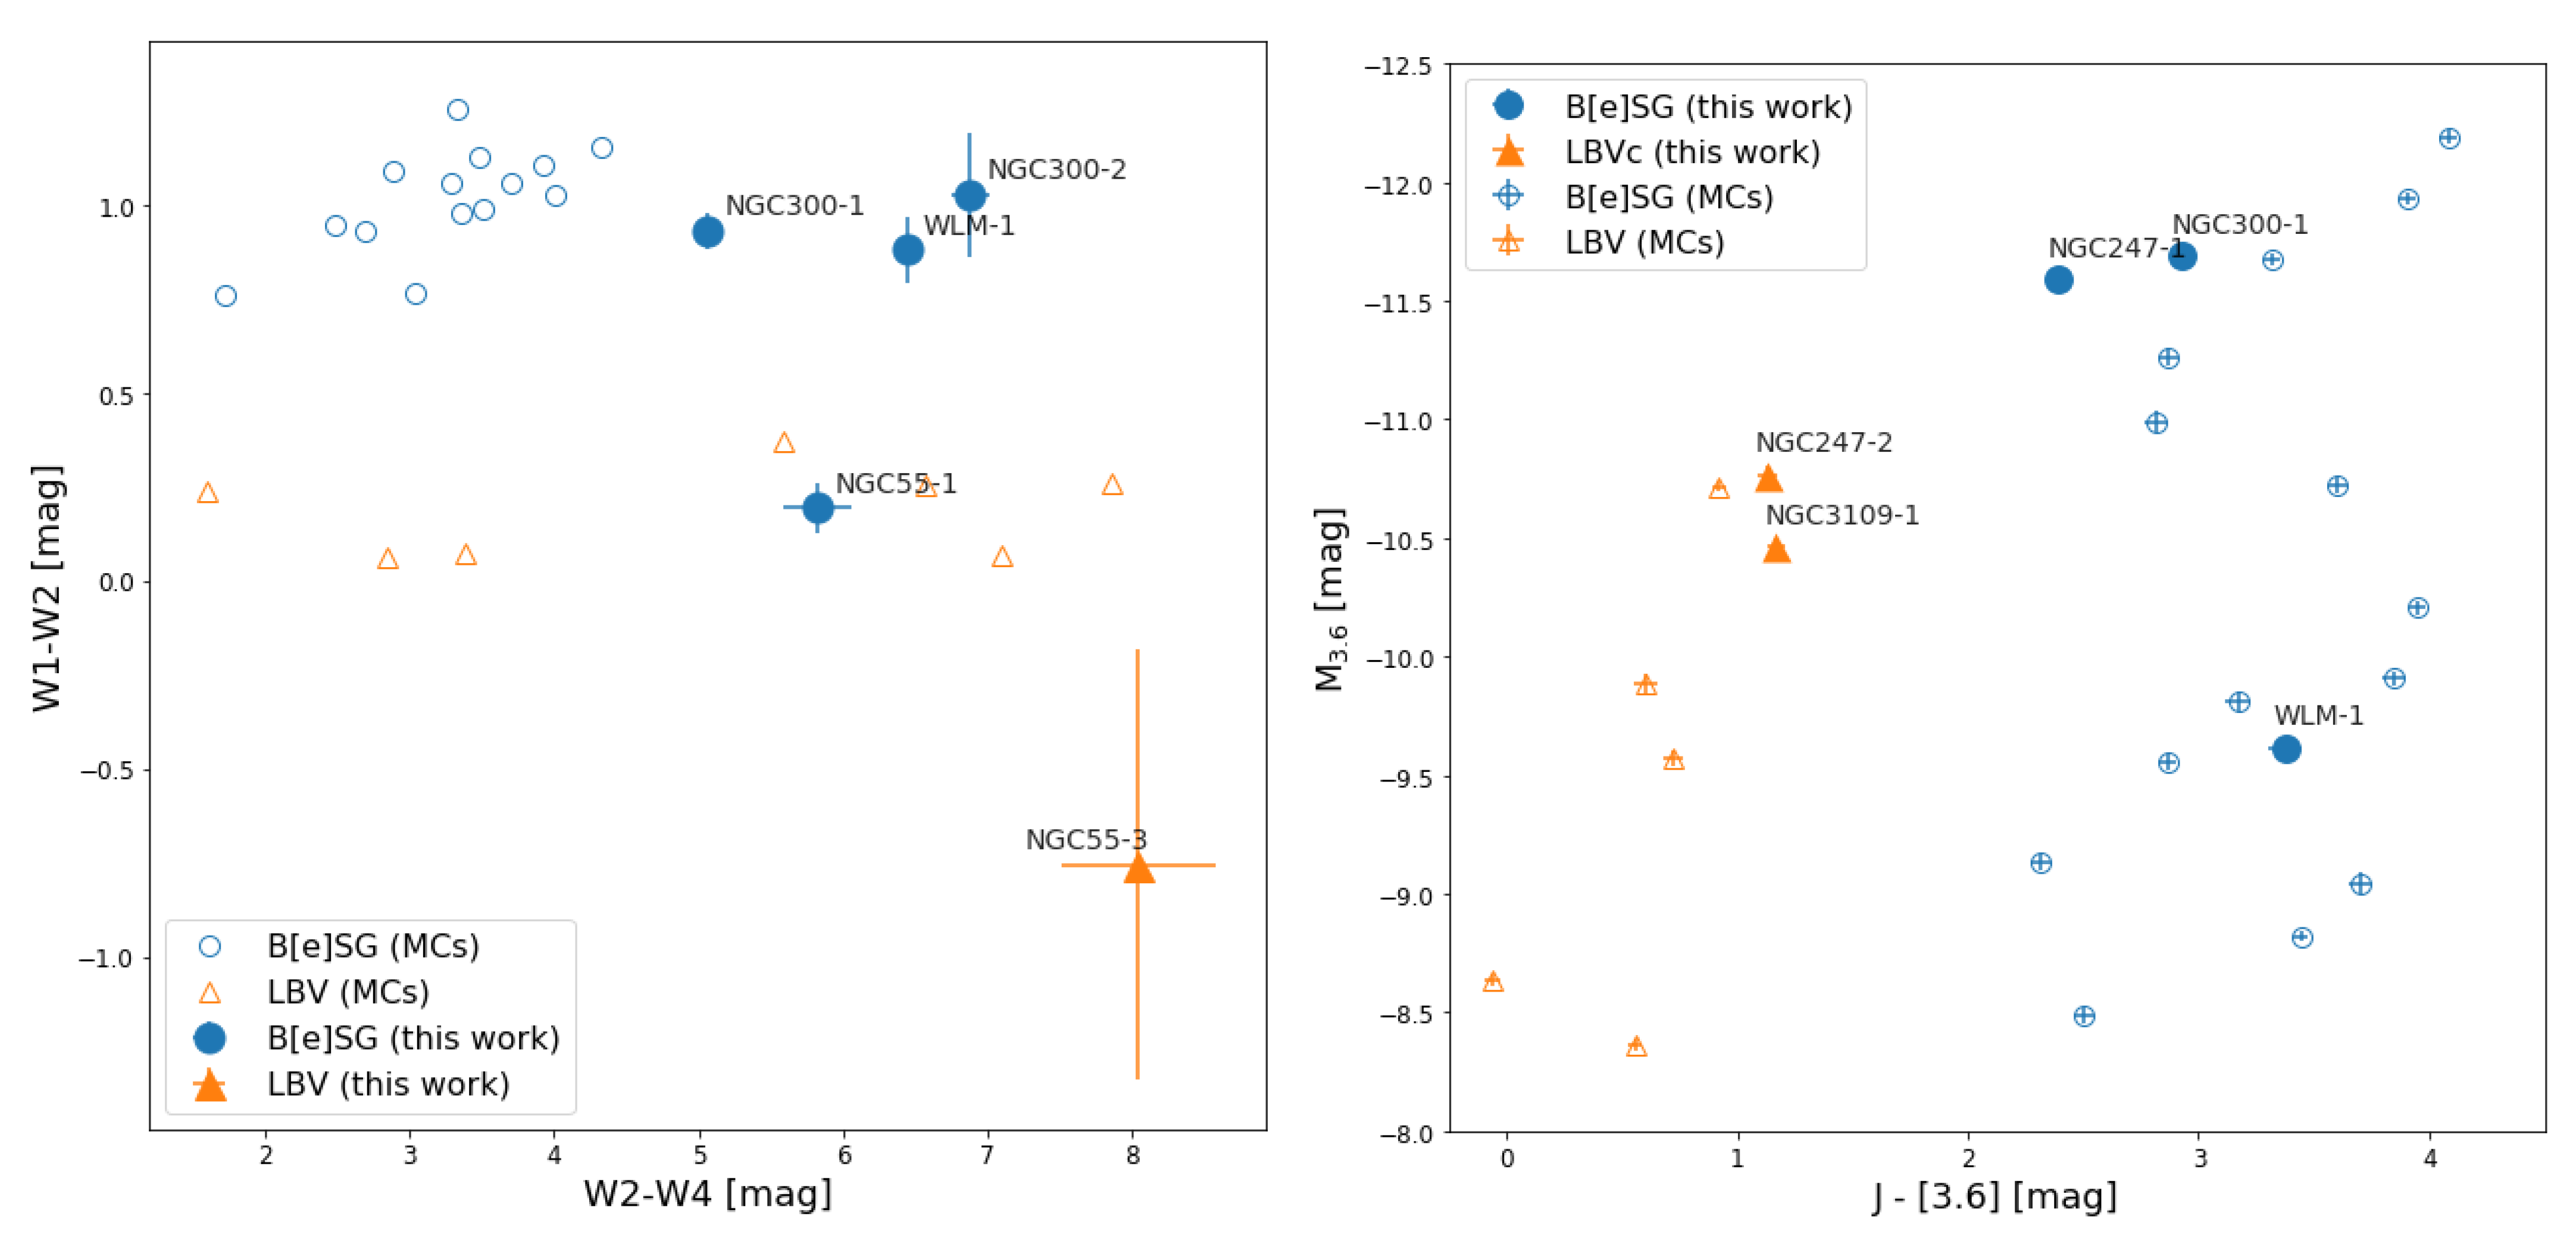
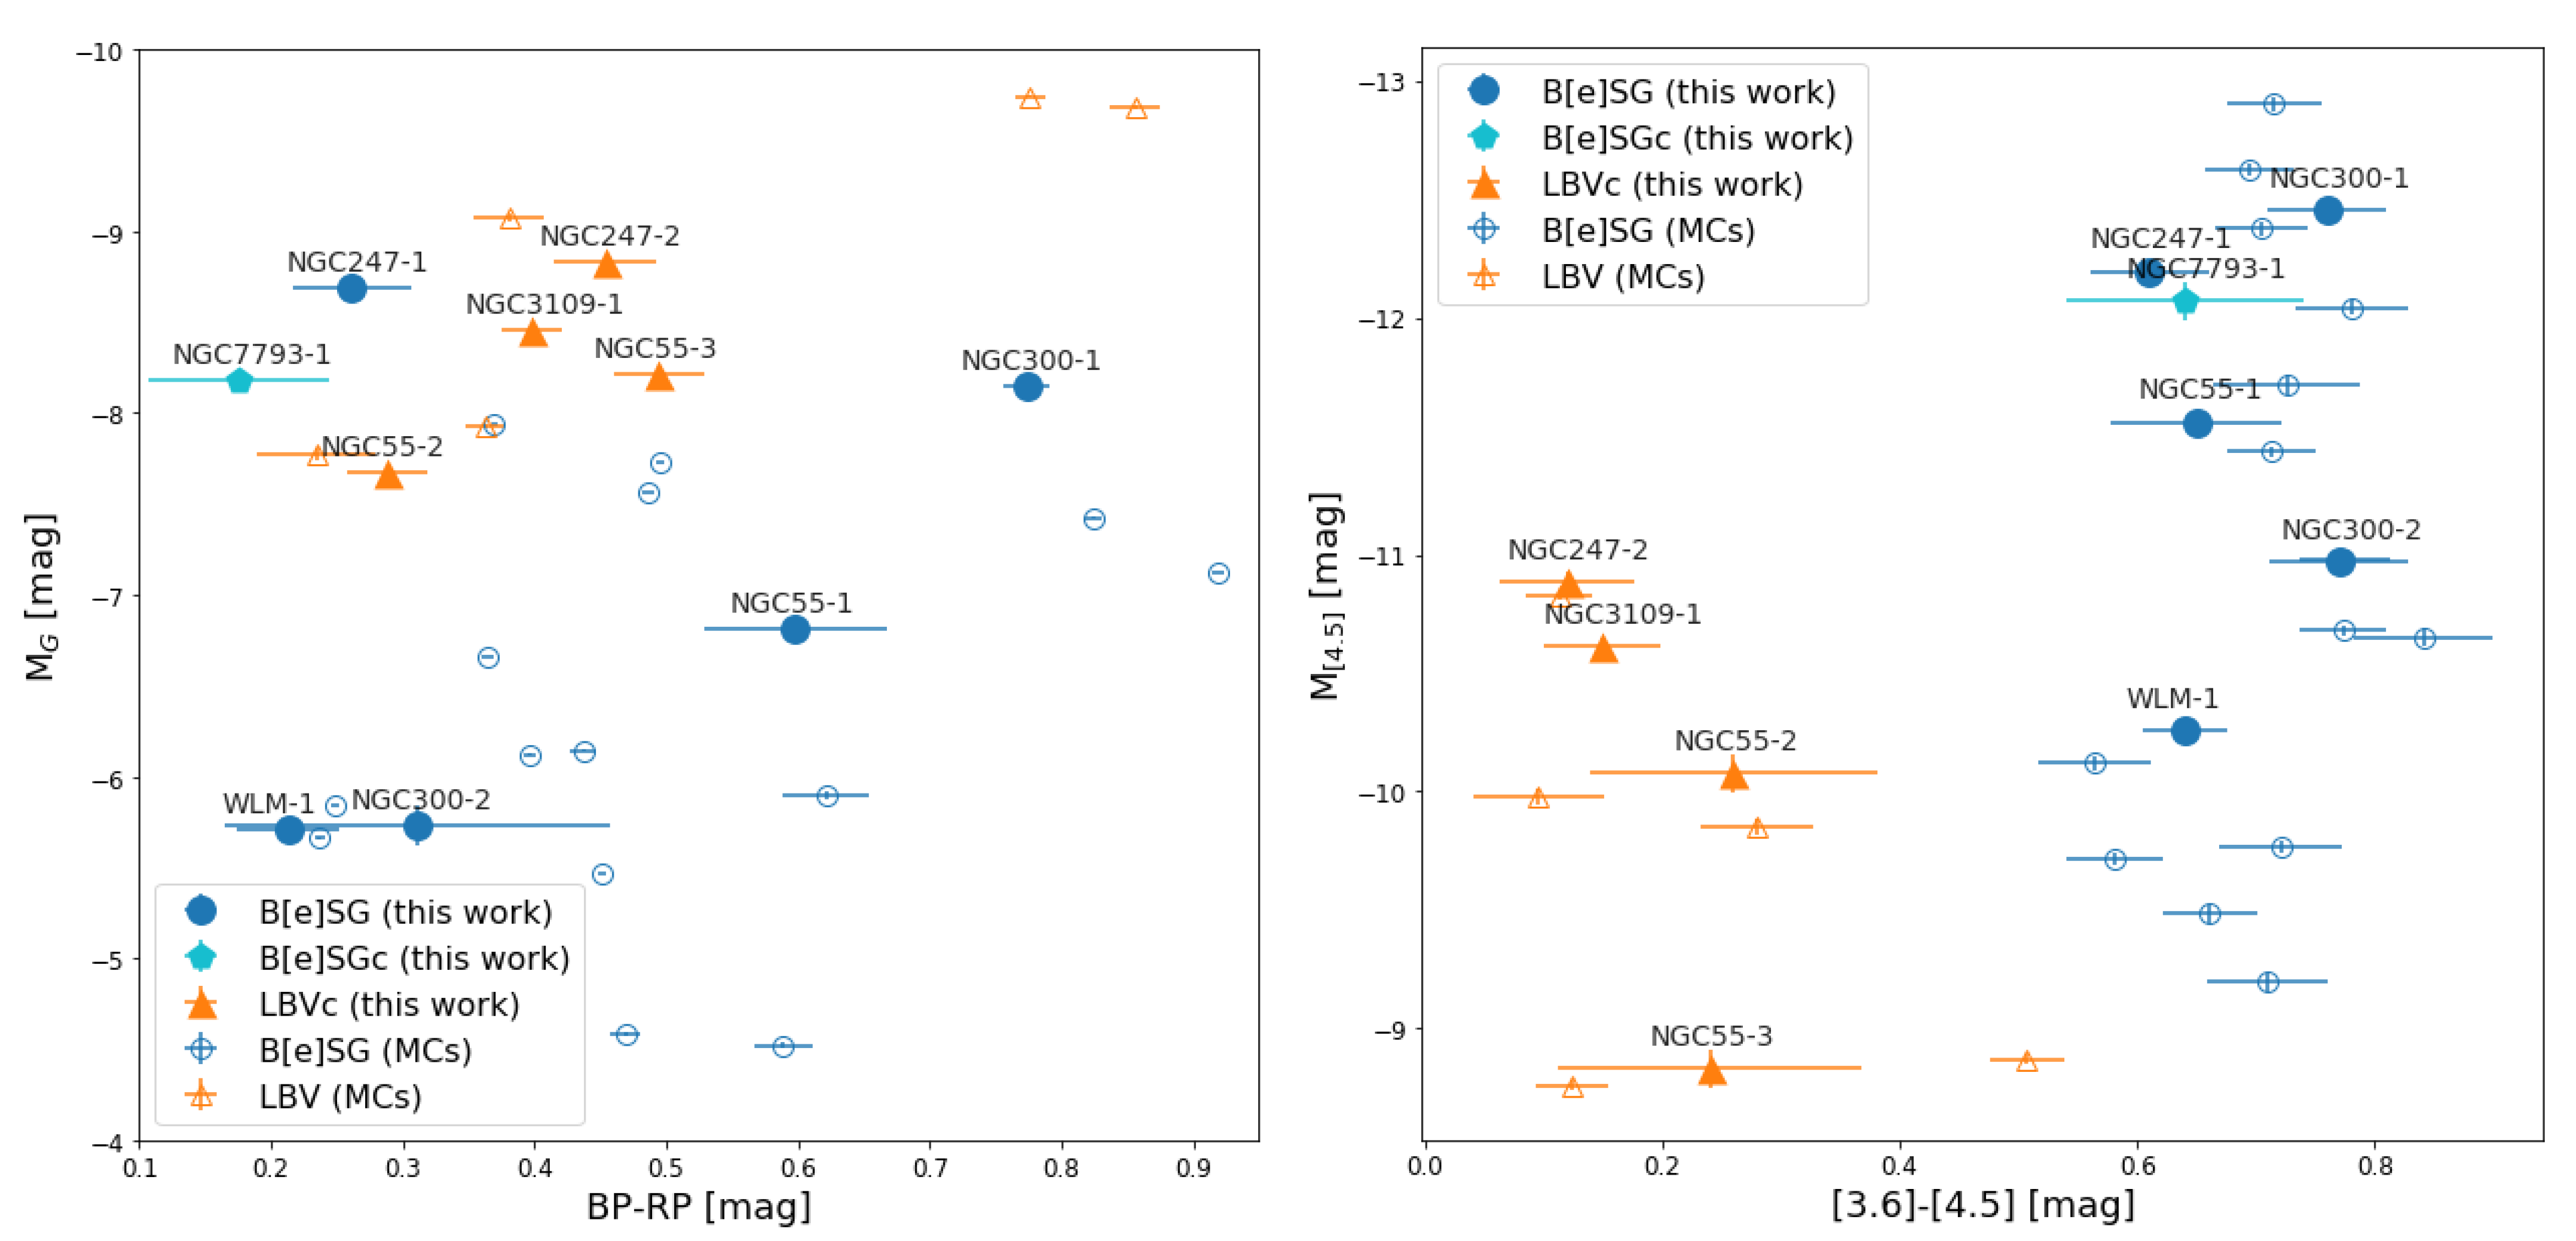
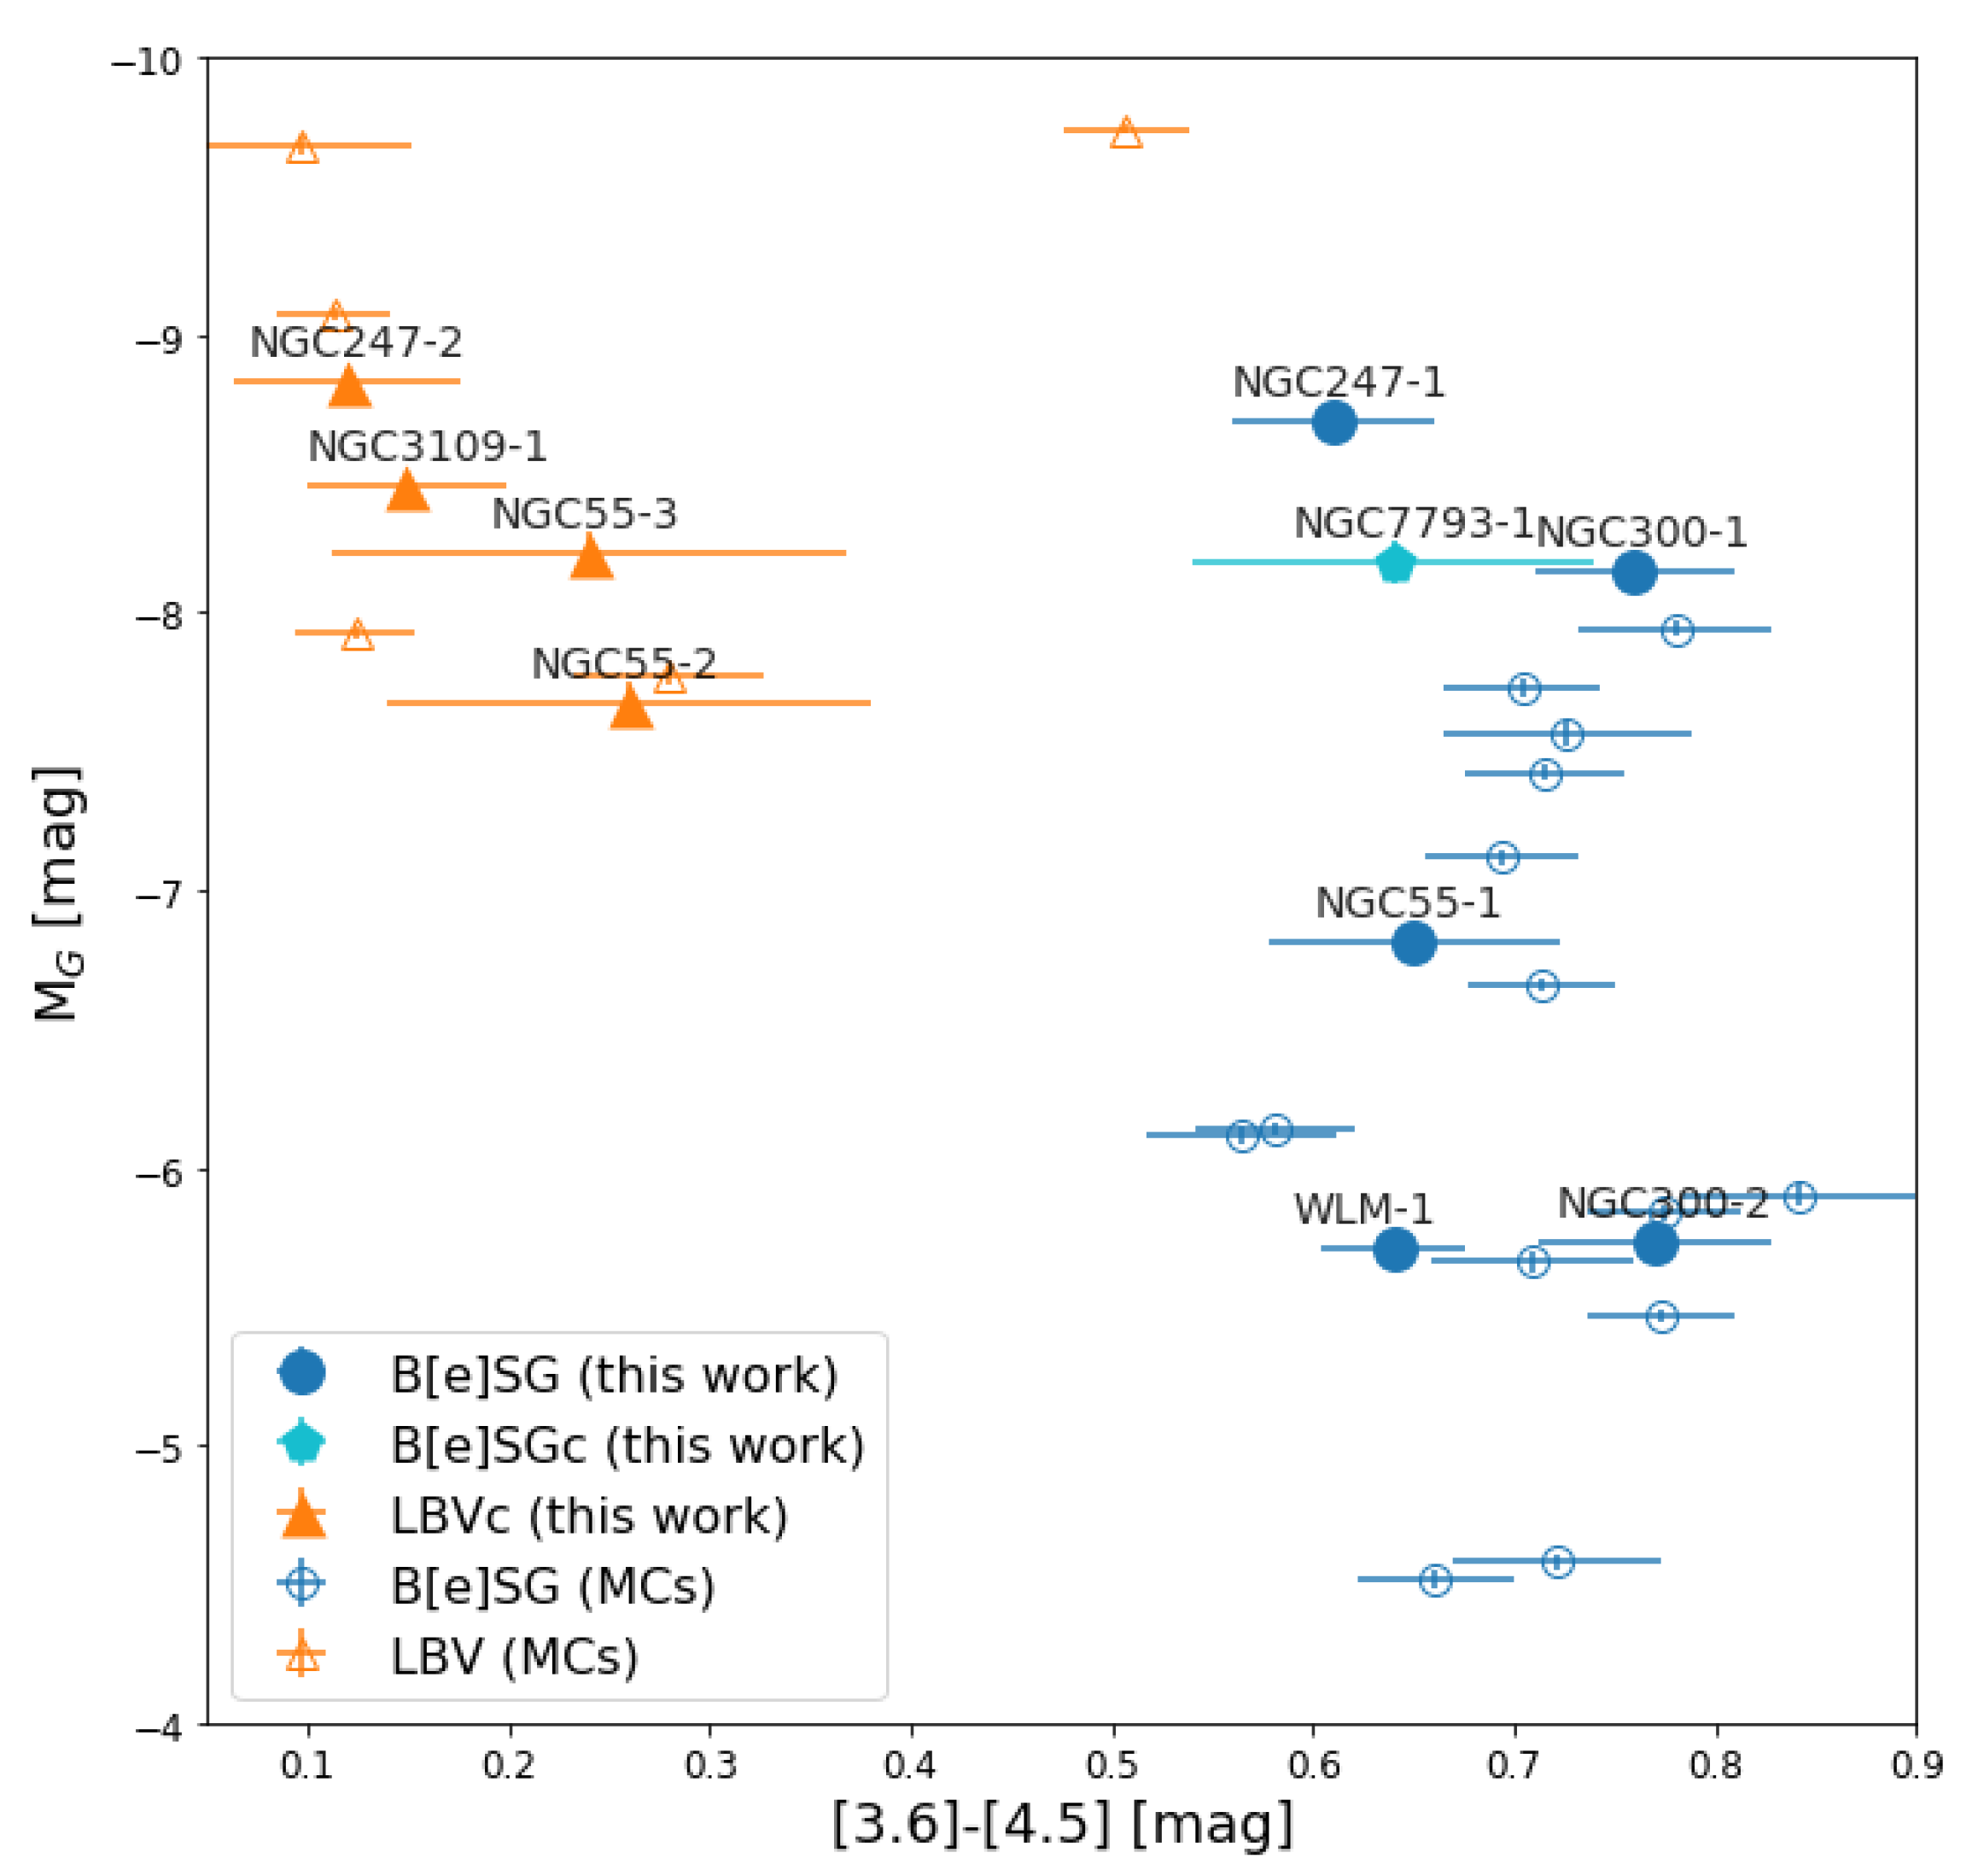
4.3. Separating the Two Classes with Photometry
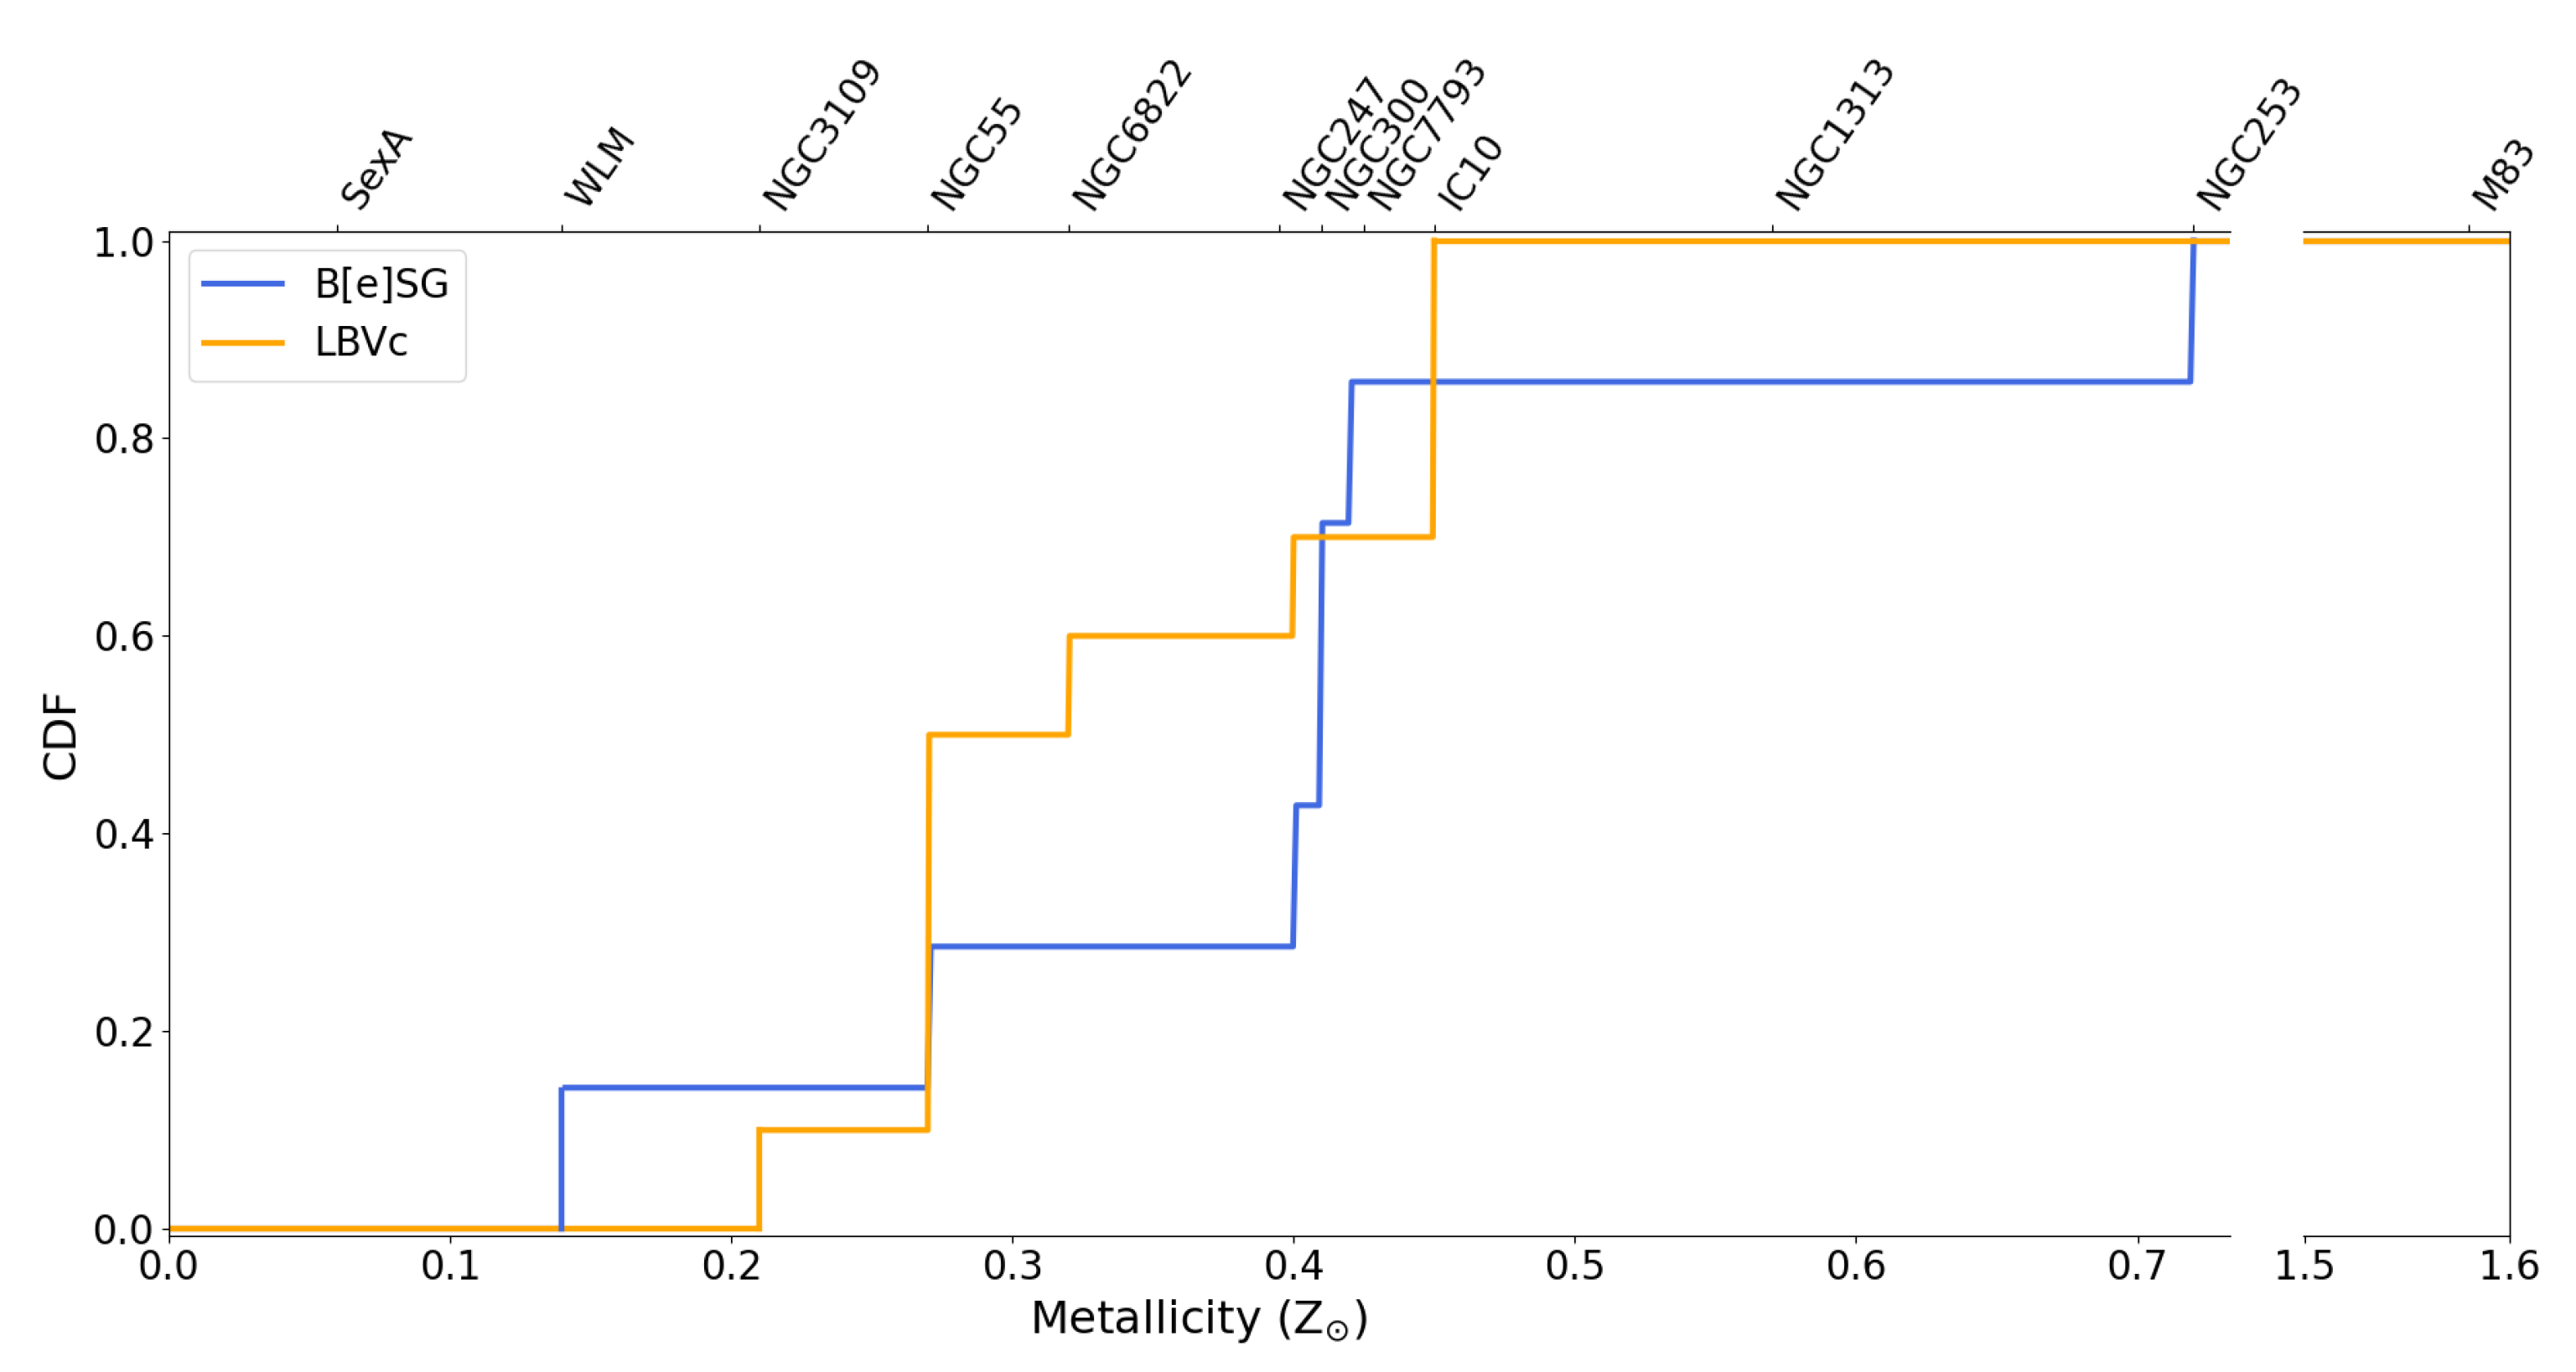
4.4. Metallicity Dependence of Populations
5. Conclusions
Author Contributions
Funding
Data Availability Statement
Acknowledgments
Conflicts of Interest
Abbreviations
| B[e]SG | B[e] Supergiant |
| CCD | Color-Color Diagram |
| CMD | Color-Magnitude Diagram |
| CSE | circumstellar environment |
| LBV | Luminous Blue Variable |
| MC | Magellanic Cloud |
| SNR | Signal to Noise Ratio |
| RSG | Red Supergiant |
| RV | Radial Velocity |
| 1 | Lamers et al. [5] commented on a relative low variation of up to 0.2 mag, which was not the case in more recent studies, see Section 3.3 for more details. |
| 2 | |
| 3 | https://www.inaoep.mx/~ydm/gtcmos/gtcmos.html accessed 1 September 2022—śee also [73]. |
| 4 | IRAF is distributed by the National Optical Astronomy Observatory, which is operated by the Association of Universities for Research in Astronomy (AURA) under cooperative agreement with the National Science Foundation. |
| 5 | Features at 5577, 5811 (step), 5846, 6855, and the region around the [Ca ii] lines. |
| 6 | |
| 7 | |
| 8 | There were only a couple of detections (epochs) for NGC253-1, which did not provide any meaningful information, and, therefore, we did not consider them. A declination of about was very close to the limit of the survey. All other galaxies with southern declination than , i.e., NGC 55, NGC 300, and NGC 7793, were not visible. |
| 9 | As our observations were obtained from different epochs (October–December 2020) than those by Castro et al. [79] (November 2004) the spectra appearance might have changed, but there was no wavelength overlap to confirm this. |
| 10 | Only NGC55-1 had an error estimate in the W4 band, while the rest of the sources did not. For all other sources we could only plot W1–W2 errors. |
References
- Ekström, S.; Georgy, C.; Eggenberger, P.; Meynet, G.; Mowlavi, N.; Wyttenbach, A.; Granada, A.; Decressin, T.; Hirschi, R.; Frischknecht, U.; et al. Grids of stellar models with rotation. I. Models from 0.8 to 120 M⊙ at solar metallicity (Z = 0.014). Astron. Astrophys. 2012, 537, A146. [Google Scholar] [CrossRef] [Green Version]
- Georgy, C.; Ekström, S.; Granada, A.; Meynet, G.; Mowlavi, N.; Eggenberger, P.; Maeder, A. Populations of rotating stars. I. Models from 1.7 to 15 M⊙ at Z = 0.014, 0.006, and 0.002 with Ω/Ωcrit between 0 and 1. Astron. Astrophys. 2013, 553, A24. [Google Scholar] [CrossRef] [Green Version]
- Smith, N. Mass Loss: Its Effect on the Evolution and Fate of High-Mass Stars. Annu. Rev. Astron. Astrophys. 2014, 52, 487–528. [Google Scholar] [CrossRef] [Green Version]
- Eldridge, J.J.; Stanway, E.R. New Insights into the Evolution of Massive Stars and Their Effects on Our Understanding of Early Galaxies. Annu. Rev. Astron. Astrophys. 2022, 60, 455–494. [Google Scholar] [CrossRef]
- Lamers, H.J.G.L.M.; Zickgraf, F.J.; de Winter, D.; Houziaux, L.; Zorec, J. An improved classification of B[e]-type stars. Astron. Astrophys. 1998, 340, 117–128. [Google Scholar]
- Kraus, M. The pre- versus post-main sequence evolutionary phase of B[e] stars. Constraints from 13CO band emission. Astron. Astrophys. 2009, 494, 253–262. [Google Scholar] [CrossRef] [Green Version]
- Kraus, M. A Census of B[e] Supergiants. Galaxies 2019, 7, 83. [Google Scholar] [CrossRef] [Green Version]
- Zickgraf, F.J.; Wolf, B.; Stahl, O.; Leitherer, C.; Klare, G. The hybrid spectrum of the LMC hypergiant R 126. Astron. Astrophys. 1985, 143, 421–430. [Google Scholar]
- Zickgraf, F.J.; Schulte-Ladbeck, R.E. Polarization characteristics of galactic Be stars. Astron. Astrophys. 1989, 214, 274–284. [Google Scholar]
- Aret, A.; Kraus, M.; Muratore, M.F.; Borges Fernandes, M. A new observational tracer for high-density disc-like structures around B[e] supergiants. Mon. Not. R. Astron. Soc. 2012, 423, 284–293. [Google Scholar] [CrossRef] [Green Version]
- de Wit, W.J.; Oudmaijer, R.D.; Vink, J.S. Dusty Blue Supergiants: News from High-Angular Resolution Observations. Adv. Astron. 2014, 2014, 270848. [Google Scholar] [CrossRef] [Green Version]
- Maravelias, G.; Kraus, M.; Cidale, L.S.; Borges Fernand es, M.; Arias, M.L.; Curé, M.; Vasilopoulos, G. Resolving the kinematics of the discs around Galactic B[e] supergiants. Mon. Not. R. Astron. Soc. 2018, 480, 320–344. [Google Scholar] [CrossRef] [Green Version]
- Kraus, M. Ionization structure in the winds of B[e] supergiants. II. Influence of rotation on the formation of equatorial hydrogen neutral zones. Astron. Astrophys. 2006, 456, 151–159. [Google Scholar] [CrossRef] [Green Version]
- Petrov, B.; Vink, J.S.; Gräfener, G. Two bi-stability jumps in theoretical wind models for massive stars and the implications for luminous blue variable supernovae. Mon. Not. R. Astron. Soc. 2016, 458, 1999–2011. [Google Scholar] [CrossRef]
- Curé, M.; Rial, D.F.; Cidale, L. Outflowing disk formation in B[e] supergiants due to rotation and bi-stability in radiation driven winds. Astron. Astrophys. 2005, 437, 929–933. [Google Scholar] [CrossRef] [Green Version]
- Krtička, J.; Kurfürst, P.; Krtičková, I. Magnetorotational instability in decretion disks of critically rotating stars and the outer structure of Be and Be/X-ray disks. Astron. Astrophys. 2015, 573, A20. [Google Scholar] [CrossRef] [Green Version]
- Wheelwright, H.E.; de Wit, W.J.; Weigelt, G.; Oudmaijer, R.D.; Ilee, J.D. AMBER and CRIRES observations of the binary sgB[e] star HD 327083: Evidence of a gaseous disc traced by CO bandhead emission. Astron. Astrophys. 2012, 543, A77. [Google Scholar] [CrossRef]
- Podsiadlowski, P.; Morris, T.S.; Ivanova, N. Massive Binary Mergers: A Unique Scenario for the sgB[e] Phenomenon? In Proceedings of the Stars with the B[e] Phenomenon, Vlieland, The Netherlands, 10–16 July 2005; Astronomical Society of the Pacific Conference Series. Kraus, M., Miroshnichenko, A.S., Eds.; Astronomical Society of the Pacific: San Francisco, CA, USA, 2006; Volume 355, p. 259. [Google Scholar]
- Kraus, M.; Cidale, L.S.; Arias, M.L.; Maravelias, G.; Nickeler, D.H.; Torres, A.F.; Borges Fernandes, M.; Aret, A.; Curé, M.; Vallverdú, R.; et al. Inhomogeneous molecular ring around the B[e] supergiant LHA 120-S 73. Astron. Astrophys. 2016, 593, A112. [Google Scholar] [CrossRef] [Green Version]
- Humphreys, R.M.; Weis, K.; Davidson, K.; Bomans, D.J.; Burggraf, B. Luminous and Variable Stars in M31 and M33. II. Luminous Blue Variables, Candidate LBVs, Fe II Emission Line Stars, and Other Supergiants. Astrophys. J. 2014, 790, 48. [Google Scholar] [CrossRef] [Green Version]
- Humphreys, R.M.; Gordon, M.S.; Martin, J.C.; Weis, K.; Hahn, D. Luminous and Variable Stars in M31 and M33. IV. Luminous Blue Variables, Candidate LBVs, B[e] Supergiants, and the Warm Hypergiants: How to Tell Them Apart. Astrophys. J. 2017, 836, 64. [Google Scholar] [CrossRef] [Green Version]
- Weis, K.; Bomans, D.J. Luminous Blue Variables. Galaxies 2020, 8, 20. [Google Scholar] [CrossRef] [Green Version]
- Vink, J.S. Eta Carinae and the Luminous Blue Variables. In Eta Carinae and the Supernova Impostors; Astrophysics and Space Science Library; Davidson, K., Humphreys, R.M., Eds.; Springer: Boston, MA, USA, 2012; Volume 384, p. 221. [Google Scholar] [CrossRef] [Green Version]
- Davidson, K. Radiation-Driven Stellar Eruptions. Galaxies 2020, 8, 10. [Google Scholar] [CrossRef] [Green Version]
- Wachter, S.; Mauerhan, J.C.; Van Dyk, S.D.; Hoard, D.W.; Kafka, S.; Morris, P.W. A Hidden Population of Massive Stars with Circumstellar Shells Discovered with the Spitzer Space Telescope. Astron. J. 2010, 139, 2330–2346. [Google Scholar] [CrossRef] [Green Version]
- Liimets, T.; Kraus, M.; Moiseev, A.; Duronea, N.; Cidale, L.S.; Fariña, C. Follow-Up of Extended Shells around B[e] Stars. Galaxies 2022, 10, 41. [Google Scholar] [CrossRef]
- Solovyeva, Y.; Vinokurov, A.; Sarkisyan, A.; Atapin, K.; Fabrika, S.; Valeev, A.F.; Kniazev, A.; Sholukhova, O.; Maslennikova, O. New luminous blue variable candidates in the NGC 247 galaxy. Mon. Not. R. Astron. Soc. 2020, 497, 4834–4842. [Google Scholar] [CrossRef]
- Richardson, N.D.; Mehner, A. The 2018 Census of Luminous Blue Variables in the Local Group. Res. Notes Am. Astron. Soc. 2018, 2, 121. [Google Scholar] [CrossRef] [Green Version]
- Wofford, A.; Ramírez, V.; Lee, J.C.; Thilker, D.A.; Della Bruna, L.; Adamo, A.; Van Dyk, S.D.; Herrero, A.; Kim, H.; Aloisi, A.; et al. Candidate LBV stars in galaxy NGC 7793 found via HST photometry + MUSE spectroscopy. Mon. Not. R. Astron. Soc. 2020, 493, 2410–2428. [Google Scholar] [CrossRef] [Green Version]
- Guseva, N.G.; Thuan, T.X.; Izotov, Y.I. Decade-long time-monitoring of candidate luminous blue variable stars in the two very metal-deficient star-forming galaxies DDO 68 and PHL 293B. Mon. Not. R. Astron. Soc. 2022, 512, 4298–4307. [Google Scholar] [CrossRef]
- Solovyeva, Y.; Vinokurov, A.; Tikhonov, N.; Kostenkov, A.; Atapin, K.; Sarkisyan, A.; Moiseev, A.; Fabrika, S.; Oparin, D.; Valeev, A. Search for LBVs in the Local Volume galaxies: Study of two stars in NGC 1156. Mon. Not. R. Astron. Soc. 2023, 518, 4345–4356. [Google Scholar] [CrossRef]
- De Wit, S.; Bonanos, A.Z.; Tramper, F.; Yang, M.; Maravelias, G.; Boutsia, K.; Britavskiy, N.; Zapartas, E. Properties of luminous red supergiant stars in the Magellanic Clouds. arXiv 2022, arXiv:2209.11239. [Google Scholar] [CrossRef]
- Yang, M.; Bonanos, A.Z.; Jiang, B.W.; Gao, J.; Gavras, P.; Maravelias, G.; Ren, Y.; Wang, S.; Xue, M.Y.; Tramper, F.; et al. Evolved massive stars at low-metallicity. I. A source catalog for the Small Magellanic Cloud. Astron. Astrophys. 2019, 629, A91. [Google Scholar] [CrossRef] [Green Version]
- Yang, M.; Bonanos, A.Z.; Jiang, B.W.; Gao, J.; Gavras, P.; Maravelias, G.; Wang, S.; Chen, X.D.; Tramper, F.; Ren, Y.; et al. Evolved massive stars at low metallicity. II. Red supergiant stars in the Small Magellanic Cloud. Astron. Astrophys. 2020, 639, A116. [Google Scholar] [CrossRef]
- Yang, M.; Bonanos, A.Z.; Jiang, B.; Gao, J.; Gavras, P.; Maravelias, G.; Wang, S.; Chen, X.D.; Lam, M.I.; Ren, Y.; et al. Evolved massive stars at low-metallicity. III. A source catalog for the Large Magellanic Cloud. Astron. Astrophys. 2021, 646, A141. [Google Scholar] [CrossRef]
- Zgirski, B.; Pietrzyński, G.; Gieren, W.; Górski, M.; Wielgórski, P.; Karczmarek, P.; Bresolin, F.; Kervella, P.; Kudritzki, R.P.; Storm, J.; et al. The Araucaria Project. Distances to Nine Galaxies Based on a Statistical Analysis of their Carbon Stars (JAGB Method). Astrophys. J. 2021, 916, 19. [Google Scholar] [CrossRef]
- Urbaneja, M.A.; Kudritzki, R.P.; Bresolin, F.; Przybilla, N.; Gieren, W.; Pietrzyński, G. The Araucaria Project: The Local Group Galaxy WLM—Distance and Metallicity from Quantitative Spectroscopy of Blue Supergiants. Astrophys. J. 2008, 684, 118–135. [Google Scholar] [CrossRef]
- McConnachie, A.W. The Observed Properties of Dwarf Galaxies in and around the Local Group. Astron. J. 2012, 144, 4. [Google Scholar] [CrossRef] [Green Version]
- Hartoog, O.E.; Sana, H.; de Koter, A.; Kaper, L. First Very Large Telescope/X-shooter spectroscopy of early-type stars outside the Local Group. Mon. Not. R. Astron. Soc. 2012, 422, 367–378. [Google Scholar] [CrossRef] [Green Version]
- Sanna, N.; Bono, G.; Stetson, P.B.; Monelli, M.; Pietrinferni, A.; Drozdovsky, I.; Caputo, F.; Cassisi, S.; Gennaro, M.; Prada Moroni, P.G.; et al. On the Distance and Reddening of the Starburst Galaxy IC 10. apjl 2008, 688, L69. [Google Scholar] [CrossRef]
- Tehrani, K.; Crowther, P.A.; Archer, I. Revealing the nebular properties and Wolf–Rayet population of IC10 with Gemini/GMOS. Mon. Not. R. Astron. Soc. 2017, 472, 4618–4633. [Google Scholar] [CrossRef] [Green Version]
- Kacharov, N.; Neumayer, N.; Seth, A.C.; Cappellari, M.; McDermid, R.; Walcher, C.J.; Böker, T. Stellar populations and star formation histories of the nuclear star clusters in six nearby galaxies. Mon. Not. R. Astron. Soc. 2018, 480, 1973–1998. [Google Scholar] [CrossRef] [Green Version]
- Tully, R.B.; Courtois, H.M.; Sorce, J.G. Cosmicflows-3. Astron. J. 2016, 152, 50. [Google Scholar] [CrossRef] [Green Version]
- Madore, B.F.; Freedman, W.L. Astrophysical Distance Scale: The AGB J-band Method. I. Calibration and a First Application. Astrophys. J. 2020, 899, 66. [Google Scholar] [CrossRef]
- Spinoglio, L.; Fernández-Ontiveros, J.A.; Malkan, M.A.; Kumar, S.; Pereira-Santaella, M.; Pérez-Díaz, B.; Pérez-Montero, E.; Krabbe, A.; Vacca, W.; Colditz, S.; et al. SOFIA Observations of Far-IR Fine-structure Lines in Galaxies to Measure Metallicity. Astrophys. J. 2022, 926, 55. [Google Scholar] [CrossRef]
- Meyer, M.J.; Zwaan, M.A.; Webster, R.L.; Staveley-Smith, L.; Ryan-Weber, E.; Drinkwater, M.J.; Barnes, D.G.; Howlett, M.; Kilborn, V.A.; Stevens, J.; et al. The HIPASS catalogue—I. Data presentation. Mon. Not. R. Astron. Soc. 2004, 350, 1195–1209. [Google Scholar] [CrossRef] [Green Version]
- Kudritzki, R.P.; Urbaneja, M.A.; Bresolin, F.; Przybilla, N.; Gieren, W.; Pietrzyński, G. Quantitative Spectroscopy of 24 A Supergiants in the Sculptor Galaxy NGC 300: Flux-weighted Gravity-Luminosity Relationship, Metallicity, and Metallicity Gradient. Astrophys. J. 2008, 681, 269–289. [Google Scholar] [CrossRef] [Green Version]
- Qing, G.; Wang, W.; Liu, J.F.; Yoachim, P. The Distance Measurement of NGC 1313 with Cepheids. Astrophys. J. 2015, 799, 19. [Google Scholar] [CrossRef] [Green Version]
- Hernandez, S.; Winch, A.; Larsen, S.; James, B.L.; Jones, L. Chemical Abundances of Young Massive Clusters in NGC 1313. Astron. J. 2022, 164, 89. [Google Scholar] [CrossRef]
- Koribalski, B.S.; Staveley-Smith, L.; Kilborn, V.A.; Ryder, S.D.; Kraan-Korteweg, R.C.; Ryan-Weber, E.V.; Ekers, R.D.; Jerjen, H.; Henning, P.A.; Putman, M.E.; et al. The 1000 Brightest HIPASS Galaxies: H I Properties. Astron. J. 2004, 128, 16–46. [Google Scholar] [CrossRef]
- Hosek, M.W.; Kudritzki, R.P.; Bresolin, F.; Urbaneja, M.A.; Evans, C.J.; Pietrzyński, G.; Gieren, W.; Przybilla, N.; Carraro, G. Quantitative Spectroscopy of Blue Supergiants in Metal-poor Dwarf Galaxy NGC 3109. Astrophys. J. 2014, 785, 151. [Google Scholar] [CrossRef] [Green Version]
- Tammann, G.A.; Reindl, B.; Sandage, A. New period-luminosity and period-color relations of classical Cepheids. IV. The low-metallicity galaxies IC 1613, WLM, Pegasus, Sextans A and B, and Leo A in comparison to SMC. Astron. Astrophys. 2011, 531, A134. [Google Scholar] [CrossRef]
- Kniazev, A.Y.; Grebel, E.K.; Pustilnik, S.A.; Pramskij, A.G.; Zucker, D.B. Spectrophotometry of Sextans A and B: Chemical Abundances of H II Regions and Planetary Nebulae. Astron. J. 2005, 130, 1558–1573. [Google Scholar] [CrossRef] [Green Version]
- Bresolin, F.; Kudritzki, R.P.; Urbaneja, M.A.; Gieren, W.; Ho, I.T.; Pietrzyński, G. Young Stars and Ionized Nebulae in M83: Comparing Chemical Abundances at High Metallicity. Astrophys. J. 2016, 830, 64. [Google Scholar] [CrossRef] [Green Version]
- Hernandez, S.; Larsen, S.; Aloisi, A.; Berg, D.A.; Blair, W.P.; Fox, A.J.; Heckman, T.M.; James, B.L.; Long, K.S.; Skillman, E.D.; et al. The First Metallicity Study of M83 Using the Integrated UV Light of Star Clusters. Astrophys. J. 2019, 872, 116. [Google Scholar] [CrossRef] [Green Version]
- Dopita, M.A.; Seitenzahl, I.R.; Sutherland, R.S.; Nicholls, D.C.; Vogt, F.P.A.; Ghavamian, P.; Ruiter, A.J. Calibrating Interstellar Abundances Using Supernova Remnant Radiative Shocks. Astron. J. 2019, 157, 50. [Google Scholar] [CrossRef] [Green Version]
- Della Bruna, L.; Adamo, A.; Lee, J.C.; Smith, L.J.; Krumholz, M.; Bik, A.; Calzetti, D.; Fox, A.; Fumagalli, M.; Grasha, K.; et al. Studying the ISM at ∼10 pc scale in NGC 7793 with MUSE. II. Constraints on the oxygen abundance and ionising radiation escape. Astron. Astrophys. 2021, 650, A103. [Google Scholar] [CrossRef]
- Gvaramadze, V.V.; Kniazev, A.Y.; Fabrika, S. Revealing evolved massive stars with Spitzer. Mon. Not. R. Astron. Soc. 2010, 405, 1047–1060. [Google Scholar] [CrossRef] [Green Version]
- Cox, N.L.J.; Kerschbaum, F.; van Marle, A.J.; Decin, L.; Ladjal, D.; Mayer, A.; Groenewegen, M.A.T.; van Eck, S.; Royer, P.; Ottensamer, R.; et al. A far-infrared survey of bow shocks and detached shells around AGB stars and red supergiants. Astron. Astrophys. 2012, 537, A35. [Google Scholar] [CrossRef] [Green Version]
- Smith, N.; Li, W.; Miller, A.A.; Silverman, J.M.; Filippenko, A.V.; Cuillandre, J.C.; Cooper, M.C.; Matheson, T.; Van Dyk, S.D. A Massive Progenitor of the Luminous Type IIn Supernova 2010jl. Astrophys. J. 2011, 732, 63. [Google Scholar] [CrossRef]
- Zhang, T.; Wang, X.; Wu, C.; Chen, J.; Chen, J.; Liu, Q.; Huang, F.; Liang, J.; Zhao, X.; Lin, L.; et al. Type IIn Supernova SN 2010jl: Optical Observations for over 500 Days after Explosion. Astron. J. 2012, 144, 131. [Google Scholar] [CrossRef] [Green Version]
- Gal-Yam, A. The Most Luminous Supernovae. Annu. Rev. Astron. Astrophys. 2019, 57, 305–333. [Google Scholar] [CrossRef] [Green Version]
- Werner, M.W.; Roellig, T.L.; Low, F.J.; Rieke, G.H.; Rieke, M.; Hoffmann, W.F.; Young, E.; Houck, J.R.; Brandl, B.; Fazio, G.G.; et al. The Spitzer Space Telescope Mission. Astrophys. J. Suppl. Ser. 2004, 154, 1–9. [Google Scholar] [CrossRef] [Green Version]
- Chambers, K.C.; Magnier, E.A.; Metcalfe, N.; Flewelling, H.A.; Huber, M.E.; Waters, C.Z.; Denneau, L.; Draper, P.W.; Farrow, D.; Finkbeiner, D.P.; et al. The Pan-STARRS1 Surveys. arXiv 2016, arXiv:1612.05560. [Google Scholar]
- McMahon, R.G.; Banerji, M.; Gonzalez, E.; Koposov, S.E.; Bejar, V.J.; Lodieu, N.; Rebolo, R.; VHS Collaboration. First Scientific Results from the VISTA Hemisphere Survey (VHS). Messenger 2013, 154, 35–37. [Google Scholar]
- Gaia Collaboration; Prusti, T.; de Bruijne, J.H.J.; Brown, A.G.A.; Vallenari, A.; Babusiaux, C.; Bailer-Jones, C.A.L.; Bastian, U.; Biermann, M.; Evans, D.W.; et al. The Gaia mission. Astron. Astrophys. 2016, 595, A1. [Google Scholar] [CrossRef] [Green Version]
- Gaia Collaboration; Brown, A.G.A.; Vallenari, A.; Prusti, T.; de Bruijne, J.H.J.; Babusiaux, C.; Bailer-Jones, C.A.L.; Biermann, M.; Evans, D.W.; Eyer, L.; et al. Gaia Data Release 2. Summary of the contents and survey properties. Astron. Astrophys. 2018, 616, A1. [Google Scholar] [CrossRef] [Green Version]
- Maravelias, G.; Bonanos, A.Z.; Tramper, F.; de Wit, S.; Yang, M.; Bonfini, P. A machine-learning photometric classifier for massive stars in nearby galaxies. I. The method. Astron. Astrophys. 2022, 666, A122. [Google Scholar] [CrossRef]
- Williams, S.J.; Bonanos, A.Z.; Whitmore, B.C.; Prieto, J.L.; Blair, W.P. The infrared massive stellar content of M 83. Astron. Astrophys. 2015, 578, A100. [Google Scholar] [CrossRef] [Green Version]
- Cepa, J.; Aguiar-Gonzalez, M.; Bland-Hawthorn, J.; Castaneda, H.; Cobos, F.J.; Correa, S.; Espejo, C.; Fragoso-Lopez, A.B.; Fuentes, F.J.; Gigante, J.V.; et al. OSIRIS tunable imager and spectrograph for the GTC. Instrument status. In Proceedings of the Instrument Design and Performance for Optical/Infrared Ground-based Telescopes, Waikoloa, HI, USA, 25–28 August 2002; Society of Photo-Optical Instrumentation Engineers (SPIE) Conference Series. Iye, M., Moorwood, A.F.M., Eds.; SPIE: Bellingham, WA, USA, 2003; Volume 4841, pp. 1739–1749. [Google Scholar] [CrossRef]
- Rodríguez Espinosa, J.M.; Alvarez, P.; Sánchez, F. The GTC: An Advanced 10m Telescope for the ORM. Astrophys. Space Sci. 1998, 263, 355–360. [Google Scholar] [CrossRef]
- Appenzeller, I.; Fricke, K.; Fürtig, W.; Gässler, W.; Häfner, R.; Harke, R.; Hess, H.J.; Hummel, W.; Jürgens, P.; Kudritzki, R.P.; et al. Successful commissioning of FORS1 - the first optical instrument on the VLT. Messenger 1998, 94, 1–6. [Google Scholar]
- Gómez-González, V.M.A.; Mayya, Y.D.; Rosa-González, D. Wolf-Rayet stars in M81: Detection and characterization using GTC/OSIRIS spectra and HST/ACS images. Mon. Not. R. Astron. Soc. 2016, 460, 1555–1566. [Google Scholar] [CrossRef] [Green Version]
- Freudling, W.; Romaniello, M.; Bramich, D.M.; Ballester, P.; Forchi, V.; García-Dabló, C.E.; Moehler, S.; Neeser, M.J. Automated data reduction workflows for astronomy. The ESO Reflex environment. Astron. Astrophys. 2013, 559, A96. [Google Scholar] [CrossRef] [Green Version]
- Ritchie, B.W.; Clark, J.S.; Negueruela, I.; Najarro, F. Spectroscopic monitoring of the luminous blue variable Westerlund1-243 from 2002 to 2009. Astron. Astrophys. 2009, 507, 1597–1611. [Google Scholar] [CrossRef] [Green Version]
- Aret, A.; Kraus, M.; Šlechta, M. Spectroscopic survey of emission-line stars—I. B[e] stars. Mon. Not. R. Astron. Soc. 2016, 456, 1424–1437. [Google Scholar] [CrossRef] [Green Version]
- Condori, C.A.H.; Borges Fernandes, M.; Kraus, M.; Panoglou, D.; Guerrero, C.A. The study of unclassified B[e] stars and candidates in the Galaxy and Magellanic Clouds†. Mon. Not. R. Astron. Soc. 2019, 488, 1090–1110. [Google Scholar] [CrossRef] [Green Version]
- Britavskiy, N.E.; Bonanos, A.Z.; Mehner, A.; Boyer, M.L.; McQuinn, K.B.W. Identification of dusty massive stars in star-forming dwarf irregular galaxies in the Local Group with mid-IR photometry. Astron. Astrophys. 2015, 584, A33. [Google Scholar] [CrossRef] [Green Version]
- Castro, N.; Herrero, A.; Garcia, M.; Trundle, C.; Bresolin, F.; Gieren, W.; Pietrzyński, G.; Kudritzki, R.P.; Demarco, R. The Araucaria Project: VLT-spectroscopy of blue massive stars in NGC 55. Astron. Astrophys. 2008, 485, 41–50. [Google Scholar] [CrossRef] [Green Version]
- Stasińska, G.; Peña, M.; Bresolin, F.; Tsamis, Y.G. Planetary nebulae and H ii regions in the spiral galaxy NGC 300. Clues on the evolution of abundance gradients and on AGB nucleosynthesis. Astron. Astrophys. 2013, 552, A12. [Google Scholar] [CrossRef] [Green Version]
- Iłkiewicz, K.; Mikołajewska, J. Distinguishing between symbiotic stars and planetary nebulae. Astron. Astrophys. 2017, 606, A110. [Google Scholar] [CrossRef]
- Akras, S.; Gonçalves, D.R.; Alvarez-Candal, A.; Pereira, C.B. Discovery of five new Galactic symbiotic stars in the VPHAS+ survey. Mon. Not. R. Astron. Soc. 2021, 502, 2513–2517. [Google Scholar] [CrossRef]
- Megeath, S.T.; Gutermuth, R.A.; Kounkel, M.A. Low Mass Stars as Tracers of Star and Cluster Formation. Publ. Astron. Soc. Pac. 2022, 134, 042001. [Google Scholar] [CrossRef]
- Mowlavi, N.; Rimoldini, L.; Evans, D.W.; Riello, M.; De Angeli, F.; Palaversa, L.; Audard, M.; Eyer, L.; Garcia-Lario, P.; Gavras, P.; et al. Large-amplitude variables in Gaia Data Release 2. Multi-band variability characterization. Astron. Astrophys. 2021, 648, A44. [Google Scholar] [CrossRef]
- Menzies, J.W.; Whitelock, P.A.; Feast, M.W.; Matsunaga, N. Luminous AGB variables in the dwarf irregular galaxy, NGC 3109. Mon. Not. R. Astron. Soc. 2019, 483, 5150–5165. [Google Scholar] [CrossRef]
- Davidge, T.J. New Blue and Red Variable Stars in NGC 247. Astron. J. 2021, 162, 152. [Google Scholar] [CrossRef]
- van Genderen, A.M. S Doradus variables in the Galaxy and the Magellanic Clouds. Astron. Astrophys. 2001, 366, 508–531. [Google Scholar] [CrossRef] [Green Version]
- Martin, J.C.; Humphreys, R.M. Multi-epoch BVRI Photometry of Luminous Stars in M31 and M33. Astron. J. 2017, 154, 81. [Google Scholar] [CrossRef] [Green Version]
- Porter, A.; Blundell, K.; Podsiadlowski, P.; Lee, S. GG Carinae: Discovery of orbital-phase-dependent 1.583-day periodicities in the B[e] supergiant binary. Mon. Not. R. Astron. Soc. 2021, 503, 4802–4814. [Google Scholar] [CrossRef]
- Massey, P.; McNeill, R.T.; Olsen, K.A.G.; Hodge, P.W.; Blaha, C.; Jacoby, G.H.; Smith, R.C.; Strong, S.B. A Survey of Local Group Galaxies Currently Forming Stars. III. A Search for Luminous Blue Variables and Other Hα Emission-Line Stars. Astron. J. 2007, 134, 2474–2503. [Google Scholar] [CrossRef] [Green Version]
- Williams, S.J.; Bonanos, A.Z. Spitzer mid-infrared point sources in the fields of nearby galaxies. Astron. Astrophys. 2016, 587, A121. [Google Scholar] [CrossRef] [Green Version]
- Clark, J.S.; Castro, N.; Garcia, M.; Herrero, A.; Najarro, F.; Negueruela, I.; Ritchie, B.W.; Smith, K.T. On the nature of candidate luminous blue variables in M 33. Astron. Astrophys. 2012, 541, A146. [Google Scholar] [CrossRef]
- Bonanos, A.Z.; Massa, D.L.; Sewilo, M.; Lennon, D.J.; Panagia, N.; Smith, L.J.; Meixner, M.; Babler, B.L.; Bracker, S.; Meade, M.R.; et al. Spitzer SAGE Infrared Photometry of Massive Stars in the Large Magellanic Cloud. Astron. J. 2009, 138, 1003–1021. [Google Scholar] [CrossRef] [Green Version]
- Bonanos, A.Z.; Lennon, D.J.; Köhlinger, F.; van Loon, J.T.; Massa, D.L.; Sewilo, M.; Evans, C.J.; Panagia, N.; Babler, B.L.; Block, M.; et al. Spitzer SAGE-SMC Infrared Photometry of Massive Stars in the Small Magellanic Cloud. Astron. J. 2010, 140, 416–429. [Google Scholar] [CrossRef] [Green Version]
- Cutri, R.M. VizieR Online Data Catalog: WISE All-Sky Data Release (Cutri+ 2012). VizieR Online Data Cat. 2012, II/311. [Google Scholar]
- Cutri, R.M.; Skrutskie, M.F.; van Dyk, S.; Beichman, C.A.; Carpenter, J.M.; Chester, T.; Cambresy, L.; Evans, T.; Fowler, J.; Gizis, J.; et al. VizieR Online Data Catalog: 2MASS All-Sky Catalog of Point Sources (Cutri+ 2003). VizieR Online Data Cat. 2003, II/246. [Google Scholar]
- McMahon, R.G.; Banerji, M.; Gonzalez, E.; Koposov, S.E.; Bejar, V.J.; Lodieu, N.; Rebolo, R.; VHS Collaboration. VizieR Online Data Catalog: The VISTA Hemisphere Survey (VHS) catalog DR5 (McMahon+, 2020). VizieR Online Data Cat. 2021, II/367. [Google Scholar]
- Gaia Collaboration; Vallenari, A.; Brown, A.G.A.; Prusti, T.; de Bruijne, J.H.J.; Arenou, F.; Babusiaux, C.; Biermann, M.; Creevey, O.L.; Ducourant, C.; et al. Gaia Data Release 3: Summary of the content and survey properties. arXiv 2022, arXiv:2208.00211. [Google Scholar] [CrossRef]
- Astropy Collaboration; Robitaille, T.P.; Tollerud, E.J.; Greenfield, P.; Droettboom, M.; Bray, E.; Aldcroft, T.; Davis, M.; Ginsburg, A.; Price-Whelan, A.M.; et al. Astropy: A community Python package for astronomy. Astron. Astrophys. 2013, 558, A33. [Google Scholar] [CrossRef]
- Astropy Collaboration; Price-Whelan, A.M.; Sipocz, B.M.; Günther, H.M.; Lim, P.L.; Crawford, S.M.; Conseil, S.; Shupe, D.L.; Craig, M.W.; Dencheva, N.; et al. The Astropy Project: Building an Open-science Project and Status of the v2.0 Core Package. Astron. J. 2018, 156, 123. [Google Scholar] [CrossRef]
- Astropy Collaboration; Price-Whelan, A.M.; Lim, P.L.; Earl, N.; Starkman, N.; Bradley, L.; Shupe, D.L.; Patil, A.A.; Corrales, L.; Brasseur, C.E.; et al. The Astropy Project: Sustaining and Growing a Community-oriented Open-source Project and the Latest Major Release (v5.0) of the Core Package. Astrophys. J. 2022, 935, 167. [Google Scholar] [CrossRef]
- Harris, C.R.; Millman, K.J.; van der Walt, S.J.; Gommers, R.; Virtanen, P.; Cournapeau, D.; Wieser, E.; Taylor, J.; Berg, S.; Smith, N.J.; et al. Array programming with NumPy. Nature 2020, 585, 357–362. [Google Scholar] [CrossRef] [PubMed]
- Hunter, J.D. Matplotlib: A 2D graphics environment. Comput. Sci. Eng. 2007, 9, 90–95. [Google Scholar] [CrossRef]


| ID | R.A. | Dec. | Gal. Type | Distance | Metal. | RV |
|---|---|---|---|---|---|---|
| (J2000) | (J2000) | (Mpc) | () | (km s) | ||
| (1) | (2) | (3) | (4) | (5) | (6) | (7) |
| WLM | 00:01:58 | −15:27:39 | SB(s)m: sp | 0.98 ± 0.04 [36] | 0.14 [37] | −130 ± 1 [38] |
| NGC 55 | 00:14:53 | −39:11:48 | SB(s)m: sp | 1.87 ± 0.02 [36] | 0.27 [39] | 129 ± 2 [38] |
| IC 10 | 00:20:17 | +59:18:14 | dIrr IV/BCD | 0.80 ± 0.03 [40] | 0.45 [41] | −348 ± 1 [38] |
| NGC 247 | 00:47:09 | −20:45:37 | SAB(s)d | 3.03 ± 0.03 [36] | 0.40 [42] | 156 [43] |
| NGC 253 | 00:47:33 | −25:17:18 | SAB(s)c | 3.40 ± 0.06 [44] | 0.72 [45] | 259 [46] |
| NGC 300 | 00:54:53 | −37:41:04 | SA(s)d | 1.97 ± 0.06 [36] | 0.41 [47] | 146 ± 2 [38] |
| NGC 1313 | 03:18:16 | −66:29:54 | SB(s)d | 4.61 ± 0.17 [48] | 0.57 [49] | 470 [50] |
| NGC 3109 | 10:03:07 | −26:09:35 | SB(s)m edge-on | 1.27 ± 0.03 [36] | 0.21 [51] | 403 ± 2 [38] |
| Sextans A | 10:11:01 | −04:41:34 | IBm | 1.34 ± 0.02 [52] | 0.06 [53] | 324 ± 2 [38] |
| M83 | 13:37:01 | −29:51:56 | SAB(s)c | 4.90 ± 0.20 [54] | 1.58 [55] | 519 [46] |
| NGC 6822 | 19:44:58 | +14:48:12 | IB(s)m | 0.45 ± 0.01 [36] | 0.32 [56] | −57 ± 2 [38] |
| NGC 7793 | 23:57:50 | −32:35:28 | SA(s)d | 3.47 ± 0.04 [36] | 0.42 [57] | 227 [46] |
| Name | RA | Dec | Prio. | ID | SNR | SpT | Prev. SpT | RV |
|---|---|---|---|---|---|---|---|---|
| (J2000) | (J2000) | (km s) | ||||||
| (1) | (2) | (3) | (4) | (5) | (6) | (7) | (8) | (9) |
| WLM-1 | 00:02:02.32 | −15:27:43.81 | Y | 95 | 30 | B[e]SG | Fe star [78] | −48 ± 10 |
| NGC55-1 | 00:15:09.31 | −39:12:41.62 | Y | 178 | 18 | B[e]SG | – | 156 ± 31 |
| NGC55-2 | 00:15:18.54 | −39:13:12.32 | N | 736 | 46 | LBVc | LBVc/WN11 [79] | 105 ± 38 |
| NGC55-3 | 00:15:37.66 | −39:13:48.68 | N | 2924 | 50 | LBVc | LBVc/WN11 [79] | 202 ± 30 |
| NGC247-1 | 00:47:02.17 | −20:47:40.13 | Y | 246 | 26 | B[e]SG | B[e]SG [27] | 217 ± 12 |
| NGC247-2 | 00:47:03.91 | −20:43:17.22 | N | 1192 | 44 | LBVc | – | 114 ± 41 |
| NGC253-1 | 00:47:04.90 | −25:20:44.12 | Y | 739 | 3 | B[e]SG | – | 283 ± 56 |
| NGC300-1 | 00:55:27.93 | −37:44:19.61 | Y | 67 | 44 | B[e]SG | – | 58 ± 27 |
| NGC300-2 | 00:55:19.17 | −37:40:56.53 | Y | 389 | 9 | B[e]SG | – | 121 ± 34 |
| NGC3109-1 | 10:03:02.11 | −26:08:58.06 | Y | 188 | 70 | LBVc | – | 371 ± 29 |
| NGC7793-1 | 23:57:43.28 | −32:34:01.81 | N | 111 | 19 | B[e]SG c | – | 317 ± 32 |
| Name | Pan-STARRS DR2 | Gaia DR2 [84] | Other | |||||
|---|---|---|---|---|---|---|---|---|
| BP | RP | |||||||
| (mag) | (mag) | (mag) | (mag) | (mag) | (mag) | (mag) | ||
| (1) | (2) | (3) | (4) | (5) | (6) | (7) | (8) | (9) |
| WLM-1 | 0.13 | 0.20 | 0.25 | 0.22 | 0.50 | – | – | – |
| NGC55-1 | – | – | – | – | – | – | – | – |
| NGC55-2 | – | – | – | – | – | 0.24 | 0.18 | – |
| NGC55-3 | – | – | – | – | – | 0.24 | 0.18 | – |
| NGC247-1 | 0.37 | 0.27 | 0.20 | 0.28 | 0.35 | 0.36 | 0.18 | V = 0.29 ± 0.09 [27] |
| [86] | ||||||||
| NGC247-2 | 0.37 | 0.27 | 0.31 | 0.23 | 1.00 | – | – | – |
| NGC253-1 * | – | – | – | – | – | – | – | – |
| NGC300-1 | – | – | – | – | – | – | – | – |
| NGC300-2 | – | – | – | – | – | – | – | – |
| NGC3109-1 | 0.12 | 0.26 | 0.43 | 0.37 | 0.49 | – | – | [85] |
| NGC7793-1 | – | – | – | – | – | – | – | – |
| ID | BP | RP | G | ... | W4 | |||
|---|---|---|---|---|---|---|---|---|
| [mag] | [mag] | [mag] | [mag] | [mag] | [mag] | [mag] | ||
| (1) | (2) | (3) | (4) | (5) | (6) | ... | (30) | (31) |
| WLM-1 | 19.132 | 0.029 | 18.919 | 0.025 | 19.252 | ... | 8.278 | −999 |
| NGC55-1 | 19.797 | 0.053 | 19.199 | 0.045 | 19.552 | ... | 8.115 | 0.233 |
| NGC55-2 | 18.620 | 0.018 | 18.332 | 0.024 | 18.691 | ... | −999 | −999 |
| NGC55-3 | 18.266 | 0.023 | 17.772 | 0.026 | 18.148 | ... | 9.091 | −999 |
| NGC247-1 | 18.602 | 0.036 | 18.341 | 0.028 | 18.723 | ... | −999 | −999 |
| NGC247-2 | 18.798 | 0.026 | 18.344 | 0.029 | 18.573 | ... | −999 | −999 |
| NGC300-1 | 18.557 | 0.013 | 17.784 | 0.013 | 18.323 | ... | 8.897 | −999 |
| NGC300-2 | 20.866 | 0.093 | 20.556 | 0.113 | 20.742 | ... | 9.013 | −999 |
| NGC3109-1 | 17.173 | 0.014 | 16.775 | 0.018 | 17.060 | ... | −999 | −999 |
| NGC7793-1 | 19.635 | 0.043 | 19.460 | 0.053 | 19.520 | ... | −999 | −999 |
Disclaimer/Publisher’s Note: The statements, opinions and data contained in all publications are solely those of the individual author(s) and contributor(s) and not of MDPI and/or the editor(s). MDPI and/or the editor(s) disclaim responsibility for any injury to people or property resulting from any ideas, methods, instructions or products referred to in the content. |
© 2023 by the authors. Licensee MDPI, Basel, Switzerland. This article is an open access article distributed under the terms and conditions of the Creative Commons Attribution (CC BY) license (https://creativecommons.org/licenses/by/4.0/).
Share and Cite
Maravelias, G.; de Wit, S.; Bonanos, A.Z.; Tramper, F.; Munoz-Sanchez, G.; Christodoulou, E. Discovering New B[e] Supergiants and Candidate Luminous Blue Variables in Nearby Galaxies. Galaxies 2023, 11, 79. https://doi.org/10.3390/galaxies11030079
Maravelias G, de Wit S, Bonanos AZ, Tramper F, Munoz-Sanchez G, Christodoulou E. Discovering New B[e] Supergiants and Candidate Luminous Blue Variables in Nearby Galaxies. Galaxies. 2023; 11(3):79. https://doi.org/10.3390/galaxies11030079
Chicago/Turabian StyleMaravelias, Grigoris, Stephan de Wit, Alceste Z. Bonanos, Frank Tramper, Gonzalo Munoz-Sanchez, and Evangelia Christodoulou. 2023. "Discovering New B[e] Supergiants and Candidate Luminous Blue Variables in Nearby Galaxies" Galaxies 11, no. 3: 79. https://doi.org/10.3390/galaxies11030079