1. Introduction
The EHT Collaboration has presented the first direct images of the event horizon of the supermassive black holes (SMBHs) at the center of M 87 (M 87*) [
1,
2,
3,
4,
5,
6,
7,
8] and at the Galactic Center (Sgr A*) [
9,
10,
11,
12,
13,
14]. The 230 GHz radio image of M 87* appears as a linearly polarized asymmetric ring-like feature of
with a brightness temperature of ∼
K and a derived BH mass of
[
15]. Image features are broadly consistent with those predicted by general relativistic magneto-hydrodynamical (GRMHD) simulations including synchrotron radiation from relativistic electrons interacting with the magnetic field within a magnetically arrested accretion flow (MAD) [
5,
6].
Reconstructing a representative image of Sgr A* from EHT data proved more challenging due to the intrinsic variability of the source on timescales considerably faster than the baseline rotation over a night. However, characteristic images reflected most likely a compact emission region with an asymmetric thick ring of diameter
, consistent with the known mass of
derived from dynamical studies of orbiting stars [
16].
The EHT 2017 array viewed M 87 from only five unique geographic locations spanning the Globe, and the sparseness of the array provided the ability to reconstruct only a simple, relatively compact structure at a limited dynamic range ∼10:1 for M 87* [
4]. In particular, the faint extended features of the M 87 jet, predicted by simulations and seen at nearby wavelengths [
17], were inaccessible due to the lack of dense short-baseline coverage. For Sgr A*, source variability, which is expected on the sub-hour timescale, is also evident in the EHT time-domain data [
10,
18], but the 2017 array coverage was too spare to confidently track these dynamical features in the image itself [
11]. A much denser instantaneous coverage would enable snapshot imaging of Sgr A*, allowing hot spots and other rapid features to be followed over the course of a single night.
The primary science targets of the EHT are M 87* and Sgr A* as these are the two black holes on the sky with the largest apparent shadow diameter; however, other active galactic nuclei (AGN) sources have also been observed such as Cen A [
19], 3C 279 [
20], and J1924-2914 [
21]. The extreme resolution of the EHT provides a view into the inner regions of the black hole systems, allowing the highest resolution imaging of SMBH jets. However these images are also at a low dynamic range, which limits the detail available for jet modeling and calls for improved u–v coverage. Since the observations of April 2017, the EHT array has been steadily improved through the addition of new telescopes and a doubling of the bandwidth (to 64 Gbps in 2018). The Greenland Telescope (GLT) joined in 2018, while the Kitt Peak 12 m Telescope (KP) and the Northern Extended Millimeter Array (NOEMA) joined in 2020. The first 345 GHz science observations with the EHT + the Atacama Large Millimeter/submillimeter Array (ALMA) are scheduled for 2023.
The ngEHT is currently undergoing an NSF-funded design and architecture study (AST-1935980). It envisions almost doubling the number of stations of the EHT with dedicated antennas and locating them at strategic points around the world to optimize Very Large Baseline Interferometry (VLBI) coverage [
22,
23]. Its three main goals are to: (1) increase the size of the EHT array to improve the imaging dynamic range by two to three orders of magnitude; (2) extend observations to new frequencies in particular to simultaneous 230/345 GHz (0.87 mm) as it increases the resolution to 15
and enables multi-frequency calibration and source modeling; and (3) use the improved snapshot coverage (for Sgr A*) and telescope availability and operational agility (for M 87 and AGN targets) to enable time-domain imaging (movies), allowing the direct study of source dynamics.
2. The Large Millimeter Telescope
The Large Millimeter Telescope (LMT) is located on Sierra Negra in central Mexico at an altitude of 4600 m. It is a 50 m-diameter single-dish radio telescope designed to operate between 0.85 mm and 4 mm with a field of view of 4 arcmins and an offset pointing accuracy better than 1 arcsec RMS [
24]. It is the largest science project ever undertaken jointly by Mexico and the United States and the most expensive scientific facility built in Mexico. The telescope joined the North American Very Large Baseline Array (VLBA) for the first LMT VLBI science at 3 mm in 2014 [
25], and the first 1 mm VLBI fringes to the LMT were obtained the following year. In 2017, the LMT joined as one of the telescopes in the EHT-2017 array used to obtain the first images of the black hole shadow of M 87* [
1,
2].
The LMT is the largest single-dish aperture in the EHT global VLBI network and provides essential short and mid-baselines to the rest of the array. In addition to filling in critical u–v coverage, the large collecting area and central location of the LMT make it particularly suitable to act as an “anchor” station for the network—where strong detections between the LMT and other EHT antennas could be used to bring the entire network to a common phase and clock reference.
The LMT is actively undergoing a series of upgrades to improve both its current performance and to prepare it as a key dual-frequency anchor station in the future ngEHT.
Table 1 shows the upgrades which include: (1) an increase in the dish surface accuracy for 230 and 345 GHz efficiency, (2) an increase in the thermal stability to enable day-time operation and longer u–v tracks, and (3) a new dual-frequency receiver capable of simultaneous dual-polarization observations at 230 and 345 GHz over an intermediate frequency (IF) bandwidth of 8 GHz per sideband.
Figure 1 shows that the performance increase due to the thermal stability and the dual-frequency receiver (denoted as LMT-II) will allow the LMT to act as an anchor station for small dishes (<6 m in diameter) in the ngEHT array. This serves a particularly critical role in ngEHT observations when other high-sensitivity stations such as ALMA or NOEMA are not able to participate (such as the extended maintenance performed in February to ALMA when the weather across the Northern Hemisphere sites is often excellent).
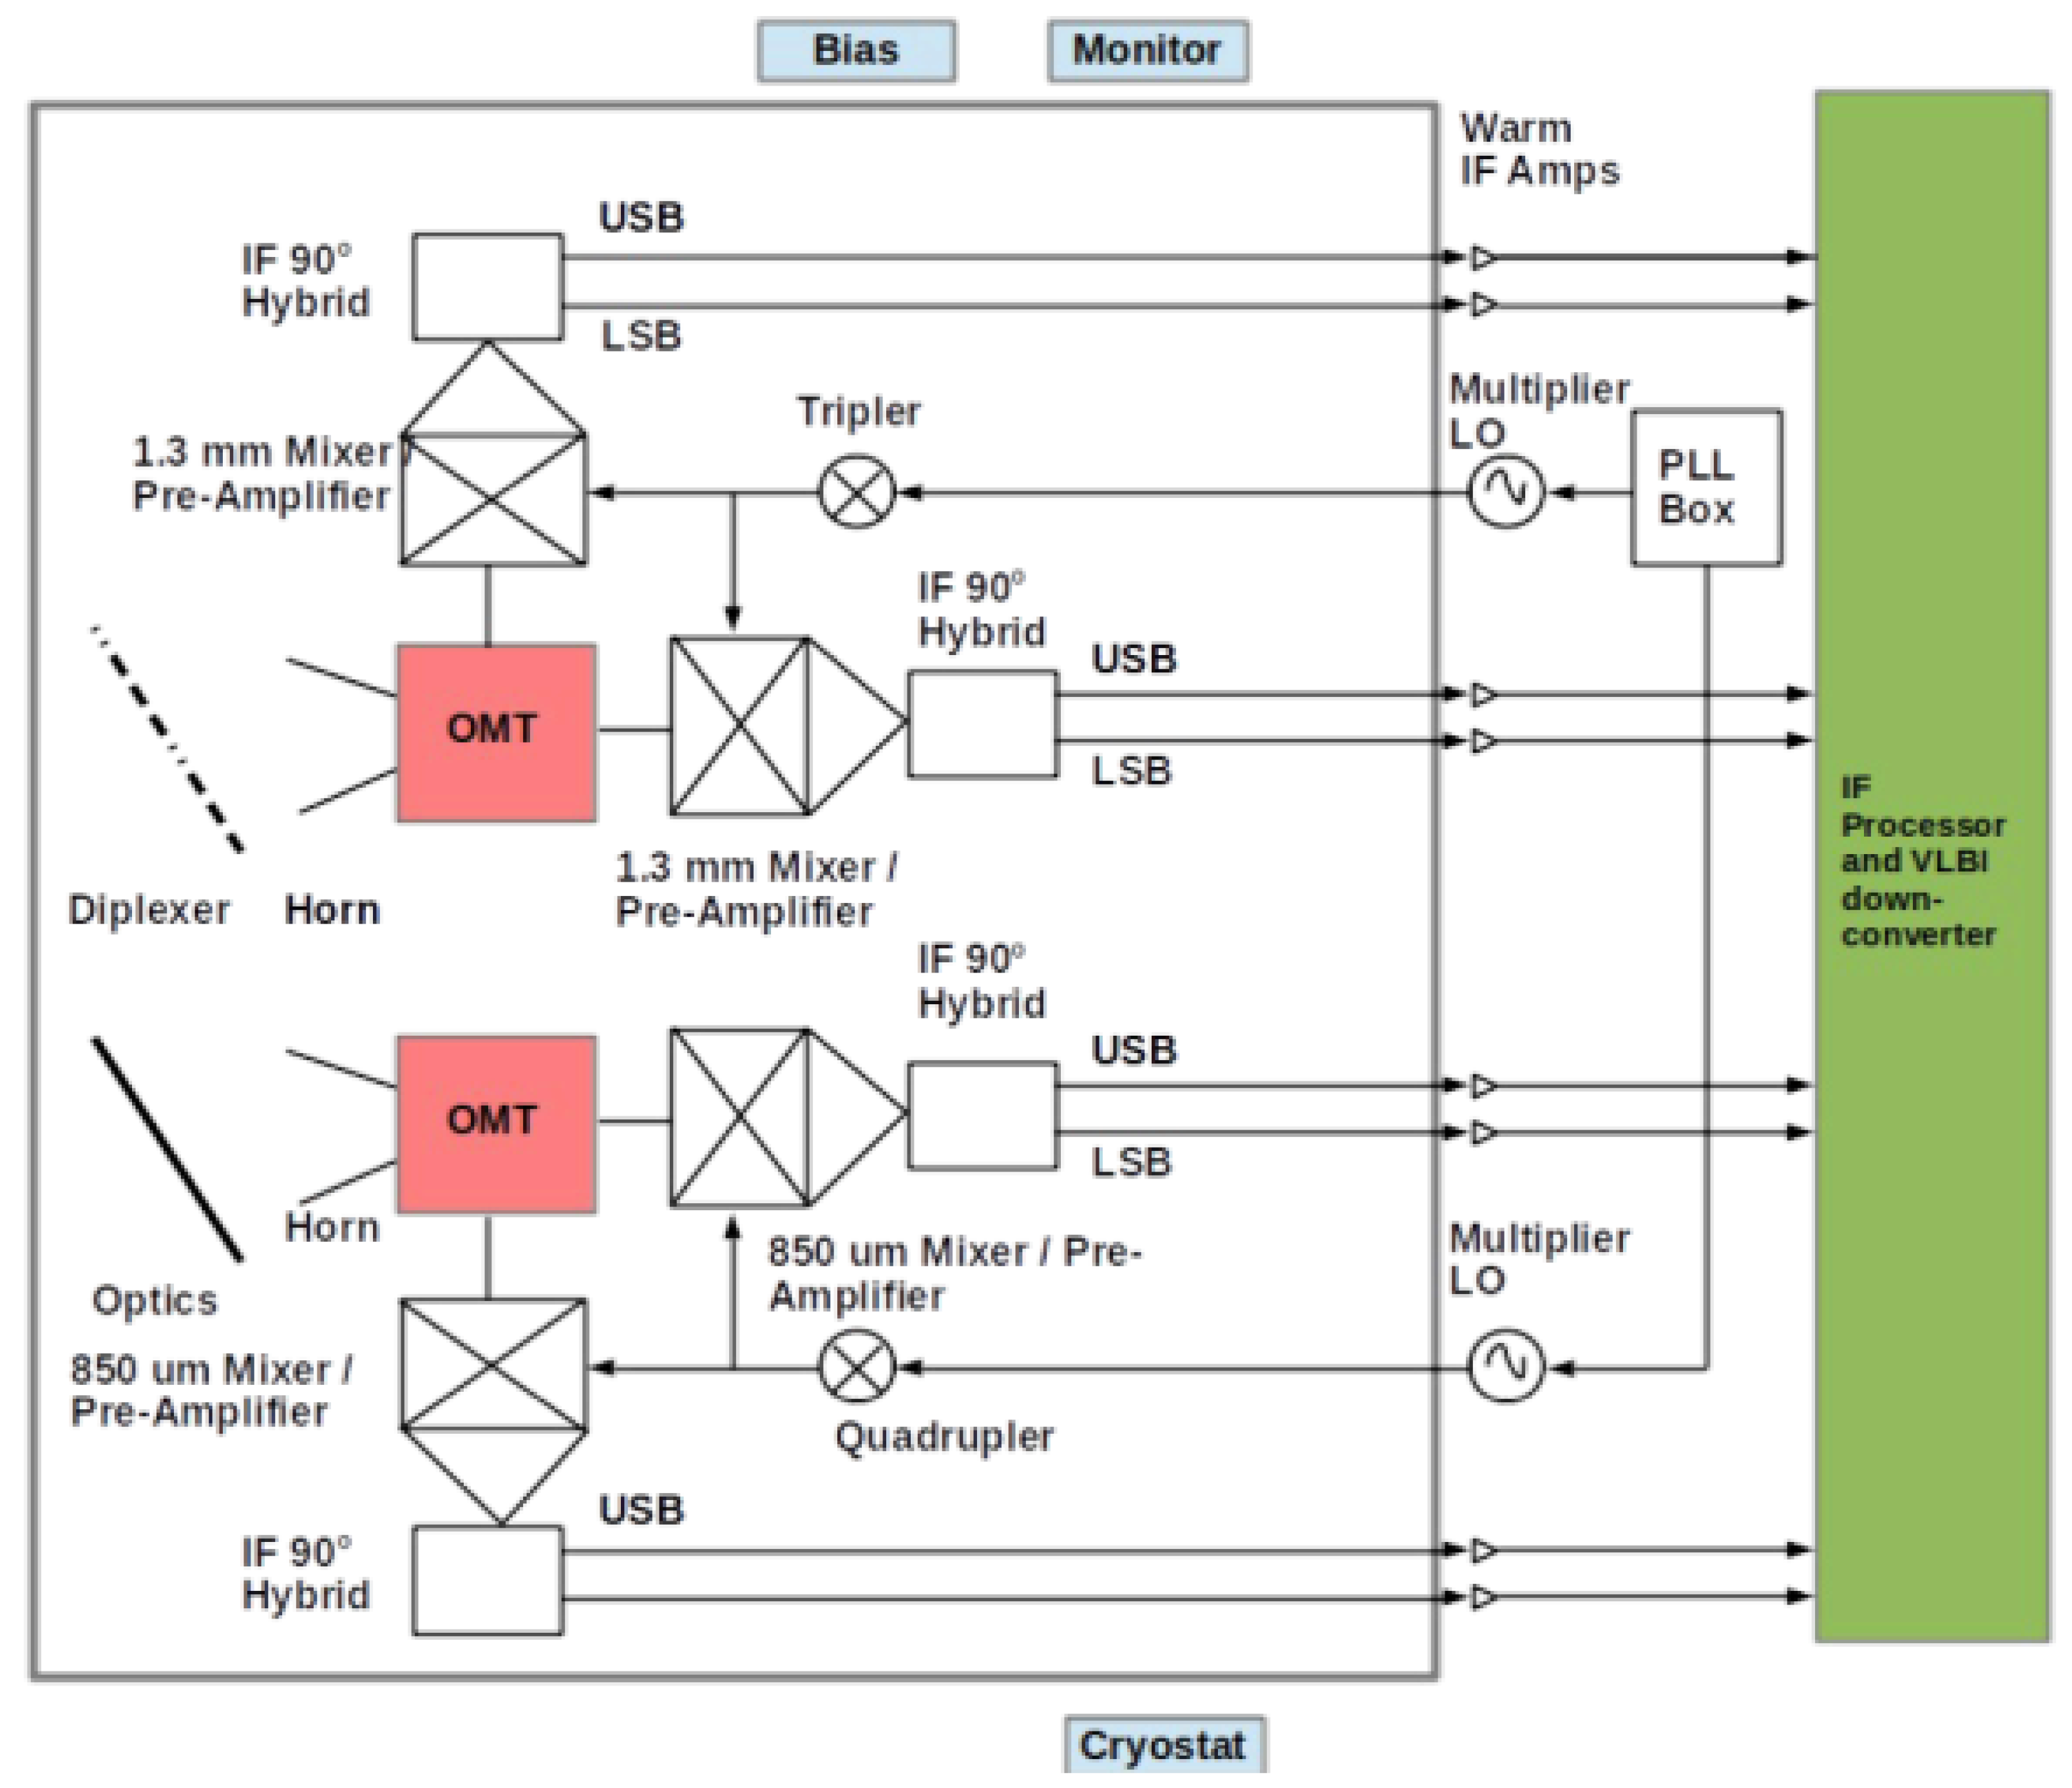
2.1. Dual-Frequency Receiver
As part of ngEHT, the University of Massachusetts (UMass) was commissioned to design and build a dual-frequency receiver capable of simultaneous observations at 1 mm (230 GHz) and 850
(345 GHz). In
Figure 2, we present a block diagram of a dual-frequency receiver being constructed for ngEHT and to be deployed at the LMT by the end of 2023. A single cryostat will hold two different receivers, and two different frequency bands are sent to each receiver through a frequency diplexer. Each receiver is dual-polarized and features sideband separation mixers. Both bands illuminate a single beam on the sky, and the overall dual-frequency receiver has eight IF outputs, each of which is 4–12 GHz wide.
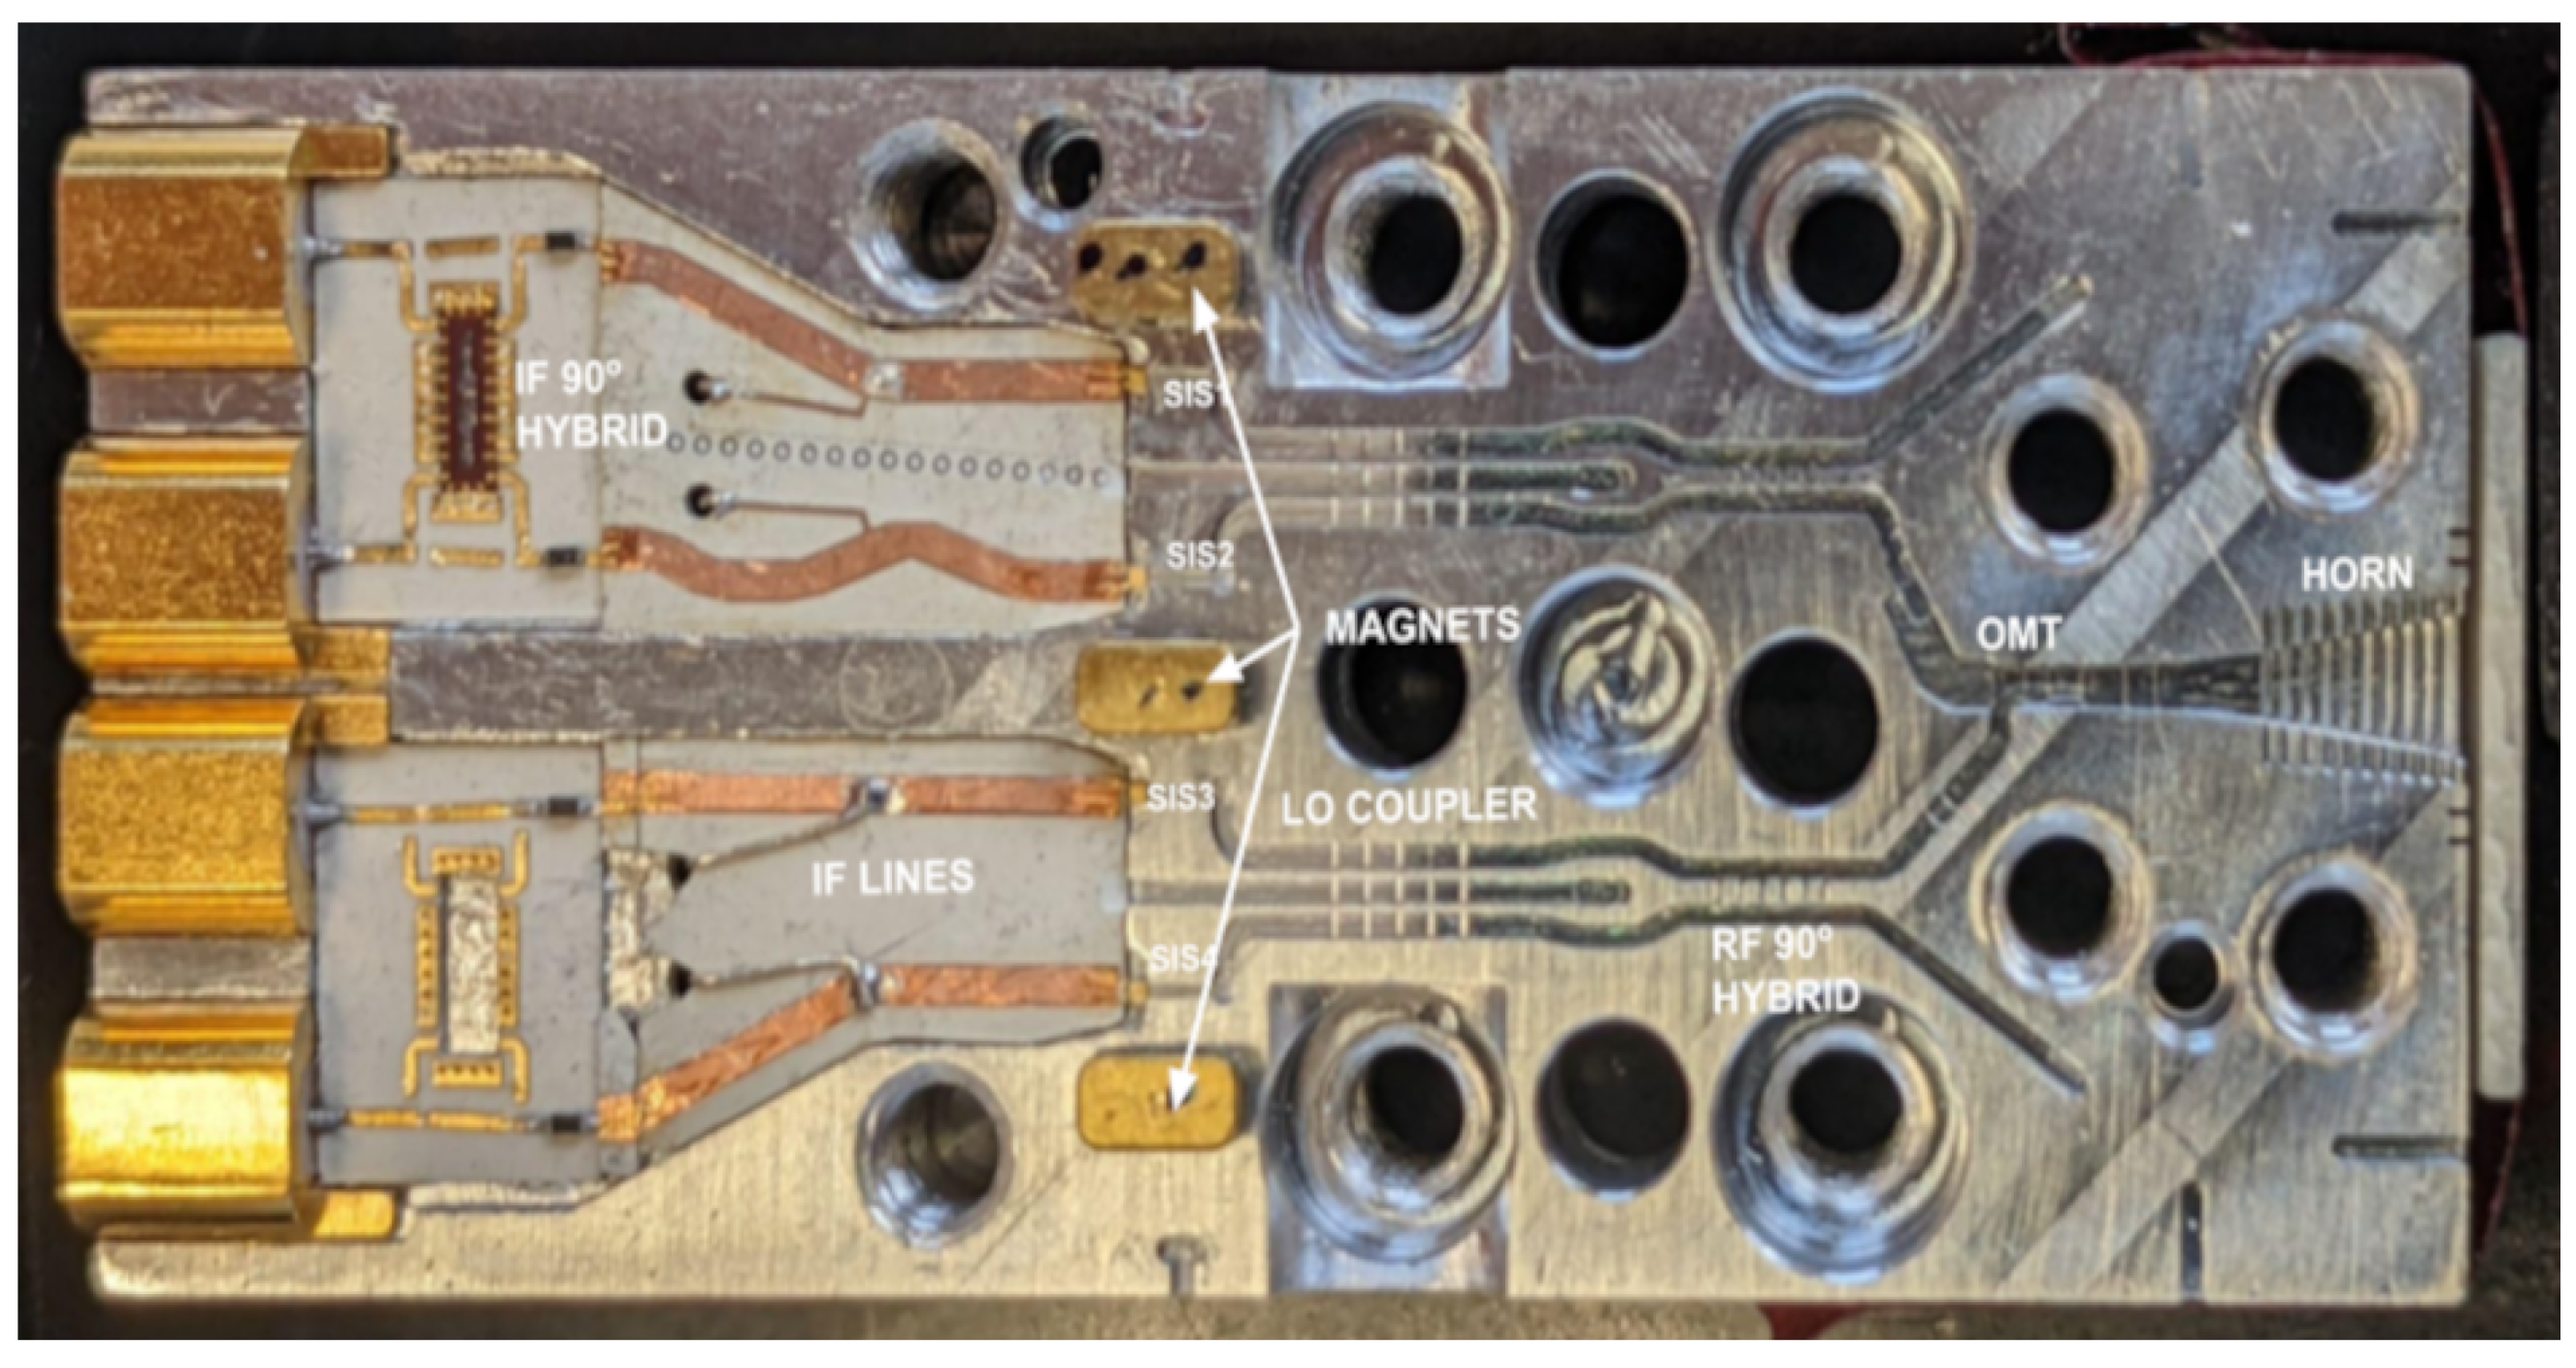
In an effort to make the design highly modular and scalable to reproduce for additional new telescopes of the ngEHT array, considerable effort has been invested into making the mixer block compact and highly integrated. In
Figure 3, we show the components of this highly integrated block. Shown is the bottom block of a split-block mixer. A similar design will be employed for the 345 GHz receiver as well. The four IF outputs from each of the mixer blocks are amplified cryogenically using low-noise amplifiers from Low Noise Factory.
Each of the receiver bands is equipped with independent local-oscillator (LO) systems. YIG oscillators at lower frequencies (in the 18–30 GHz) range are multiplied up to the 95 GHz band and subsequently amplified using W-band (75 to 110 GHz) power amplifiers. This is then fed through cryogenic triplers to produce the required LO signal. The drain currents of the last stage of the W-band power amplifiers can be adjusted to set the appropriate LO power for the mixers. The whole LO system is phase locked and fully computer controlled with no mechanical moving parts.
A prototype 230 GHz mixer block has been assembled and tested in the lab with both polarizations and sidebands with cryogenic IF amplifiers.
Figure 4 shows the results of noise temperature tests of the 230 GHz receiver component. The figure shows the noise temperature is within five-times the quantum limit at all RF frequencies tested.
Through a separate project, the Smithsonian Observatory and UMass will be acquiring 3 GHz superconductor–isolator–superconductor (SIS) junctions from Jet Propulsion Laboratory (JPL). Mixer blocks scaled from the design at the 230 GHz complement will be constructed at UMass and used with the JPL junctions. Each receiver has a specification of a single-sideband noise temperature of 5–6-times the quantum limit in each band.
2.2. The LMT Thermal Stabilization Program
The ultimate performance of a large telescope like the LMT is often limited by its response to thermal gradients that develop within the antenna structure. These gradients lead to deformations of the primary reflector surface, which in turn cause a loss of antenna gain. Thermally induced deformations may also change the relative position of the secondary and primary mirrors, leading to antenna focus and pointing errors. The performance of the LMT is currently limited by such effects, and as a result, scientific work at the telescope is limited to ten hours at night when the telescope is relatively thermally stable. Moreover, even during night-time conditions, the antenna still develops internal temperature gradients as it cools, and the resulting deformations require corrections every few hours to achieve the best performance. The LMT’s active primary surface system provides the means to realign the surface continuously in response to any thermal deformation. Thus, it is only for the lack of the ability to measure the deformations that we are not already able to maintain the surface shape in the presence of structural temperature gradients. The LMT has undertaken a major technical program to develop systems and methods that will reduce the magnitude of temperature gradients within the structure and provide measurements to estimate the surface deformations so that the active surface can correct them. These problems are being pursued in four basic ways: (1) mitigation of thermal effects, through the installation of a ventilation system in the antenna backup structure; (2) measurement of structural temperatures, combined with finite-element modeling, to predict and correct surface deformations; (3) active measurement of the surface shape during observations using the out-of-focus (OOF) holography technique; and (4) real-time measurements of the surface shape, using laser metrology techniques, to allow the surface shape to be updated and maintained in real-time by the active surface.
2.2.1. Mitigation of Thermal Effects
Most large high-frequency antennas are equipped with systems that are designed to maintain the antenna structure at a uniform temperature. The original design of the LMT called for two measures to be installed to reduce temperature gradients within the structure. The first mitigating measure was the enclosure of the antenna in thermally insulating cladding. This was performed at the time of antenna construction. The cladding prevents solar radiation from striking the antenna backup structure and alidade directly. However, temperature gradients of a few degrees still build up within the backup structure due to the uneven distribution of solar energy and differences in the thermal mass of different parts of the structure. The second mitigation measure proposed with the original LMT design was the installation of a ventilation system. The ventilation system is a system of fans arranged to move air through the backup structure in order to minimize temperature gradients between different structural elements. The system to be installed is similar in nature to that of the IRAM 30 m antenna, but unlike that system, there is no attempt to set the structural temperatures to match a single desired value. Rather, the goal is to achieve the uniformity of the temperatures within the backup structure. The backup structure ventilation system is about to begin its detailed design work, which will be followed by the procurement and installation of the ventilation fans and ducts for the backup structure. The plan calls for the installation to take place during the summer months of 2023.
2.2.2. Measurement of Structural Temperatures
The LMT was originally equipped with a modest set of 64 temperature sensors distributed over the entire structure. These sensors have been used to provide a better understanding of thermal effects on the telescope, but the coverage of the structure with sensors is not adequate to provide the resolution needed for structural thermal modeling. Therefore, an additional 256 sensors are being procured for installation, primarily for measurements within the antenna backup structure. The goal of the sensor system is to achieve 0.1 degrees C accuracy. This can be realized with four-wire Pt100 Resistance Temperature Detector (RTD) sensors if care is taken in the calibration of both the sensor and the readout system. Sensor procurement is now underway with the expectation of the delivery of the sensors in 2023. Sensor installation will then be able to begin in early 2023 and should be completed by the spring.
Structural temperatures may be used with finite-element models to predict the deformation of the antenna structure. The LMT’s original finite-element model has been reviewed and updated to allow more accuracy in predictions of the structure’s thermal behavior. The model is being used to compute a set of thermal cases that can be used to predict the surface deformation given an arbitrary pattern of temperatures within the structure. After the installation of the new temperature sensors on the antenna, the system will be commissioned against direct observation of surface deformations made using photogrammetry.
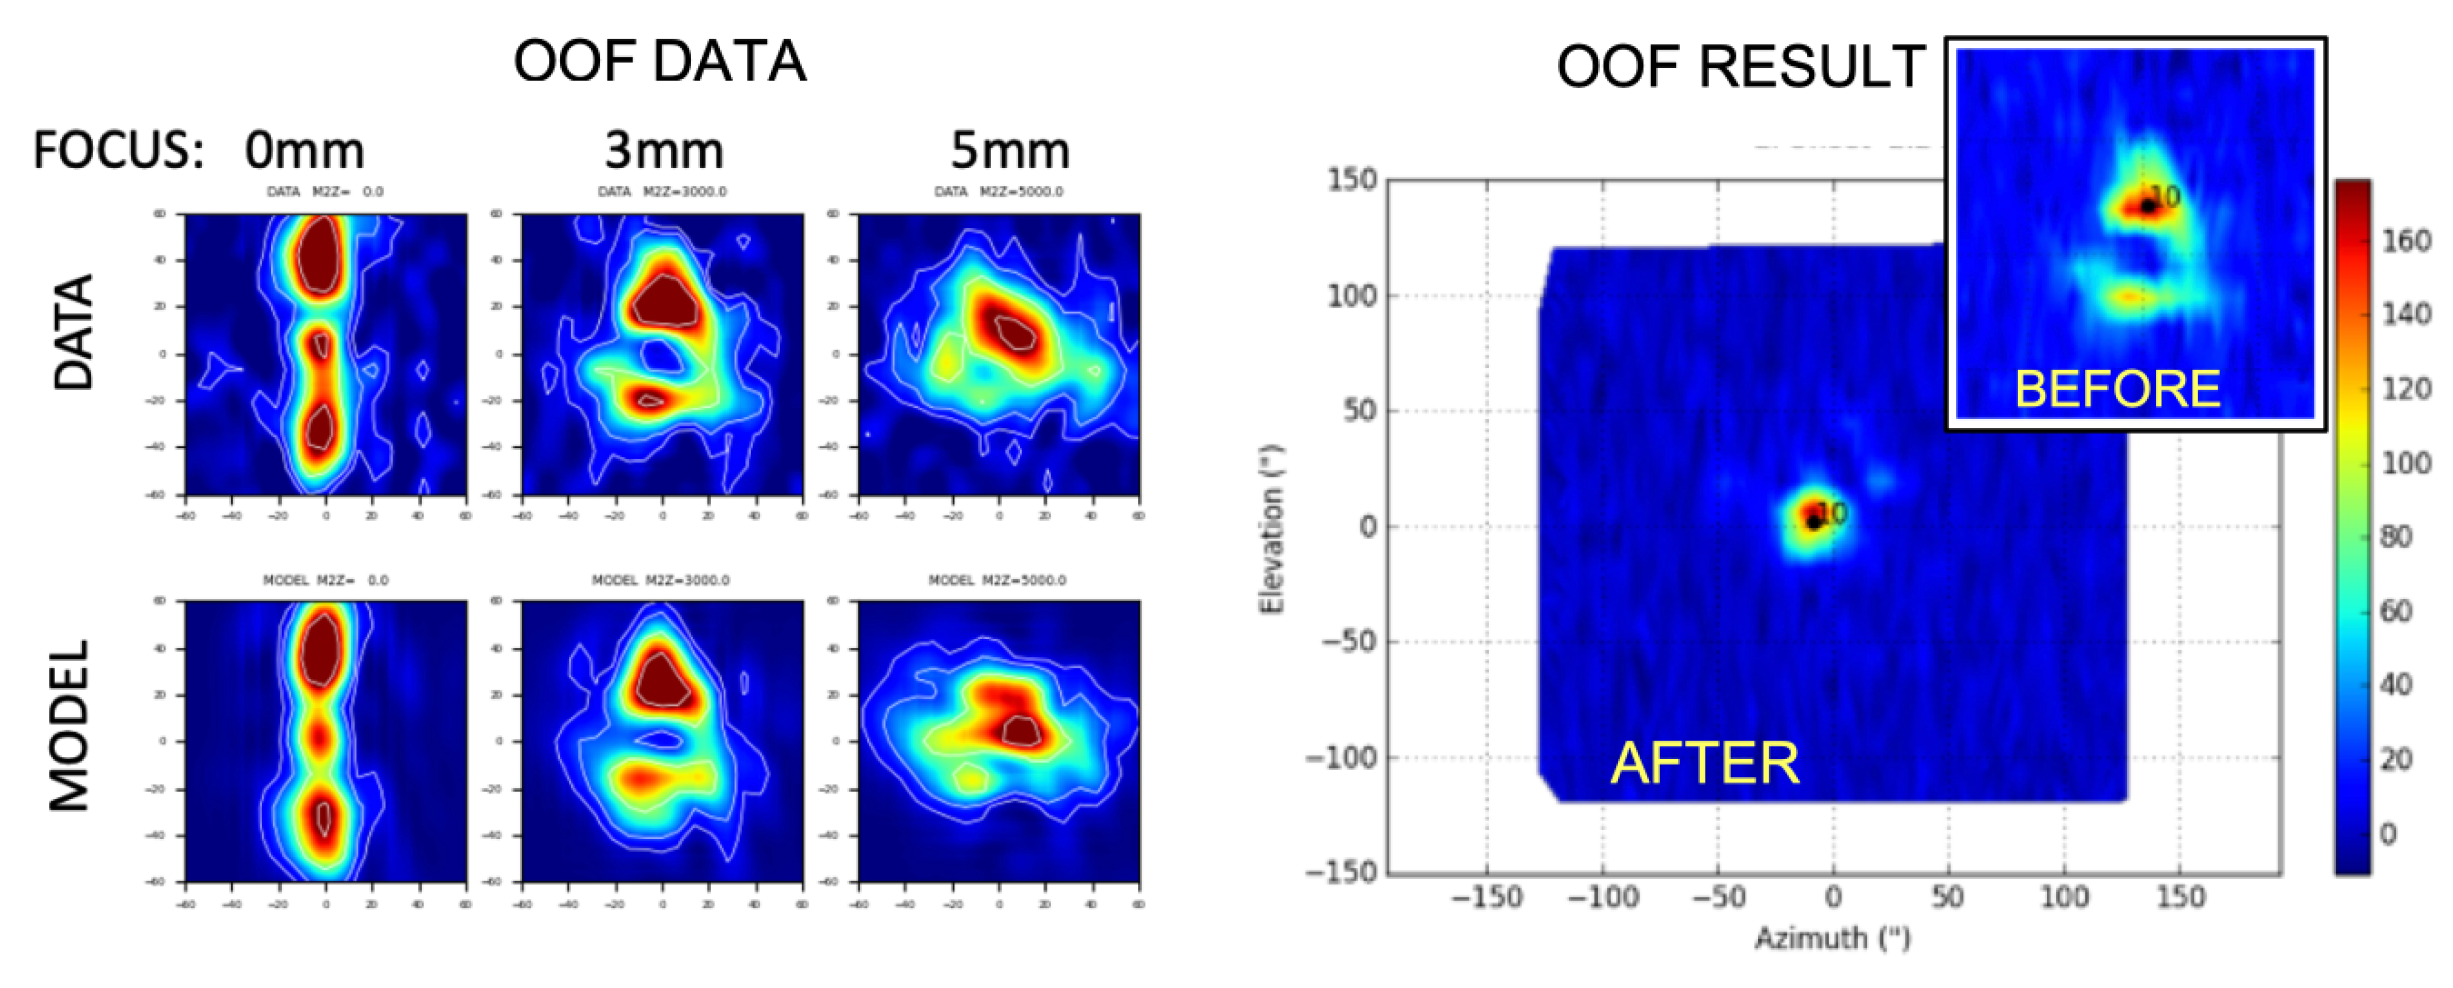
2.2.3. Astronomical Measurements of Surface Shape
The out-of-focus (OOF) holography technique has been used successfully at other telescopes to measure the shape of the primary surface. At the LMT, past studies of the thermal deformation of the surface shape have shown that the dominant mode of deformation is an astigmatism. The magnitude of the effect varies from night to night and within a night. We have successfully used astronomical measurements to estimate the amount of astigmatism by using the active surface to introduce intentional deformations, following the Zernike vertical astigmatism polynomial, to find the optimum shape. The technique works well and must be used at high frequencies to obtain the best results. With OOF, we can, in principle, solve for a greater number of Zernike modes to achieve better surface accuracy. The LMT has installed OOF software on the antenna and began testing during the first half of 2022 (see
Figure 5). System commissioning will be completed during the fall of 2022.
2.2.4. Large Aperture Surface Error Recovery System
The techniques for determining the primary surface deformations of the LMT mentioned above have limitations. Astronomical measurement of surface shape can take fifteen minutes or more to complete, and this means that they can struggle to converge to a solution during times when the structure changes rapidly. Inferences about structural changes based on the temperature of the structural members require significant “calibration” of the technique and ultimately will only be as good as the underlying model. Clearly, the best solution is to directly measure, in real-time, the shape of the antenna and the relative positions of its optical elements. Thus, the LMT collaboration has embarked on the development of a new system: the Large Aperture Surface Error Recovery System (LASERS). The purpose of the LASERS project is to develop a system that will: (1) measure the LMT’s low-order primary surface deformation so that the active surface may be used to remove transient deformations imposed by thermal gradients within the structure; and (2) measure the location of the LMT’s secondary mirror with respect to the primary so that the relative position may be maintained to high accuracy. The system under development relies on an instrumental capability originally developed for monitoring alignments in large particle accelerators and is currently being built into large optical telescopes for the alignment of optical elements in the telescope structure. Our proposed alignment system is based on the Hexagon Absolute Multiline Technology (AMT) System, which provides a means to make highly accurate measurements of the distances between points on the antenna structure. Simulation studies (see
Figure 6) suggest that LASERS will be able to remove low-spatial-order thermal deformations of the primary to a level of about 20 microns RMS over the surface.
Secondary position measurements will be made to an accuracy of about 10 microns RMS, which corresponds to a pointing error due to subreflector motions of 0.25 arcsec. The LASERS program has acquired the laser metrology device, which is currently undergoing lab tests. It is anticipated that the instrument will be sent to the LMT site for further testing by the end of 2022. Full system commissioning is expected to begin in the spring of 2023.
3. Performance Simulations
To evaluate the impact of LMT upgrades on the overall performance of both near-term EHT observations and the ngEHT, we utilize end-to-end simulations of actual observations with the VLBI array and reconstructions of ground-truth images and models. The simulations span a range of projected telescope performance parameters, (ng)EHT array configurations, and observing scenarios.
3.1. Synthetic Data
As of the most recent April 2022 observations, the EHT consists of 11 telescopes in nine distinct geographical locations: LMT on Volcan Sierra Negra in central Mexico, ALMA and the Atacama Pathfinder Experiment telescope (APEX) separated by
km in the Atacama Desert in Chile, the South Pole Telescope (SPT) at the South Pole, GLT in Thule, Greenland, the IRAM 30 m telescope on Pico Veleta (PV) in Spain, NOEMA in France, the Submillimeter Telescope Observatory in Arizona (SMT) on Mt. Graham and the 12 m radio telescope at Kitt Peak (KP) both in Arizona, USA, and the Submillimeter Array (SMA) and the James Clerk Maxwell Telescope (JCMT) co-located on Maunakea, Hawaii, USA. The current EHT observes 4 GHz in dual-polarization in each of two sidebands of about
GHz and is currently commissioning non-simultaneous observations at 345 GHz observations for qualified sites for 2023. Details of the configuration of the EHT and nominal performance during the 2017 campaign are provided in [
2,
3].
The ngEHT concept is to supplement the current EHT by adding several new telescopes in key geographic locations, doubling the bandwidth at each observing frequency, and supporting simultaneous 230 and 345 GHz observations across the array [
22]. For a hypothetical ngEHT array configuration, we adopted a selection of 10 additional candidate sites from [
23], which were also used in the first ngEHT data analysis challenge [
26]. The candidates sites are listed in
Table 2.
Station performance is based on an assumption of new 6 meter dishes installed at sites with historical records of valid local site weather and without an existing dish.
Simulated VLBI observations were generated using EHT-imaging [
27,
28] assuming 5 min scans were taken every 10 min. It is assumed that individual telescopes are amplitude-calibrated, but without known station phases, which is appropriate for high-frequency VLBI, where absolute phase calibration (e.g., from a nearby phase calibrator) is generally not possible.
3.2. Coverage and Daytime Operation
To test the contribution of LMT daytime observations to M 87 coverage with the ngEHT, we simulated a full-track (24-h) observation on the first day of each month of 2021. To illustrate this,
Figure 7 and
Figure 8 show (left) a full-track observation and (right) the corresponding u–v plane during April and November of 2021, respectively. The orange markers show the baselines using the EHT array, while the blue markers show the baselines added to the EHT to create the ngEHT. It is clear from these figures that the ngEHT improved both the resolution and u–v coverage compared to the EHT for both months. Note that the November coverage illustrates how the baselines with the LMT almost doubled in time when daytime operations are possible after 16 UT. Thus, the ability to operate outside of a stable night-time window is important if the LMT is to serve as an anchor station throughout a multi-month monitoring campaign on M 87 during the winter months in the Northern Hemisphere.
For Sgr A*, we are interested in the snapshot ability to reconstruct the source given that Sgr A* has characteristic dynamical timescales of minutes. In this case, we cannot rely on Earth’s rotation over a full track to build coverage for static imaging. We determined the UT hour with the maximum number of baselines to the LMT for a given day to evaluate snapshot imaging capability with the LMT.
Figure 9 shows the active stations and the u–v coverage for a single-hour snapshot. With respect to the EHT 2022 coverage, the ngEHT is much better at filling the u–v plane through the combined benefit of double the number of stations and simultaneous multi-frequency coverage.
3.3. Source Models
For our reconstructions, we used two GRMHD models, one for each source: M 87 and Sgr A*. Both models are ray-traced at 230 GHz and 345 GHz.
The M 87 model is a GRMHD simulation from [
29]. It assumes a mass of
at a distance of 16.7 Mpc and a dimensionless spin
. This simulation allows the ions and electrons to evolve self-consistently in a MAD disk, giving, as a result, a two-temperature evolution. This simulation can reproduce a wide opening angle of the jet consistent with VLBI observations at 43 and 86 GHz [
30]. In addition, it is able to produce a jet with a power of
close to the correct estimated value of M 87.
The Sgr A* model, prepared by Christian Fromm, is a semi-analytic stationary RIAF model at an inclination of
° with
. The model is scaled to have a mass of
at a distance of 8.178 kpc, consistent with [
16].
3.4. Image Reconstruction
Once the source model is selected and a synthesized observation is created, we start the image reconstruction. We use the software package EHT-imaging [
27,
31] for imaging the synthetic data. EHT-imaging uses forward modeling and gradient descent to fit a regularized maximum likelihood image model to the u–v data or derived data products. In this work, we fit a combination of the closure phases, the log-closure amplitudes, and the visibility amplitudes accounting for a fractional gain error. EHT-imaging makes use of regularization to find a solution to the generally underconstrained sparse imaging problem. We use a combination of a simple entropy regularizer, total variation and total squared variation (smoothness), an image sparsity constraint (l1), and a preference for overall spatial compactness.
For M 87 reconstructions, the starting image for optimization, as well as the prior for the simple entropy regularizer are composed of two concentric Gaussians: (1) a central Gaussian with FWHM = with an integrated flux equal to 90% of the model’s total flux of the model and (2) a diffuse Gaussian with FWHM = with an integrated flux equal to 25% of the model’s total flux. The large diffuse Gaussian simulates the diffuse jet emission we expect from this source without assuming any particular direction. For Sgr A* case, the prior is a simple Gaussian with FWHM = and an integrated flux equal to the model’s integrated flux.
EHT-imaging supports simultaneous multi-frequency reconstruction by solving for the image at a reference frequency (in our case, 230 GHz) and solving for a corresponding map of the spectral index [
32]. We utilize this unique capability in the case of ngEHT dual-frequency observations, where the models are typically slightly different at both frequencies since there is some shallow, but non-zero spectral index.
3.5. Image Fidelity
To evaluate the quality of our image reconstructions, we introduce a figure-of-merit for image dynamic range, which is responsive to the non-uniform image noise that is characteristic of sparse image reconstruction under various image priors. The metric is based on the pixel distribution of residual noise after subtracting the model ground truth from the reconstruction:
where
is the intensity of the reconstruction,
is the intensity of the model, and
is the peak intensity of the model. To apply this metric to our reconstructions, we align the reconstructions with the model and blur them with a circular beam of 3
before calculating the model residual.
The top row of
Figure 10 shows the M 87 model (left) and the reconstructions using the EHT (middle) and ngEHT (right). The ngEHT reconstruction shows a more detailed and faithful image than the EHT 2022 reconstruction. The bottom row of
Figure 10 shows the residual noise of the prior (left), the EHT reconstruction (middle), and the ngEHT reconstruction (right). The prior residual noise highlights the quality of the initial guess for the model and can be compared with improvements from the reconstructions. The EHT residual noise traces the fine features in the jet that are not observed in the reconstruction, while the ngEHT residual noise looks more noise-like in the jet region. The latter shows the extent to which the ngEHT array can distinguish fine structure within the jet and the photon ring at a higher fidelity given the improved bandwidth, coverage, and frequency information.
Likewise,
Figure 11 shows an improvement with the ngEHT array for the case of Sgr A* snapshot imaging. The improvement is more evident than in the M 87 case by showing a ring-like feature for a single snapshot using the ngEHT. This improvement is an encouraging step toward tracking rapid dynamical features in Sgr A* with an expanded array.
The distribution of residual noise can be compared via its cumulative function, as shown in
Figure 12 and
Figure 13. In these cumulative distributions, we begin with the largest values of the residual error (which usually correspond to the brightest regions of the image) and record the residual error as a function of the fraction of the image field-of-view (FOV). For these plots, we also include a “model residual” (blue line) when compared to a blank image (
), as well as the model residual to the original starting prior for imaging (
, orange line) to serve as useful reference curves. When the residual curve falls below the “model residual”, it shows that the reconstruction is accurately reflecting the brightness distribution of the model, and when it falls below the “prior residual”, it is making a more accurate representation than the starting guess.
Figure 12 shows that the prior residual (orange) is limited in detecting the fine structure, as expected. The EHT (green) and ngEHT (red) residuals are below the model; however, we can see an
dex improvement between both cases. The distance between the ngEHT residual noise curve and the EHT curve on the logarithmic scale is roughly the same as the distance between the EHT curve and the original model, showing a progressive improvement to the simulated reconstruction fidelity when going from EHT’s 2022 configuration to ngEHT.
Figure 13 shows that the snapshot EHT residual is dominated by noise and cannot generally reproduce the model, as is clear from the reconstruction image itself. This implies that a single instantaneous observation by the EHT lacks the coverage necessary to image our simple model reliably. The ngEHT snapshot residual can follow the model’s shape given the much-expanded coverage provided by the ngEHT.
4. Conclusions
In this white paper, we outlined a program of upgrades to the LMT, which are scheduled to come online before or on the timescale of the ngEHT. In addition to the simultaneous 230 + 345 GHz capabilities and quadrupling of the total on-sky bandwidth with respect to current observations, the series of upgrades include enhanced thermal stabilization through improved ventilation, measurements, and modeling, as well as a laser metrology system that can be used for real-time measurement and active correction of the surface. The improvements will allow the LMT to operate near its theoretical performance over a wide range of conditions, relaxing various current constraints on observing (such as night-time) and allowing the 50-meter dish to serve as a critical anchor station for ngEHT observations throughout much of the year.
Using the expected performance of an improved LMT as part of a hypothetical ngEHT configuration comprised of 10 additional stations alongside the current EHT 2022 array, we investigated the imaging performance of an ngEHT array using full-track simulated observations of M 87, as well as snapshot observations of Sgr A*, meant to reflect the ability of the array to form movies of both targets on their respective dynamical timescales. We introduced a metric to evaluate image fidelity based on the distribution of residual noise of simulated reconstructions, which can be used as one representation of the image dynamic range. Within a reasonable region of interest, the ngEHT is able to reconstruct structures of ∼ peak brightness in our full-track M 87 simulations and approximately a few peak brightness in snapshot reconstructions of Sgr A*.
For future work, we plan to include seasonal weather variation and limited daytime operation for the full-track observations of M 87* to investigate weather-related effects relevant to a multi-month observing campaign. Furthermore, we intend to test the effect on reconstruction fidelity when various other anchor stations (such as ALMA and NOEMA) are not able to participate, and we plan to characterize the performance of subsets of the array, which may be available during portions of an observing cycle.
Author Contributions
Conceptualization, S.B., L.B., G.N., F.P.S. and D.H.; methodology, S.B., L.B., G.N. and F.P.S.; writing—original draft preparation, S.B., L.B., G.N. and F.P.S.; writing—review and editing, S.B., L.B., G.N., F.P.S. and D.H. All authors have read and agreed to the published version of the manuscript.
Funding
This work was supported by the Black Hole Initiative at Harvard University, which is funded by grants from the John Templeton Foundation and the Gordon and Betty Moore Foundation to Harvard University. This work was also supported by National Science Foundation Grants AST-1935980 and AST-2034306 and the Gordon and Betty Moore Foundation (GBMF-10423). The LMT LASERS project is supported by National Science Foundation Grant AST-2117422.
Institutional Review Board Statement
Not applicable.
Informed Consent Statement
Not applicable.
Data Availability Statement
Not applicable.
Acknowledgments
We thank David Sanchez, Freek Roelofs, Michael Johnson, Andrew Chael, Richard Anantua, Paul Tiede, Dominic Pesce, Angelo Ricarte, Jose Gomez, and the EHT and ngEHT working groups for stimulating discussion on topics related to this work.
Conflicts of Interest
The authors declare no conflict of interest.
Abbreviations
The following abbreviations are used in this manuscript:
| AGN | active galactic nuclei |
| ALMA | Atacama Large Millimeter Array |
| APEX | Atacama Pathfinder Experiment |
| EHT | Event Horizon Telescope |
| EVPA | electric-vector position angle |
| FOV | field-of-view |
| GLT | Greenland Telescope |
| GRMHD | general relativity and magneto-hydrodynamical |
| ISCO | innermost stable circular orbit |
| JCMT | James Clerk Maxwell Telescope |
| JPL | Jet Propulsion Laboratory |
| KP | Kitt Peak 12 m Telescope |
| LMT | Large Millimeter Telescope |
| MAD | magnetically arrested accretion flow |
| ngEHT | next-generation Event Horizon Telescope |
| OMAyA | One Millimeter Array for Astronomy |
| PdB | NOEMA on Plateau de Bure |
| PV | IRAM 30 m Telescope |
| RIAF | radiatively inefficient accretion flow |
| SMBH | super massive black hole |
| SMA | Submillimeter Array |
| SMT | Submillimeter Telescope |
| SPT | South Pole Telescope |
| STM | science traceability matrix |
| VLBI | Very Long Baseline Interferometer |
References
- Akiyama, K. et al. [The Event Horizon Telescope Collaboration]. First M87 Event Horizon Telescope Results. I. The Shadow of the Supermassive Black Hole. Astrophys. J. Lett. 2019, 875, L1. [Google Scholar] [CrossRef]
- Akiyama, K. et al. [The Event Horizon Telescope Collaboration]. First M87 Event Horizon Telescope Results. II. Array and Instrumentation. Astrophys. J. Lett. 2019, 875, L2. [Google Scholar] [CrossRef]
- Akiyama, K. et al. [The Event Horizon Telescope Collaboration]. First M87 Event Horizon Telescope Results. III. Data Processing and Calibration. Astrophys. J. Lett. 2019, 875, L3. [Google Scholar] [CrossRef]
- Akiyama, K. et al. [The Event Horizon Telescope Collaboration]. First M87 Event Horizon Telescope Results. IV. Imaging the Central Supermassive Black Hole. Astrophys. J. Lett. 2019, 875, L4. [Google Scholar] [CrossRef]
- Akiyama, K. et al. [The Event Horizon Telescope Collaboration]. First M87 Event Horizon Telescope Results. V. Physical Origin of the Asymmetric Ring. Astrophys. J. Lett. 2019, 875, L5. [Google Scholar] [CrossRef]
- Akiyama, K. et al. [The Event Horizon Telescope Collaboration]. First M87 Event Horizon Telescope Results. VI. The Shadow and Mass of the Central Black Hole. Astrophys. J. Lett. 2019, 875, L6. [Google Scholar] [CrossRef]
- Akiyama, K. et al. [The Event Horizon Telescope Collaboration]. First M87 Event Horizon Telescope Results. VII. Polarization of the Ring. Astrophys. J. Lett. 2021, 910, L12. [Google Scholar] [CrossRef]
- Akiyama, K. et al. [The Event Horizon Telescope Collaboration]. First M87 Event Horizon Telescope Results. VIII. Magnetic Field Structure near The Event Horizon. Astrophys. J. Lett. 2021, 910, L13. [Google Scholar] [CrossRef]
- Akiyama, K. et al. [The Event Horizon Telescope Collaboration]. First Sagittarius A* Event Horizon Telescope Results. I. The Shadow of the Supermassive Black Hole in the Center of the Milky Way. Astrophys. J. Lett. 2022, 930, L12. [Google Scholar] [CrossRef]
- Akiyama, K. et al. [The Event Horizon Telescope Collaboration]. First Sagittarius A* Event Horizon Telescope Results. II. EHT and Multiwavelength Observations, Data Processing, and Calibration. Astrophys. J. Lett. 2022, 930, L13. [Google Scholar] [CrossRef]
- Akiyama, K. et al. [The Event Horizon Telescope Collaboration]. First Sagittarius A* Event Horizon Telescope Results. III. Imaging of the Galactic Center Supermassive Black Hole. Astrophys. J. Lett. 2022, 930, L14. [Google Scholar] [CrossRef]
- Akiyama, K. et al. [The Event Horizon Telescope Collaboration]. First Sagittarius A* Event Horizon Telescope Results. IV. Variability, Morphology, and Black Hole Mass. Astrophys. J. Lett. 2022, 930, L15. [Google Scholar] [CrossRef]
- Akiyama, K. et al. [The Event Horizon Telescope Collaboration]. First Sagittarius A* Event Horizon Telescope Results. V. Testing Astrophysical Models of the Galactic Center Black Hole. Astrophys. J. Lett. 2022, 930, L16. [Google Scholar] [CrossRef]
- Akiyama, K. et al. [The Event Horizon Telescope Collaboration]. First Sagittarius A* Event Horizon Telescope Results. VI. Testing the Black Hole Metric. Astrophys. J. Lett. 2022, 930, L17. [Google Scholar] [CrossRef]
- Gebhardt, K.; Adams, J.; Richstone, D.; Lauer, T.R.; Faber, S.M.; Gültekin, K.; Murphy, J.; Tremaine, S. The Black Hole Mass in M87 from Gemini/NIFS Adaptive Optics Observations. Astrophys. J. 2011, 729, 119. [Google Scholar] [CrossRef]
- GRAVITY Collaboration. A Geometric Distance Measurement to the Galactic Center Black Hole with 0.3% Uncertainty. Astron. Astrophys. 2019, 625, L10. [Google Scholar] [CrossRef] [Green Version]
- Kim, J.Y.; Lu, R.S.; Krichbaum, T.; Bremer, M.; Zensus, J.; Walker, R. Resolving the Base of the Relativistic Jet in M87 at 6Rsch Resolution with Global mm-VLBI. Galaxies 2016, 4, 39. [Google Scholar] [CrossRef] [Green Version]
- Wielgus, M.; Marchili, N.; Martí-Vidal, I.; Keating, G.K.; Ramakrishnan, V.; Tiede, P.; Fomalont, E.; Issaoun, S.; Neilsen, J.; Nowak, M.A.; et al. Millimeter Light Curves of Sagittarius A* Observed during the 2017 Event Horizon Telescope Campaign. Astrophys. J. Lett. 2022, 930, L19. [Google Scholar] [CrossRef]
- Janssen, M.; Falcke, H.; Kadler, M.; Ros, E.; Wielgus, M.; Akiyama, K.; Baloković, M.; Blackburn, L.; Bouman, K.L.; Chael, A.; et al. Event Horizon Telescope Observations of the Jet Launching and Collimation in Centaurus A. Nat. Astron. 2021, 5, 1017–1028. [Google Scholar] [CrossRef]
- Kim, J.Y.; Krichbaum, T.P.; Broderick, A.E.; Wielgus, M.; Blackburn, L.; Gómez, J.L.; Johnson, M.D.; Bouman, K.L.; Chael, A.; Akiyama, K.; et al. Event Horizon Telescope Imaging of the Archetypal Blazar 3C 279 at an Extreme 20 Microarcsecond Resolution. Astron. Astrophys. 2020, 640, A69. [Google Scholar] [CrossRef]
- Issaoun, S.; Wielgus, M.; Jorstad, S.; Krichbaum, T.P.; Blackburn, L.; Janssen, M.; Chan, C.k.; Pesce, D.W.; Gómez, J.L.; Akiyama, K.; et al. Resolving the Inner Parsec of the Blazar J1924-2914 with the Event Horizon Telescope. Astrophys. J. 2022, 934, 145. [Google Scholar] [CrossRef]
- Doeleman, S.; Blackburn, L.; Dexter, J.; Gomez, J.L.; Johnson, M.D.; Palumbo, D.C.; Weintroub, J.; Farah, J.R.; Fish, V.; Loinard, L.; et al. Studying Black Holes on Horizon Scales with VLBI Ground Arrays. Bull. Am. Astron. Soc. 2019, 51, 256. [Google Scholar] [CrossRef]
- Raymond, A.W.; Palumbo, D.; Paine, S.N.; Blackburn, L.; Rosado, R.C.; Doeleman, S.S.; Farah, J.R.; Johnson, M.D.; Roelofs, F.; Tilanus, R.P.J.; et al. Evaluation of New Submillimeter VLBI Sites for the Event Horizon Telescope. Astrophys. J. Suppl. Ser. 2021, 253, 5. [Google Scholar] [CrossRef]
- Hughes, D.H.; Schloerb, F.P.; Aretxaga, I.; Castillo-Domínguez, E.; Chávez Dagostino, M.; Colín, E.; Erickson, N.; Ferrusca Rodriguez, D.; Gale, D.M.; Gómez-Ruiz, A.; et al. The Large Millimeter Telescope (LMT) Alfonso Serrano: Current Status and Telescope Performance. In Proc. SPIE 11445, Ground-based and Airborne Telescopes VIII; 2020; online. [Google Scholar] [CrossRef]
- Ortiz-León, G.N.; Johnson, M.D.; Doeleman, S.S.; Blackburn, L.; Fish, V.L.; Loinard, L.; Reid, M.J.; Castillo, E.; Chael, A.A.; Hernández-Gómez, A.; et al. The Intrinsic Shape of Sagittarius A* at 3.5 mm Wavelength. Astrophys. J. 2016, 824, 40. [Google Scholar] [CrossRef] [Green Version]
- Roelofs, F.; Blackburn, L.; Lindahl, G.; Doeleman, S.S.; Johnson, M.D.; Arras, P.; Chatterjee, K.; Emami, R.; Fromm, C.; Fuentes, A.; et al. The ngEHT Analysis Challenges. Galaxies 2023. submitted. [Google Scholar]
- Chael, A.A.; Johnson, M.D.; Narayan, R.; Doeleman, S.S.; Wardle, J.F.C.; Bouman, K.L. High-resolution Linear Polarimetric Imaging for the Event Horizon Telescope. Astrophys. J. 2016, 829, 11. [Google Scholar] [CrossRef]
- Chael, A.; Rowan, M.; Narayan, R.; Johnson, M.; Sironi, L. The Role of Electron Heating Physics in Images and Variability of the Galactic Centre Black Hole Sagittarius A*. Mon. Not. R. Astron. Soc. 2018, 478, 5209–5229. [Google Scholar] [CrossRef]
- Chael, A.; Narayan, R.; Johnson, M.D. Two-temperature, Magnetically Arrested Disc simulations of the jet from the supermassive black hole in M87. Mon. Not. R. Astron. Soc. 2019, 486, 2873–2895. Available online: http://xxx.lanl.gov/abs/1810.01983 (accessed on 14 December 2022). [CrossRef]
- Walker, R.C.; Hardee, P.E.; Davies, F.B.; Ly, C.; Junor, W. The Structure and Dynamics of the Subparsec Jet in M87 Based on 50 VLBA Observations over 17 Years at 43 GHz. ApJ 2018, 855, 128. [Google Scholar] [CrossRef] [Green Version]
- Chael, A.A.; Johnson, M.D.; Bouman, K.L.; Blackburn, L.L.; Akiyama, K.; Narayan, R. Interferometric Imaging Directly with Closure Phases and Closure Amplitudes. Astrophys. J. 2018, 857, 23. [Google Scholar] [CrossRef]
- Chael, A.; Issaoun, S.; Pesce, D.w.; Johnson, M.D.; Ricarte, A.; Fromm, C.M.; Mizuno, Y. Multi-frequency Black Hole Imaging for the Next-Generation Event Horizon Telescope. Astrophys. J. 2022. submitted. [Google Scholar] [CrossRef]
| Disclaimer/Publisher’s Note: The statements, opinions and data contained in all publications are solely those of the individual author(s) and contributor(s) and not of MDPI and/or the editor(s). MDPI and/or the editor(s) disclaim responsibility for any injury to people or property resulting from any ideas, methods, instructions or products referred to in the content. |
© 2022 by the authors. Licensee MDPI, Basel, Switzerland. This article is an open access article distributed under the terms and conditions of the Creative Commons Attribution (CC BY) license (https://creativecommons.org/licenses/by/4.0/).


 ,
, 


