

Lowering Barriers to Health Risk Assessments in Promoting Personalized Health Management
 , , , and
Abstract
:1. Introduction
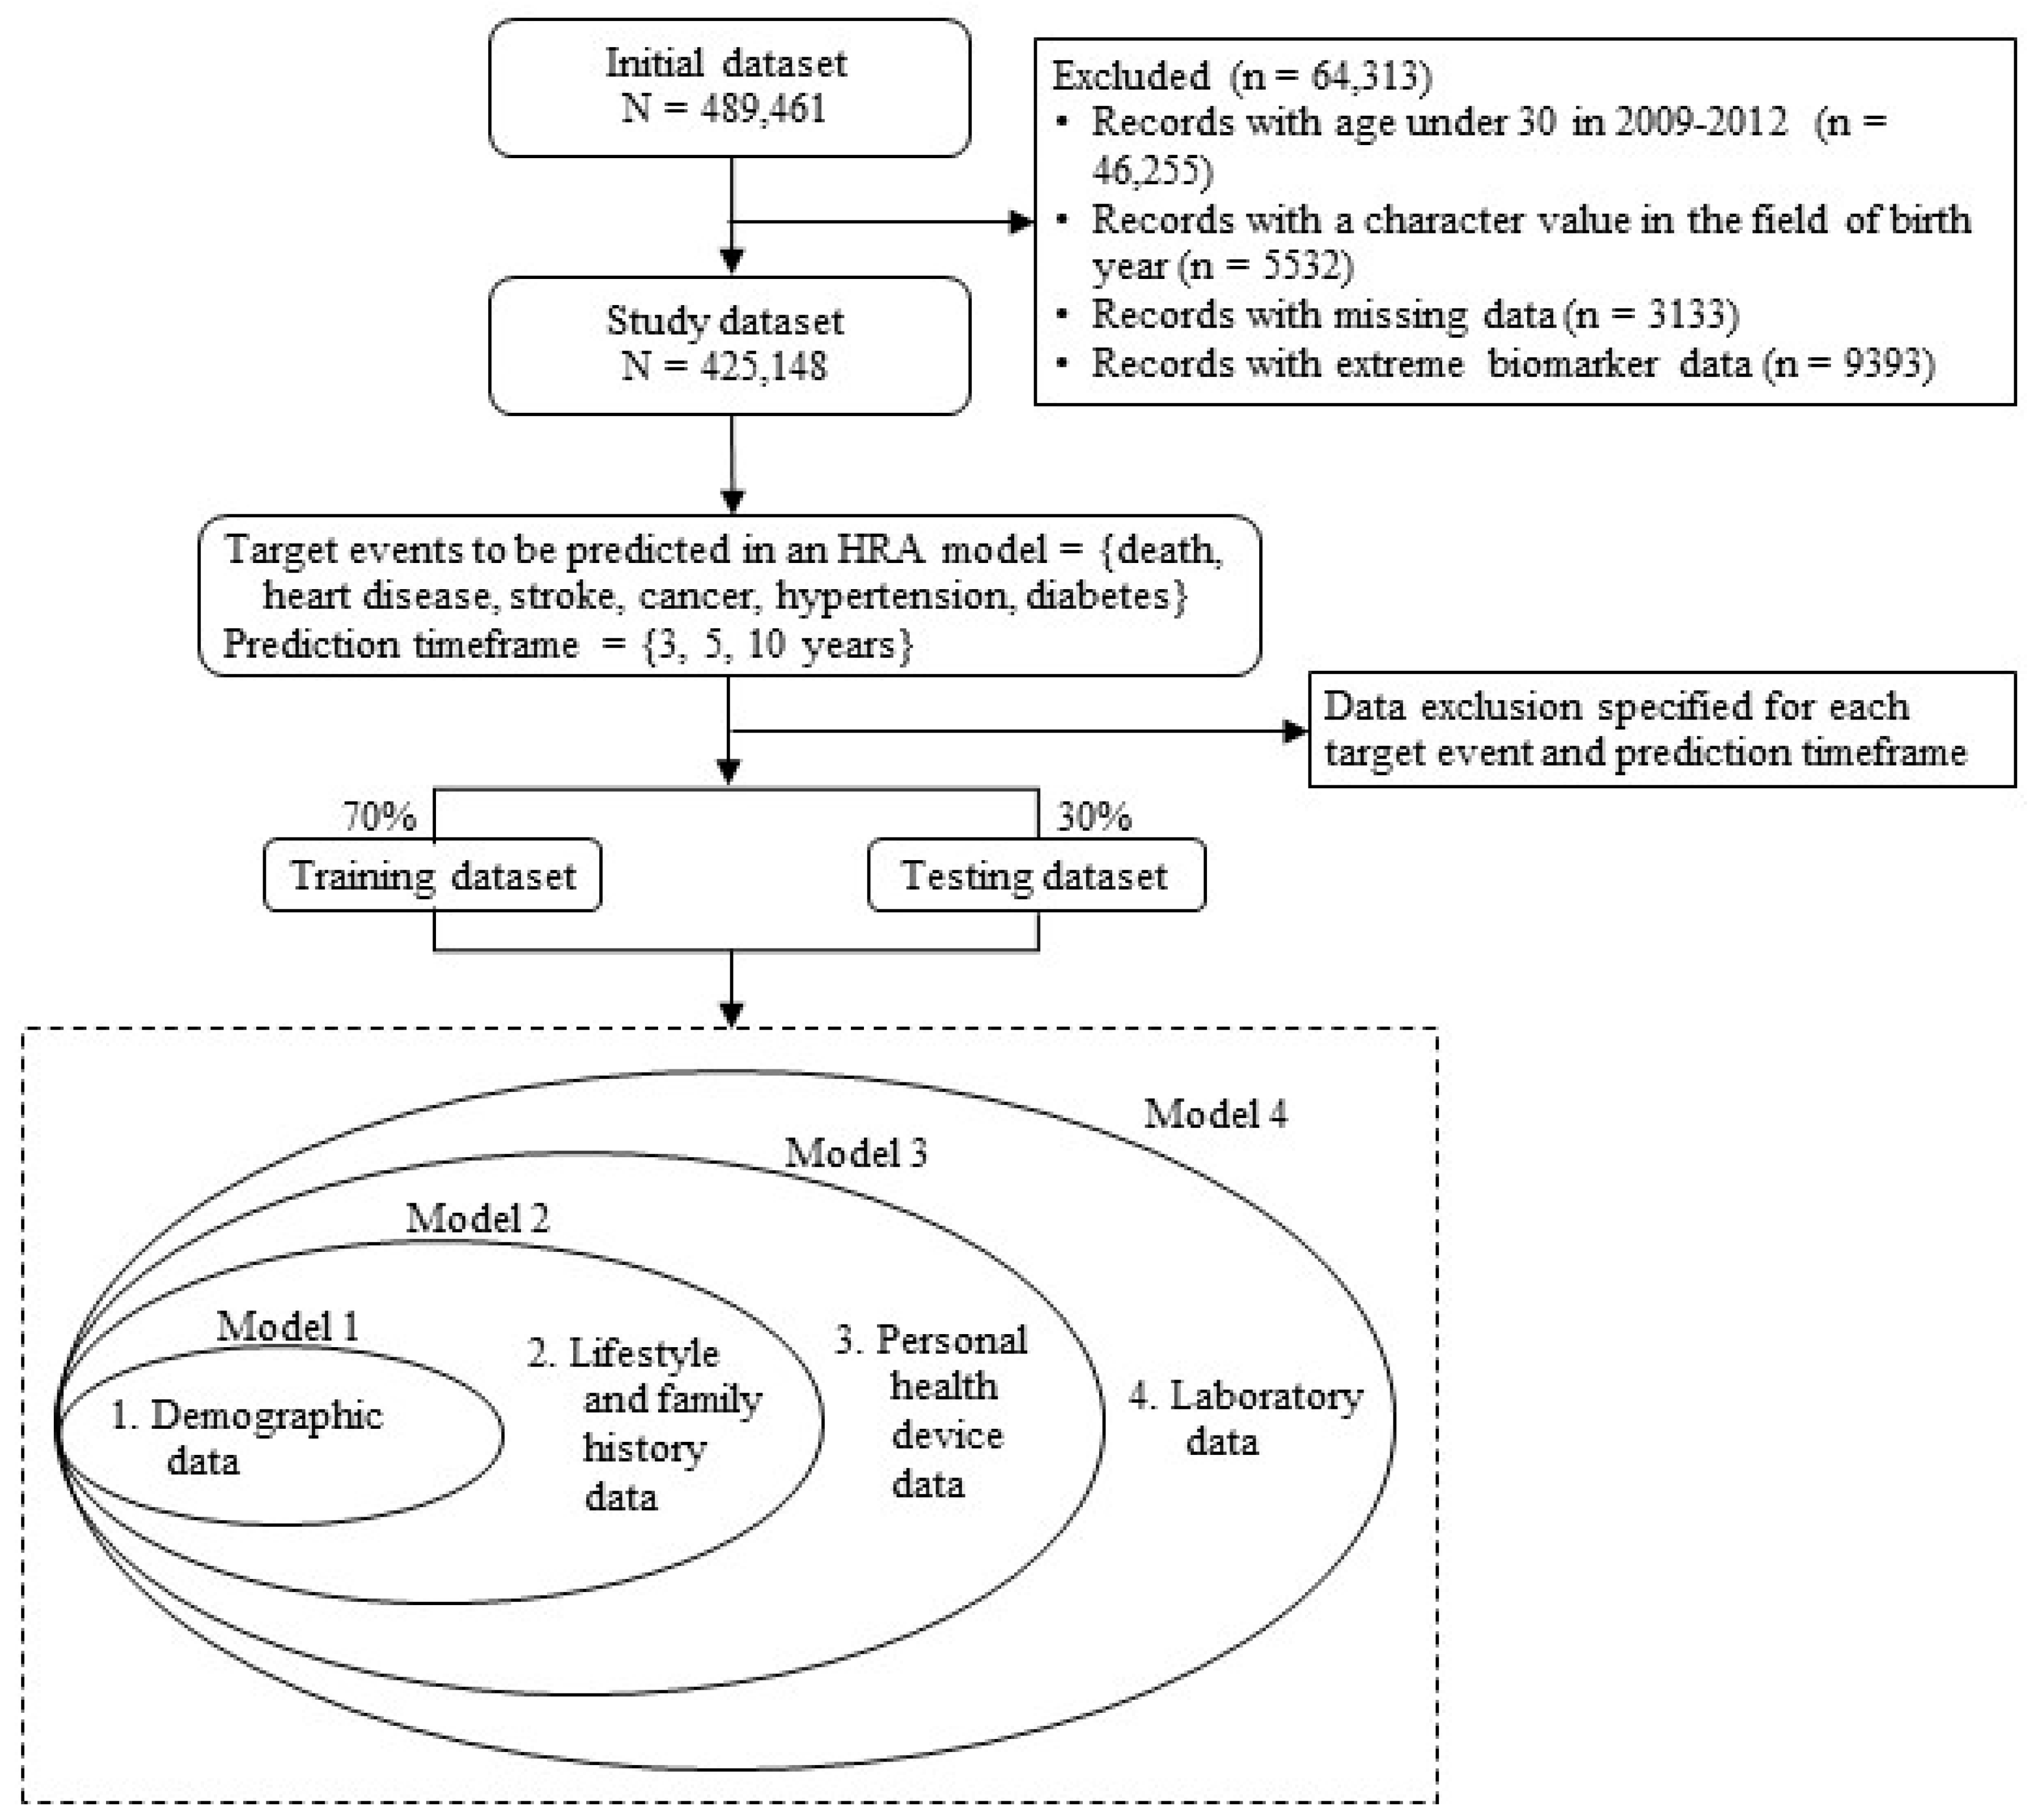
2. Materials and Methods
2.1. Data
2.2. Variables
2.3. Analytical Models
3. Results
3.1. Incremental Predictive Performance Achieved by the Inclusion of Groups of Predictor Variables
3.2. Feature Importance
4. Discussion
5. Conclusions
Author Contributions
Funding
Institutional Review Board Statement
Informed Consent Statement
Data Availability Statement
Conflicts of Interest
Appendix A

| Adverse Health Event | Gender | Pre. Time | n | AUC | Accuracy | F1-Score | |||||||||
|---|---|---|---|---|---|---|---|---|---|---|---|---|---|---|---|
| Model 1 | Model 2 | Model 3 | Model 4 | Model 1 | Model 2 | Model 3 | Model 4 | Model 1 | Model 2 | Model 3 | Model 4 | ||||
| Mortality | Male | 3 | 62,860 | 0.867 | 0.877 *** | 0.880 | 0.894 *** | 0.799 | 0.775 | 0.763 | 0.814 | 0.095 | 0.090 | 0.088 | 0.107 |
| 5 | 62,860 | 0.872 | 0.882 *** | 0.885 | 0.897 *** | 0.803 | 0.820 | 0.824 | 0.827 | 0.166 | 0.179 | 0.183 | 0.191 | ||
| 10 | 29,006 | 0.871 | 0.877 | 0.881 * | 0.889 *** | 0.762 | 0.805 | 0.787 | 0.830 | 0.271 | 0.303 | 0.290 | 0.331 | ||
| Female | 3 | 62,277 | 0.858 | 0.865 *** | 0.867 | 0.878 * | 0.815 | 0.813 | 0.783 | 0.815 | 0.062 | 0.062 | 0.056 | 0.064 | |
| 5 | 62,277 | 0.863 | 0.868 ** | 0.869 | 0.879 *** | 0.809 | 0.815 | 0.827 | 0.791 | 0.111 | 0.114 | 0.119 | 0.108 | ||
| 10 | 24,400 | 0.867 | 0.870 *** | 0.872 * | 0.875 * | 0.813 | 0.804 | 0.805 | 0.805 | 0.247 | 0.242 | 0.242 | 0.244 | ||
| Heart disease | Male | 3 | 56,906 | 0.700 | 0.707 *** | 0.710 | 0.711 ** | 0.554 | 0.563 | 0.589 | 0.606 | 0.097 | 0.099 | 0.102 | 0.104 |
| 5 | 56,265 | 0.696 | 0.708 *** | 0.710 | 0.711 | 0.618 | 0.611 | 0.606 | 0.604 | 0.154 | 0.156 | 0.157 | 0.157 | ||
| 10 | 25,101 | 0.687 | 0.698 *** | 0.701 ** | 0.703 | 0.590 | 0.614 | 0.605 | 0.634 | 0.253 | 0.260 | 0.261 | 0.265 | ||
| Female | 3 | 55,703 | 0.719 | 0.728 *** | 0.731 | 0.733 * | 0.571 | 0.558 | 0.623 | 0.619 | 0.099 | 0.100 | 0.106 | 0.106 | |
| 5 | 55,345 | 0.714 | 0.723 *** | 0.726 | 0.727 * | 0.583 | 0.569 | 0.605 | 0.584 | 0.151 | 0.152 | 0.157 | 0.155 | ||
| 10 | 21,029 | 0.696 | 0.703 * | 0.705 *** | 0.706 | 0.544 | 0.576 | 0.606 | 0.586 | 0.253 | 0.259 | 0.264 | 0.261 | ||
| Stroke | Male | 3 | 59,362 | 0.772 | 0.774 | 0.775 ** | 0.776 | 0.736 | 0.685 | 0.648 | 0.647 | 0.122 | 0.113 | 0.107 | 0.107 |
| 5 | 58,733 | 0.769 | 0.772 *** | 0.773 | 0.774 * | 0.667 | 0.679 | 0.689 | 0.678 | 0.165 | 0.169 | 0.171 | 0.169 | ||
| 10 | 26,204 | 0.749 | 0.753 *** | 0.754 | 0.755 | 0.692 | 0.668 | 0.679 | 0.676 | 0.283 | 0.278 | 0.282 | 0.281 | ||
| Female | 3 | 57,408 | 0.752 | 0.756 *** | 0.758 *** | 0.759 | 0.691 | 0.663 | 0.649 | 0.644 | 0.133 | 0.128 | 0.126 | 0.126 | |
| 5 | 58,733 | 0.752 | 0.755 *** | 0.757 | 0.757 *** | 0.701 | 0.671 | 0.675 | 0.647 | 0.199 | 0.192 | 0.194 | 0.188 | ||
| 10 | 21,704 | 0.727 | 0.729 * | 0.730 ** | 0.730 | 0.646 | 0.641 | 0.616 | 0.612 | 0.326 | 0.325 | 0.321 | 0.320 | ||
| Cancer | Male | 3 | 61,515 | 0.753 | 0.761 *** | 0.760 | 0.766 | 0.680 | 0.679 | 0.669 | 0.681 | 0.048 | 0.048 | 0.047 | 0.048 |
| 5 | 60,773 | 0.748 | 0.753 | 0.753 | 0.766 ** | 0.688 | 0.660 | 0.658 | 0.658 | 0.072 | 0.070 | 0.069 | 0.070 | ||
| 10 | 26,877 | 0.729 | 0.735 ** | 0.735 * | 0.740 | 0.661 | 0.643 | 0.658 | 0.625 | 0.117 | 0.115 | 0.117 | 0.113 | ||
| Female | 3 | 61,363 | 0.682 | 0.680 * | 0.681 | 0.684 | 0.574 | 0.614 | 0.576 | 0.582 | 0.020 | 0.021 | 0.020 | 0.020 | |
| 5 | 60,897 | 0.679 | 0.679 | 0.679 | 0.683 ** | 0.588 | 0.589 | 0.587 | 0.566 | 0.032 | 0.032 | 0.032 | 0.032 | ||
| 10 | 23,027 | 0.653 | 0.651 ** | 0.651 | 0.652 ** | 0.583 | 0.534 | 0.554 | 0.482 | 0.063 | 0.061 | 0.062 | 0.059 | ||
| Hypertension | Male | 3 | 40,557 | 0.623 | 0.661 *** | 0.721 *** | 0.723 | 0.562 | 0.561 | 0.650 | 0.636 | 0.264 | 0.281 | 0.326 | 0.325 |
| 5 | 40,279 | 0.635 | 0.676 *** | 0.729 *** | 0.732 *** | 0.630 | 0.599 | 0.648 | 0.639 | 0.316 | 0.340 | 0.382 | 0.382 | ||
| 10 | 22,869 | 0.624 | 0.675 *** | 0.726 *** | 0.729 | 0.620 | 0.616 | 0.650 | 0.656 | 0.442 | 0.489 | 0.531 | 0.533 | ||
| Female | 3 | 40,905 | 0.711 | 0.739 *** | 0.790 *** | 0.789 | 0.630 | 0.627 | 0.706 | 0.678 | 0.234 | 0.245 | 0.294 | 0.282 | |
| 5 | 40,781 | 0.711 | 0.741 *** | 0.788 *** | 0.789 | 0.640 | 0.657 | 0.697 | 0.707 | 0.298 | 0.318 | 0.361 | 0.365 | ||
| 10 | 15,368 | 0.697 | 0.728 *** | 0.775 *** | 0.777 *** | 0.640 | 0.653 | 0.698 | 0.688 | 0.459 | 0.486 | 0.530 | 0.530 | ||
| Diabetes | Male | 3 | 51,056 | 0.656 | 0.686 *** | 0.733 *** | 0.738 | 0.602 | 0.625 | 0.663 | 0.651 | 0.168 | 0.180 | 0.203 | 0.202 |
| 5 | 50,585 | 0.666 | 0.698 *** | 0.736 *** | 0.742 ** | 0.586 | 0.627 | 0.668 | 0.653 | 0.231 | 0.249 | 0.275 | 0.274 | ||
| 10 | 22,869 | 0.648 | 0.689 *** | 0.720 *** | 0.730 | 0.597 | 0.606 | 0.633 | 0.679 | 0.364 | 0.391 | 0.411 | 0.423 | ||
| Female | 3 | 50,809 | 0.691 | 0.710 *** | 0.740 *** | 0.744 | 0.618 | 0.609 | 0.680 | 0.678 | 0.170 | 0.174 | 0.197 | 0.198 | |
| 5 | 50,533 | 0.691 | 0.713 *** | 0.739 *** | 0.743 | 0.629 | 0.594 | 0.642 | 0.640 | 0.248 | 0.251 | 0.271 | 0.271 | ||
| 10 | 19,268 | 0.674 | 0.700 *** | 0.725 *** | 0.732 *** | 0.578 | 0.612 | 0.665 | 0.673 | 0.398 | 0.416 | 0.436 | 0.442 | ||
| Adverse Health Event | Gender | Pre. Time | n | AUC | ||||||
|---|---|---|---|---|---|---|---|---|---|---|
| Model 1 | Model 2 | Model 3 | Model 4 | |||||||
| Mortality | Male | 3 | 63,084 | 0.873 | 0.880 | *** | 0.882 | 0.896 | *** | |
| 5 | 63,084 | 0.876 | 0.880 | *** | 0.882 | ** | 0.892 | *** | ||
| 10 | 29,091 | 0.875 | 0.880 | *** | 0.882 | * | 0.889 | *** | ||
| Female | 3 | 62,053 | 0.867 | 0.869 | 0.870 | 0.881 | ** | |||
| 5 | 62,053 | 0.867 | 0.868 | 0.869 | * | 0.875 | ** | |||
| 10 | 24,315 | 0.866 | 0.867 | 0.868 | * | 0.870 | ||||
| Heart disease | Male | 3 | 56,825 | 0.704 | 0.714 | *** | 0.716 | 0.715 | ||
| 5 | 56,189 | 0.702 | 0.712 | *** | 0.715 | ** | 0.714 | |||
| 10 | 25,099 | 0.691 | 0.698 | ** | 0.701 | ** | 0.700 | |||
| Female | 3 | 55,784 | 0.721 | 0.726 | * | 0.728 | * | 0.728 | ||
| 5 | 55,423 | 0.714 | 0.721 | *** | 0.725 | *** | 0.724 | |||
| 10 | 21,032 | 0.705 | 0.709 | * | 0.711 | * | 0.709 | |||
| Stroke | Male | 3 | 59,209 | 0.772 | 0.776 | *** | 0.778 | ** | 0.776 | |
| 5 | 58,727 | 0.768 | 0.771 | *** | 0.773 | ** | 0.773 | |||
| 10 | 26,284 | 0.747 | 0.752 | *** | 0.753 | ** | 0.753 | |||
| Female | 3 | 57,561 | 0.752 | 0.755 | ** | 0.756 | * | 0.754 | * | |
| 5 | 57,050 | 0.759 | 0.760 | * | 0.761 | 0.761 | ||||
| 10 | 21,625 | 0.730 | 0.732 | * | 0.733 | 0.733 | ||||
| Cancer | Male | 3 | 61,500 | 0.757 | 0.757 | 0.757 | 0.760 | |||
| 5 | 60,801 | 0.753 | 0.758 | ** | 0.758 | 0.763 | ** | |||
| 10 | 26,760 | 0.728 | 0.730 | 0.730 | 0.734 | * | ||||
| Female | 3 | 61,378 | 0.696 | 0.695 | 0.697 | 0.698 | ||||
| 5 | 60,869 | 0.678 | 0.679 | 0.679 | 0.683 | |||||
| 10 | 23,145 | 0.663 | 0.661 | 0.661 | 0.662 | |||||
| Hypertension | Male | 3 | 40,419 | 0.613 | 0.651 | *** | 0.709 | *** | 0.658 | *** |
| 5 | 40,125 | 0.626 | 0.667 | *** | 0.718 | *** | 0.672 | *** | ||
| 10 | 18,404 | 0.627 | 0.673 | *** | 0.719 | *** | 0.680 | *** | ||
| Female | 3 | 41,043 | 0.717 | 0.743 | *** | 0.785 | *** | 0.745 | *** | |
| 5 | 40,936 | 0.714 | 0.740 | *** | 0.782 | *** | 0.743 | *** | ||
| 10 | 15,353 | 0.700 | 0.732 | *** | 0.776 | *** | 0.734 | *** | ||
| Diabetes | Male | 3 | 51,048 | 0.653 | 0.682 | *** | 0.721 | *** | 0.693 | *** |
| 5 | 50,726 | 0.668 | 0.697 | *** | 0.730 | *** | 0.707 | *** | ||
| 10 | 22,795 | 0.649 | 0.688 | *** | 0.716 | *** | 0.700 | *** | ||
| Female | 3 | 50,818 | 0.690 | 0.707 | *** | 0.736 | *** | 0.716 | *** | |
| 5 | 50,392 | 0.693 | 0.711 | *** | 0.734 | *** | 0.722 | *** | ||
| 10 | 19,342 | 0.673 | 0.698 | *** | 0.718 | *** | 0.707 | |||
References
- Alonso, S.G.; de la Torre Díez, I.; Zapiraín, B.G. Predictive, Personalized, Preventive and Participatory (4P) Medicine Applied to Telemedicine and eHealth in the Literature. J. Med. Syst. 2019, 43, 140. [Google Scholar] [CrossRef] [PubMed]
- Flores, M.; Glusman, G.; Brogaard, K.; Price, N.D.; Hood, L. P4 medicine: How systems medicine will transform the healthcare sector and society. Pers. Med. 2013, 10, 565–576. [Google Scholar] [CrossRef] [PubMed]
- Sobradillo, P.; Pozo, F.; Agustí, A. P4 medicine: The future around the corner. Arch. Bronconeumol. 2011, 47, 35–40. [Google Scholar] [CrossRef] [PubMed]
- Sadusk, J.F., Jr.; Robbins, L.C. Proposal for health-hazard appraisal in comprehensive health care. JAMA 1968, 203, 1108–1112. [Google Scholar] [CrossRef]
- Charlson, M.E.; Pompei, P.; Ales, K.L.; MacKenzie, C.R. A new method of classifying prognostic comorbidity in longitudinal studies: Development and validation. J. Chronic Dis. 1987, 40, 373–383. [Google Scholar] [CrossRef]
- Lindström, J.; Tuomilehto, J. The diabetes risk score: A practical tool to predict type 2 diabetes risk. Diabetes Care 2003, 26, 725–731. [Google Scholar] [CrossRef] [PubMed]
- Conroy, R.M.; Pyörälä, K.; Fitzgerald, A.P.; Sans, S.; Menotti, A.; De Backer, G.; De Bacquer, D.; Ducimetière, P.; Jousilahti, P.; Keil, U.; et al. Estimation of ten-year risk of fatal cardiovascular disease in Europe: The SCORE project. Eur. Heart J. 2003, 24, 987–1003. [Google Scholar] [CrossRef]
- D’Agostino, R.B., Sr.; Vasan, R.S.; Pencina, M.J.; Wolf, P.A.; Cobain, M.; Massaro, J.M.; Kannel, W.B. General cardiovascular risk profile for use in primary care: The Framingham Heart Study. Circulation 2008, 117, 743–753. [Google Scholar] [CrossRef]
- Perk, J.; De Backer, G.; Gohlke, H.; Graham, I.; Reiner, Z.; Verschuren, M.; Verschuren, M.; Albus, C.; Benlian, P.; Boysen, G.; et al. European Guidelines on cardiovascular disease prevention in clinical practice (version 2012). The Fifth Joint Task Force of the European Society of Cardiology and Other Societies on Cardiovascular Disease Prevention in Clinical Practice (constituted by representatives of nine societies and by invited experts). Eur. Heart J. 2012, 33, 1635–1701. [Google Scholar] [CrossRef] [PubMed]
- Schoenbach, V.J. Appraising health risk appraisal. Am. J. Public Health 1987, 77, 409–411. [Google Scholar] [CrossRef]
- Goetzel, R.Z.; Staley, P.; Ogden, L.; Stange, P.V.; Fox, J.; Spangler, J.; Tabrizi, M.; Beckowski, M.; Kowlessar, N.; Glasgow, R.E.; et al. A Framework for Patient-Centered Health Risk Assessments—Providing Health Promotion and Disease Prevention Services to Medicare Beneficiaries. US Department of Health and Human Services, Centers for Disease Control and Prevention: Atlanta, GA, USA, 2011. Available online: http://www.cdc.gov/policy/paeo/hra/frameworkforhra.pdf (accessed on 13 March 2024).
- Elstad, M.; Ahmed, S.; Røislien, J.; Douiri, A. Evaluation of the reported data linkage process and associated quality issues for linked routinely collected healthcare data in multimorbidity research: A systematic methodology review. BMJ Open 2023, 13, e069212. [Google Scholar] [CrossRef] [PubMed]
- Fletcher, D.J.; Smith, G.L. Health-risk appraisal. Helping patients predict and prevent health problems. Postgrad. Med. 1986, 80, 69–83. [Google Scholar] [CrossRef] [PubMed]
- Misra, A.; Lloyd, J.T. Hospital utilization and expenditures among a nationally representative sample of Medicare fee-for-service beneficiaries 2 years after receipt of an Annual Wellness Visit. Prev. Med. 2019, 129, 105850. [Google Scholar] [CrossRef] [PubMed]
- Shin, D.W.; Cho, B.; Guallar, E. Korean National Health Insurance Database. JAMA Intern. Med. 2016, 176, 138. [Google Scholar] [CrossRef] [PubMed]
- Lee, J.; Lee, J.S.; Park, S.H.; Shin, S.A.; Kim, K. Cohort Profile: The National Health Insurance Service-National Sample Cohort (NHIS-NSC). South Korea Int. J. Epidemiol. 2017, 46, e15. [Google Scholar] [CrossRef] [PubMed]
- Kwon, H.-S.; Oh, P.-J.; Kang, M.-Y.; Woo, K.-S. A study on insurance premium rate differentiation by simplified issue insurance product type using the health level scoring model based on national health insurance data. J. Risk Manag. 2021, 32, 99–147. [Google Scholar] [CrossRef]
- Galani, C.; Schneider, H. Prevention and treatment of obesity with lifestyle interventions: Review and meta-analysis. Int. J. Public Health 2007, 52, 348–359. [Google Scholar] [CrossRef]
- Kyrou, I.; Tsigos, C.; Mavrogianni, C.; Cardon, G.; Van Stappen, V.; Latomme, J.; Tsochev, K.; Nanasi, A.; Semanova, C.; Lamiquiz-Moneo, I.; et al. Sociodemographic and lifestyle-related risk factors for identifying vulnerable groups for type 2 diabetes: A narrative review with emphasis on data from Europe. BMC Endocr. Disord. 2020, 20 (Suppl. S1), 134. [Google Scholar] [CrossRef]
- GBD 2017 Risk Factor Collaborators. Global, regional, and national comparative risk assessment of 84 behavioural, environmental and occupational, and metabolic risks or clusters of risks for 195 countries and territories, 1990–2017: A systematic analysis for the Global Burden of Disease Study 2017. Lancet 2018, 392, 1923–1994. [Google Scholar] [CrossRef]
- Grembowski, D.; Patrick, D.; Diehr, P.; Durham, M.; Beresford, S.; Kay, E.; Hecht, J. Self-efficacy and health behavior among older adults. J. Health Soc. Behav. 1993, 34, 89–104. [Google Scholar] [CrossRef] [PubMed]
- Wood, D.M.; Mould, M.G.; Ong, S.B.; Baker, E.H. “Pack year” smoking histories: What about patients who use loose tobacco? Tob. Control. 2005, 14, 141–142. [Google Scholar] [CrossRef]
- Kim, Y.G.; Han, K.D.; Choi, J.I.; Boo, K.Y.; Kim, D.Y.; Lee, K.N.; Shim, J.; Kim, J.S.; Kim, Y.H. Frequent drinking is a more important risk factor for new-onset atrial fibrillation than binge drinking: A nationwide population-based study. EP Europace 2020, 22, 216–224. [Google Scholar] [CrossRef]
- Chung, A.E.; Skinner, A.C.; Steiner, M.J.; Perrin, E.M. Physical activity and BMI in a nationally representative sample of children and adolescents. Clin. Pediatr. 2012, 51, 122–129. [Google Scholar] [CrossRef]
- Yach, D.; Hawkes, C.; Gould, C.L.; Hofman, K.J. The global burden of chronic diseases: Overcoming impediments to prevention and control. JAMA 2004, 291, 2616–2622. [Google Scholar] [CrossRef]
- GBD 2019 Diseases and Injuries Collaborators. Global burden of 369 diseases and injuries in 204 countries and territories, 1990–2019: A systematic analysis for the Global Burden of Disease Study 2019. Lancet 2020, 396, 1204–1222. [Google Scholar] [CrossRef]
- Sagner, M.; McNeil, A.; Puska, P.; Auffray, C.; Price, N.D.; Hood, L.; Lavie, C.J.; Han, Z.-G.; Chen, Z.; Brahmachari, S.K.; et al. The P4 health spectrum—A predictive, preventive, personalized and participatory continuum for promoting healthspan. Prog. Cardiovasc. Dis. 2017, 59, 506–521. [Google Scholar] [CrossRef] [PubMed]
- Lee, S.; Lee, H.; Kim, H.S.; Koh, S.B. Incidence, Risk factors, and prediction of myocardial infarction and stroke in farmers: A Korean nationwide population-based study. J. Prev. Med. Public Health 2020, 53, 313–322. [Google Scholar] [CrossRef] [PubMed]
- Kim, K.I.; Ji, E.; Choi, J.Y.; Kim, S.W.; Ahn, S.; Kim, C.H. Ten-year trends of hypertension treatment and control rate in Korea. Sci. Rep. 2021, 11, 6966. [Google Scholar] [CrossRef]
- Yeo, Y.; Shin, D.W.; Han, K.; Park, S.H.; Jeon, K.-H.; Lee, J.; Kim, J.; Shin, A. Individual 5-year lung cancer risk prediction model in Korea using a nationwide representative database. Cancers 2021, 13, 3496. [Google Scholar] [CrossRef] [PubMed]
- Lee, J.; Choi, E.; Choo, E.; Linda, S.; Jang, E.J.; Lee, I.H. Relationship between continuity of care and clinical outcomes in patients with dyslipidemia in Korea: A real world claims database study. Sci. Rep. 2022, 12, 3062. [Google Scholar] [CrossRef]
- Jung, K.W.; Won, Y.J.; Kong, H.J.; Lee, E.S. Prediction of cancer incidence and mortality in Korea, 2019. Cancer Res. Treat. 2019, 51, 431–437. [Google Scholar] [CrossRef]
- Yi, K.H. The revised 2016 Korean Thyroid Association guidelines for thyroid nodules and cancers: Differences from the 2015 American Thyroid Association guidelines. Endocrinol. Metab. 2016, 31, 373–378. [Google Scholar] [CrossRef]
- Grannemann, T.W.; Brown, R.S.; Pauly, M.V. Estimating hospital costs. A multiple-output analysis. J. Health Econ. 1986, 5, 107–127. [Google Scholar] [CrossRef] [PubMed]
- Youden, W.J. Index for rating diagnostic tests. Cancer 1950, 3, 32–35. [Google Scholar] [CrossRef] [PubMed]
- Robin, X.; Turck, N.; Hainard, A.; Tiberti, N.; Lisacek, F.; Sanchez, J.-C.; Müller, M. pROC: An open-source package for R and S+ to analyze and compare ROC curves. BMC Bioinform. 2011, 12, 77. [Google Scholar] [CrossRef]
- Sun, X.; Xu, W. Fast implementation of DeLong’s algorithm for comparing the areas under correlated receiver operating characteristic curves. IEEE Signal Process. Lett. 2014, 21, 1389–1393. [Google Scholar] [CrossRef]
- Chen, T.; Guestrin, C. XGBoost: A scalable tree boosting system. In Proceedings of the 22nd ACM SIGKDD International Conference on Knowledge Discovery and Data Mining, San Francisco, CA, USA, 13–17 August 2016; pp. 785–794. [Google Scholar] [CrossRef]
- Ye, C.; Fu, T.; Hao, S.; Zhang, Y.; Wang, O.; Jin, B.; Xia, M.; Liu, M.; Zhou, X.; Wu, Q.; et al. Prediction of incident hypertension within the next year: Prospective study using statewide electronic health records and machine learning. J. Med. Internet Res. 2018, 20, e22. [Google Scholar] [CrossRef]
- Taninaga, J.; Nishiyama, Y.; Fujibayashi, K.; Gunji, T.; Sasabe, N.; Iijima, K.; Naito, T. Prediction of future gastric cancer risk using a machine learning algorithm and comprehensive medical check-up data: A case-control study. Sci. Rep. 2019, 9, 12384. [Google Scholar] [CrossRef] [PubMed]
- Inoue, T.; Ichikawa, D.; Ueno, T.; Cheong, M.; Inoue, T.; Whetstone, W.D.; Endo, T.; Nizuma, K.; Tominaga, T. XGBoost, a machine learning method, predicts neurological recovery in patients with cervical spinal cord injury. Neurotrauma Rep. 2020, 1, 8–16. [Google Scholar] [CrossRef]
- Binson, V.; Subramoniam, M.; Sunny, Y.; Mathew, L. Prediction of pulmonary diseases with electronic nose using SVM and XGBoost. IEEE Sens. J. 2021, 21, 20886–20895. [Google Scholar] [CrossRef]
- Ogunleye, A.; Wang, Q.G. XGBoost model for chronic kidney disease diagnosis. IEEE/ACM Trans. Comput. Biol. Bioinform. 2020, 17, 2131–2140. [Google Scholar] [CrossRef]
- Budholiya, K.; Shrivastava, S.K.; Sharma, V. An optimized XGBoost based diagnostic system for effective prediction of heart disease. J. King Saud. Univ. Comput. Info Sci. 2020, 34, 4514–4523. [Google Scholar] [CrossRef]
- Li, Q.; Yang, H.; Wang, P.; Liu, X.; Lv, K.; Ye, M. XGBoost-based and tumor-immune characterized gene signature for the prediction of metastatic status in breast cancer. J. Transl. Med. 2022, 20, 177. [Google Scholar] [CrossRef] [PubMed]
- Putatunda, S.; Rama, K. A comparative analysis of hyperopt as against other approaches for hyper-parameter optimization of XGBoost. In Proceedings of the 2018 International Conference on Signal Processing and Machine Learning, Shanghai, China, 28–30 November 2018; pp. 6–10. [Google Scholar] [CrossRef]
- Gong, Q.; Zhang, P.; Wang, J.; Ma, J.; An, Y.; Chen, Y.; Zhang, B.; Feng, X.; Li, H.; Chen, X.; et al. Morbidity and mortality after lifestyle intervention for people with impaired glucose tolerance: 30-year results of the Da Qing Diabetes Prevention Outcome Study. Lancet Diabetes Endocrinol. 2019, 7, 452–461. [Google Scholar] [CrossRef] [PubMed]
- Valenzuela, P.L.; Carrera-Bastos, P.; Gálvez, B.G.; Ruiz-Hurtado, G.; Ordovas, J.M.; Ruilope, L.M.; Lucia, A. Lifestyle interventions for the prevention and treatment of hypertension. Nat. Rev. Cardiol. 2021, 18, 251–275. [Google Scholar] [CrossRef] [PubMed]
- Korea National Health Insurance Services. 2021 National Health Insurance Statistical Yearbook. Available online: https://www.hira.or.kr/bbsDummy.do?pgmid=HIRAA020045020000&brdScnBltNo=4&brdBltNo=2314&pageIndex=1&pageIndex2=1#none (accessed on 6 March 2023).
- Roehrs, A.; da Costa, C.A.; Righi, R.D.; de Oliveira, K.S. Personal health records: A systematic literature review. J. Med. Internet Res. 2017, 19, e13. [Google Scholar] [CrossRef] [PubMed]
- Vuong, A.M.; Huber, J.C., Jr.; Bolin, J.N.; Ory, M.G.; Moudouni, D.M.; Helduser, J.; Begaye, D.; Bonner, T.J.; Forjuoh, S.N. Factors affecting acceptability and usability of technological approaches to diabetes self-management: A case study. Diabetes Technol. Ther. 2012, 14, 1178–1182. [Google Scholar] [CrossRef]
- Sora, N.D.; Shashpal, F.; Bond, E.A.; Jenkins, A.J. Insulin pumps: Review of technological advancement in diabetes management. Am. J. Med. Sci. 2019, 358, 326–331. [Google Scholar] [CrossRef]
- Grant, A.K.; Golden, L. Technological advancements in the management of type 2 diabetes. Curr. Diabetes Rep. 2019, 19, 163. [Google Scholar] [CrossRef]
- Shin, J.Y. Trends in the prevalence and management of diabetes in Korea: 2007–2017. Epidemiol. Health 2019, 41, e2019029. [Google Scholar] [CrossRef]
- Kim, D.H.; Kim, B.; Han, K.; Kim, S.W. The relationship between metabolic syndrome and obstructive sleep apnea syndrome: A nationwide population-based study. Sci. Rep. 2021, 11, 8751. [Google Scholar] [CrossRef] [PubMed]
- Korea Diabetes Association. Diabetes Fact Sheet in Korea. Available online: https://www.diabetes.or.kr/bbs/?code=fact_sheet&mode=view&number=2390&page=1&code=fact_sheet (accessed on 6 March 2023).
- Smith, K.W.; McKinlay, S.M.; Thorington, B.D. The validity of health risk appraisal instruments for assessing coronary heart disease risk. Am. J. Public Health 1987, 77, 419–424. [Google Scholar] [CrossRef]
- Lemmens, P.H.; Volovics, L.; Haan, Y.D. Measurement of lifetime exposure to alcohol: Data quality of a self-administered questionnaire and impact on risk assessment. Contemp. Drug Prob. 1997, 24, 581–600. [Google Scholar] [CrossRef]
- Gallagher, K.A.; Sonneville, K.R.; Hazzard, V.M.; Carson, T.L.; Needham, B.L. Evaluating gender bias in an eating disorder risk assessment questionnaire for athletes. Eat. Disord. 2021, 29, 29–41. [Google Scholar] [CrossRef]
- Brown, J.; Cug, J.; Kolencik, J. Internet of things-based smart healthcare systems: Real-time patient-generated medical data from networked wearable devices. Am. J. Med. Res. 2020, 7, 21–26. [Google Scholar] [CrossRef]
- Miyaji, T.; Kawaguchi, T.; Azuma, K.; Suzuki, S.; Sano, Y.; Akatsu, M.; Torii, A.; Kamimura, T.; Ozawa, Y.; Tsuchida, A.; et al. Patient-generated health data collection using a wearable activity tracker in cancer patients—A feasibility study. Support. Care Cancer 2020, 28, 5953–5961. [Google Scholar] [CrossRef] [PubMed]


| Category | Variable | Definition | Mean ± STD/Freq % | p-Value | |
|---|---|---|---|---|---|
| Male (n = 214,613) | Female (n = 210,535) | ||||
| Demographic (DEMO) | AGE | Age (years) | 48.8 ± 12.9 | 51.7 ± 12.6 | <0.001 |
| Health behavior (LS) | SMK | Smoking amount (pack-year) | 11.9 ± 14.0 | 0.4 ± 2.6 | <0.001 |
| DRK | Alcohol intake (bottle/week) | 1.6 ± 2.2 | 0.2 ± 0.7 | <0.001 | |
| PA | Physical activity (MET-minute scores, IPAQ analysis) | 540.3 ± 528.7 | 457.1 ± 498.0 | <0.001 | |
| Body measurement (LS) | HT | Height (cm) | 169.6 ± 6.4 | 156.1 ± 6.1 | <0.001 |
| WT | Weight (kg) | 69.9 ± 10.5 | 57.2 ± 8.5 | <0.001 | |
| WC | Waist circumference (cm) | 83.9 ± 7.5 | 77.2 ± 8.7 | <0.001 | |
| BMI | Body mass index (kg/m2) | 24.3 ± 3.0 | 23.5 ± 3.3 | <0.001 | |
| Family history (FH) | FH_HT | Family history of heart diseases | 3.4% | 3.7% | <0.001 |
| FH_STR | Family history of stroke | 6.3% | 6.6% | 0.004 | |
| FH_HTN | Family history of hypertension | 10.6% | 13.7% | <0.001 | |
| FH_DM | Family history of diabetes | 8.8% | 10.0% | <0.001 | |
| Personal health device (PHD) | SBP | Systolic blood pressure (mmHg) | 125.0 ± 14.3 | 120.8 ± 16.0 | <0.001 |
| DBP | Diastolic blood pressure (mmHg) | 78.2 ± 9.9 | 74.7 ± 10.2 | <0.001 | |
| FBS | Fasting blood sugar (mg/dL) | 100.4 ± 25.3 | 96.3 ± 21.3 | <0.001 | |
| Laboratory (LAB) | TCHOL | Total cholesterol (mg/dL) | 194.9 ± 35.6 | 197.9 ± 37.0 | <0.001 |
| HDL | High density lipoprotein (mg/dL) | 51.9 ± 12.9 | 57.8 ± 13.9 | <0.001 | |
| LDL | Low density lipoprotein (mg/dL) | 113.6 ± 32.6 | 117.2 ± 33.7 | <0.001 | |
| TG | Triglycerides (mg/dL) | 147.3 ± 82.4 | 113.6 ± 64.8 | <0.001 | |
| HGB | Hemoglobin (g/dL) | 14.9 ± 1.2 | 12.8 ± 1.2 | <0.001 | |
| SCR | Creatinine (mg/dL) | 1.0 ± 0.2 | 0.8 ± 0.2 | <0.001 | |
| EGFR 1 | Glomerular filtration rate (GFR) ≥ 90 | 45.7% | 48.2% | <0.001 | |
| EGFR 2 | 60 ≤ GFR < 90 | 50.3% | 46.0% | ||
| EGFR 3 | 30 ≤ GFR < 60 | 3.9% | 5.7% | ||
| EGFR 4 | 15 ≤ GFR < 30 | 0.0% | 0.1% | ||
| AST | Aspartate aminotransferase (U/L) | 26.7 ± 11.7 | 23.1 ± 9.8 | <0.001 | |
| ALT | Alanine aminotransferase (U/L) | 28.8 ± 18.5 | 20.2 ± 13.1 | <0.001 | |
| GGT | Gamma glutamyl transferase (U/L) | 45.4 ± 37.5 | 22.3 ± 18.9 | <0.001 | |
| UPROT 0 | Urine protein 0 g/day | 94.9% | 95.3% | <0.001 | |
| UPROT 1 | <0.5 | 2.4% | 2.3% | ||
| UPROT 2 | 0.5 ≤ UPROT < 1 | 1.8% | 1.6% | ||
| UPROT 3 | 1 ≤ UPROT < 2 | 0.7% | 0.6% | ||
| UPROT 4 | 2 ≤ UPROT | 0.2% | 0.1% | ||
| Adverse Health Event | Three Year | Five Year | Ten Year | ||||||||||||
|---|---|---|---|---|---|---|---|---|---|---|---|---|---|---|---|
| Male | Female | p-value | Male | Female | p-Value | Male | Female | p-Value | |||||||
| n | Prev. (%) | n | Prev. (%) | n | Prev. (%) | n | Prev. (%) | n | Prev. (%) | n | Prev. (%) | ||||
| Mortality | 209,532 | 1.37 | 207,589 | 0.81 | <0.001 | 212,522 | 2.48 | 209,740 | 1.52 | <0.001 | 96,687 | 5.32 | 81,332 | 3.91 | <0.001 |
| Heart diseases | 189,688 | 3.16 | 185,675 | 3.06 | 0.079 | 187,552 | 5.08 | 184,485 | 4.95 | 0.088 | 83,670 | 9.72 | 70,097 | 9.92 | 0.239 |
| Stroke | 197,874 | 2.73 | 191,359 | 3.43 | <0.001 | 195,776 | 4.42 | 190,146 | 5.52 | <0.001 | 87,349 | 8.86 | 72,347 | 12.24 | <0.001 |
| Cancer | 205,050 | 1.09 | 204,543 | 0.62 | <0.001 | 202,577 | 1.71 | 202,988 | 0.99 | <0.001 | 89,590 | 3.16 | 76,757 | 2.12 | <0.001 |
| Hypertension | 135,188 | 12.41 | 136,351 | 8.25 | <0.001 | 134,262 | 15.48 | 135,939 | 11.41 | <0.001 | 61,298 | 28.02 | 51,226 | 23.57 | <0.001 |
| Diabetes | 170,187 | 6.27 | 169,365 | 5.77 | <0.001 | 168,615 | 9.17 | 168,442 | 9.15 | 0.900 | 76,231 | 18.01 | 64,225 | 19.37 | <0.001 |
| Adverse Health Event | Gender | Fea. Rank. | Three Year | Five Year | Ten Year | |||||||||||||||
|---|---|---|---|---|---|---|---|---|---|---|---|---|---|---|---|---|---|---|---|---|
| Model 2 | Model 3 | Model 4 | Model 2 | Model 3 | Model 4 | Model 2 | Model 3 | Model 4 | ||||||||||||
| Mortality | Male | 1 | AGE | (0.816) | AGE | (0.780) | AGE | (0.646) | AGE | (0.863) | AGE | (0.832) | AGE | (0.729) | AGE | (0.910) | AGE | (0.850) | AGE | (0.769) |
| 2 | WT | (0.056) | WT | (0.051) | HGB | (0.050) | WT | (0.046) | WT | (0.043) | HGB | (0.045) | SMK | (0.022) | WT | (0.030) | HGB | (0.027) | ||
| 3 | BMI | (0.036) | BMI | (0.032) | AST | (0.035) | SMK | (0.024) | FBS | (0.028) | GGT | (0.034) | WT | (0.022) | FBS | (0.025) | GGT | (0.024) | ||
| 4 | PA | (0.026) | FBS | (0.030) | GGT | (0.032) | BMI | (0.022) | SMK | (0.023) | WT | (0.029) | BMI | (0.021) | SMK | (0.022) | WT | (0.023) | ||
| 5 | SMK | (0.024) | PA | (0.022) | WT | (0.031) | PA | (0.019) | BMI | (0.021) | FBS | (0.020) | PA | (0.010) | BMI | (0.020) | AST | (0.019) | ||
| Female | 1 | AGE | (0.875) | AGE | (0.840) | AGE | (0.723) | AGE | (0.906) | AGE | (0.873) | AGE | (0.706) | AGE | (0.853) | AGE | (0.858) | AGE | (0.776) | |
| 2 | WT | (0.036) | WT | (0.035) | HGB | (0.051) | WT | (0.025) | WT | (0.025) | HGB | (0.039) | BMI | (0.039) | FBS | (0.030) | HGB | (0.020) | ||
| 3 | BMI | (0.030) | FBS | (0.029) | GGT | (0.046) | BMI | (0.021) | FBS | (0.023) | GGT | (0.038) | WT | (0.025) | WT | (0.024) | FBS | (0.018) | ||
| 4 | PA | (0.027) | BMI | (0.026) | WT | (0.030) | PA | (0.016) | HT | (0.016) | FBS | (0.024) | WC | (0.024) | BMI | (0.019) | GGT | (0.018) | ||
| 5 | WC | (0.010) | PA | (0.025) | FBS | (0.024) | WC | (0.013) | DBP | (0.015) | WT | (0.024) | PA | (0.021) | WC | (0.014) | WT | (0.017) | ||
| Heart disease | Male | 1 | AGE | (0.739) | AGE | (0.683) | AGE | (0.617) | AGE | (0.869) | AGE | (0.835) | AGE | (0.819) | AGE | (0.809) | AGE | (0.767) | AGE | (0.734) |
| 2 | BMI | (0.071) | BMI | (0.045) | WC | (0.042) | WC | (0.060) | WC | (0.047) | WC | (0.029) | WC | (0.067) | BMI | (0.037) | WC | (0.054) | ||
| 3 | WC | (0.061) | SBP | (0.041) | BMI | (0.038) | BMI | (0.045) | BMI | (0.036) | FH_HT | (0.029) | BMI | (0.053) | WT | (0.033) | BMI | (0.033) | ||
| 4 | PA | (0.027) | WC | (0.039) | SBP | (0.030) | SMK | (0.009) | SBP | (0.029) | BMI | (0.027) | SMK | (0.030) | FBS | (0.033) | SBP | (0.029) | ||
| 5 | SMK | (0.026) | WT | (0.034) | FBS | (0.028) | FH_HT | (0.008) | FBS | (0.018) | SBP | (0.024) | HT | (0.011) | WC | (0.033) | FBS | (0.029) | ||
| Female | 1 | AGE | (0.890) | AGE | (0.851) | AGE | (0.824) | AGE | (0.890) | AGE | (0.851) | AGE | (0.824) | AGE | (0.857) | AGE | (0.819) | AGE | (0.786) | |
| 2 | SMK | (0.184) | WC | (0.044) | WC | (0.045) | SMK | (0.184) | WC | (0.044) | WC | (0.045) | BMI | (0.043) | SBP | (0.035) | SBP | (0.029) | ||
| 3 | WC | (0.051) | SBP | (0.039) | DBP | (0.021) | WC | (0.051) | SBP | (0.039) | DBP | (0.021) | WC | (0.037) | WC | (0.033) | BMI | (0.024) | ||
| 4 | BMI | (0.021) | BMI | (0.020) | SBP | (0.021) | BMI | (0.021) | BMI | (0.020) | SBP | (0.021) | WT | (0.021) | BMI | (0.031) | WC | (0.023) | ||
| 5 | WT | (0.016) | FBS | (0.014) | BMI | (0.017) | WT | (0.016) | FBS | (0.014) | BMI | (0.017) | SMK | (0.015) | FBS | (0.021) | GGT | (0.020) | ||
| Stroke | Male | 1 | AGE | (0.973) | AGE | (0.957) | AGE | (0.948) | AGE | (0.923) | AGE | (0.896) | AGE | (0.866) | AGE | (0.934) | AGE | (0.915) | AGE | (0.892) |
| 2 | WC | (0.014) | SBP | (0.011) | SBP | (0.009) | WC | (0.023) | FBS | (0.019) | FBS | (0.014) | WC | (0.024) | WC | (0.014) | WC | (0.016) | ||
| 3 | SMK | (0.004) | FBS | (0.008) | FBS | (0.008) | SMK | (0.011) | SBP | (0.016) | SBP | (0.013) | SMK | (0.010) | SBP | (0.011) | SBP | (0.010) | ||
| 4 | BMI | (0.004) | DBP | (0.007) | WC | (0.006) | PA | (0.011) | WC | (0.015) | WC | (0.012) | DRK | (0.007) | FBS | (0.011) | FBS | (0.009) | ||
| 5 | PA | (0.003) | PA | (0.005) | DBP | (0.005) | BMI | (0.011) | SMK | (0.010) | GGT | (0.010) | FH_STR | (0.007) | HT | (0.011) | DBP | (0.008) | ||
| Female | 1 | AGE | (0.929) | AGE | (0.901) | AGE | (0.877) | AGE | (0.917) | AGE | (0.889) | AGE | (0.860) | AGE | (0.973) | AGE | (0.960) | AGE | (0.950) | |
| 2 | WC | (0.022) | SBP | (0.019) | SBP | (0.017) | WC | (0.021) | SBP | (0.019) | SBP | (0.014) | WC | (0.009) | SBP | (0.009) | SBP | (0.008) | ||
| 3 | BMI | (0.015) | WC | (0.013) | WC | (0.011) | BMI | (0.018) | WC | (0.017) | TG | (0.013) | BMI | (0.008) | FBS | (0.008) | WC | (0.007) | ||
| 4 | PA | (0.010) | FBS | (0.012) | DBP | (0.010) | PA | (0.011) | FBS | (0.015) | WC | (0.010) | PA | (0.002) | WT | (0.005) | TG | (0.006) | ||
| 5 | HT | (0.008) | DBP | (0.012) | TG | (0.009) | HT | (0.010) | BMI | (0.013) | FBS | (0.010) | WT | (0.002) | DBP | (0.005) | FBS | (0.005) | ||
| Cancer | Male | 1 | AGE | (0.869) | AGE | (0.855) | AGE | (0.782) | AGE | (0.916) | AGE | (0.895) | AGE | (0.821) | AGE | (0.872) | AGE | (0.847) | AGE | (0.776) |
| 2 | SMK | (0.029) | SMK | (0.026) | AST | (0.028) | SMK | (0.030) | SMK | (0.029) | LDL | (0.029) | SMK | (0.041) | SMK | (0.038) | LDL | (0.041) | ||
| 3 | BMI | (0.029) | DBP | (0.019) | SMK | (0.021) | WT | (0.011) | FBS | (0.013) | AST | (0.026) | WC | (0.022) | FBS | (0.021) | SMK | (0.032) | ||
| 4 | WC | (0.021) | WC | (0.017) | HGB | (0.020) | DRK | (0.011) | SBP | (0.012) | SMK | (0.025) | BMI | (0.021) | BMI | (0.017) | FBS | (0.019) | ||
| 5 | WT | (0.016) | BMI | (0.016) | LDL | (0.020) | WC | (0.011) | DRK | (0.010) | TG | (0.014) | PA | (0.015) | WC | (0.017) | HGB | (0.016) | ||
| Female | 1 | AGE | (0.908) | AGE | (0.882) | AGE | (0.777) | AGE | (0.962) | AGE | (0.954) | AGE | (0.886) | AGE | (0.772) | AGE | (0.711) | AGE | (0.589) | |
| 2 | DRK | (0.025) | FBS | (0.029) | AST | (0.050) | PA | (0.099) | SMK | (0.112) | AST | (0.048) | WC | (0.042) | DBP | (0.048) | LDL | (0.046) | ||
| 3 | WC | (0.016) | DRK | (0.021) | ALT | (0.031) | SMK | (0.018) | FBS | (0.011) | HGB | (0.013) | PA | (0.041) | BMI | (0.040) | TG | (0.045) | ||
| 4 | BMI | (0.015) | SBP | (0.015) | TCHOL | (0.026) | WC | (0.007) | SBP | (0.005) | LDL | (0.013) | BMI | (0.040) | SBP | (0.034) | AST | (0.044) | ||
| 5 | SMK | (0.014) | SMK | (0.011) | HGB | (0.023) | BMI | (0.006) | PA | (0.004) | SMK | (0.012) | HT | (0.039) | WC | (0.030) | DBP | (0.030) | ||
| Hypertension | Male | 1 | AGE | (0.546) | SBP | (0.350) | AGE | (0.286) | AGE | (0.574) | AGE | (0.318) | AGE | (0.277) | AGE | (0.513) | SBP | (0.330) | AGE | (0.304) |
| 2 | BMI | (0.200) | AGE | (0.299) | FBS | (0.270) | BMI | (0.191) | SBP | (0.315) | SBP | (0.215) | BMI | (0.227) | AGE | (0.312) | DBP | (0.222) | ||
| 3 | WC | (0.124) | DBP | (0.165) | SBP | (0.189) | WC | (0.124) | DBP | (0.137) | DBP | (0.163) | WC | (0.139) | DBP | (0.139) | SBP | (0.170) | ||
| 4 | DRK | (0.074) | WC | (0.047) | DBP | (0.056) | DRK | (0.061) | BMI | (0.053) | BMI | (0.068) | DRK | (0.057) | WC | (0.073) | BMI | (0.092) | ||
| 5 | HT | (0.021) | BMI | (0.042) | WC | (0.046) | HT | (0.018) | FBS | (0.047) | FBS | (0.043) | FH_HTN | (0.019) | BMI | (0.066) | WC | (0.053) | ||
| Female | 1 | AGE | (0.709) | SBP | (0.378) | SBP | (0.401) | AGE | (0.711) | SBP | (0.378) | SBP | (0.369) | AGE | (0.484) | SBP | (0.349) | SBP | (0.303) | |
| 2 | BMI | (0.161) | AGE | (0.352) | AGE | (0.345) | BMI | (0.160) | AGE | (0.366) | AGE | (0.355) | BMI | (0.192) | AGE | (0.263) | AGE | (0.229) | ||
| 3 | WC | (0.060) | DBP | (0.121) | DBP | (0.097) | WC | (0.082) | DBP | (0.107) | DBP | (0.103) | WC | (0.095) | BMI | (0.086) | BMI | (0.064) | ||
| 4 | HT | (0.019) | BMI | (0.051) | BMI | (0.048) | FH_HTN | (0.016) | BMI | (0.054) | BMI | (0.049) | PA | (0.070) | WC | (0.059) | DBP | (0.046) | ||
| 5 | FH_HTN | (0.017) | WC | (0.041) | WC | (0.028) | HT | (0.013) | WC | (0.048) | WC | (0.043) | HT | (0.051) | DBP | (0.059) | WC | (0.043) | ||
| Diabetes | Male | 1 | AGE | (0.657) | FBS | (0.468) | FBS | (0.381) | AGE | (0.668) | AGE | (0.409) | AGE | (0.389) | AGE | (0.536) | AGE | (0.320) | AGE | (0.311) |
| 2 | WC | (0.129) | AGE | (0.318) | AGE | (0.307) | WC | (0.129) | FBS | (0.363) | FBS | (0.364) | BMI | (0.185) | FBS | (0.314) | FBS | (0.244) | ||
| 3 | BMI | (0.118) | WC | (0.061) | SBP | (0.054) | BMI | (0.124) | WC | (0.064) | WC | (0.052) | WC | (0.142) | BMI | (0.113) | GGT | (0.086) | ||
| 4 | FH_DM | (0.028) | BMI | (0.050) | WC | (0.042) | FH_DM | (0.022) | BMI | (0.058) | GGT | (0.045) | SMK | (0.036) | WC | (0.079) | WC | (0.063) | ||
| 5 | SMK | (0.027) | SMK | (0.025) | GGT | (0.040) | SMK | (0.020) | SBP | (0.056) | ALT | (0.041) | FH_DM | (0.029) | SMK | (0.033) | SBP | (0.049) | ||
| Female | 1 | AGE | (0.731) | AGE | (0.500) | AGE | (0.461) | AGE | (0.739) | AGE | (0.535) | AGE | (0.494) | AGE | (0.650) | AGE | (0.463) | AGE | (0.404) | |
| 2 | BMI | (0.113) | FBS | (0.232) | FBS | (0.265) | BMI | (0.117) | FBS | (0.200) | FBS | (0.253) | BMI | (0.157) | FBS | (0.160) | FBS | (0.225) | ||
| 3 | WC | (0.095) | HT | (0.102) | GGT | (0.061) | WC | (0.099) | HT | (0.090) | WC | (0.051) | WC | (0.115) | SBP | (0.122) | WC | (0.074) | ||
| 4 | FH_DM | (0.018) | WC | (0.048) | WC | (0.051) | FH_DM | (0.019) | BMI | (0.045) | BMI | (0.044) | FH_DM | (0.022) | WC | (0.087) | BMI | (0.064) | ||
| 5 | HT | (0.012) | BMI | (0.033) | BMI | (0.029) | HT | (0.009) | WC | (0.033) | GGT | (0.042) | PA | (0.015) | BMI | (0.058) | TG | (0.059) | ||
Disclaimer/Publisher’s Note: The statements, opinions and data contained in all publications are solely those of the individual author(s) and contributor(s) and not of MDPI and/or the editor(s). MDPI and/or the editor(s) disclaim responsibility for any injury to people or property resulting from any ideas, methods, instructions or products referred to in the content. |
© 2024 by the authors. Licensee MDPI, Basel, Switzerland. This article is an open access article distributed under the terms and conditions of the Creative Commons Attribution (CC BY) license (https://creativecommons.org/licenses/by/4.0/).
Share and Cite
Park, H.; Jung, S.Y.; Han, M.K.; Jang, Y.; Moon, Y.R.; Kim, T.; Shin, S.-Y.; Hwang, H. Lowering Barriers to Health Risk Assessments in Promoting Personalized Health Management. J. Pers. Med. 2024, 14, 316. https://doi.org/10.3390/jpm14030316
Park H, Jung SY, Han MK, Jang Y, Moon YR, Kim T, Shin S-Y, Hwang H. Lowering Barriers to Health Risk Assessments in Promoting Personalized Health Management. Journal of Personalized Medicine. 2024; 14(3):316. https://doi.org/10.3390/jpm14030316
Chicago/Turabian StylePark, Hayoung, Se Young Jung, Min Kyu Han, Yeonhoon Jang, Yeo Rae Moon, Taewook Kim, Soo-Yong Shin, and Hee Hwang. 2024. "Lowering Barriers to Health Risk Assessments in Promoting Personalized Health Management" Journal of Personalized Medicine 14, no. 3: 316. https://doi.org/10.3390/jpm14030316