
Impact of COVID-19 on Fetal Outcomes in Pregnant Women: A Systematic Review and Meta-Analysis

 , , and
Abstract
:1. Introduction
2. Material and Methods
2.1. Search Strategy
2.2. Selection Criteria
2.3. Data Extraction
2.4. Quality Assessment
2.5. Statistical Analysis
3. Results
3.1. Study Characteristics
3.2. Quality of Evidence of Included Studies
3.3. Specific Results
3.3.1. Patients and Controls Characteristics
3.3.2. Ovarian Function
3.3.3. Pregnancy Outcomes
3.3.4. Fetal Outcomes
4. Discussion
5. Conclusions
Supplementary Materials
Author Contributions
Funding
Institutional Review Board Statement
Informed Consent Statement
Data Availability Statement
Conflicts of Interest
References
- Chatterjee, P.; Nagi, N.; Agarwal, A.; Das, B.; Banerjee, S.; Sarkar, S.; Gupta, N.; Gangakhedkar, R. The 2019 Novel Coronavirus Disease (COVID-19) Pandemic: A Review of the Current Evidence. Indian J. Med. Res. 2020, 151, 147. [Google Scholar] [CrossRef] [PubMed]
- WHO. Coronavirus Disease 2019 (2019-NCOV) Situation Report—11; World Health Organization: Geneva, Switzerland, 2020; Volume 31, pp. 1–7.
- WHO. World Health Organization (WHO): Situation Report-26; World Health Organization (WHO): Geneva, Switzerland, 2016.
- Heymann, D.L.; Shindo, N. COVID-19: What Is next for Public Health. Lancet 2020, 395, 10224. [Google Scholar] [CrossRef] [PubMed]
- Ochani, R.; Asad, A.; Yasmin, F.; Shaikh, S.; Khalid, H.; Batra, S.; Sohail, M.R.; Mahmood, S.F.; Ochani, R.; Hussham Arshad, M.; et al. COVID-19 pandemic: From origins to outcomes. A comprehensive review of viral pathogenesis, clinical manifestations, diagnostic evaluation, and management. Infez. Med. 2021, 29, 20–36. [Google Scholar]
- Jamieson, D.J.; Rasmussen, S.A. An update on COVID-19 and pregnancy. Am. J. Obstet. Gynecol. 2022, 226, 177–186. [Google Scholar] [CrossRef] [PubMed]
- Sheikh, J.; Lawson, H.; Allotey, J.; Yap, M.; Balaji, R.; Kew, T.; Stallings, E.; Coomar, D.; Gaetano-Gil, A.; Zamora, J.; et al. Global variations in the burden of SARS-CoV-2 infection and its outcomes in pregnant women by geographical region and country’s income status: A meta-analysis. BMJ Glob. Health 2022, 7, e010060. [Google Scholar] [CrossRef] [PubMed]
- Wang, M.; Yang, Q.; Ren, X.; Hu, J.; Li, Z.; Long, R.; Xi, Q.; Zhu, L.; Jin, L. Investigating the impact of asymptomatic or mild SARS-CoV-2 infection on female fertility and in vitro fertilization outcomes: A retrospective cohort study. EClinicalMedicine 2021, 38, 101013. [Google Scholar] [CrossRef]
- Yaghoobpoor, S.; Fathi, M.; Vakili, K.; Tutunchian, Z.; Dehghani, M.; Bahrami, A.; Hajibeygi, R.; Eslami, S.; Yaghoobpour, T.; Hajiesmaeili, M. Cardiovascular Complications of COVID-19 among Pregnant Women and Their Fetuses: A Systematic Review. J. Clin. Med. 2022, 11, 6194. [Google Scholar] [CrossRef] [PubMed]
- Prochaska, E.; Jang, M.; Burd, I. COVID-19 in pregnancy: Placental and neonatal involvement. Am. J. Reprod. Immunol. 2020, 84, e13306. [Google Scholar] [CrossRef]
- Carrasco, I.; Muñoz-Chapuli, M.; Vigil-Vázquez, S.; Aguilera-Alonso, D.; Hernández, C.; Sánchez-Sánchez, C.; Oliver, C.; Riaza, M.; Pareja, M.; Sanz, O.; et al. SARS-COV-2 infection in pregnant women and newborns in a Spanish cohort (GESNEO-COVID) during the first wave. BMC Pregnancy Childbirth 2021, 21, 326. [Google Scholar] [CrossRef]
- Methley, A.M.; Campbell, S.; Chew-Graham, C.; McNally, R.; Cheraghi-Sohi, S. PICO, PICOS and SPIDER: A comparison study of specificity and sensitivity in three search tools for qualitative systematic reviews. BMC Health Serv. Res. 2014, 14, 579. [Google Scholar] [CrossRef] [PubMed]
- Wan, X.; Wang, W.; Liu, J.; Tong, T. Estimating the sample mean and standard deviation from the sample size, median, range and/or interquartile range. BMC Med. Res. Methodol. 2014, 14, 135. [Google Scholar] [CrossRef] [PubMed]
- Murray, J.; Farrington, D.P.; Eisner, M.P. Drawing conclusions about causes from systematic reviews of risk factors: The Cambridge Quality Checklists. J. Exp. Criminol. 2009, 5, 1–23. [Google Scholar] [CrossRef]
- Glynn, S.M.; Yang, Y.J.; Thomas, C.; Friedlander, R.L.; Cagino, K.A.; Matthews, K.C.; Riley, L.E.; Baergen, R.N.; Prabhu, M. SARS-CoV-2 and Placental Pathology: Malperfusion Patterns Are Dependent on Timing of Infection during Pregnancy. Am. J. Surg. Pathol. 2022, 46, 51–57. [Google Scholar] [CrossRef] [PubMed]
- Lankford, A.; Berger, J.; Benjenk, I.; Jackson, A.; Ahmadzia, H.; Mazzeffi, M. Outcomes of cesarean delivery in obstetric patients with SARS-CoV-2 infection. Int. J. Gynecol. Obstet. 2021, 155, 547–548. [Google Scholar] [CrossRef]
- Ruggiero, M.; Somigliana, E.; Tassis, B.; Li Piani, L.; Uceda Renteria, S.; Barbara, G.; Lunghi, G.; Pietrasanta, C.; Ferrazzi, E. Clinical relevance of SARS-CoV-2 infection in late pregnancy. BMC Pregnancy Childbirth 2021, 21, 505. [Google Scholar] [CrossRef]
- DeSisto, C.L.; Wallace, B.; Simeone, R.M.; Polen, K.; Ko, J.Y.; Meaney-Delman, D.; Ellington, S.R. Risk for Stillbirth Among Women With and Without COVID-19 at Delivery Hospitalization—United States, March 2020–September 2021. MMWR Morb. Mortal Wkly. Rep. 2021, 70, 1640–1645. [Google Scholar] [CrossRef]
- Crovetto, F.; Crispi, F.; Llurba, E.; Pascal, R.; Larroya, M.; Trilla, C.; Camacho, M.; Medina, C.; Dobaño, C.; Gomez-Roig, M.D.; et al. Impact of Severe Acute Respiratory Syndrome Coronavirus 2 Infection on Pregnancy Outcomes: A Population-based Study. Clin. Infect. Dis. 2021, 73, 1768–1775. [Google Scholar] [CrossRef]
- Brien, M.E.; Bouron-Dal Soglio, D.; Dal Soglio, S.; Couture, C.; Boucoiran, I.; Nasr, Y.; Widdows, K.; Sharps, M.C.; El Demellawy, D.; Heazell, A.E.; et al. Pandemic stress and SARS-CoV-2 infection are associated with pathological changes at the maternal-fetal interface. Placenta 2021, 115, 37–44. [Google Scholar] [CrossRef]
- Gurol-Urganci, I.; Jardine, J.E.; Carroll, F.; Draycott, T.; Dunn, G.; Fremeaux, A.; Harris, T.; Hawdon, J.; Morris, E.; Muller, P.; et al. Maternal and perinatal outcomes of pregnant women with SARS-CoV-2 infection at the time of birth in England: National cohort study. Am. J. Obstet. Gynecol. 2021, 225, 522.e1–522.e11. [Google Scholar] [CrossRef]
- Bertero, L.; Borella, F.; Botta, G.; Carosso, A.; Cosma, S.; Bovetti, M.; Carosso, M.; Abbona, G.; Collemi, G.; Papotti, M.; et al. Placenta histopathology in SARS-CoV-2 infection: Analysis of a consecutive series and comparison with control cohorts. Virchows Arch. 2021, 479, 715–728. [Google Scholar] [CrossRef]
- Laresgoiti-Servitje, E.; Arturo, J.; Gabriela, R.; Helguera-Repetto, A.C.; Moreno-Verduzco, E.R. COVID-19 Infection in Pregnancy: PCR Cycle Thresholds, Placental Pathology, and Perinatal Outcomes. Viruses. 2021, 13, 1884. [Google Scholar] [CrossRef] [PubMed]
- Januszewski, M.; Ziuzia-Januszewska, L.; Santor-Zaczynska, M.; Jakimiuk, A.A.; Oleksik, T.; Pokulniewicz, M.; Pluta, K.; Wierzba, W.; Jakimiuk, A.J. COVID-19 in pregnancy—Perinatal outcomes and vertical transmission preventative strategies, when considering more transmissible sars-cov-2 variants. J. Clin. Med. 2021, 10, 3724. [Google Scholar] [CrossRef] [PubMed]
- Maeda, M.D.; Brizot, M.D.; Gibelli, M.A.; Ibidi, S.M.; Carvalho, W.B.; Hoshida, M.S.; Machado, C.M.; Sabino, E.C.; Oliveira da Silva, L.C.; Jaenisch, T.; et al. Vertical transmission of SARS-CoV2 during pregnancy: A high-risk cohort. Prenat. Diagn. 2021, 41, 998–1008. [Google Scholar] [CrossRef] [PubMed]
- Tasca, C.; Rossi, R.S.; Corti, S.; Anelli, G.M.; Savasi, V.; Brunetti, F.; Cardellicchio, M.; Caselli, E.; Tonello, C.; Vergani, P.; et al. Placental pathology in COVID-19 affected pregnant women: A prospective case-control study. Placenta 2021, 110, 9–15. [Google Scholar] [CrossRef]
- Bortoletto, P.; Romanski, P.A.; Stewart, J.; Rosenwaks, Z.; Pfeifer, S.M. Incidence of first trimester pregnancy loss in the infertile population during the first wave of the coronavirus disease 2019 pandemic in New York City. F&S Rep. 2021, 2, 209–214. [Google Scholar]
- Levitan, D.; London, V.; McLaren, R.A., Jr.; Mann, J.D.; Cheng, K.; Silver, M.; Balhotra, K.S.; McCalla, S.; Loukeris, K. Histologic and Immunohistochemical Evaluation of 65 Placentas From Women With Polymerase Chain Reaction-Proven Severe Acute Respiratory Syndrome Coronavirus 2 (SARS-CoV-2) Infection. Arch. Pathol. Lab. Med. 2021, 145, 648. [Google Scholar] [CrossRef]
- Blasco Santana, L.; Miraval Wong, E.; Álvarez-Troncoso, J.; Sánchez García, L.; Bartha, J.L.R.-Z.R. Maternal and perinatal outcomes and placental pathologic examination of 29 SARS-CoV-2 infected patients in the third trimester of gestation. J. Obs. Gynaecol. Res. 2021, 47, 2131. [Google Scholar] [CrossRef]
- Rebutini, P.Z.; Zanchettin, A.C.; Stonoga, E.T.; Pra, D.M.; de Oliveira, A.L.; Deziderio, F.D.; Fonseca, A.S.; Dagostini, J.C.; Hlatchuk, E.C.; Furuie, I.N.; et al. Association Between COVID-19 Pregnant Women Symptoms Severity and Placental Morphologic Features. Front. Immunol. 2021, 12, 685919. [Google Scholar] [CrossRef]
- Resta, L.; Vimercati, A.; Cazzato, G.; Mazzia, G.; Cicinelli, E.; Colagrande, A.; Fanelli, M.; Scarcella, S.V.; Ceci, O.; Rossi, R. SARS-CoV-2 and Placenta: New Insights and Perspectives. Viruses 2021, 13, 723. [Google Scholar] [CrossRef]
- Jaiswal, N.; Puri, M.; Agarwal, K.; Singh, S.; Yadav, R.; Tiwary, N.; Tayal, P.; Vats, B. COVID-19 as an independent risk factor for subclinical placental dysfunction. Eur. J. Obstet. Gynecol. Reprod Biol. 2021, 259, 7–11. [Google Scholar] [CrossRef]
- Patberg, E.T.; Adams, T.; Rekawek, P.; Vahanian, S.A.; Akerman, M.; Hernandez, A.; Rapkiewicz, A.V.; Ragolia, L.; Sicuranza, G.; Chavez, M.R.; et al. Coronavirus disease 2019 infection and placental histopathology in women delivering at term. Am. J. Obstet. Gynecol. 2021, 224, 382.e1–382.e18. [Google Scholar] [CrossRef] [PubMed]
- Cribiù, F.M.; Erra, R.; Pugni, L.; Rubio-Perez, C.; Alonso, L.; Simonetti, S.; Croci, G.A.; Serna, G.; Ronchi, A.; Pietrasanta, C.; et al. Severe SARS-CoV-2 placenta infection can impact neonatal outcome in the absence of vertical transmission. J. Clin. Investig. 2021, 131, e14. [Google Scholar] [CrossRef] [PubMed]
- Debelenko, L.; Katsyv, I.; Chong, A.M.; Peruyero, L.; Szabolcs, M.; Uhlemann, A.C. Trophoblast damage with acute and chronic intervillositis: Disruption of the placental barrier by severe acute respiratory syndrome coronavirus 2. Hum. Pathol. 2021, 109, 69–79. [Google Scholar] [CrossRef] [PubMed]
- Tadas, M.P.; Prashanthi, S.; Waikar, M. Maternal and neonatal outcomes of pregnant women with covid-19: A case–control study at a tertiary care center in india. J. SAFOG 2021, 13, 44–49. [Google Scholar] [CrossRef]
- la Cour Freiesleben, N.; Egerup, P.; Hviid, K.V.; Severinsen, E.R.; Kolte, A.M.; Westergaard, D.; Fich Olsen, L.; Prætorius, L.; Zedeler, A.; Christiansen, A.M.; et al. SARS-CoV-2 in first trimester pregnancy: A cohort study. Hum. Reprod. 2021, 36, 40–47. [Google Scholar] [CrossRef]
- Smithgall, M.C.; Liu-Jarin, X.; Hamele-Bena, D.; Cimic, A.; Mourad, M.; Debelenko, L.; Chen, X. Third-trimester placentas of severe acute respiratory syndrome coronavirus 2 (SARS-CoV-2)-positive women: Histomorphology, including viral immunohistochemistry. Histopathology 2020, 77, 994–999. [Google Scholar] [CrossRef]
- Gulersen, M.; Prasannan, L.; Tam, H.T.; Metz, C.N.; Rochelson, B.; Meirowitz, N.; Shan, W.; Edelman, M.; Millington, K.A. Histopathologic evaluation of placentas after diagnosis of maternal severe acute respiratory syndrome coronavirus 2 infection. Am. J. Obstet. Gynecol. MFM 2020, 2, 100211. [Google Scholar] [CrossRef]
- Taglauer, E.; Benarroch, Y.; Rop, K.; Barnett, E.; Sabharwal, V.; Yarrington, C.; Wachman, E.M. Consistent localization of SARS-CoV-2 spike glycoprotein and ACE2 over TMPRSS2 predominance in placental villi of 15 COVID-19 positive maternal-fetal dyads. Placenta 2020, 100, 69–74. [Google Scholar] [CrossRef]
- Maraschini, A.; Corsi, E.; Salvatore, M.A.D.S. ItOSS COVID-19 Working Group. Coronavirus and birth in Italy: Results of a national population-based cohort study. Ann. Ist Super Sanita 2020, 56, 378–389. [Google Scholar]
- Higgins, J.P.; Altman, D.G.; Gøtzsche, P.C.; Jüni, P.; Moher, D.; Oxman, A.D.; Savović, J.; Schulz, K.F.; Weeks, L.; Sterne, J.A. The Cochrane Collaboration’s tool for assessing risk of bias in randomised trials. BMJ 2011, 343, d5928. [Google Scholar] [CrossRef]
- Wang, L.M.; Lai, S.P.; Liang, S.J.; Yang, S.T.; Liu, C.H.; Wang, P.H. Maternal and fetal outcomes of the pregnant woman with COVID-19: The first case report in Taiwan. Taiwan J. Obstet. Gynecol. 2021, 60, 942–944. [Google Scholar] [CrossRef] [PubMed]
- Abedzadeh-Kalahroudi, M.; Sehat, M.; Vahedpour, Z.T.P. Maternal and neonatal outcomes of pregnant patients with COVID-19: A prospective cohort study. Int. J. Gynaecol. Obs. 2021, 153, 449. [Google Scholar] [CrossRef] [PubMed]
- Schwartz, D.A.; Baldewijns, M.; Benachi, A.; Bugatti, M.; Bulfamante, G.; Cheng, K.; Collins, R.R.; Debelenko, L.; De Luca, D.; Facchetti, F.; et al. Hofbauer cells and COVID-19 in pregnancy: Molecular pathology analysis of villous macrophages, endothelial cells, and placental findings from 22 placentas infected by SARS-CoV-2 with and without fetal transmission. Arch. Pathol. Lab. Med. 2021, 145, 1328–1340. [Google Scholar] [CrossRef] [PubMed]
- Verma, S.; Joshi, C.S.; Silverstein, R.B.; He, M.; Carter, E.B.; Mysorekar, I.U. SARS-CoV-2 colonization of maternal and fetal cells of the human placenta promotes alteration of local renin-angiotensin system. Med 2021, 2, 575–590.e5. [Google Scholar] [CrossRef] [PubMed]
- Jang, W.K.; Lee, S.Y.; Park, S.; Ryoo, N.H.; Hwang, I.; Park, J.M.; Bae, J.G. Pregnancy Outcome, Antibodies, and Placental Pathology in SARS-CoV-2 Infection during Early Pregnancy. Int. J. Environ. Res. Public Health 2021, 18, 5709. [Google Scholar] [CrossRef]
- Moore, K.M.; Suthar, M.S. Comprehensive analysis of COVID-19 during pregnancy. Biochem. Biophys. Res. Commun. 2021, 538, 180–186. [Google Scholar] [CrossRef]
- Wong, S.S. Birth Order and Birth Weight of Saudi Newborns. J. R. Soc. Health 1990, 110, 9. [Google Scholar]
- Qiu, L.; Morse, A.; Di, W.; Song, L.; Kong, B.; Wang, Z.; Lang, J.; Chai, W.; Zhu, L.; Xue, F.; et al. Management of gynecology patients during the coronavirus disease 2019 pandemic: Chinese expert consensus. Am. J. Obstet. Gynecol. 2020, 223, 3–8. [Google Scholar] [CrossRef]
- Ardissino, M.; Slob, E.A.; Millar, O.; Reddy, R.K.; Lazzari, L.; Patel, K.H.; Ryan, D.; Johnson, M.R.; Gill, D.; Ng, F.S. Maternal Hypertension Increases Risk of Preeclampsia and Low Fetal Birthweight: Genetic Evidence from a Mendelian Randomization Study. Hypertension 2022, 79, 588–598. [Google Scholar] [CrossRef]
- Chatterjee, S.; Ouidir, M.; Tekola-Ayele, F. Pleiotropic genetic influence on birth weight and childhood obesity. Sci. Rep. 2021, 11, 48. [Google Scholar] [CrossRef]
- Sun, Y.; Shen, Z.; Zhan, Y.; Wang, Y.; Ma, S.; Zhang, S.; Liu, J.; Wu, S.; Feng, Y.; Chen, Y.; et al. Effects of pre-pregnancy body mass index and gestational weight gain on maternal and infant complications. BMC Pregnancy Childbirth 2020, 20, 390. [Google Scholar] [CrossRef] [PubMed]
- Mascio, D.; Di Khalil, A.; Saccone, G.; Rizzo, G.; Buca, D. Systematic Review Outcome of coronavirus spectrum infections. Am. J. Obstet. Gynecol. MFM 2020, 2, 100107. [Google Scholar] [CrossRef] [PubMed]
- Di Toro, F.; Gjoka, M.; Di Lorenzo, G.; De Santo, D.; De Seta, F.; Maso, G.; Risso, F.M.; Romano, F.; Wiesenfeld, U.; Levi-D’Ancona, R.; et al. Impact of COVID-19 on maternal and neonatal outcomes: A systematic review and meta-analysis. Clin. Microbiol. Infect. 2021, 27, 36–46. [Google Scholar] [CrossRef]
- Chmielewska, B.; Barratt, I.; Townsend, R.; Kalafat, E.; van der Meulen, J.; Gurol-Urganci, I.; O’Brien, P.; Morris, E.; Draycott, T.; Thangaratinam, S.; et al. Effects of the COVID-19 Pandemic on Maternal and Perinatal Outcomes: A Systematic Review and Meta-Analysis. Lancet Glob. Health 2021, 9, e759–e772. [Google Scholar] [CrossRef] [PubMed]
- Di Mascio, D.; Sen, C.; Saccone, G.; Galindo, A.; Grünebaum, A.; Yoshimatsu, J.; Stanojevic, M.; Kurjak, A.; Chervenak, F.; Rodríguez Suárez, M.J.; et al. Risk factors associated with adverse fetal outcomes in pregnancies affected by Coronavirus disease 2019 (COVID-19): A secondary analysis of the WAPM study on COVID-19. J. Perinat Med. 2020, 48, 950–958. [Google Scholar] [CrossRef] [PubMed]
- Wei, S.Q.; Bilodeau-Bertrand, M.; Liu, S.; Auger, N. The impact of COVID-19 on pregnancy outcomes: A systematic review and meta-analysis. Cmaj 2021, 193, E540–E548. [Google Scholar] [CrossRef]
- Zaigham, M.; Andersson, O. Maternal and perinatal outcomes with COVID-19: A systematic review of 108 pregnancies. Acta Obstet. Gynecol. Scand. 2020, 99, 823–829. [Google Scholar] [CrossRef]


| Inclusion Criteria | Exclusion Criteria | |
|---|---|---|
| Population | Fertile pregnant women and/or women seeking pregnancy | Pre-existing comorbidities of the reproductive apparatus (early menopause, hysterectomized woman, urogenital infections, etc.) |
| Exposure | Previous or current SARS-CoV-2 infection assessed by RT-PCR swab | Presumed or unproven infection |
| Comparison | No infection | |
| Outcomes |
| |
| Study type | Observational studies, randomized controlled studies, case–control studies | Animal studies, in vitro studies, reviews, meta-analyses, case reports, book chapters, and editorials |
| Author, Year | Type of Study | Number of Patients/ Controls | Age (Mean ± SD) (Patients/ Controls) | BMI (Mean ± SD) (Patients/ Controls) | Diabetes (Events/ Total) | Hypertension (Events/ Total) | Gestational Age at Delivery (Years) | Preterm Delivery (Events/ Total) | Fetal Death (Events/ Total) | Live Birth (Events/ Total) |
|---|---|---|---|---|---|---|---|---|---|---|
| Glyn et al., 2022 [15] | Prospective cohort study | 88/188 | 35.5 ± 5.11/ 35.4 ± 5.3 | - | - | - | - | - | - | - |
| Lankford et al., 2021 [16] | Retrospective cohort study | 261/12,046 | - | - | Patients:44/261 Controls: 1658/12,046 | Patients 15/261 Controls: 454/12,046 | - | Patients: 23/261 Controls: 546/12,046 | Patients: 8/261 Controls: 96/12,046 | Patients: 23/261 Controls: 546/12,046 |
| Ruggiero et al., 2021 [17] | Prospective cohort study | 28/287 | 31.6 ± 7/ 34.2 ± 5 | 32 ± 7/ 26 ± 4 | Patients: 3/28 Controls: 22/287 | Patients: 2/28 Controls:6/287 | 38 ± 1.4/ 39 ± 2 | - | - | - |
| DeSisto et al., 2021 [18] | Retrospective cohort study | 21,653/1,227,981 | - | - | - | - | - | - | Patients: 273/21,653 Controls: 7881/1,227,981 | - |
| Crovetto et al., 2021 [19] | Prospective cohort study | 317/1908 | - | - | Patients: 6/317 Controls: 33/1908 | Patients: 11/317 Controls: 58/1908 | 39.1 ± 2.1/ 39.3 ± 2.6 | - | Patients: 1/317 Controls: 6/1908 | - |
| Brienet al., 2021 [20] | Prospective cohort study | 32/38 | - | - | - | - | - | Patients: 5/31 Controls: 3/38 | - | - |
| Gurol-Urganci et al., 2021 [21] | Retrospective cohort study | 3527/338,553 | - | - | - | - | - | Patients: 369/3527 Controls: 18,527/338,553 | Patients: 30/2527 Controls: 1140/338,553 | - |
| Bertero et al., 2021 [22] | Prospective cohort study | 18/86 | - | - | - | - | - | - | - | - |
| Laresgoiti-Servitje et al., 2021 [23] | Retrospective cohort study | 298/828 | 28 ± 7.2/ 28 ± 7 | - | - | - | - | Patients: 39/298 Controls: 38/828 | Patients: 19/298 Controls: 38/828 | - |
| Januszewski et al., 2021 [24] | Retrospective cohort study | 47/44 | - | 30 ± 5/30 ± 5 | Patients:10/47 Controls: 7/44 | Patients:8/47 Controls: 7/44 | - | - | - | - |
| Wang et al., 2021 [8] | Retrospective cohort study | 65/195 | - | - | - | - | - | - | - | - |
| Maeda et al., 2021 [25] | Retrospective cohort study | 16/93 | - | - | Patients: 2/16 Controls: 2/93 | Patients: 0/16 Controls: 14/93 | - | - | - | - |
| Tasca et al., 2021 [26] | Prospective cohort study | 64/64 | 32 ± 5/ 32 ± 6 | 24 ± 5/ 25 ± 5 | Patients: 7/64 Controls: 10/64 | Patients: 1/64 Controls: 3/64 | - | Patients: 3/64 Controls: 3/64 | - | - |
| Bortoletto et al., 2021 [27] | Cross-sectional survey | 202/518 | 37 ± 4/ 36 ± 4 | - | - | - | - | - | - | - |
| Levitan et al., 2021 [28] | Retrospective case–control study | 65/85 | - | - | Patients: 2/65 Controls: 11/85 | Patients: 9/65 Controls: 13/85 | - | Patients: 12/65 Controls: 27/85 | - | - |
| Blasco Santana et al., 2021 [29] | Retrospective cohort study | 32/58 | 32 ± 5.7/ 34 ± 5 | - | - | - | - | - | - | - |
| Rebutini et al., 2021 [30] | Retrospective case–control study. | 19/19 | - | - | Patients: 4/19 Controls: 3/19 | Patients: 3/19 Controls: 3/19 | - | Patients: 10/19 Controls: 9/19 | - | - |
| Resta et al., 2021 [31] | Retrospective case–control study. | 83/142 | 33 ± 6.1/ 33 ± 6 | - | Patients: 5/83 Controls: 11/142 | Patients: 6/83 Controls: 15/142 | 39 ± 3/ 39 ± 2 | - | - | - |
| Jaiswal et al., 2021 [32] | Prospective cohort study | 27/27 | 27 ± 5/ 25 ± 5 | - | - | - | - | - | Patients: 4/27 Controls: 6/27 | - |
| Patberg et al., 2021 [33] | Retrospective cohort study | 77/56 | 29 ± 6/ 32 ± 5 | 32 ± 6/ 32 ± 5 | Patients:7/77 Controls: 0/56 | - | 39 ± 1/ 39 ± 1 | - | - | - |
| Cribiù et al., 2021 [34] | Prospective cohort study | 21/16 | - | - | - | - | - | Patients: 6/21 Controls: 3/16 | - | - |
| Debelenko et al., 2021 [35] | Retrospective cohort study | 75/75 | - | - | Patients: 5/75 Controls: 4/75 | Patients: 9/75 Controls: 8/75 | - | - | Patients: 0/75 Controls: 1/75 | - |
| Tadas et al., 2021 [36] | Retrospective cohort study | 187/181 | 27 ± 6/ 27 ± 6 | - | - | - | 38 ± 2/ 38 ± 2 | - | Patients: 7/187 Controls: 7/181 | - |
| la Cour Freiesleben et al., 2021 [37] | Retrospective case–control study | 18/100 | - | - | - | - | - | - | - | - |
| Smithgall et al., 2021 [38] | Retrospective cohort study | 51/25 | - | - | - | - | - | Patients: 10/51 Controls: 4/25 | - | - |
| Gulersen et al., 2021 [39] | Retrospective cohort study | 50/50 | - | - | Patients: 2/50 Controls: 8/50 | Patients: 0/50 Controls: 1/50 | - | - | - | - |
| Taglauer et al., 2021 [40] | Prospective cohort study | 15/10 | 32 ± 6/ 30 ± 6 | - | - | - | 38 ± 6/ 30 ± 6 | - | - | - |
| Donati et al., 2021 [41] | Prospective cohort study | 47/99 | - | - | Patients: 2/47 Controls: 4/99 | Patients: 4/47 Controls: 1/99 | - | Patients: 15/47 Controls: 13/99 | - | - |
| Study Name | Type of Study | Cambridge Quality Checklists | |||
|---|---|---|---|---|---|
| Checklist for Correlates | Checklist for Risk Factors | Checklist for Causal Risk Factors | Total Score | ||
| Glyn et al., 2022 [15] | Prospective cohort study | 2 | 3 | 5 | 10 |
| Lankford et al., 2021 [16] | Retrospective cohort study | 2 | 2 | 5 | 9 |
| Ruggiero et al., 2021 [17] | Prospective cohort study | 2 | 3 | 5 | 10 |
| DeSisto et al., 2021 [18] | Retrospective cohort study | 3 | 2 | 5 | 10 |
| Crovetto et al., 2021 [19] | Prospective cohort study | 2 | 3 | 5 | 10 |
| Brienet al., 2021 [20] | Prospective cohort study | 2 | 3 | 5 | 10 |
| Gurol-Urganci et al., 2021 [21] | Retrospective cohort study | 3 | 2 | 5 | 10 |
| Bertero et al., 2021 [22] | Prospective cohort study | 2 | 3 | 4 | 9 |
| Laresgoiti-Servitje et al., 2021 [23] | Retrospective cohort study | 2 | 2 | 5 | 9 |
| Januszewski et al., 2021 [24] | Retrospective cohort study | 3 | 2 | 5 | 10 |
| Wang et al., 2021 [43] | Retrospective cohort study | 2 | 2 | 5 | 9 |
| Maeda et al., 2021 [25] | Retrospective cohort study | 2 | 2 | 5 | 9 |
| Tasca et al., 2021 [26] | Prospective cohort study | 2 | 3 | 5 | 10 |
| Bortoletto et al., 2021 [27] | Cross-sectional survey | 2 | 1 | 5 | 8 |
| Levitan et al., 2021 [28] | Retrospective case–control study | 2 | 2 | 5 | 9 |
| Blasco Santana et al., 2021 [29] | Retrospective cohort study | 2 | 2 | 5 | 9 |
| Rebutini et al., 2021 [30] | Retrospective case–control study | 2 | 2 | 5 | 9 |
| Resta et al., 2021 [31] | Retrospective case–control study | 3 | 2 | 5 | 10 |
| Jaiswal et al., 2021 [32] | Prospective cohort study | 3 | 3 | 5 | 11 |
| Patberg et al., 2021 [33] | Retrospective cohort study | 3 | 2 | 5 | 10 |
| Cribiù et al., 2021 [34] | Prospective cohort study | 2 | 3 | 5 | 10 |
| Debelenko et al., 2021 [35] | Retrospective cohort study | 2 | 2 | 5 | 9 |
| Tadas et al., 2021 [36] | Retrospective cohort study | 2 | 2 | 5 | 9 |
| la Cour Freiesleben et al., 2021 [37] | Retrospective case–control study | 2 | 2 | 5 | 9 |
| Smithgall et al., 2021 [38] | Retrospective cohort study | 2 | 2 | 5 | 9 |
| Gulersen et al., 2021 [39] | Retrospective cohort study | 2 | 2 | 5 | 9 |
| Taglauer et al., 2021 [40] | Prospective cohort study | 3 | 3 | 5 | 11 |
| Donati et al., 2021 [41] | Prospective cohort study | 2 | 3 | 5 | 10 |
| Parameters | N° of Studies | Patients Included | SD in Means | CI 95% | OR | p-Value | Interpretation |
|---|---|---|---|---|---|---|---|
| Age | 12 | 1101 | 0.180 | −0.239; 0.599 | 0.4 | Non-significantly different | |
| BMI | 4 | 216 | 0.335 | −0.178; 0.848 | 0.2 | Non-significantly different | |
| Risk of diabetes | 16 | 1173 | 0.825; 1.309 | 1.039 | 0.7 | Non-significantly different | |
| Risk of hypertension | 16 | 1160 | 0.796; 1.353 | 1.038 | 0.8 | Non-significantly different | |
| Miscarriages | 4 | 602 | 0.364; 0.875 | 0.564 | 0.0 | Significantly lower in patients | |
| Chorioamnionitis | 9 | 376 | 0.579; 1.402 | 0.901 | 0.6 | Non-significantly different | |
| Birthweight | 9 | 756 | 0.079 | −0.003; 0.161 | 0.06 | Non-significantly different | |
| Small for gestational age | 8 | 4134 | 0.880; 1.149 | 1.0 | 0.9 | Non-significantly different | |
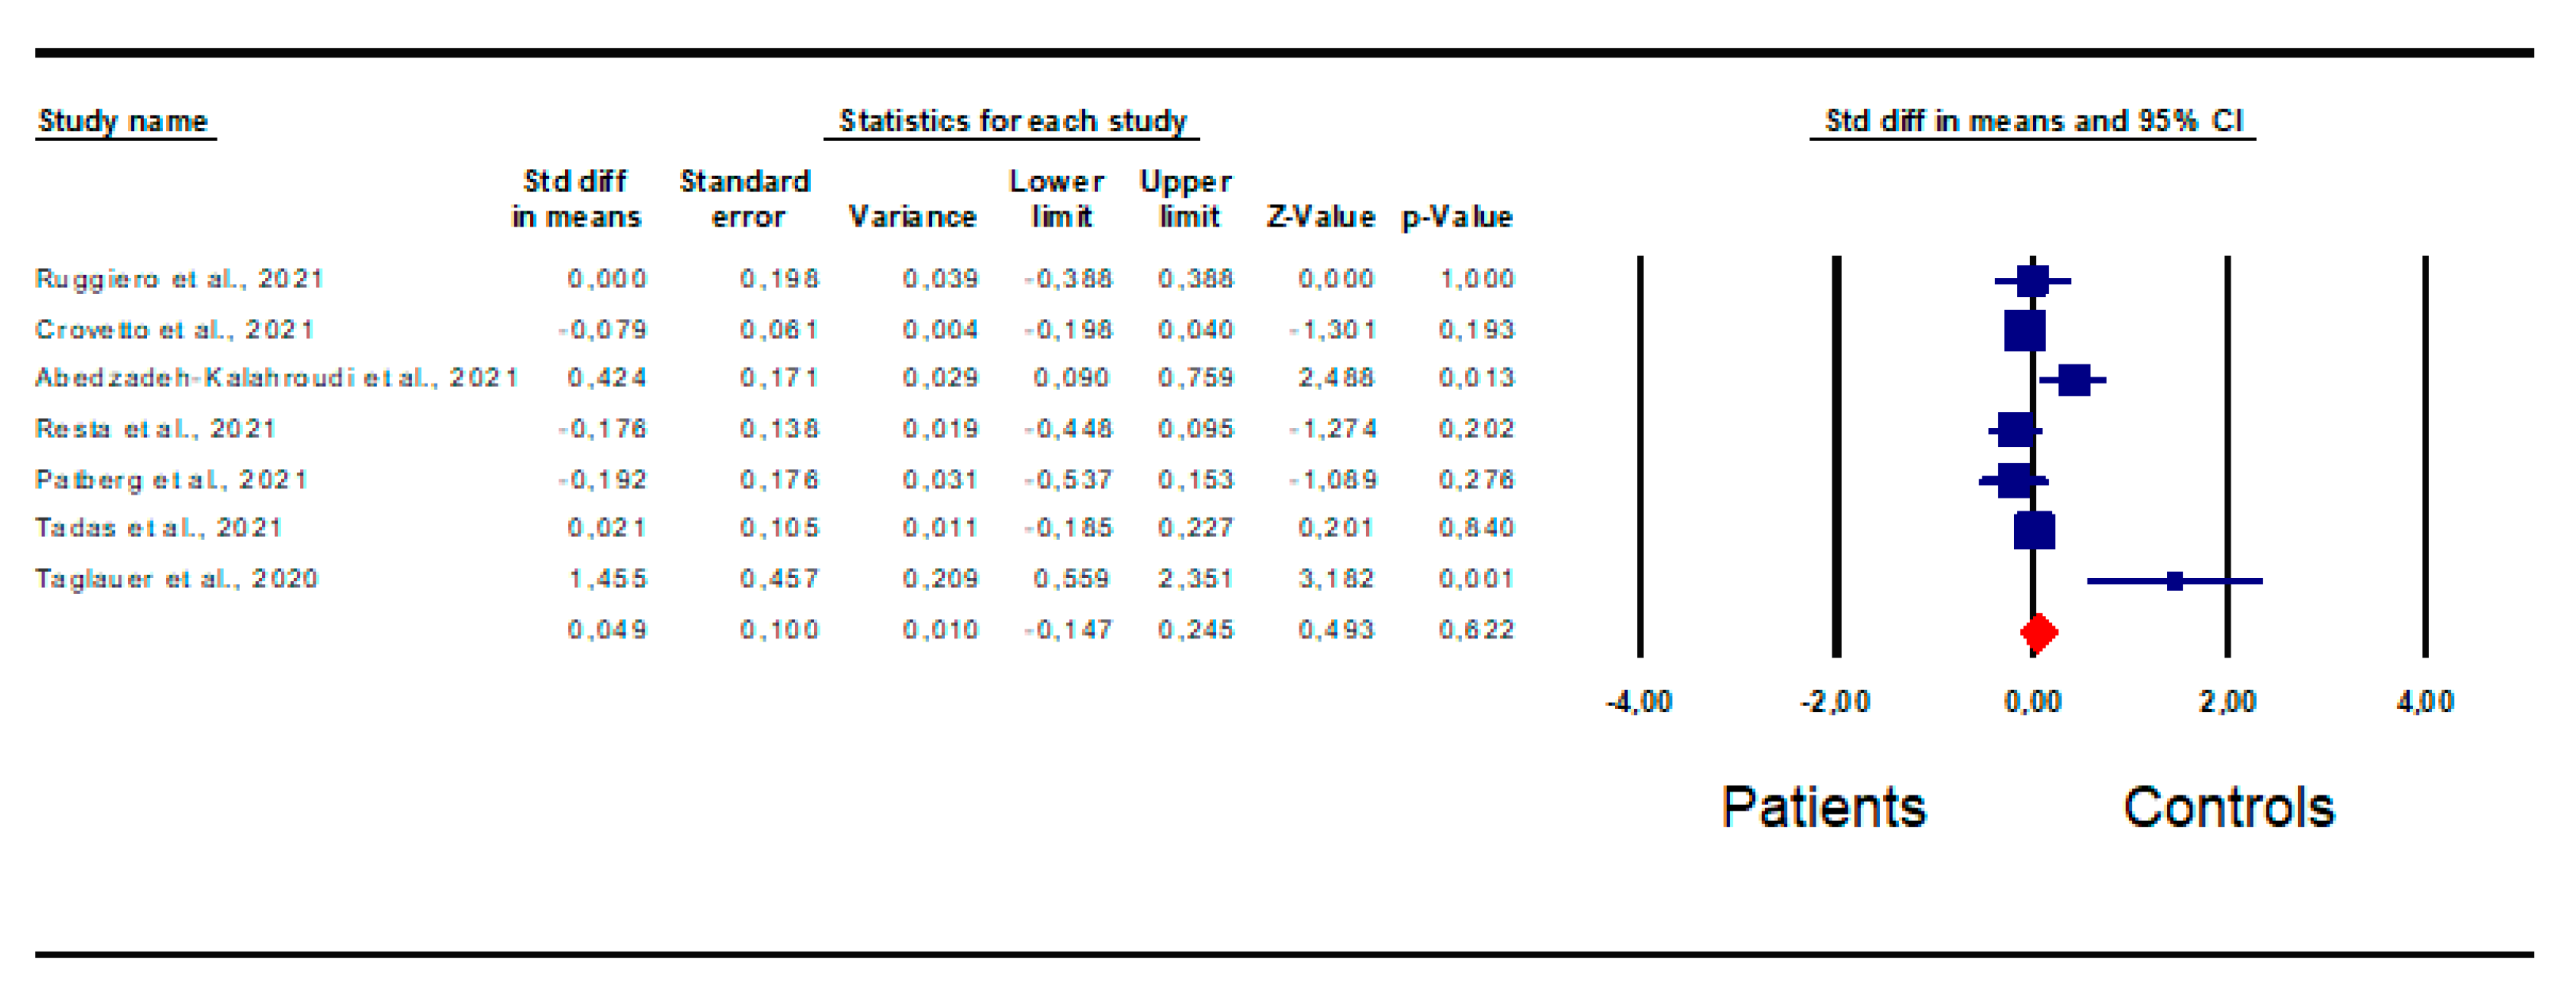
| Gestational age at delivery | 7 | 707 | 0.049 | −0.147; 0.245 | 0.62 | Non-significantly different | |
| Pre-term delivery | 12 | 4299 | 1.827; 2.228 | 2.017 | 0.0 | Significantly higher in patients | |
| Cesarean delivery | 18 | 4882 | 0.443; 0.902 | 0.632 | 0.0 | Significantly lower in patients | |
| Risk of fetal death | 8 | 26,345 | 1.783; 2.223 | 1.991 | 0.0 | Significantly higher in patients |
Disclaimer/Publisher’s Note: The statements, opinions and data contained in all publications are solely those of the individual author(s) and contributor(s) and not of MDPI and/or the editor(s). MDPI and/or the editor(s) disclaim responsibility for any injury to people or property resulting from any ideas, methods, instructions or products referred to in the content. |
© 2023 by the authors. Licensee MDPI, Basel, Switzerland. This article is an open access article distributed under the terms and conditions of the Creative Commons Attribution (CC BY) license (https://creativecommons.org/licenses/by/4.0/).
Share and Cite
Cannarella, R.; Kaiyal, R.S.; Marino, M.; La Vignera, S.; Calogero, A.E. Impact of COVID-19 on Fetal Outcomes in Pregnant Women: A Systematic Review and Meta-Analysis. J. Pers. Med. 2023, 13, 1337. https://doi.org/10.3390/jpm13091337
Cannarella R, Kaiyal RS, Marino M, La Vignera S, Calogero AE. Impact of COVID-19 on Fetal Outcomes in Pregnant Women: A Systematic Review and Meta-Analysis. Journal of Personalized Medicine. 2023; 13(9):1337. https://doi.org/10.3390/jpm13091337
Chicago/Turabian StyleCannarella, Rossella, Raneen Sawaid Kaiyal, Marta Marino, Sandro La Vignera, and Aldo E. Calogero. 2023. "Impact of COVID-19 on Fetal Outcomes in Pregnant Women: A Systematic Review and Meta-Analysis" Journal of Personalized Medicine 13, no. 9: 1337. https://doi.org/10.3390/jpm13091337