
Age and Sex-Related Effects on Single-Subject Gray Matter Networks in Healthy Participants
 , , , ,
Abstract
:1. Introduction
2. Materials and Methods
2.1. Participants
2.2. MRI Data Acquisition
2.3. MR Data Preprocessing and Brain Age Prediction
2.4. Brain Age Prediction
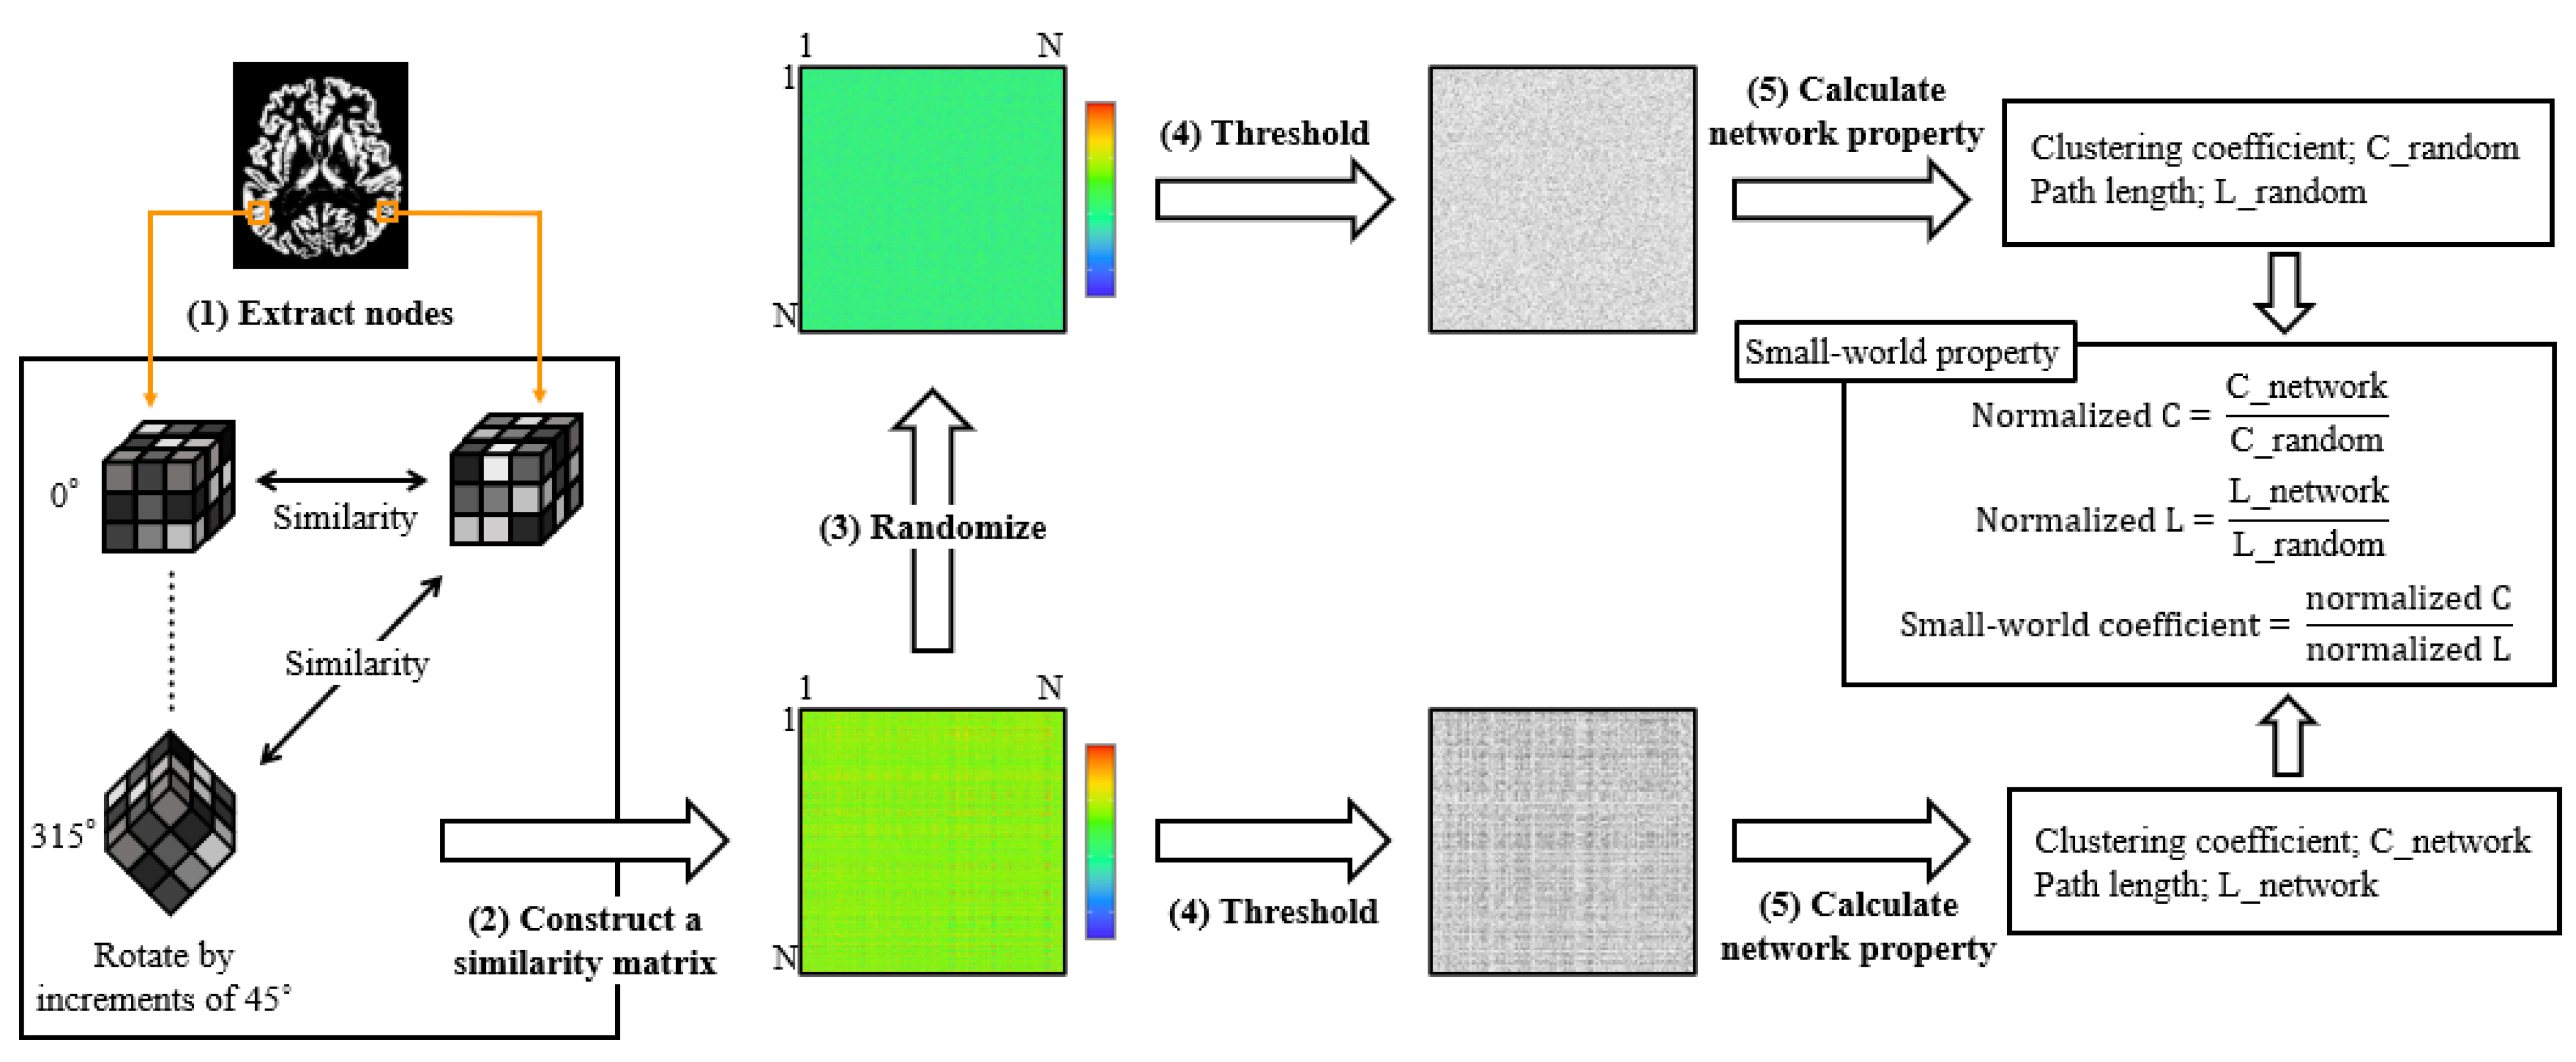
2.5. Single-Subject Gray Matter Network
2.6. Statistical Analysis
3. Results
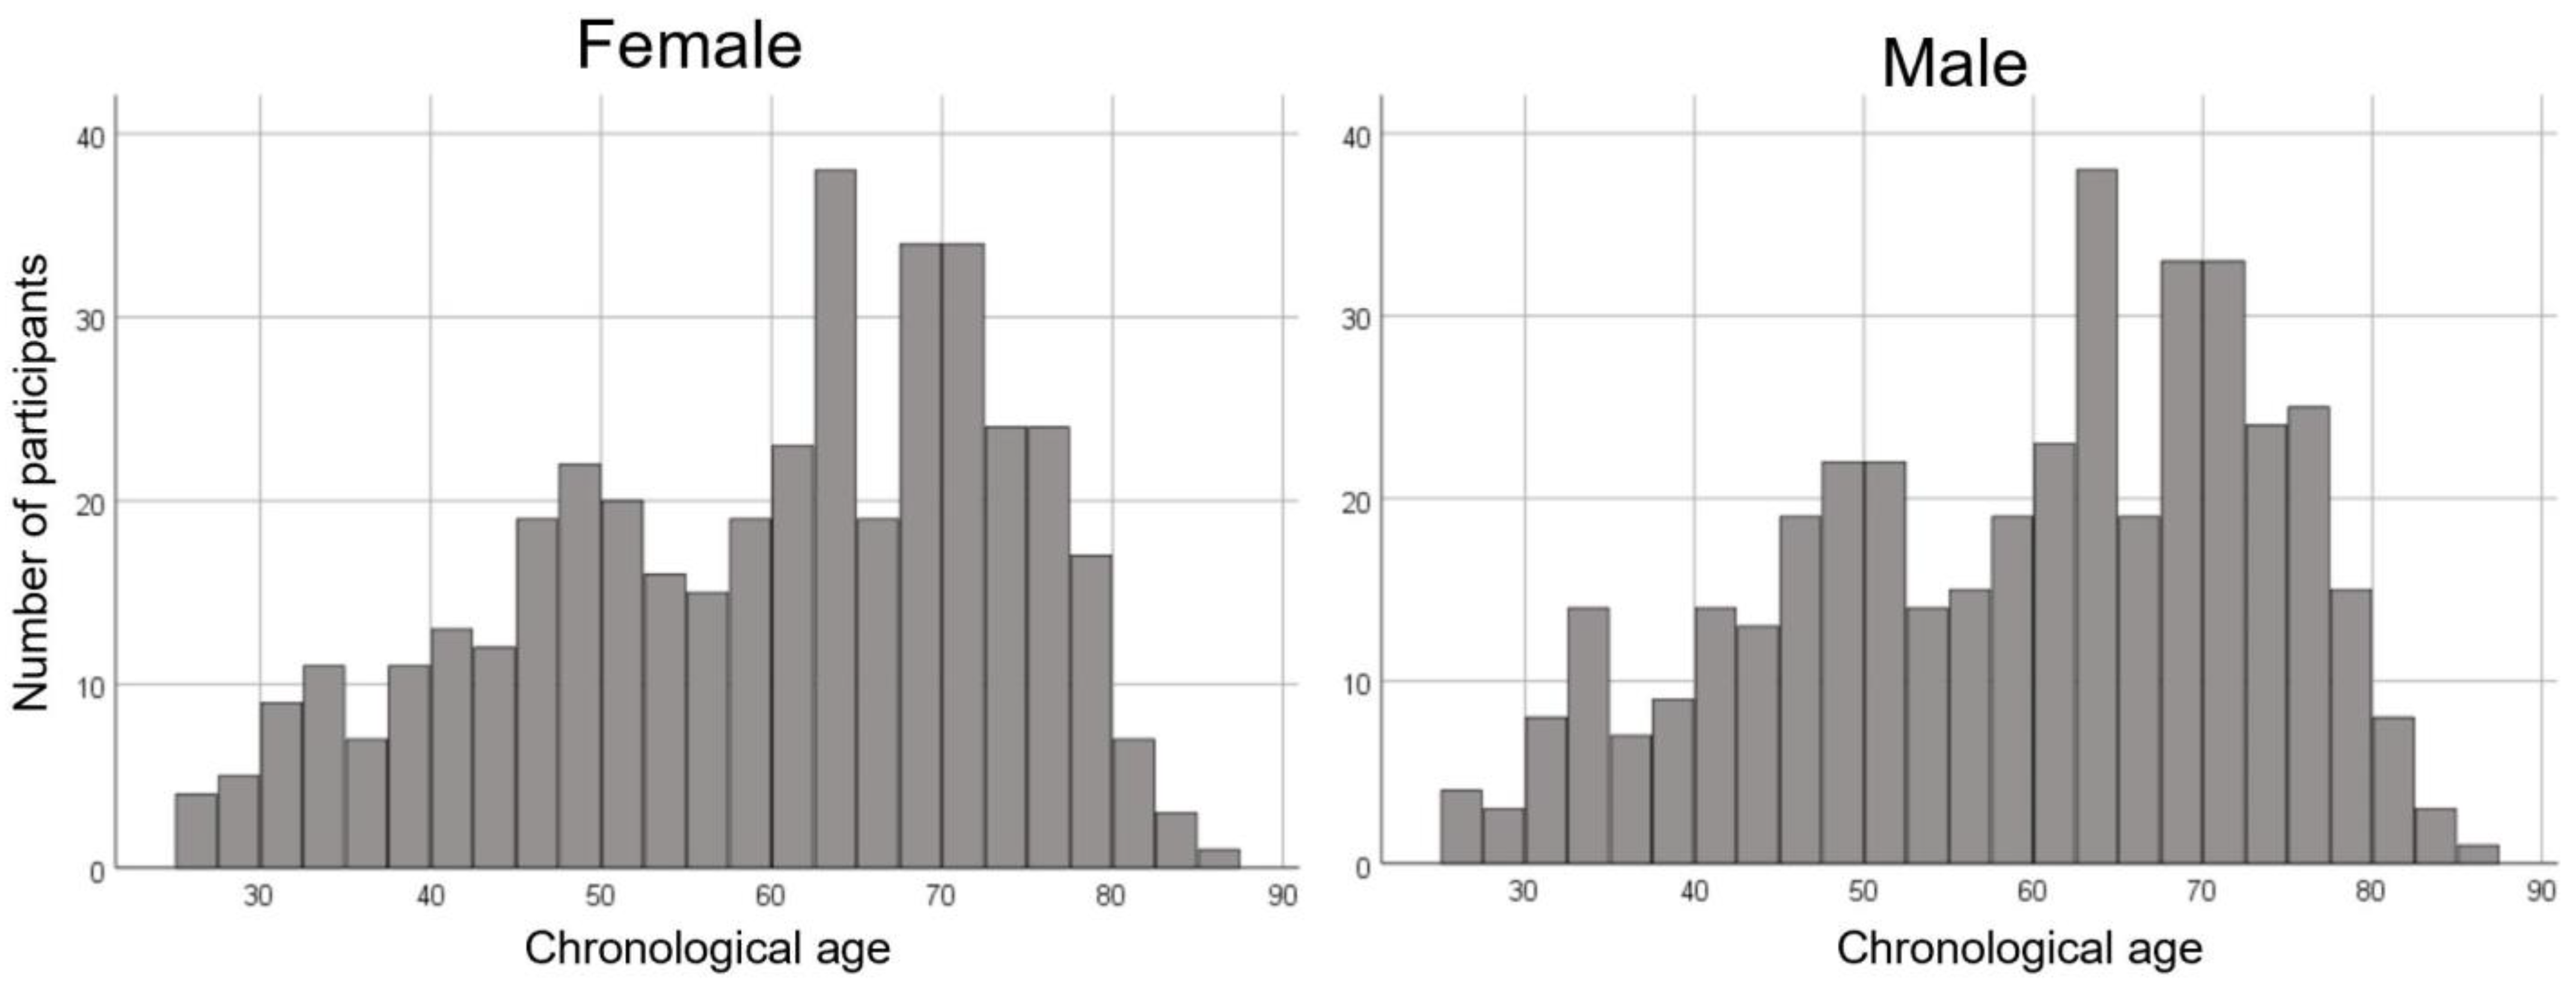
3.1. Demographics
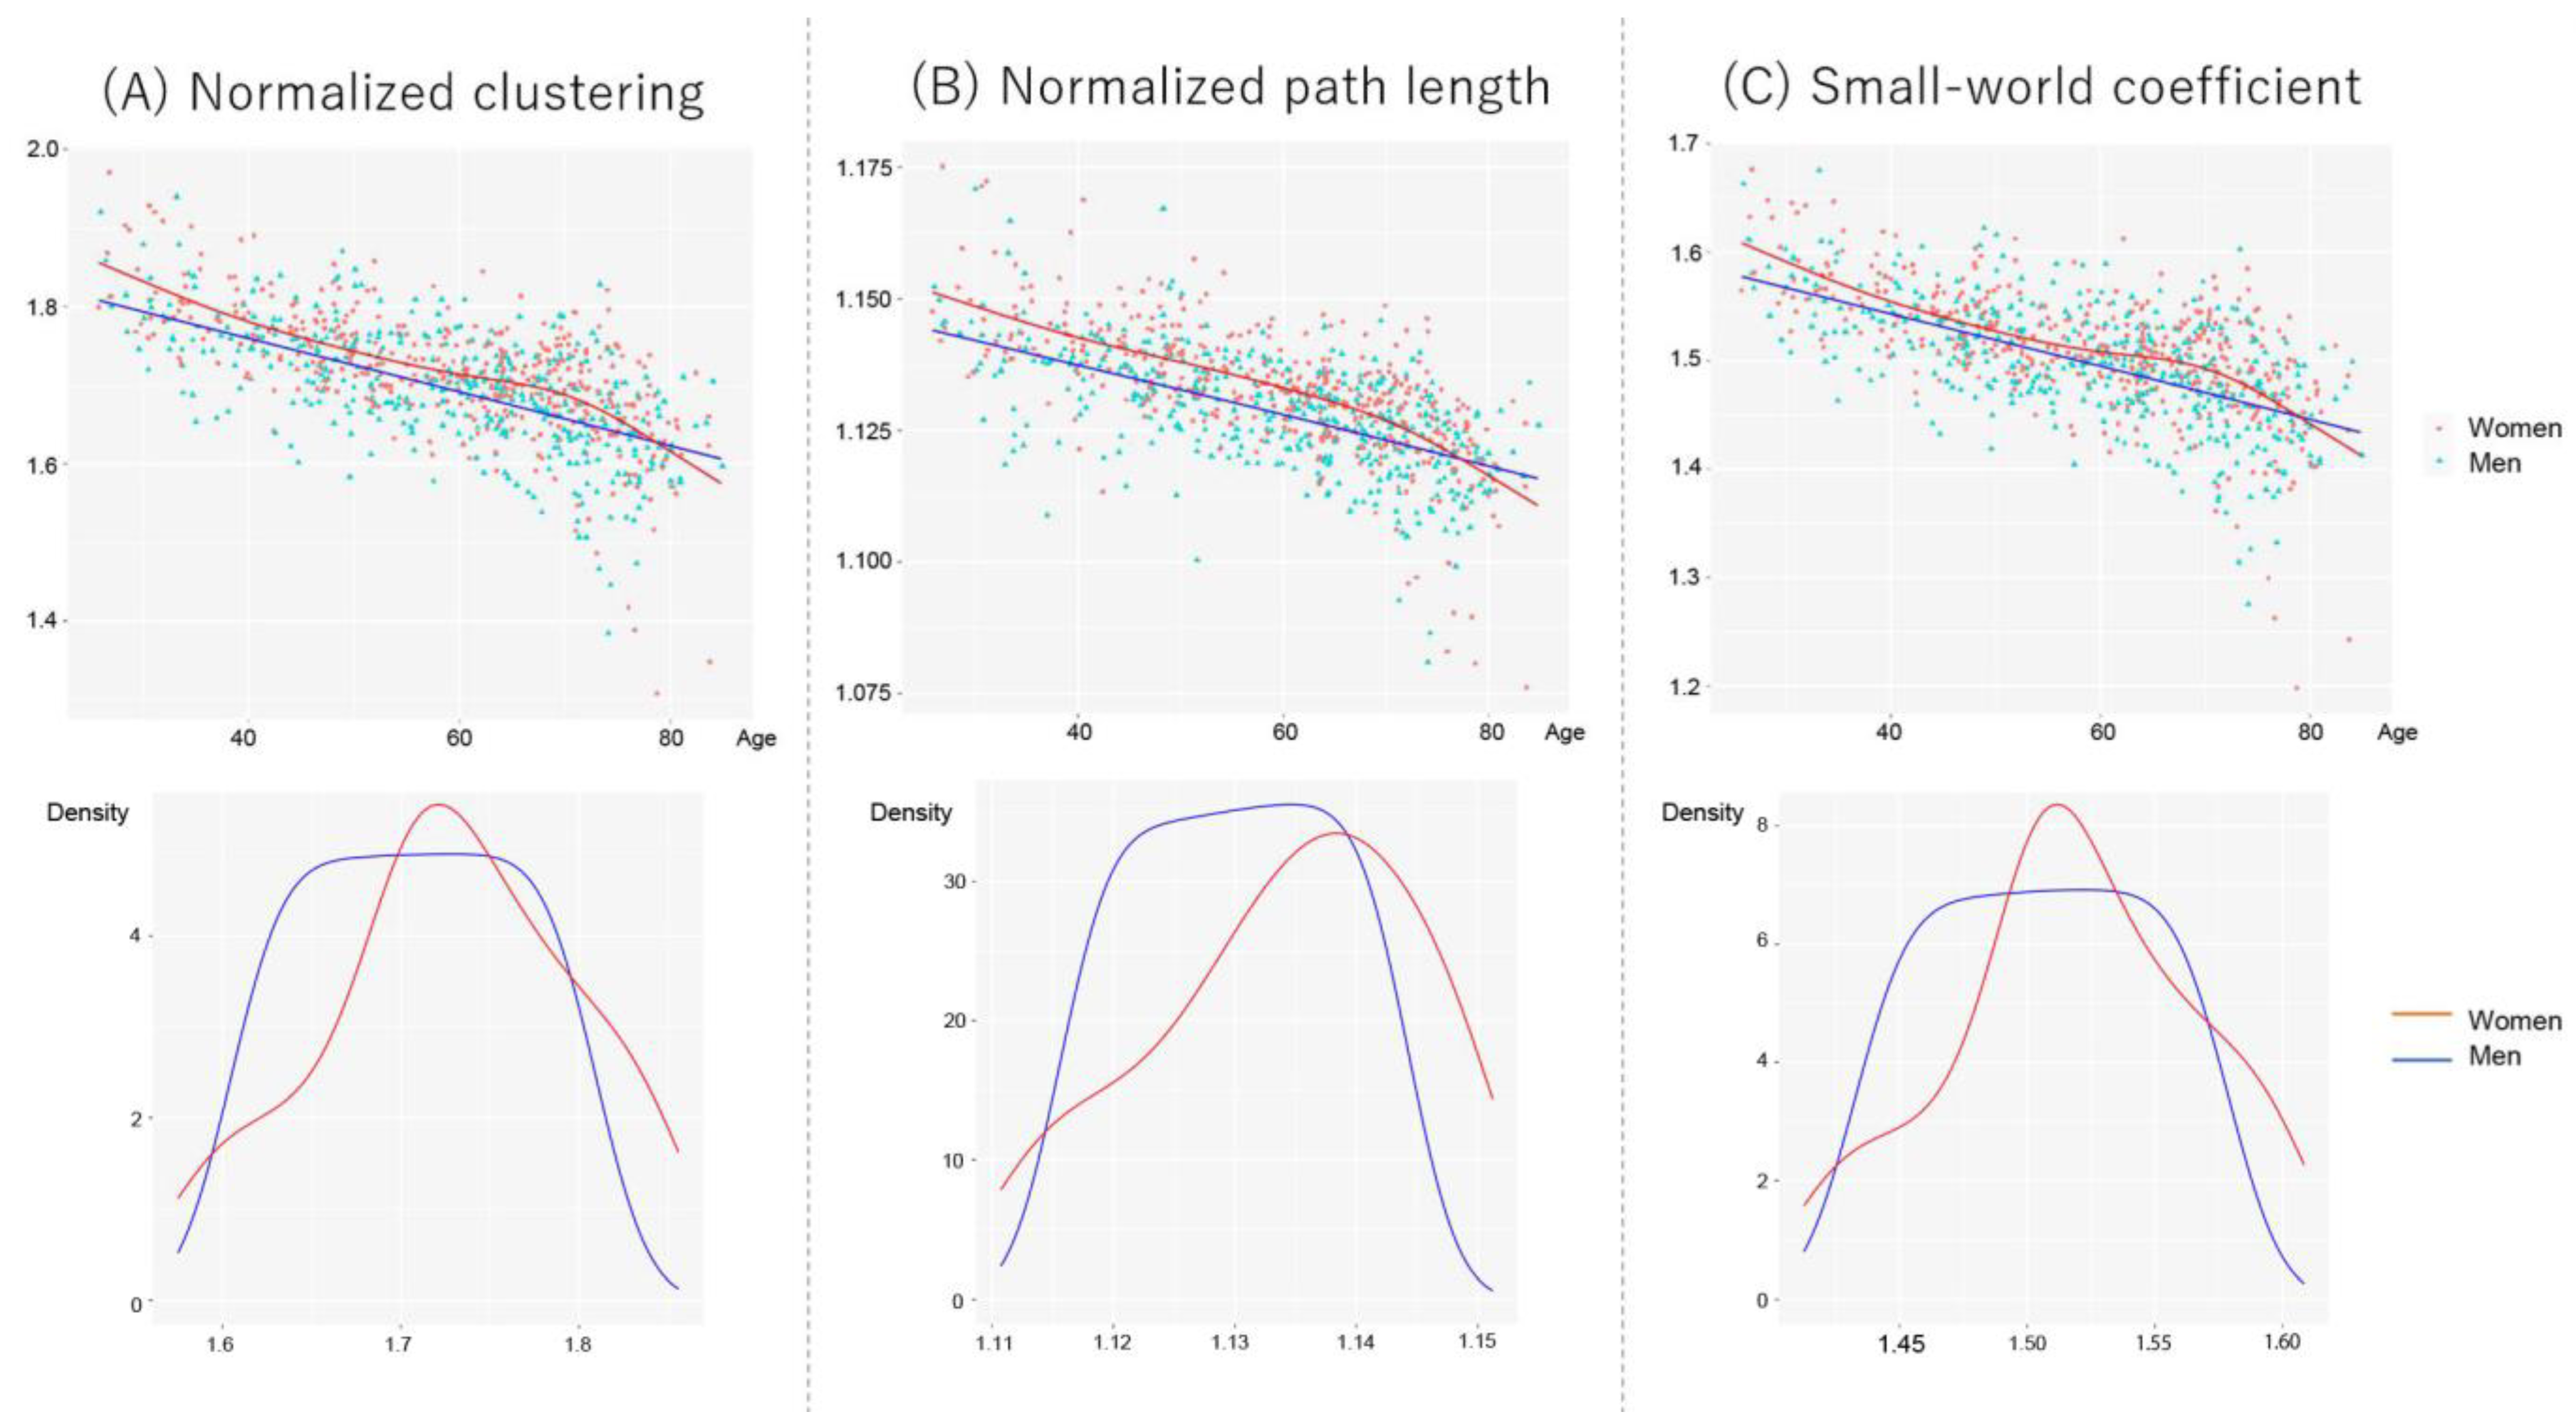
3.2. Age- and Sex-Related Alterations of Network Properties
3.3. Correlations between Global Network Properties and Chronological/Brain Age
4. Discussion
5. Conclusions
Author Contributions
Funding
Institutional Review Board Statement
Informed Consent Statement
Data Availability Statement
Acknowledgments
Conflicts of Interest
References
- Matsuda, H. Voxel-based morphometry of brain MRI in normal aging and Alzheimer’s disease. Aging Dis. 2013, 4, 29–37. [Google Scholar]
- Farokhian, F.; Yang, C.; Beheshti, I.; Matsuda, H.; Wu, S. Age-related gray and white matter changes in normal adult brains. Aging Dis. 2017, 8, 899–909. [Google Scholar] [CrossRef] [PubMed] [Green Version]
- Beheshti, I.; Maikusa, N.; Matsuda, H. Effects of aging on brain volumes in healthy individuals across adulthood. Neurol. Sci. 2019, 40, 1191–1198. [Google Scholar] [CrossRef]
- Fjell, A.M.; Westlye, L.T.; Amlien, I.; Espeseth, T.; Reinvang, I.; Raz, N.; Agartz, I.; Salat, D.H.; Greve, D.N.; Fischl, B.; et al. High consistency of regional cortical thinning in aging across multiple samples. Cereb. Cortex 2009, 19, 2001–2012. [Google Scholar] [CrossRef] [Green Version]
- Gong, G.; Rosa-Neto, P.; Carbonell, F.; Chen, Z.J.; He, Y.; Evans, A.C. Age- and gender-related differences in the cortical anatomical network. J. Neurosci. 2009, 29, 15684–15693. [Google Scholar] [CrossRef] [Green Version]
- Gaser, C.; Franke, K.; Klöppel, S.; Koutsouleris, N.; Sauer, H.; Alzheimer’s Disease Neuroimaging Initiative. BrainAGE in mild cognitive impaired patients: Predicting the conversion to Alzheimer’s disease. PLoS ONE 2013, 8, e67346. [Google Scholar] [CrossRef] [Green Version]
- Bassett, D.S.; Bullmore, E.; Verchinski, B.A.; Mattay, V.S.; Weinberger, D.R.; Meyer-Lindenberg, A. Hierarchical organization of human cortical networks in health and schizophrenia. J. Neurosci. 2008, 28, 9239–9248. [Google Scholar] [CrossRef] [PubMed] [Green Version]
- He, Y.; Chen, Z.J.; Evans, A.C. Small-world anatomical networks in the human brain revealed by cortical thickness from MRI. Cereb. Cortex. 2007, 17, 2407–2419. [Google Scholar] [CrossRef] [PubMed] [Green Version]
- Tijms, B.M.; Seriès, P.; Willshaw, D.J.; Lawrie, S.M. Similarity-based extraction of individual networks from gray matter MRI scans. Cereb. Cortex 2012, 22, 1530–1541. [Google Scholar] [CrossRef] [PubMed] [Green Version]
- Shigemoto, Y.; Sone, D.; Okita, K.; Maikusa, N.; Yamao, T.; Kimura, Y.; Suzuki, F.; Fujii, H.; Kato, K.; Sato, N.; et al. Gray matter structural networks related to 18F-THK5351 retention in cognitively normal older adults and Alzheimer’s disease patients. eNeurologicalSci 2021, 22, 100309. [Google Scholar] [CrossRef]
- Tijms, B.M.; Möller, C.; Vrenken, H.; Wink, A.M.; de Haan, W.; van der Flier, W.M.; Stam, C.J.; Scheltens, P.; Barkhof, F. Single-subject grey matter graphs in Alzheimer’s disease. PLoS ONE 2013, 8, e58921. [Google Scholar] [CrossRef]
- Shigemoto, Y.; Sato, N.; Sone, D.; Maikusa, N.; Yamao, T.; Kimura, Y.; Chiba, E.; Suzuki, F.; Fujii, H.; Takayama, Y.; et al. Single-subject gray matter networks in temporal lobe epilepsy patients with hippocampal sclerosis. Epilepsy Res. 2021, 177, 106766. [Google Scholar] [CrossRef] [PubMed]
- Ota, M.; Noda, T.; Sato, N.; Hidese, S.; Teraishi, T.; Matsuda, H.; Kunugi, H. Structural brain network differences in bipolar disorder using with similarity-based approach. Acta Neuropsychiatr. 2021, 33, 121–125. [Google Scholar] [CrossRef]
- Beheshti, I.; Mishra, S.; Sone, D.; Khanna, P.; Matsuda, H. T1-weighted MRI-driven brain age estimation in Alzheimer’s disease and Parkinson’s disease. Aging Dis. 2020, 11, 618–628. [Google Scholar] [CrossRef] [PubMed]
- Sone, D.; Beheshti, I.; Maikusa, N.; Ota, M.; Kimura, Y.; Sato, N.; Koepp, M.; Matsuda, H. Neuroimaging-based brain-age prediction in diverse forms of epilepsy: A signature of psychosis and beyond. Mol. Psychiatry 2021, 26, 825–834. [Google Scholar] [CrossRef] [Green Version]
- Watts, D.J.; Strogatz, S.H. Collective dynamics of “small-world” networks. Nature 1998, 393, 440–442. [Google Scholar] [CrossRef]
- Bassett, D.S.; Bullmore, E. Small-world brain networks. Neuroscientist 2006, 12, 512–523. [Google Scholar] [CrossRef]
- Lenhard, W.; Lenhard, A. Hypothesis tests for comparing correlations. Bibergau (Ger.) Psychom. 2014. Available online: https://www.psychometrica.de/correlation.html (accessed on 10 July 2022). [CrossRef]
- Achard, S.; Bullmore, E. Efficiency and cost of economical brain functional networks. PLOS Comput. Biol. 2007, 3, e17. [Google Scholar] [CrossRef]
- Latora, V.; Marchiori, M. Efficient behavior of small-world networks. Phys. Rev. Lett. 2001, 87, 198701. [Google Scholar] [CrossRef] [Green Version]
- Wu, K.; Taki, Y.; Sato, K.; Kinomura, S.; Goto, R.; Okada, K.; Kawashima, R.; He, Y.; Evans, A.C.; Fukuda, H. Age-related changes in topological organization of structural brain networks in healthy individuals. Hum. Brain Mapp. 2012, 33, 552–568. [Google Scholar] [CrossRef]
- Verfaillie, S.C.J.; Slot, R.E.R.; Dicks, E.; Prins, N.D.; Overbeek, J.M.; Teunissen, C.E.; Scheltens, P.; Barkhof, F.; van der Flier, W.M.; Tijms, B.M. A more randomly organized grey matter network is associated with deteriorating language and global cognition in individuals with subjective cognitive decline. Hum. Brain Mapp. 2018, 39, 3143–3151. [Google Scholar] [CrossRef] [PubMed] [Green Version]
- Tijms, B.M.; Ten Kate, M.; Gouw, A.A.; Borta, A.; Verfaillie, S.; Teunissen, C.E.; Scheltens, P.; Barkhof, F.; van der Flier, W.M. Gray matter networks and clinical progression in subjects with predementia Alzheimer’s disease. Neurobiol. Aging. 2018, 61, 75–81. [Google Scholar] [CrossRef] [PubMed]
- Vermunt, L.; Dicks, E.; Wang, G.; Dincer, A.; Flores, S.; Keefe, S.J.; Berman, S.B.; Cash, D.M.; Chhatwal, J.P.; Cruchaga, C.; et al. Single-subject grey matter network trajectories over the disease course of autosomal dominant Alzheimer’s disease. Brain Commun. 2020, 2, fcaa102. [Google Scholar] [CrossRef]
- Yan, C.; Gong, G.; Wang, J.; Wang, D.; Liu, D.; Zhu, C.; Chen, Z.J.; Evans, A.; Zang, Y.; He, Y. Sex- and brain size-related small-world structural cortical networks in young adults: A DTI tractography study. Cereb. Cortex. 2011, 21, 449–458. [Google Scholar] [CrossRef] [Green Version]
- Allen, J.S.; Damasio, H.; Grabowski, T.J.; Bruss, J.; Zhang, W. Sexual dimorphism and asymmetries in the gray-white composition of the human cerebrum. Neuroimage 2003, 18, 880–894. [Google Scholar] [CrossRef]
- Smith, Y.R.; Zubieta, J.K. Neuroimaging of aging and estrogen effects on central nervous system physiology. Fertil. Steril. 2001, 76, 651–659. [Google Scholar] [CrossRef] [PubMed]
- Norbury, R.; Cutter, W.J.; Compton, J.; Robertson, D.M.; Craig, M.; Whitehead, M.; Murphy, D.G. The neuroprotective effects of estrogen on the aging brain. Exp. Gerontol. 2003, 38, 109–117. [Google Scholar] [CrossRef]
- Sherwin, B.B.; Henry, J.F. Brain aging modulates the neuroprotective effects of estrogen on selective aspects of cognition in women: A critical review. Front. Neuroendocrinol. 2008, 29, 88–113. [Google Scholar] [CrossRef]
- Wise, P.M. Estrogen therapy: Does it help or hurt the adult and aging brain? Insights derived from animal models. Neuroscience 2006, 138, 831–835. [Google Scholar] [CrossRef]
- Cook, I.A.; Morgan, M.L.; Dunkin, J.J.; David, S.; Witte, E.; Lufkin, R.; Abrams, M.; Rosenberg, S.; Leuchter, A.F. Estrogen replacement therapy is associated with less progression of subclinical structural brain disease in normal elderly women: A pilot study. Int. J. Geriatr. Psychiatry 2002, 17, 610–618. [Google Scholar] [CrossRef]
- Ottowitz, W.E.; Derro, D.; Dougherty, D.D.; Lindquist, M.A.; Fischman, A.J.; Hall, J.E. FDG-PET analysis of amygdalar–cortical network covariance during pre-versus post-menopausal estrogen levels: Potential relevance to resting state networks, mood, and cognition. Neuro Endocrinol. Lett. 2009, 29, 467–474. [Google Scholar]
- Ottowitz, W.E.; Siedlecki, K.L.; Lindquist, M.A.; Dougherty, D.D.; Fischman, A.J.; Hall, J.E. Evaluation of prefrontal–hippocampal effective connectivity following 24 hours of estrogen infusion: An FDG-PET study. Psychoneuroendocrinology 2008, 33, 1419–1425. [Google Scholar] [CrossRef] [PubMed] [Green Version]
- Nelson, H.D. Menopause. Lancet 2008, 371, 760–770. [Google Scholar] [CrossRef] [PubMed]
- Sundermann, E.E.; Maki, P.M.; Rubin, L.H.; Lipton, R.B.; Landau, S.; Biegon, A.; Alzheimer’s Disease Neuroimaging Initiative. Female advantage in verbal memory: Evidence of sex-specific cognitive reserve. Neurology 2016, 87, 1916–1924. [Google Scholar] [CrossRef] [PubMed] [Green Version]
- Nebel, R.A.; Aggarwal, N.T.; Barnes, L.L.; Gallagher, A.; Goldstein, J.M.; Kantarci, K.; Mallampalli, M.P.; Mormino, E.C.; Scott, L.; Yu, W.H.; et al. Understanding the impact of sex and gender in Alzheimer’s disease: A call to action. Alzheimers Dement. 2018, 14, 1171–1183. [Google Scholar] [CrossRef]
- Sone, D.; Beheshti, I.; Shinagawa, S.; Niimura, H.; Kobayashi, N.; Kida, H.; Shikimoto, R.; Noda, Y.; Nakajima, S.; Bun, S.; et al. Neuroimaging-derived brain age is associated with life satisfaction in cognitively unimpaired elderly: A community-based study. Transl. Psychiatry 2022, 12, 25. [Google Scholar] [CrossRef] [PubMed]
- Kharabian Masouleh, S.; Beyer, F.; Lampe, L.; Loeffler, M.; Luck, T.; Riedel-Heller, S.G.; Schroeter, M.L.; Stumvoll, M.; Villringer, A.; Witte, A.V. Gray matter structural networks are associated with cardiovascular risk factors in healthy older adults. J. Cereb. Blood Flow Metab. 2018, 38, 360–372. [Google Scholar] [CrossRef] [Green Version]


| Characteristic | Women | Men | p-Value |
|---|---|---|---|
| Participants, N | 407 (50.1%) | 405 (49.9%) | |
| Age, y | |||
| Chronological age | 59.272 ± 13.990 | 59.245 ± 13.970 | 0.964 a |
| Predicted brain age | 59.019 ± 15.234 | 58.490 ± 16.186 | 0.923 a |
| Brain PAD score | −0.254 ± 5.413 | −0.755 ± 5.156 | 0.139 a |
| Network measures | |||
| Normalized clustering | 1.729 ± 0.086 | 1.711 ± 0.078 | <0.0001 b |
| Normalized path length | 1.112 ± 0.016 | 1.106 ± 0.015 | <0.0001 b |
| Small-world coefficient | 1.554 ± 0.059 | 1.546 ± 0.056 | 0.012 b |
| Variables | Unstandardized β | Standard Error | Standardized β | p-Value |
|---|---|---|---|---|
| Chronological age < 70 y | ||||
| Normalized clustering | ||||
| Age × female (sex) interaction | <−0.001 | 0.051 | −0.045 | 0.214 |
| Age effect | −0.003 | 0.037 | −0.580 | <0.001 |
| Female (sex) effect | 0.051 | 0.065 | 0.269 | 0.012 |
| Normalized path length | ||||
| Age × female (sex) interaction | <−0.001 | 0.041 | −0.112 | 0.040 |
| Age effect | <−0.001 | 0.030 | −0.423 | <0.001 |
| Female (sex) effect | 0.012 | 0.052 | 0.262 | <0.001 |
| Small-world coefficient | ||||
| Age × female (sex) interaction | <−0.001 | 0.054 | −0.014 | 0.416 |
| Age effect | −0.002 | 0.039 | −0.589 | <0.001 |
| Female (sex) effect | 0.028 | 0.069 | 0.243 | 0.05 |
| Chronological age ≥ 70 y | ||||
| Normalized clustering | ||||
| Age × female (sex) interaction | −0.008 | 0.517 | −1.363 | 0.009 |
| Age effect | 0.609 | 0.603 | 1.638 | 0.412 |
| Female (sex) effect | −0.002 | 0.363 | −0.298 | 0.008 |
| Normalized path length | ||||
| Age × female (sex) interaction | −0.001 | 0.391 | −1.223 | 0.002 |
| Age effect | <−0.001 | 0.274 | −0.162 | 0.555 |
| Female (sex) effect | 0.103 | 0.456 | 1.425 | 0.002 |
| Small-world coefficient | ||||
| Age × female (sex) interaction | −0.006 | 0.555 | −1.347 | 0.016 |
| Age effect | −0.001 | 0.389 | −0.320 | 0.412 |
| Female (sex) effect | 0.421 | 0.647 | 1.622 | 0.015 |
| Variables | Women | Men | p-Value |
|---|---|---|---|
| Chronological age < 70 yrs | |||
| Normalized clustering | 1.756 ± 0.003 | 1.730 ± 0.003 | <0.001 |
| Normalized path length | 1.115 ± 0.001 | 1.110 ± 0.001 | <0.001 |
| Small-world coefficient | 1.575 ± 0.002 | 1.558 ± 0.002 | <0.001 |
| Chronological age ≥ 70 yrs | |||
| Normalized clustering | 1.661 ± 0.009 | 1.655 ± 0.009 | 0.679 |
| Normalized path length | 1.100 ± 0.001 | 1.100 ± 0.001 | 0.873 |
| Small-world coefficient | 1.508 ± 0.007 | 1.504 ± 0.007 | 0.692 |
| Chronological Age | Predicted Brain Age | Comparisons of Correlations * | |||
|---|---|---|---|---|---|
| r | p-Value | r | p-Value | p-Value | |
| <70 yrs | |||||
| Normalized clustering | −0.551 | <0.0001 | −0.590 | <0.0001 | 0.16 |
| Normalized path length | −0.524 | <0.0001 | −0.573 | <0.0001 | 0.114 |
| Small-world coefficient | −0.526 | <0.0001 | −0.556 | <0.0001 | 0.233 |
| ≥70 yrs | |||||
| Normalized clustering | −0.282 | <0.0001 | −0.628 | <0.0001 | <0.0001 |
| Normalized path length | −0.269 | <0.0001 | −0.604 | <0.0001 | <0.0001 |
| Small-world coefficient | −0.275 | <0.0001 | −0.612 | <0.0001 | <0.0001 |
Disclaimer/Publisher’s Note: The statements, opinions and data contained in all publications are solely those of the individual author(s) and contributor(s) and not of MDPI and/or the editor(s). MDPI and/or the editor(s) disclaim responsibility for any injury to people or property resulting from any ideas, methods, instructions or products referred to in the content. |
© 2023 by the authors. Licensee MDPI, Basel, Switzerland. This article is an open access article distributed under the terms and conditions of the Creative Commons Attribution (CC BY) license (https://creativecommons.org/licenses/by/4.0/).
Share and Cite
Shigemoto, Y.; Sato, N.; Maikusa, N.; Sone, D.; Ota, M.; Kimura, Y.; Chiba, E.; Okita, K.; Yamao, T.; Nakaya, M.; et al. Age and Sex-Related Effects on Single-Subject Gray Matter Networks in Healthy Participants. J. Pers. Med. 2023, 13, 419. https://doi.org/10.3390/jpm13030419
Shigemoto Y, Sato N, Maikusa N, Sone D, Ota M, Kimura Y, Chiba E, Okita K, Yamao T, Nakaya M, et al. Age and Sex-Related Effects on Single-Subject Gray Matter Networks in Healthy Participants. Journal of Personalized Medicine. 2023; 13(3):419. https://doi.org/10.3390/jpm13030419
Chicago/Turabian StyleShigemoto, Yoko, Noriko Sato, Norihide Maikusa, Daichi Sone, Miho Ota, Yukio Kimura, Emiko Chiba, Kyoji Okita, Tensho Yamao, Moto Nakaya, and et al. 2023. "Age and Sex-Related Effects on Single-Subject Gray Matter Networks in Healthy Participants" Journal of Personalized Medicine 13, no. 3: 419. https://doi.org/10.3390/jpm13030419