

Clinical Relevance of a Vancomycin 24 h Area under the Concentration—Time Curve Values Using Different Renal Function Equations in Bayesian Dosing Software

Abstract
:1. Introduction
2. Materials and Methods
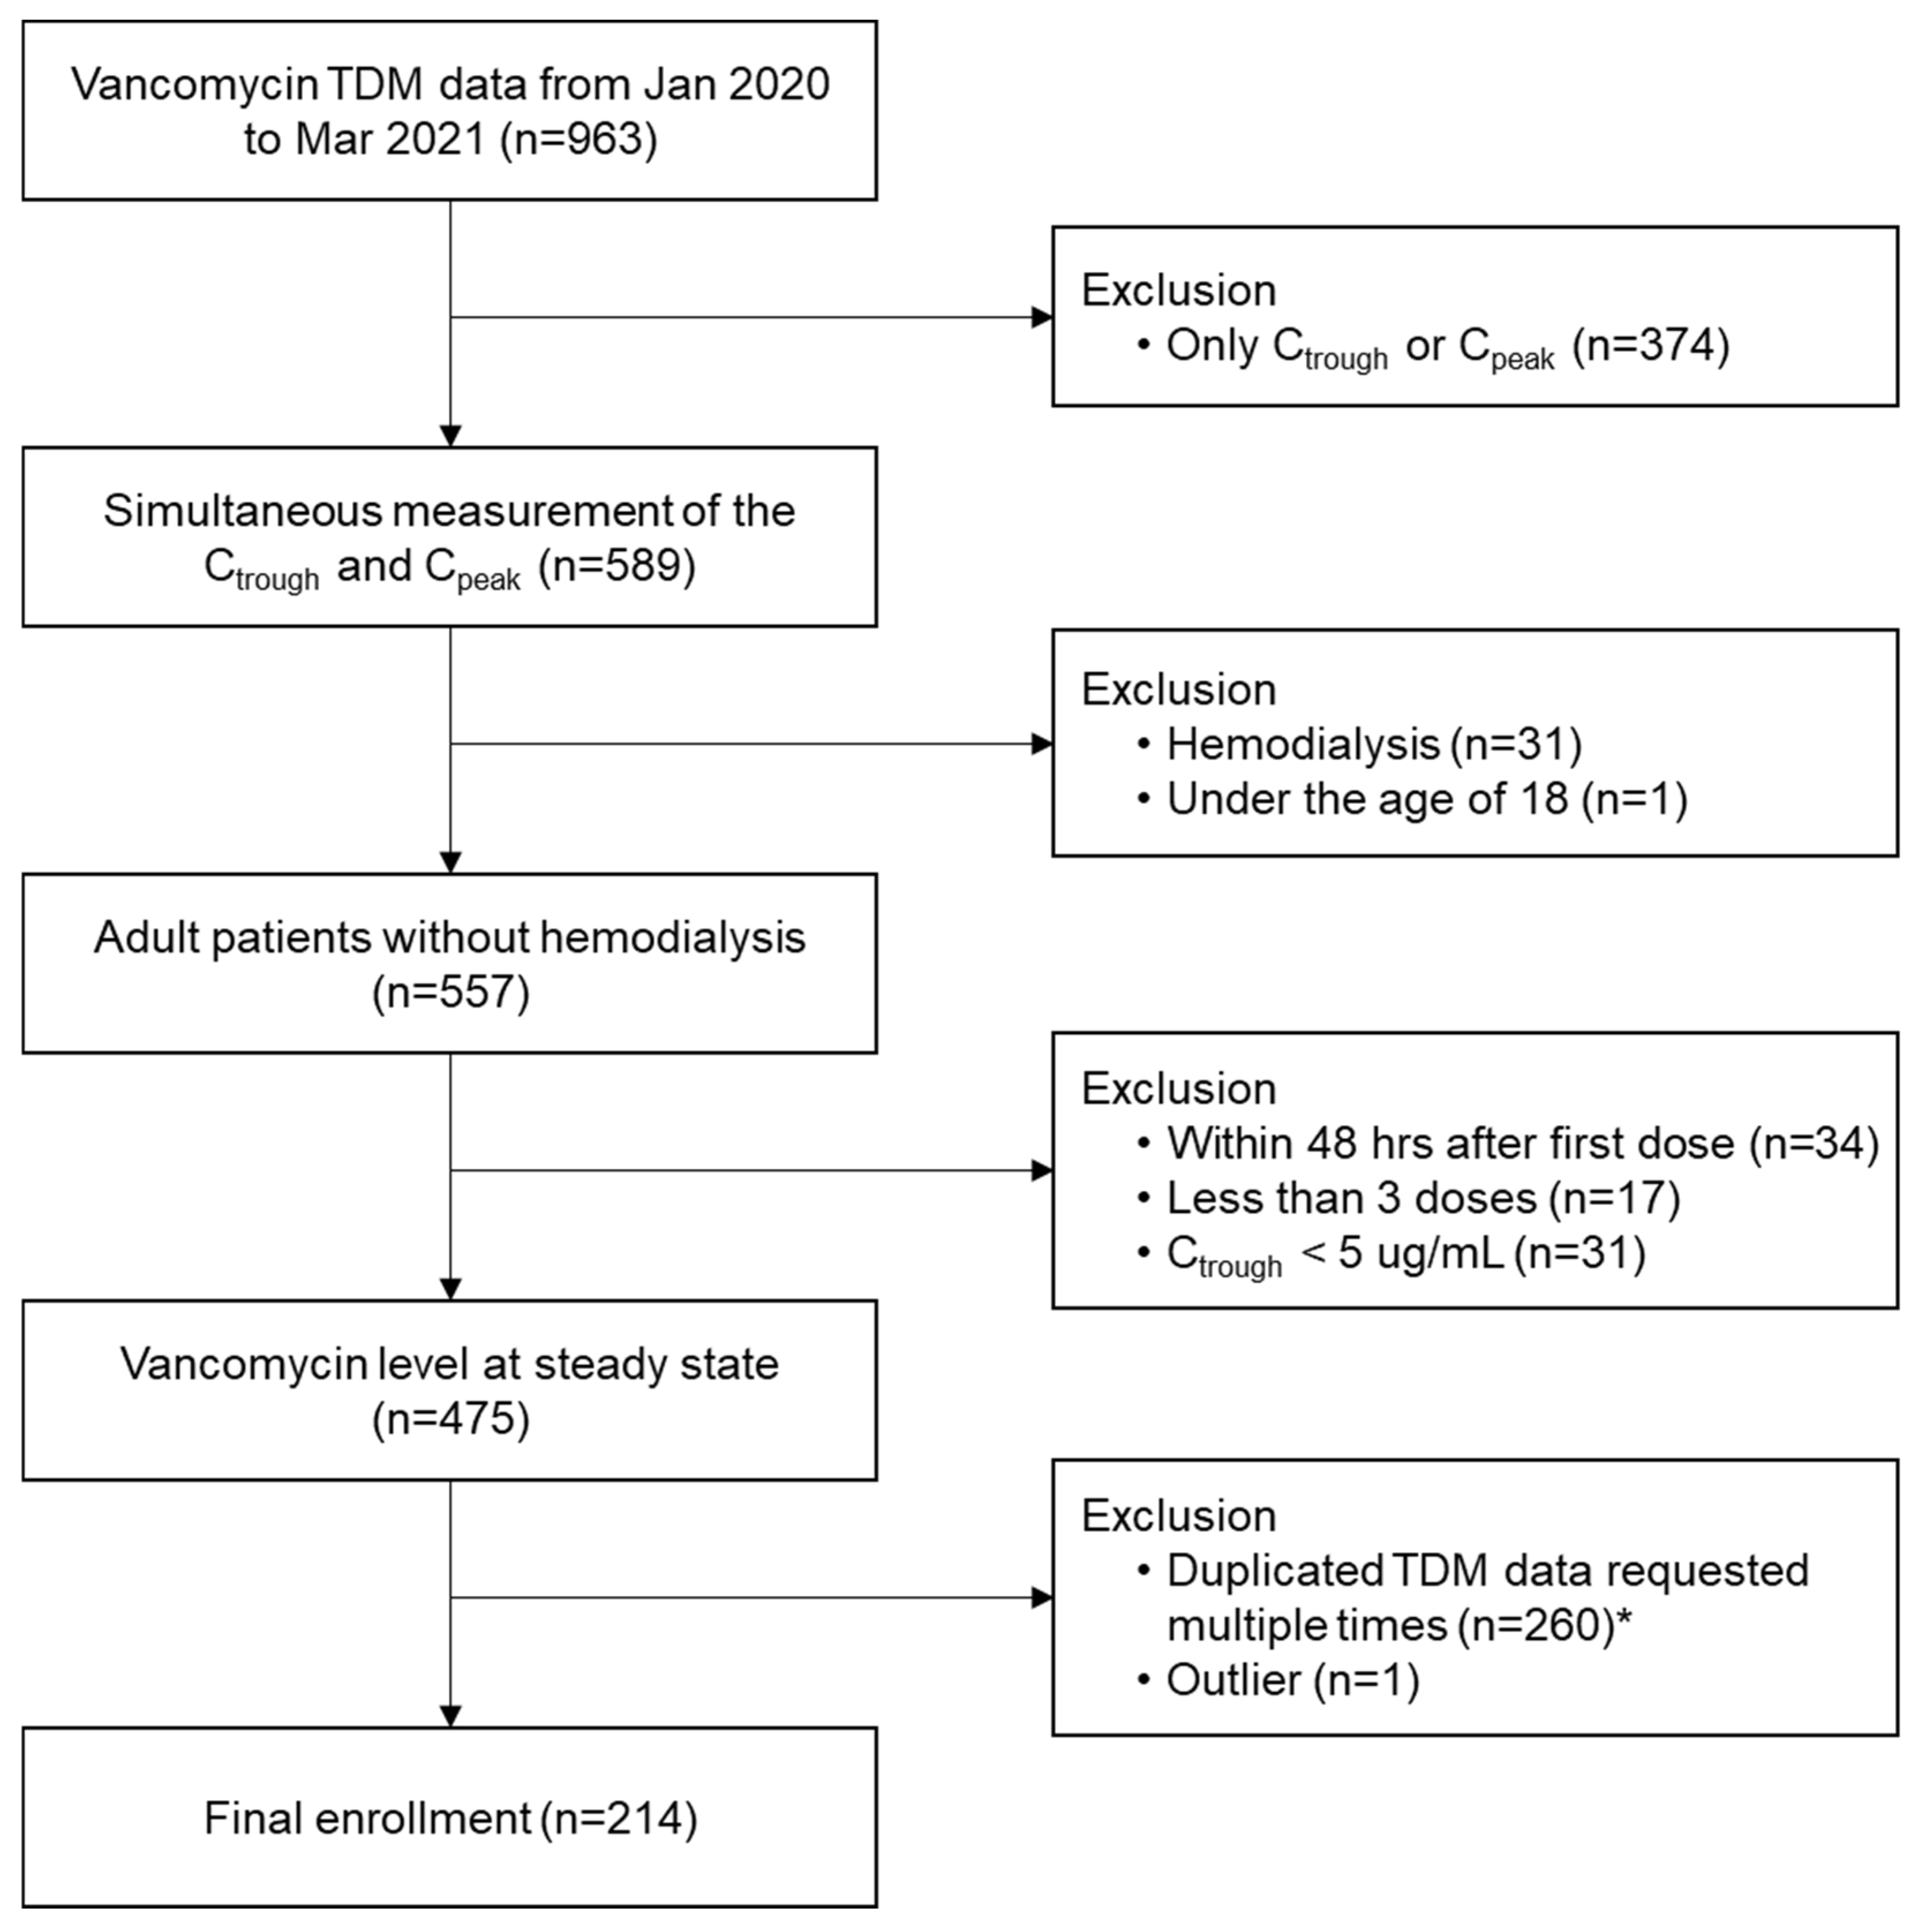
2.1. Study Subjects and Data Collection
2.2. Serum Vancomycin Concentration Measurements
2.3. TDM Analysis Tool and Calculation of eGFR
2.4. Statistical Analysis
3. Results
3.1. Characteristics of Study Subjects
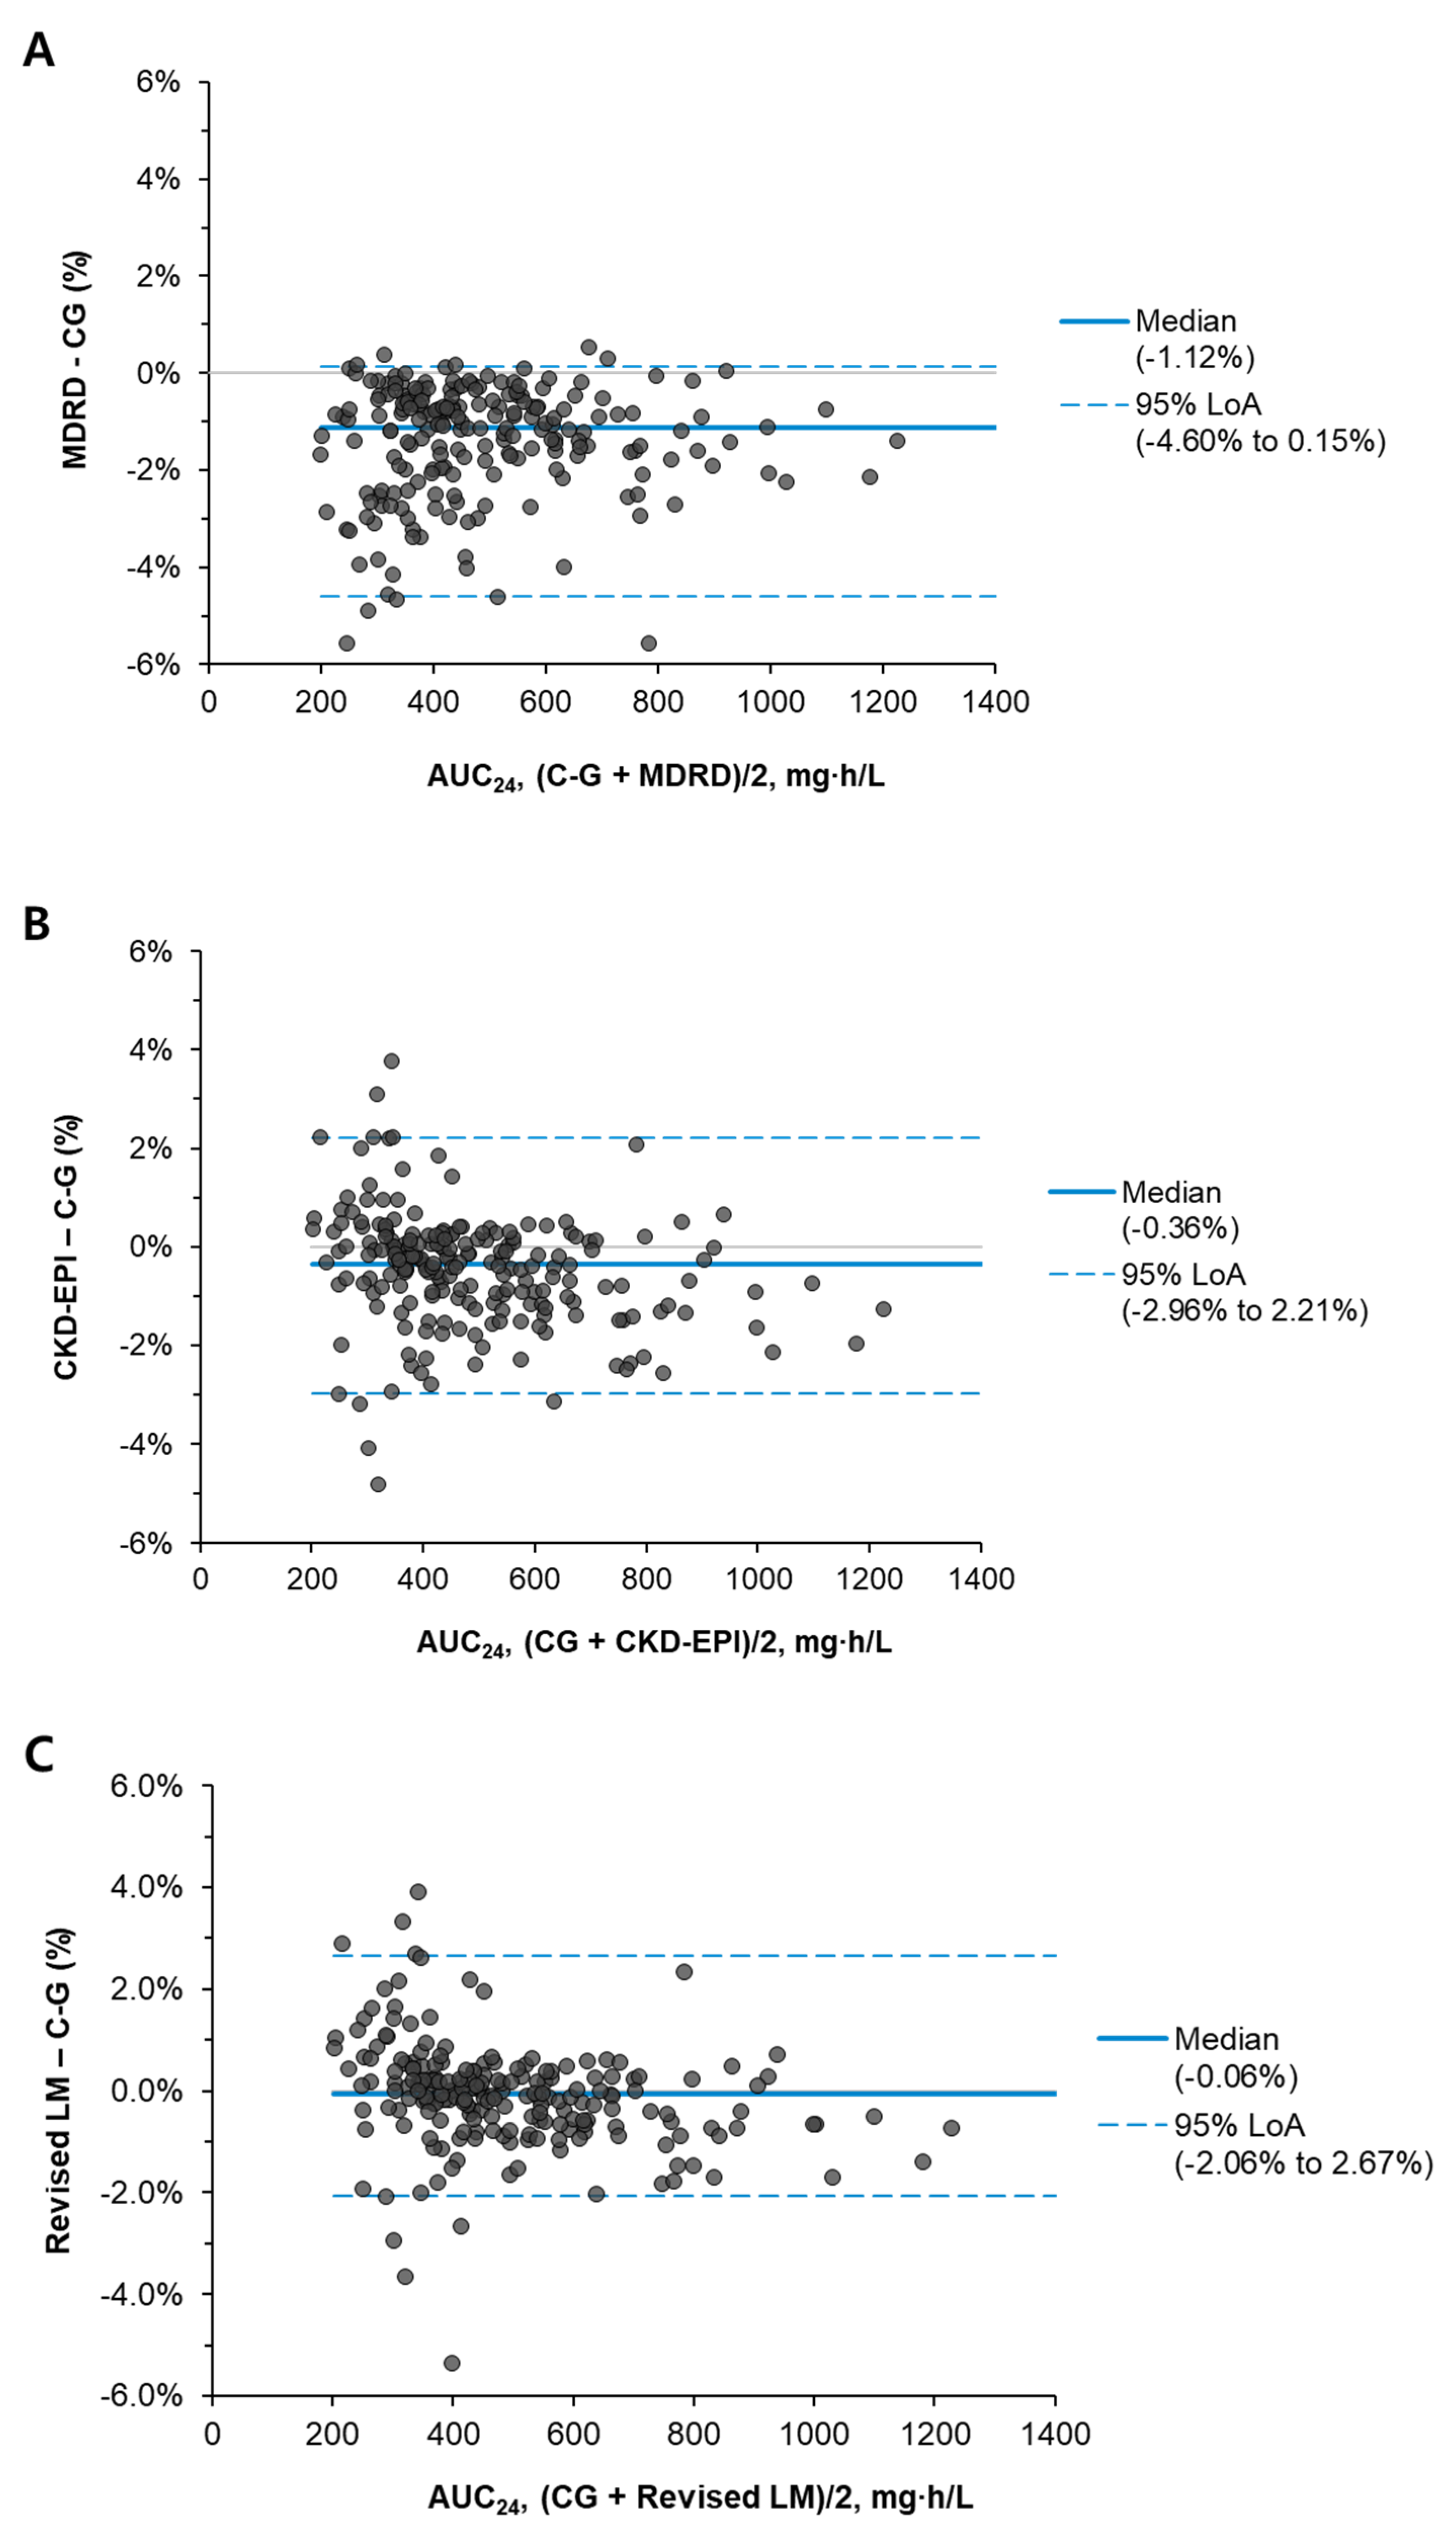
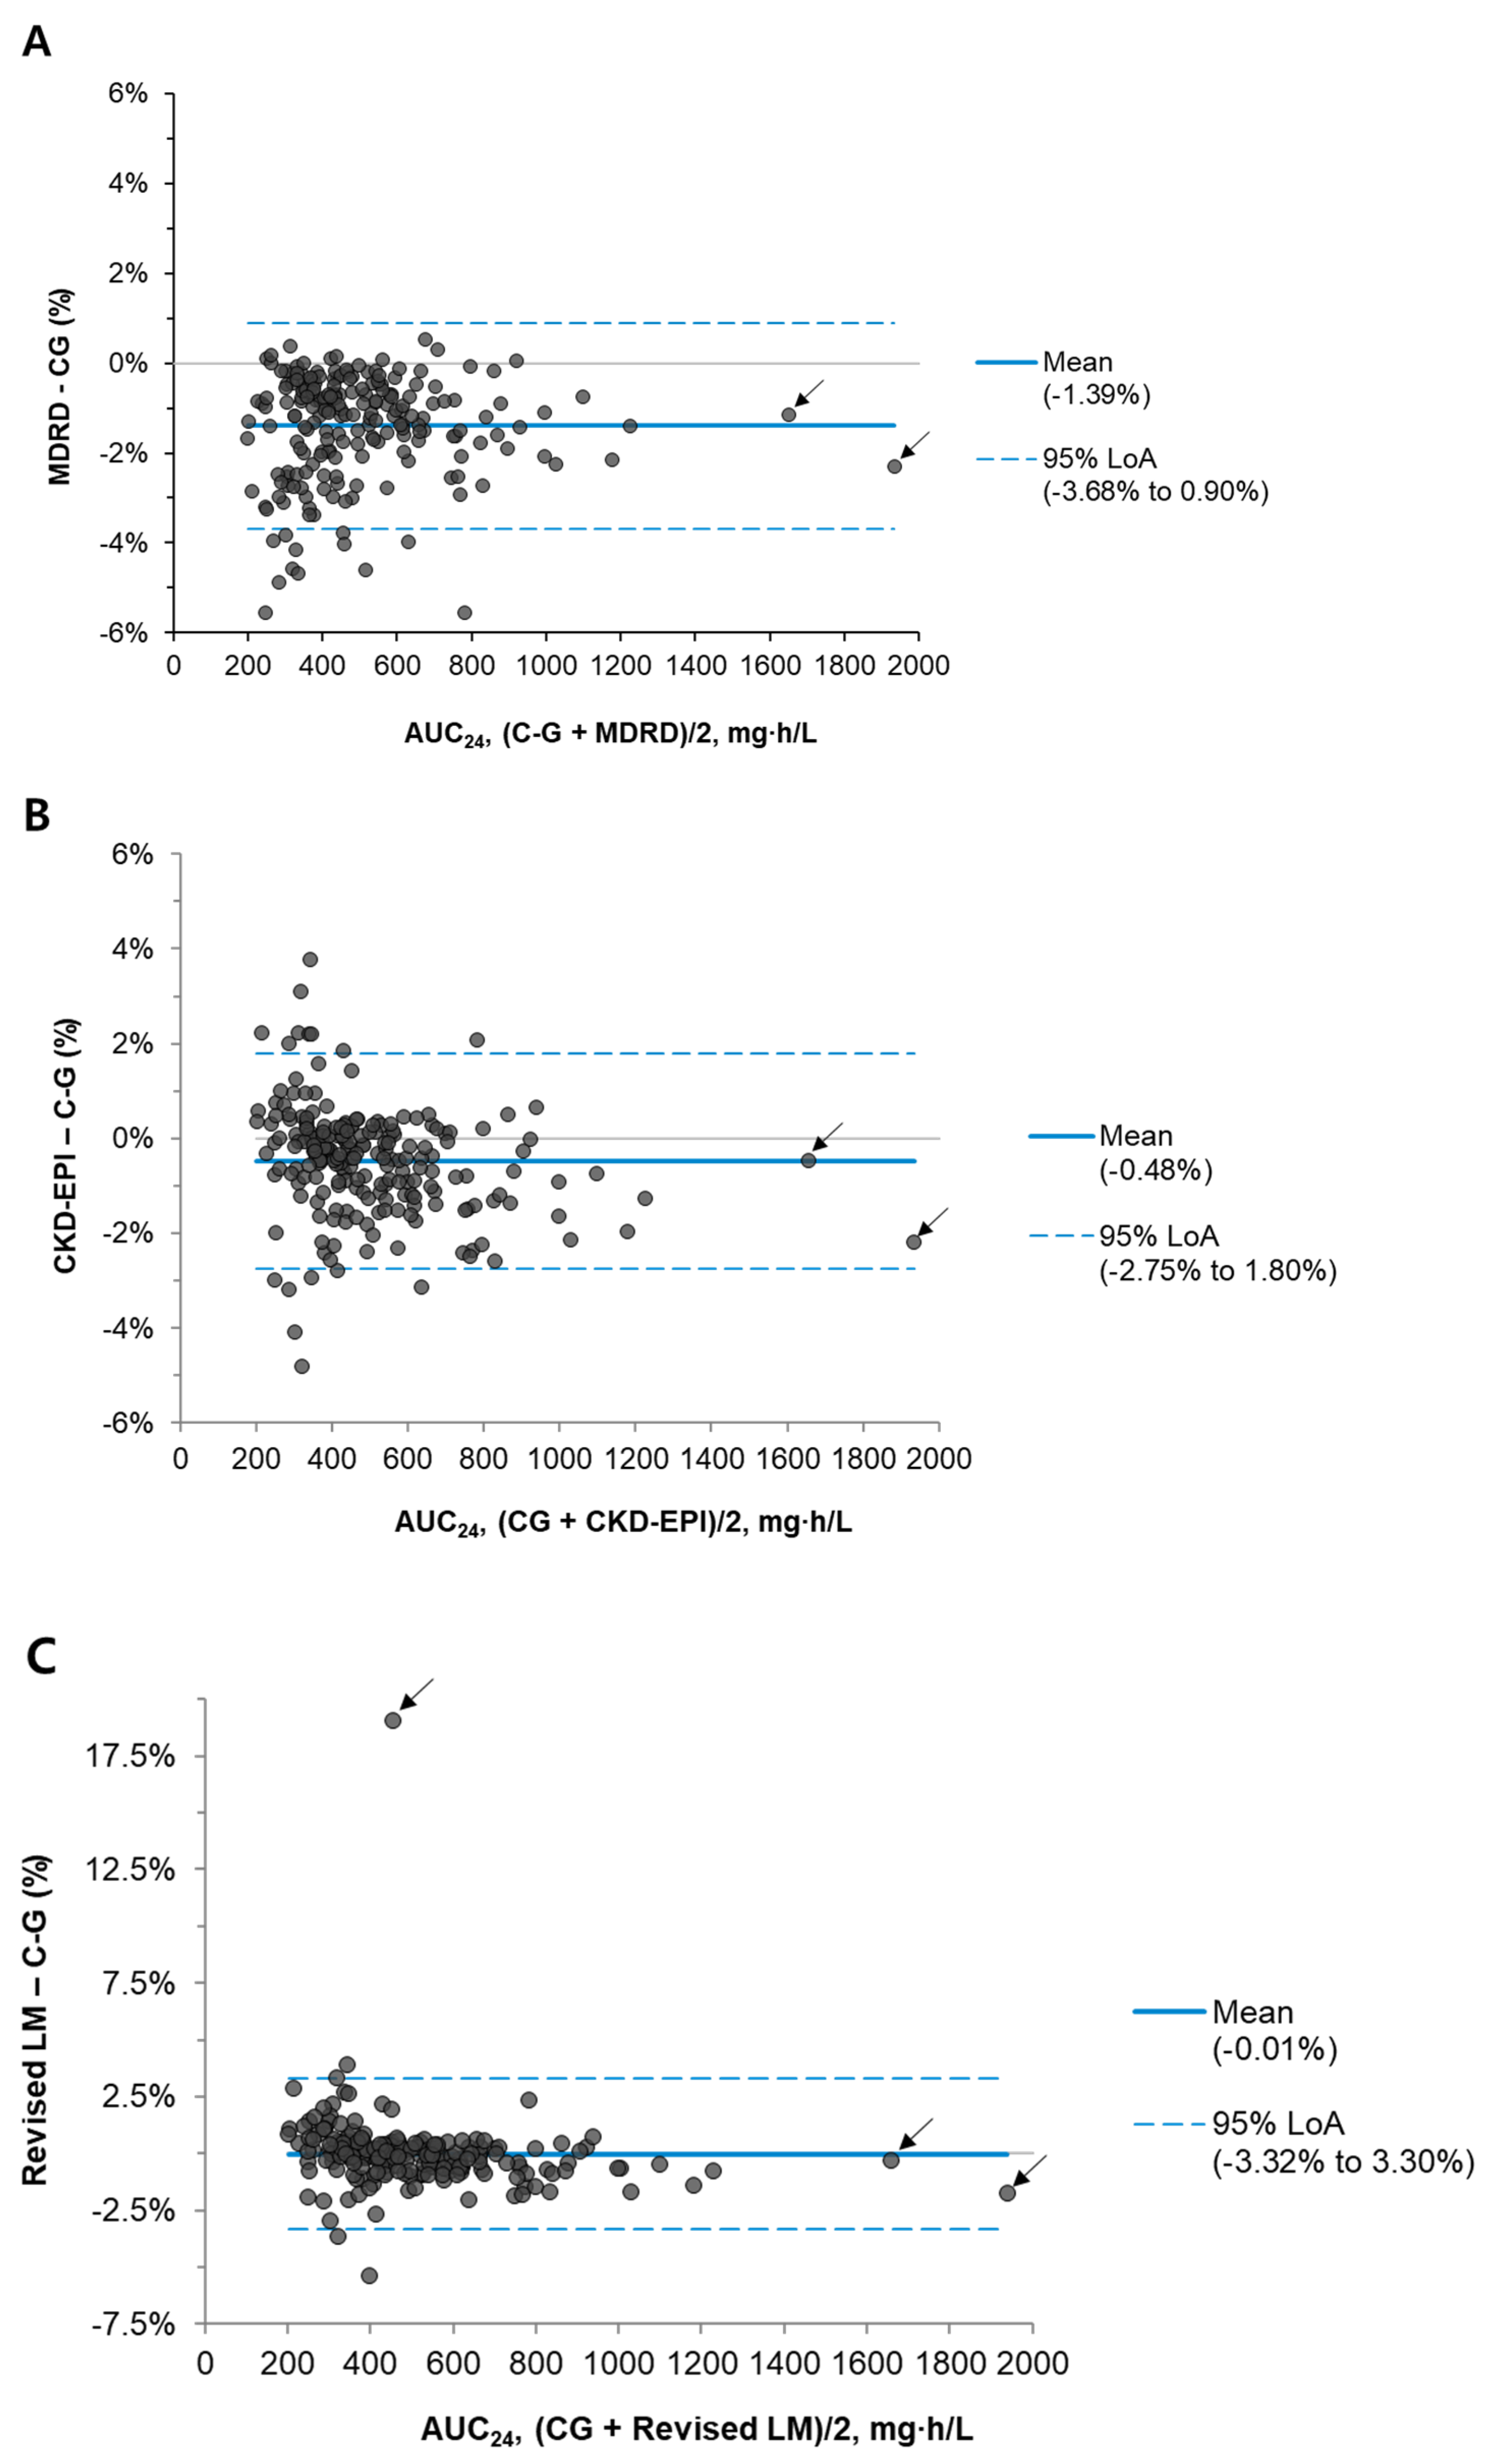
3.2. AUC24 According to the eGFR Formula
4. Discussion
5. Conclusions
Author Contributions
Funding
Institutional Review Board Statement
Informed Consent Statement
Data Availability Statement
Conflicts of Interest
Appendix A

References
- Lee, A.S.; de Lencastre, H.; Garau, J.; Kluytmans, J.; Malhotra-Kumar, S.; Peschel, A.; Harbarth, S. Methicillin-resistant Staphylococcus aureus. Nat. Rev. Dis. Prim. 2018, 4, 18033. [Google Scholar] [CrossRef] [PubMed] [Green Version]
- Rybak, M.J.; Le, J.; Lodise, T.P.; Levine, D.P.; Bradley, J.S.; Liu, C.; Mueller, B.A.; Pai, M.P.; Wong-Beringer, A.; Rotschafer, J.C.; et al. Therapeutic monitoring of vancomycin for serious methicillin-resistant Staphylococcus aureus infections: A revised consensus guideline and review by the American Society of Health-System Pharmacists, the Infectious Diseases Society of America, the Pediatric Infectious Diseases Society, and the Society of Infectious Diseases Pharmacists. Am. J. Health Syst. Pharm. 2020, 77, 835–864. [Google Scholar] [CrossRef] [PubMed] [Green Version]
- Rybak, M.; Lomaestro, B.; Rotschafer, J.C.; Moellering, R., Jr.; Craig, W.; Billeter, M.; Dalovisio, J.R.; Levine, D.P. Therapeutic monitoring of vancomycin in adult patients: A consensus review of the American Society of Health-System Pharmacists, the Infectious Diseases Society of America, and the Society of Infectious Diseases Pharmacists. Am. J. Health Syst. Pharm. 2009, 66, 82–98. [Google Scholar] [CrossRef]
- Rule, A.D.; Larson, T.S.; Bergstralh, E.J.; Slezak, J.M.; Jacobsen, S.J.; Cosio, F.G. Using serum creatinine to estimate glomerular filtration rate: Accuracy in good health and in chronic kidney disease. Ann. Intern. Med. 2004, 141, 929–937. [Google Scholar] [CrossRef] [PubMed]
- Broeker, A.; Nardecchia, M.; Klinker, K.P.; Derendorf, H.; Day, R.O.; Marriott, D.J.; Carland, J.E.; Stocker, S.L.; Wicha, S.G. Towards precision dosing of vancomycin: A systematic evaluation of pharmacometric models for Bayesian forecasting. Clin. Microbiol. Infect. 2019, 25, 1286.e1–1286.e7. [Google Scholar] [CrossRef]
- Stevens, L.A.; Coresh, J.; Greene, T.; Levey, A.S. Assessing kidney function—Measured and estimated glomerular filtration rate. N. Engl. J. Med. 2006, 354, 2473–2483. [Google Scholar] [CrossRef] [Green Version]
- Cockcroft, D.W.; Gault, M.H. Prediction of creatinine clearance from serum creatinine. Nephron 1976, 16, 31–41. [Google Scholar] [CrossRef]
- Levey, A.S.; Bosch, J.P.; Lewis, J.B.; Greene, T.; Rogers, N.; Roth, D. A more accurate method to estimate glomerular filtration rate from serum creatinine: A new prediction equation. Modification of Diet in Renal Disease Study Group. Ann. Intern. Med. 1999, 130, 461–470. [Google Scholar] [CrossRef]
- Levey, A.S.; Stevens, L.A.; Schmid, C.H.; Zhang, Y.L.; Castro, A.F., 3rd; Feldman, H.I.; Kusek, J.W.; Eggers, P.; Van Lente, F.; Greene, T.; et al. A new equation to estimate glomerular filtration rate. Ann. Intern. Med. 2009, 150, 604–612. [Google Scholar] [CrossRef]
- Jeong, T.D.; Lee, W.; Chun, S.; Lee, S.K.; Ryu, J.S.; Min, W.K.; Park, J.S. Comparison of the MDRD study and CKD-EPI equations for the estimation of the glomerular filtration rate in the Korean general population: The fifth Korea National Health and Nutrition Examination Survey (KNHANES V-1), 2010. Kidney Blood Press. Res. 2013, 37, 443–450. [Google Scholar] [CrossRef]
- Jeong, T.D.; Cho, E.J.; Lee, W.; Chun, S.; Hong, K.S.; Min, W.K. Accuracy Assessment of Five Equations Used for Estimating the Glomerular Filtration Rate in Korean Adults. Ann. Lab. Med. 2017, 37, 371–380. [Google Scholar] [CrossRef] [PubMed]
- Jones, G.R. Estimating renal function for drug dosing decisions. Clin. Biochem. Rev. 2011, 32, 81–88. [Google Scholar] [PubMed]
- Proost, J.H.; Meijer, D.K. MW/Pharm, an integrated software package for drug dosage regimen calculation and therapeutic drug monitoring. Comput. Biol. Med. 1992, 22, 155–163. [Google Scholar] [CrossRef] [PubMed]
- Fuchs, A.; Csajka, C.; Thoma, Y.; Buclin, T.; Widmer, N. Benchmarking therapeutic drug monitoring software: A review of available computer tools. Clin. Pharmacokinet. 2013, 52, 9–22. [Google Scholar] [CrossRef]
- Levin, A.S.; Bilous, R.W.; Coresh, J. Chapter 1: Definition and classification of CKD. Kidney Int. Suppl. 2013, 3, 19–62. [Google Scholar] [CrossRef] [Green Version]
- Nyman, U.; Grubb, A.; Larsson, A.; Hansson, L.O.; Flodin, M.; Nordin, G.; Lindström, V.; Björk, J. The revised Lund-Malmö GFR estimating equation outperforms MDRD and CKD-EPI across GFR, age and BMI intervals in a large Swedish population. Clin. Chem. Lab. Med. 2014, 52, 815–824. [Google Scholar] [CrossRef]
- Miller, W.G.; Jones, G.R.D. Estimated Glomerular Filtration Rate; Laboratory Implementation and Current Global Status. Adv. Chronic Kidney Dis. 2018, 25, 7–13. [Google Scholar] [CrossRef] [Green Version]
- Tsuji, Y.; Hiraki, Y.; Mizoguchi, A.; Sadoh, S.; Sonemoto, E.; Kamimura, H.; Karube, Y. Effect of various estimates of renal function on prediction of vancomycin concentration by the population mean and Bayesian methods. J. Clin. Pharm. Ther. 2009, 34, 465–472. [Google Scholar] [CrossRef]
- Kim, D.J.; Lee, D.H.; Ahn, S.; Jung, J.; Kiem, S.; Kim, S.W.; Shin, J.G. A new population pharmacokinetic model for vancomycin in patients with variable renal function: Therapeutic drug monitoring based on extended covariate model using CKD-EPI estimation. J. Clin. Pharm. Ther. 2019, 44, 750–759. [Google Scholar] [CrossRef]
- Sima, M.; Hartinger, J.; Grus, T.; Slanar, O. Initial dosing of intermittent vancomycin in adults: Estimation of dosing interval in relation to dose and renal function. Eur. J. Hosp. Pharm. 2021, 28, 276–279. [Google Scholar] [CrossRef]
- Inker, L.A.; Eneanya, N.D.; Coresh, J.; Tighiouart, H.; Wang, D.; Sang, Y.; Crews, D.C.; Doria, A.; Estrella, M.M.; Froissart, M.; et al. New Creatinine- and Cystatin C-Based Equations to Estimate GFR without Race. N. Engl. J. Med. 2021, 385, 1737–1749. [Google Scholar] [CrossRef] [PubMed]


| Characteristic | Value |
|---|---|
| Total number, n | 214 |
| Male gender, n (%) | 129 (60.3) |
| Age, years (median [Q1, Q3]) | 72 (60, 79) |
| Body weight, kg (mean ± SD) | 59.8 ± 13.2 |
| Height, cm (mean ± SD) | 162.9 ± 8.9 |
| BSA, m2 (median, [Q1, Q3]) | 1.62 (1.50, 1.78) |
| BMI, kg/m2 (mean ± SD) | 22.5 ± 4.4 |
| Serum creatinine, mg/dL (median [Q1, Q3]) | 0.61 (0.47, 0.81) |
| eGFR, mL/min * | |
| C-G (median [Q1, Q3]) | 80.6 (54.3, 113.7) |
| MDRD (median [Q1, Q3]) | 112.7 (78.8, 154.0) |
| CKD-EPI (median [Q1, Q3]) | 91.2 (72.3, 107.2) |
| Revised LM (median [Q1, Q3]) | 82.8 (65.2, 99.7) |
| Measured vancomycin Ctrough, μg/mL (median [Q1, Q3]) | 11.6 (8.1, 16.4) |
| Measured vancomycin Cpeak, μg/mL (median [Q1, Q3]) | 28.8 (25.0, 37.0) |
| Daily vancomycin dose, mg/kg (median [Q1, Q3]) | 29.7 (25.0, 37.0) |
| Variable | eGFR Equation | |||
|---|---|---|---|---|
| C-G | MDRD | CKD-EPI | Revised LM | |
| All | ||||
| Median AUC24 (95% CI) | 441.9 (420.1, 468.5) | 437.4 (415.7, 466.2) | 440.3 (418.9, 468.6) | 444.5 (422.6, 475.1) |
| Median difference, % (95% CI) | Reference | −3.1 (−3.4, −2.9) b | −1.1 (−1.4, −0.8) b | −0.2 (−0.5, 0.1) c |
| Creatinine 0.16–0.47 mg/dL * (Q1) | ||||
| Median AUC24 (95% CI) | 393.4 (355.8, 433.3) | 388.8 (350.1, 424.0) | 392.4 (355.8, 432.5) | 392.6 (356.1, 433.7) |
| Median difference, % (95% CI) | Reference | −5.6 (−6.9, −4.4) b | 1.7 (0.8, 2.8) b | 2.3 (1.4, 3.4) b |
| Creatinine 0.48–0.61 mg/dL * (Q2) | ||||
| Median AUC24 (95% CI) | 419.9 (363.0, 456.1) | 414.7 (354.8, 448.9) | 418.0 (360.1, 455.2) | 424.7 (362.2, 464.5) |
| Median difference, % (95% CI) | Reference | −6.1 (−8.0, −4.5) b | −1.3 (−2.4, −0.5) b | 0.1 (−0.8, 0.7) c |
| Creatinine 0.62–0.81 mg/dL * (Q3) | ||||
| Median AUC24 (95% CI) | 452.4 (412.2, 545.8) | 447.8 (406.4, 541.1) | 450.5 (406.5, 540.8) | 451.7 (408.8, 542.8) |
| Median difference, % (95% CI) | Reference | −5.8 (−7.4, −4.1) b | −4.0 (−5.6, −2.7) b | −1.7 (−2.7, −0.6) a |
| Creatinine 0.82–2.11 mg/dL * (Q4) | ||||
| Median AUC24 (95% CI) | 562.8 (509.4, 630.2) | 559.0 (504.0, 616.2) | 558.3 (503.7, 619.7) | 559.7 (506.2, 626.8) |
| Median difference, % (95% CI) | Reference | −7.1 (−9.3, −5.3) b | −7.0 (−9.0, −5.4) b | −4.2 (−5.7, −3.0) b |
| eGFR Equation | AUC24/MIC | AUC24/MIC by C-G | Weighted Kappa (95% CI) | ||
|---|---|---|---|---|---|
| <400 | 400–600 | >600 | |||
| MDRD | <400 | 79 | 4 | 0 | 0.972 (0.948, 0.996) |
| 400–600 | 0 | 79 | 1 | ||
| >600 | 0 | 0 | 51 | ||
| CKD-EPI | <400 | 79 | 1 | 0 | 0.989 (0.973, 1.000) |
| 400–600 | 0 | 82 | 1 | ||
| >600 | 0 | 0 | 51 | ||
| Revised LM | <400 | 79 | 2 | 0 | 0.983 (0.964, 1.000) |
| 400–600 | 0 | 81 | 1 | ||
| >600 | 0 | 0 | 51 | ||
Disclaimer/Publisher’s Note: The statements, opinions and data contained in all publications are solely those of the individual author(s) and contributor(s) and not of MDPI and/or the editor(s). MDPI and/or the editor(s) disclaim responsibility for any injury to people or property resulting from any ideas, methods, instructions or products referred to in the content. |
© 2023 by the authors. Licensee MDPI, Basel, Switzerland. This article is an open access article distributed under the terms and conditions of the Creative Commons Attribution (CC BY) license (https://creativecommons.org/licenses/by/4.0/).
Share and Cite
Kim, H.-K.; Jeong, T.-D. Clinical Relevance of a Vancomycin 24 h Area under the Concentration—Time Curve Values Using Different Renal Function Equations in Bayesian Dosing Software. J. Pers. Med. 2023, 13, 120. https://doi.org/10.3390/jpm13010120
Kim H-K, Jeong T-D. Clinical Relevance of a Vancomycin 24 h Area under the Concentration—Time Curve Values Using Different Renal Function Equations in Bayesian Dosing Software. Journal of Personalized Medicine. 2023; 13(1):120. https://doi.org/10.3390/jpm13010120
Chicago/Turabian StyleKim, Hyun-Ki, and Tae-Dong Jeong. 2023. "Clinical Relevance of a Vancomycin 24 h Area under the Concentration—Time Curve Values Using Different Renal Function Equations in Bayesian Dosing Software" Journal of Personalized Medicine 13, no. 1: 120. https://doi.org/10.3390/jpm13010120