
Measuring Indirect Radiation-Induced Perfusion Change in Fed Vasculature Using Dynamic Contrast CT

 , , and
Abstract
:1. Introduction
2. Materials and Methods
2.1. Novel Swine Model
2.2. Swine Setup
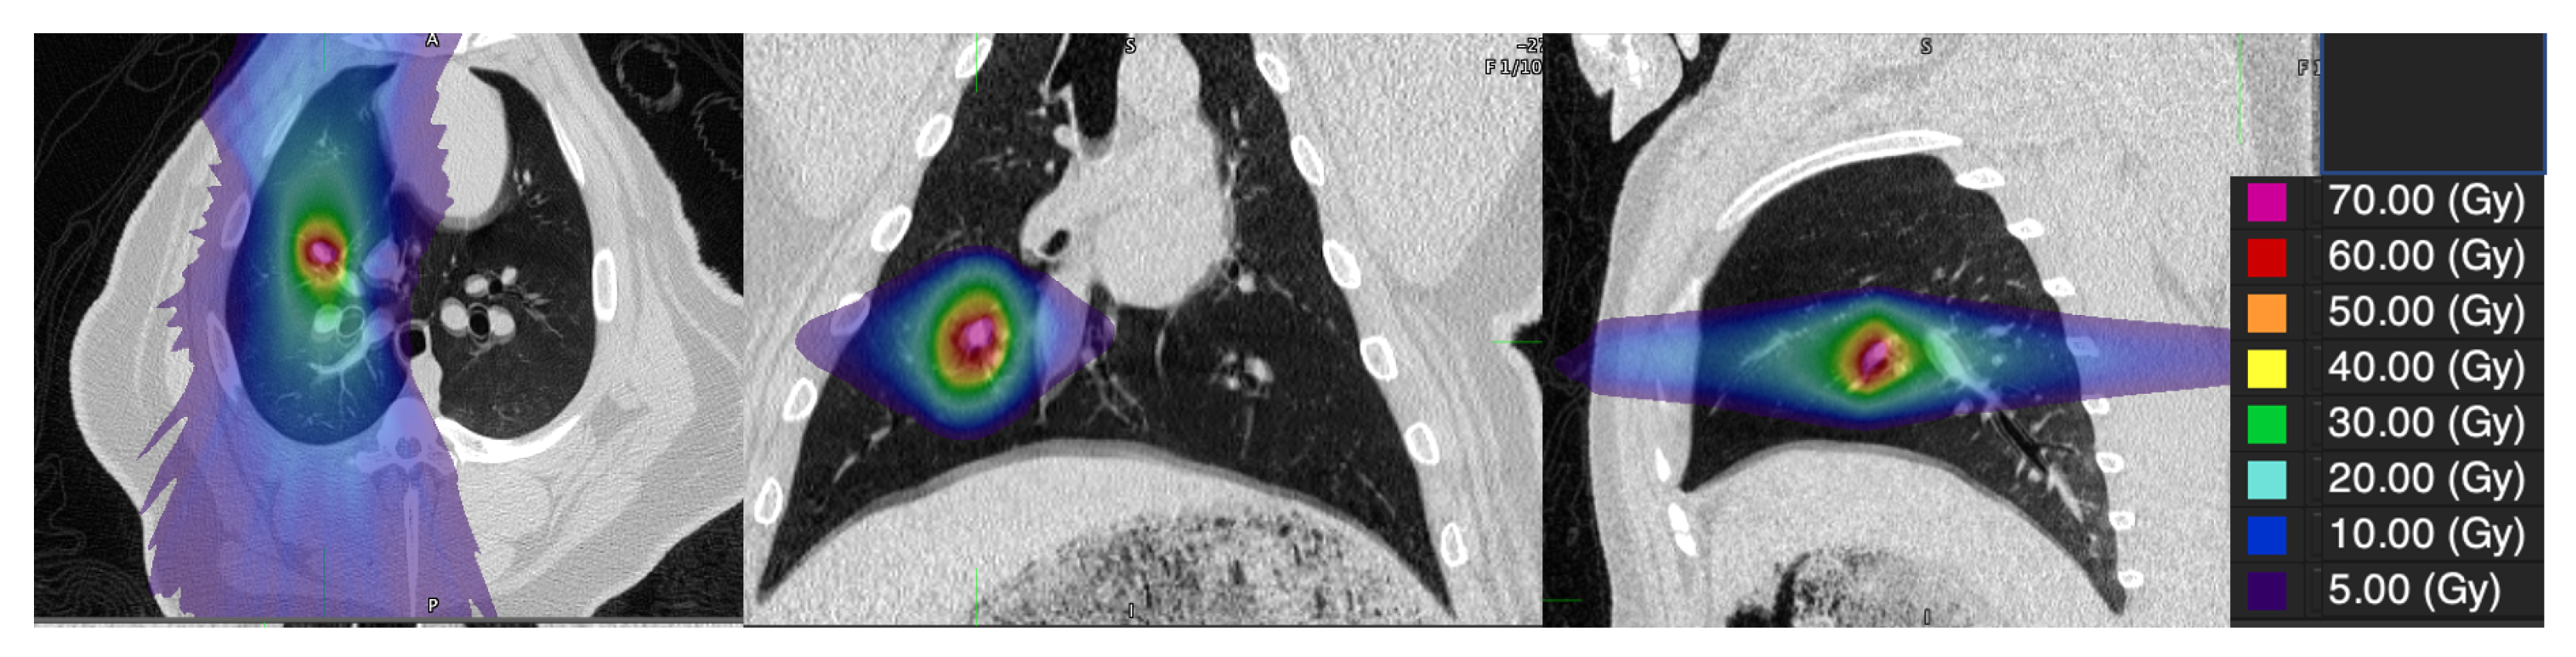
2.3. Swine Treatment
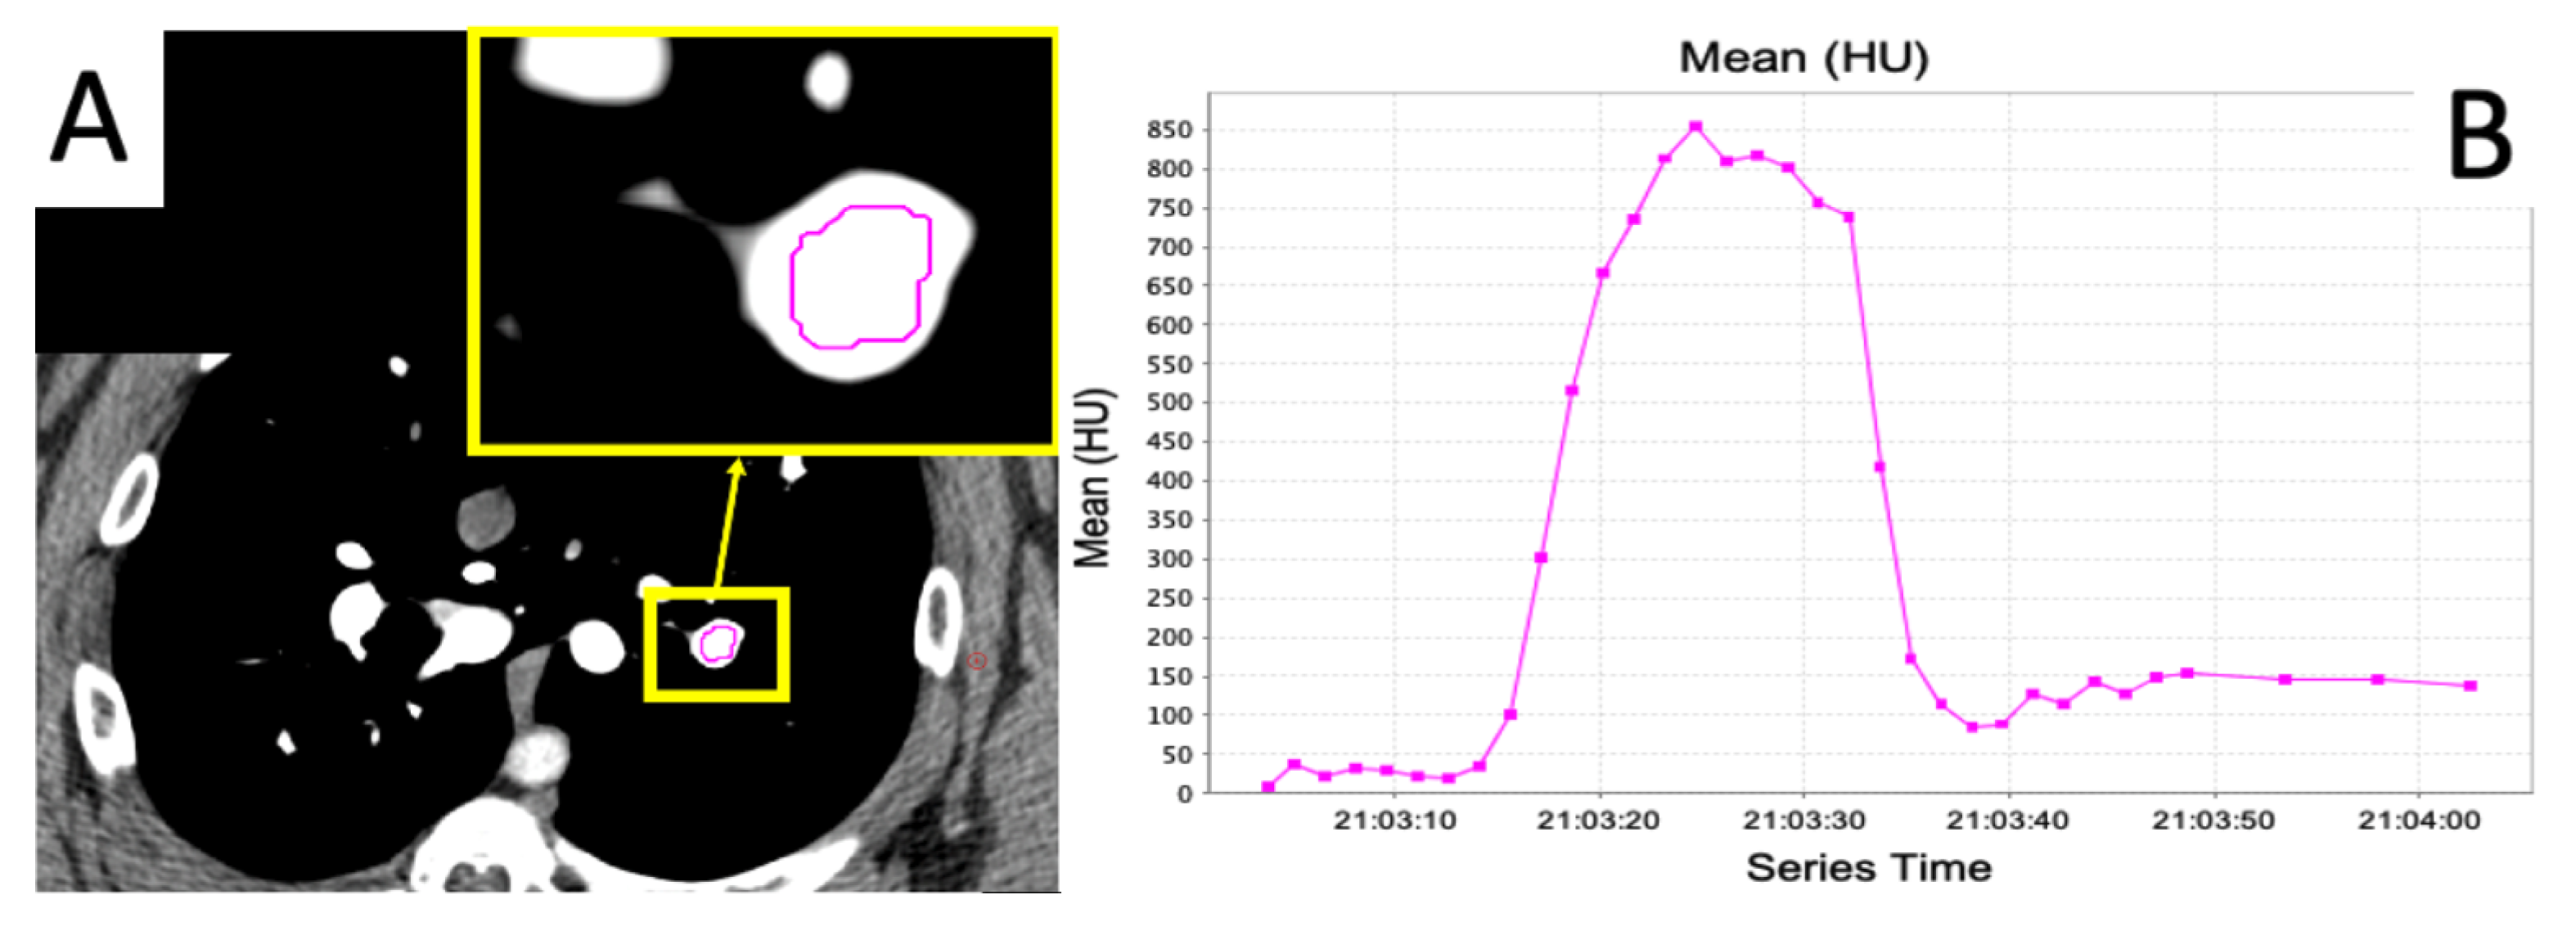
2.4. Dynamic Contrast CT
2.5. Regional Perfusion Analysis
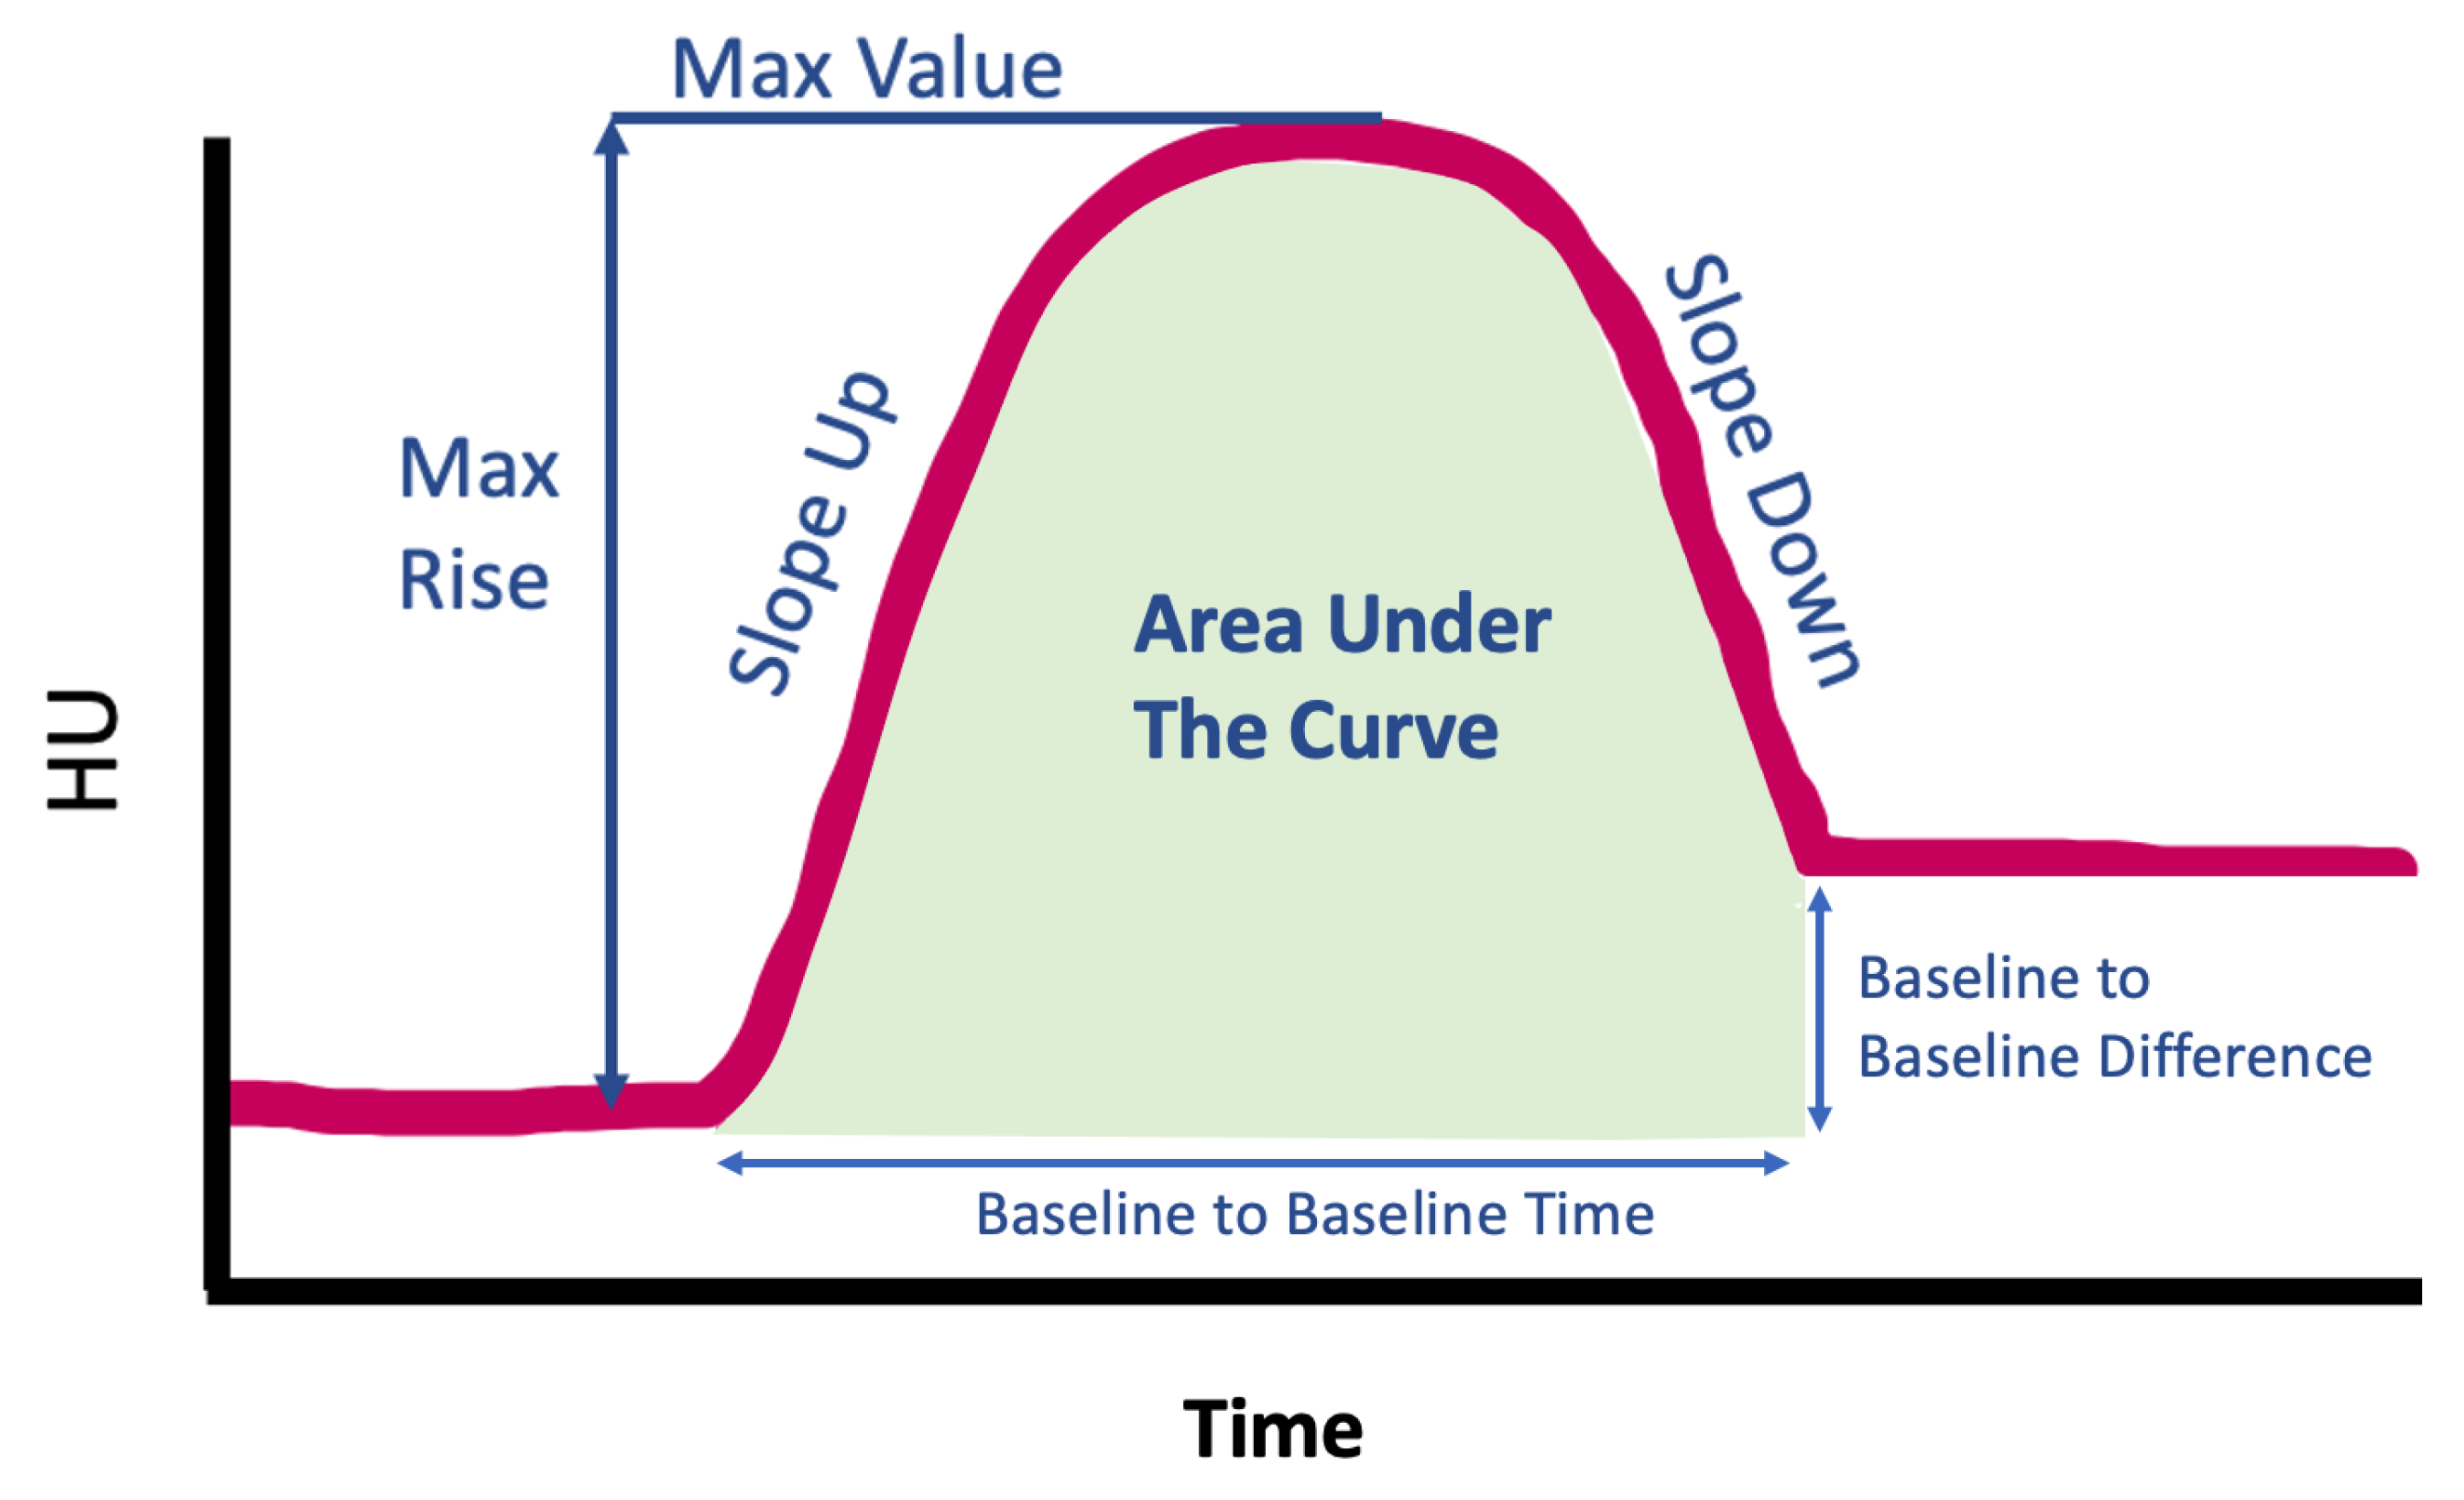
2.5.1. Calculation of Slopes
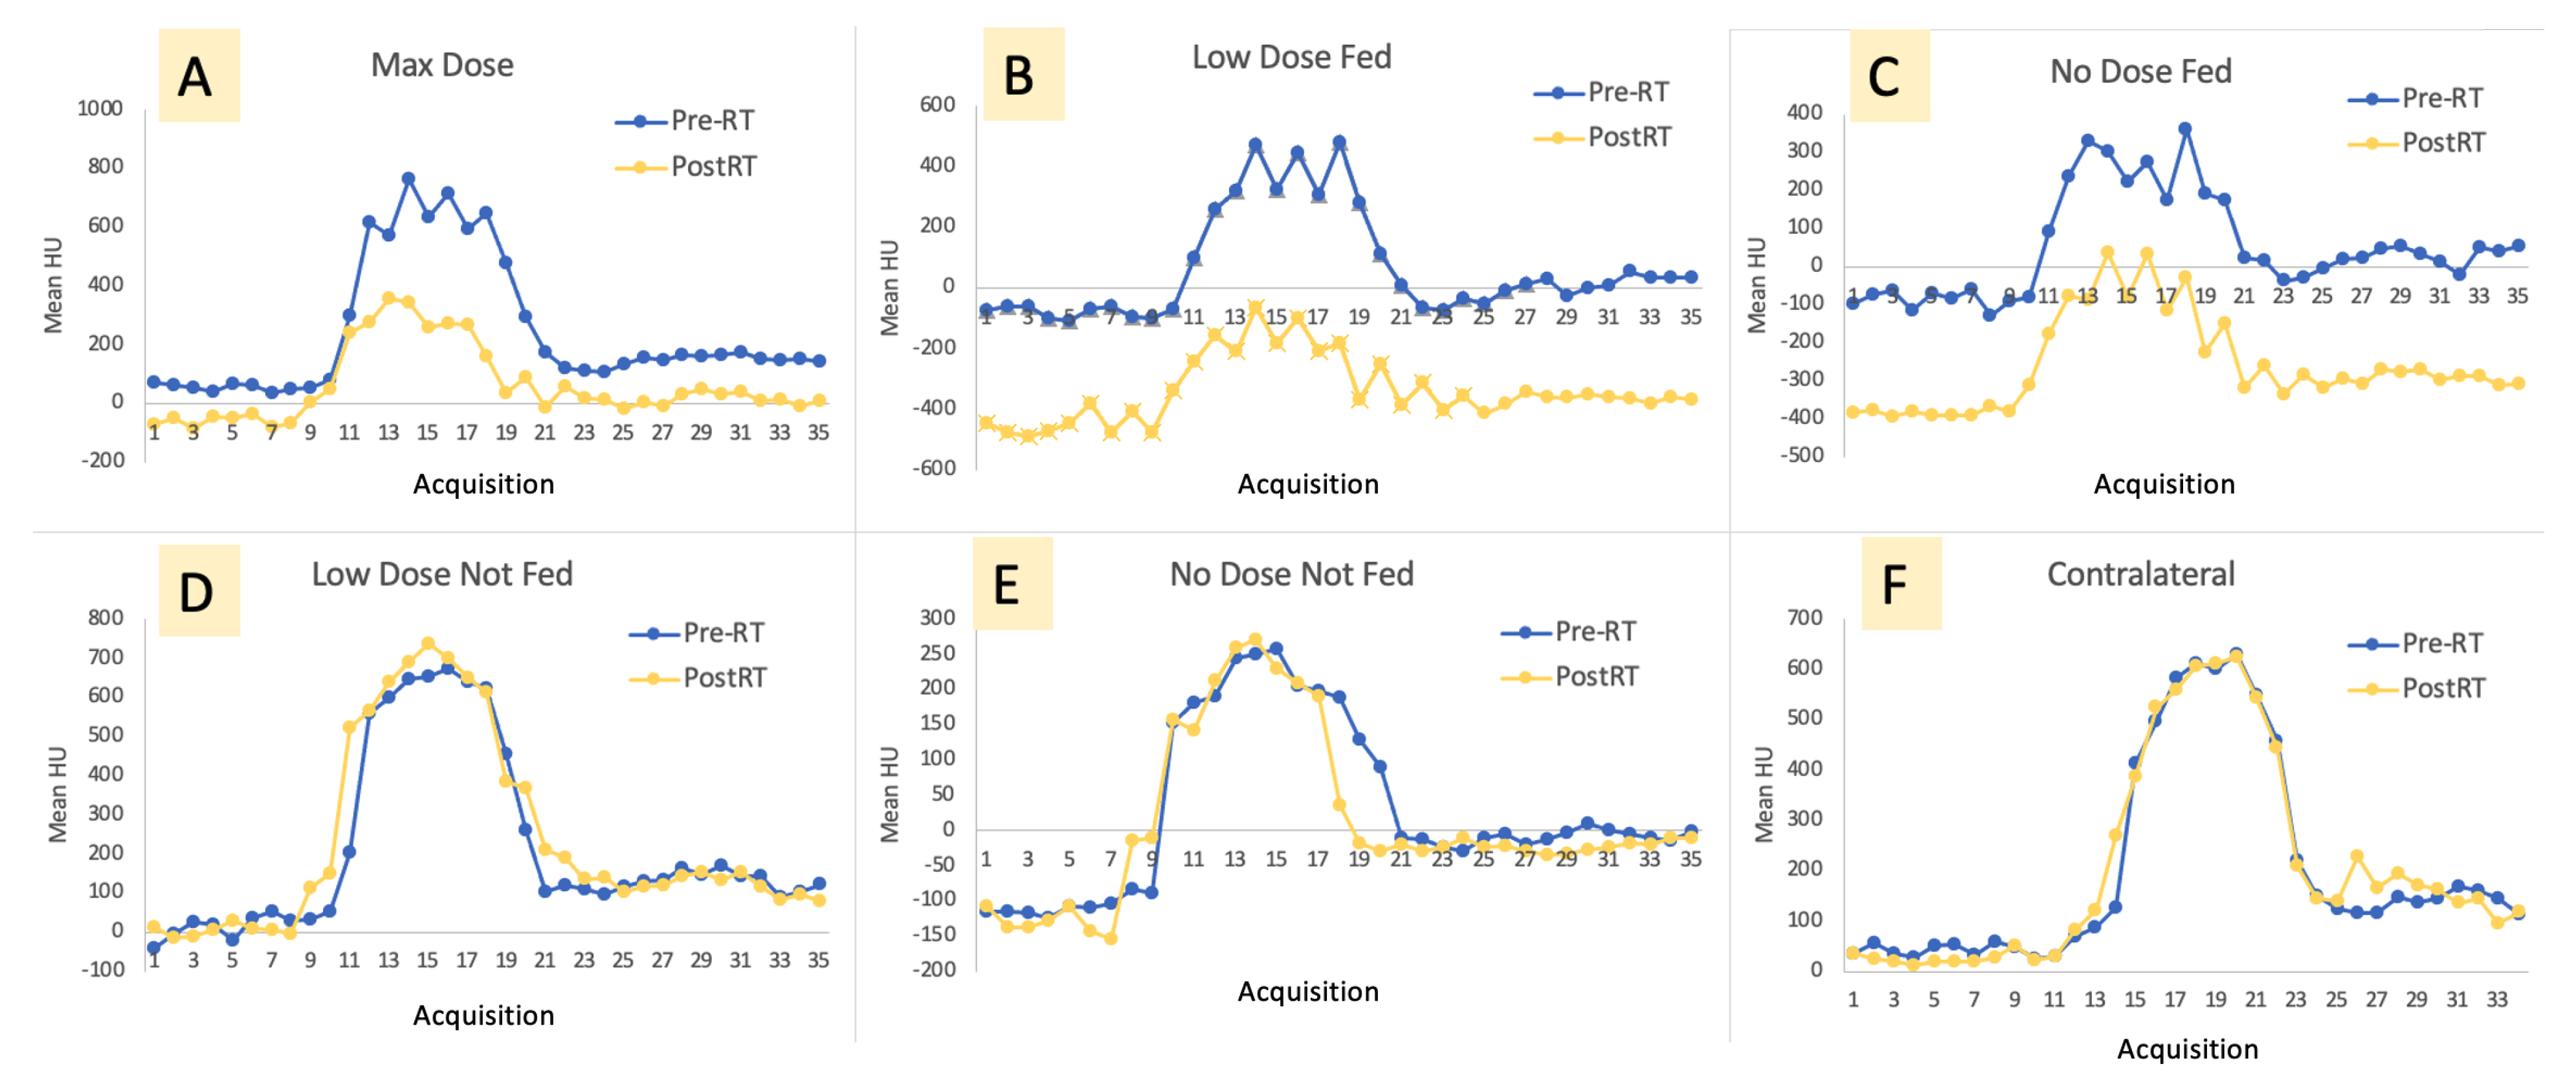
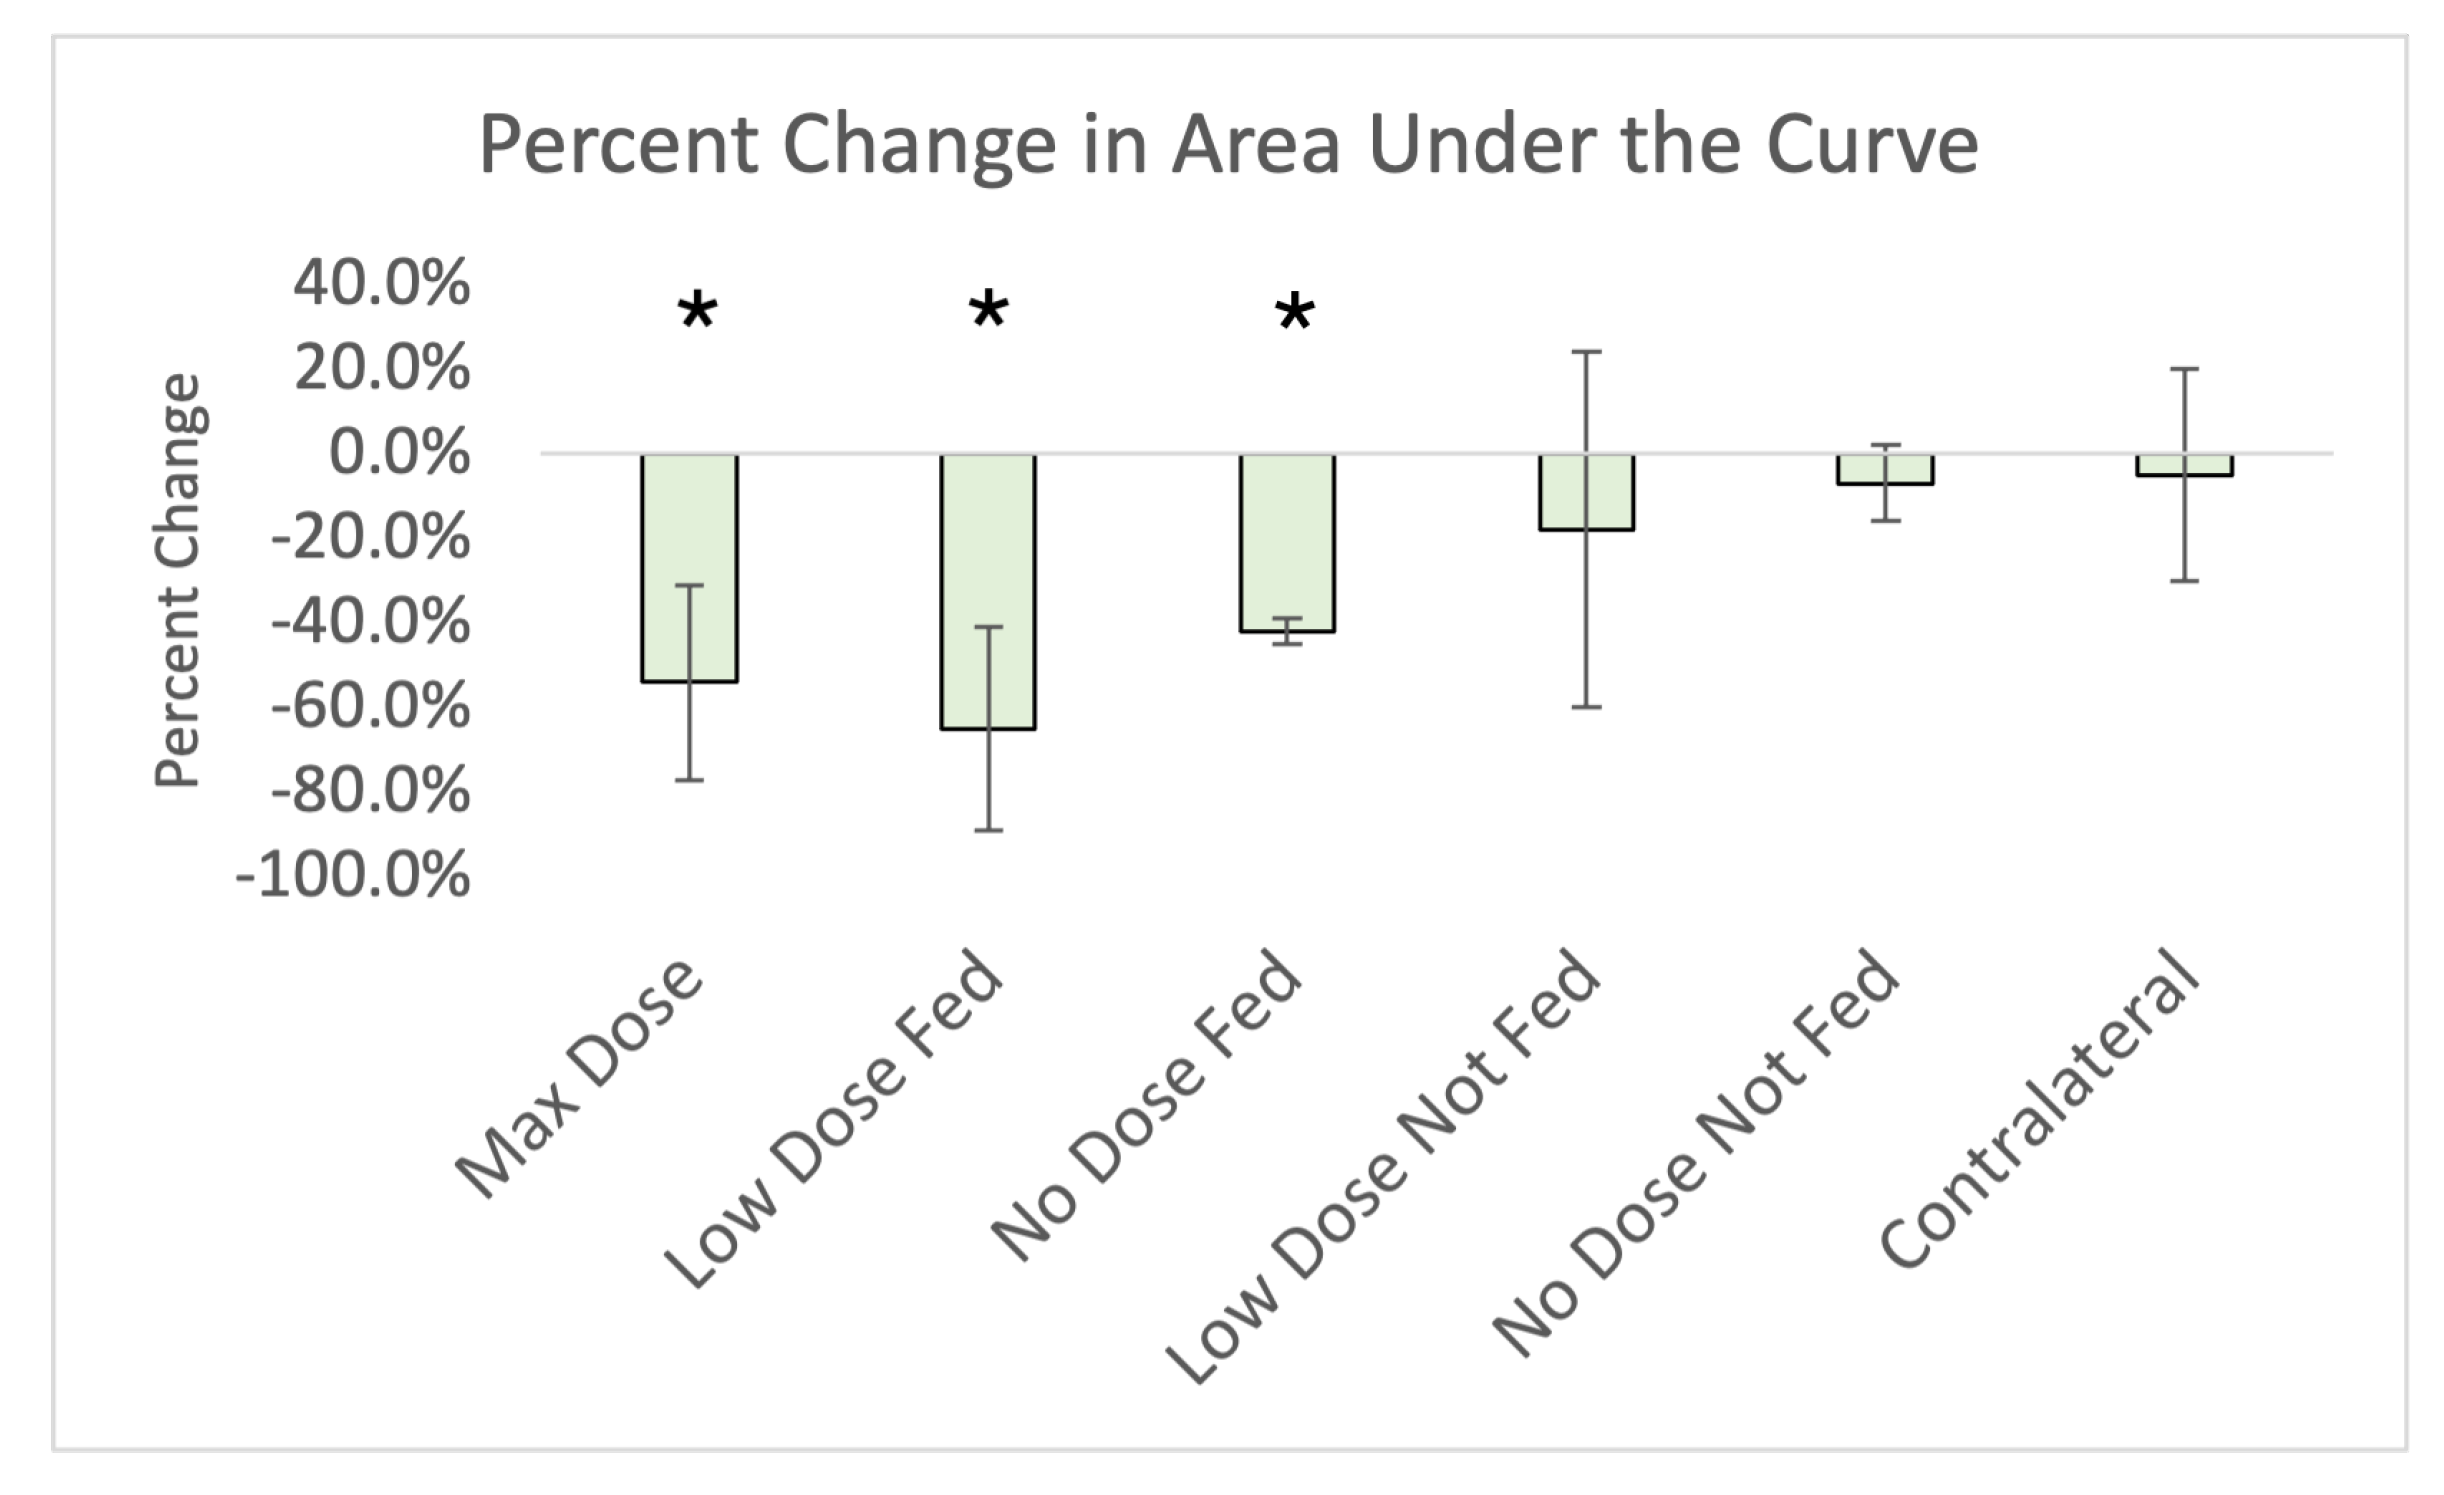
2.5.2. Area under the Curve
3. Results
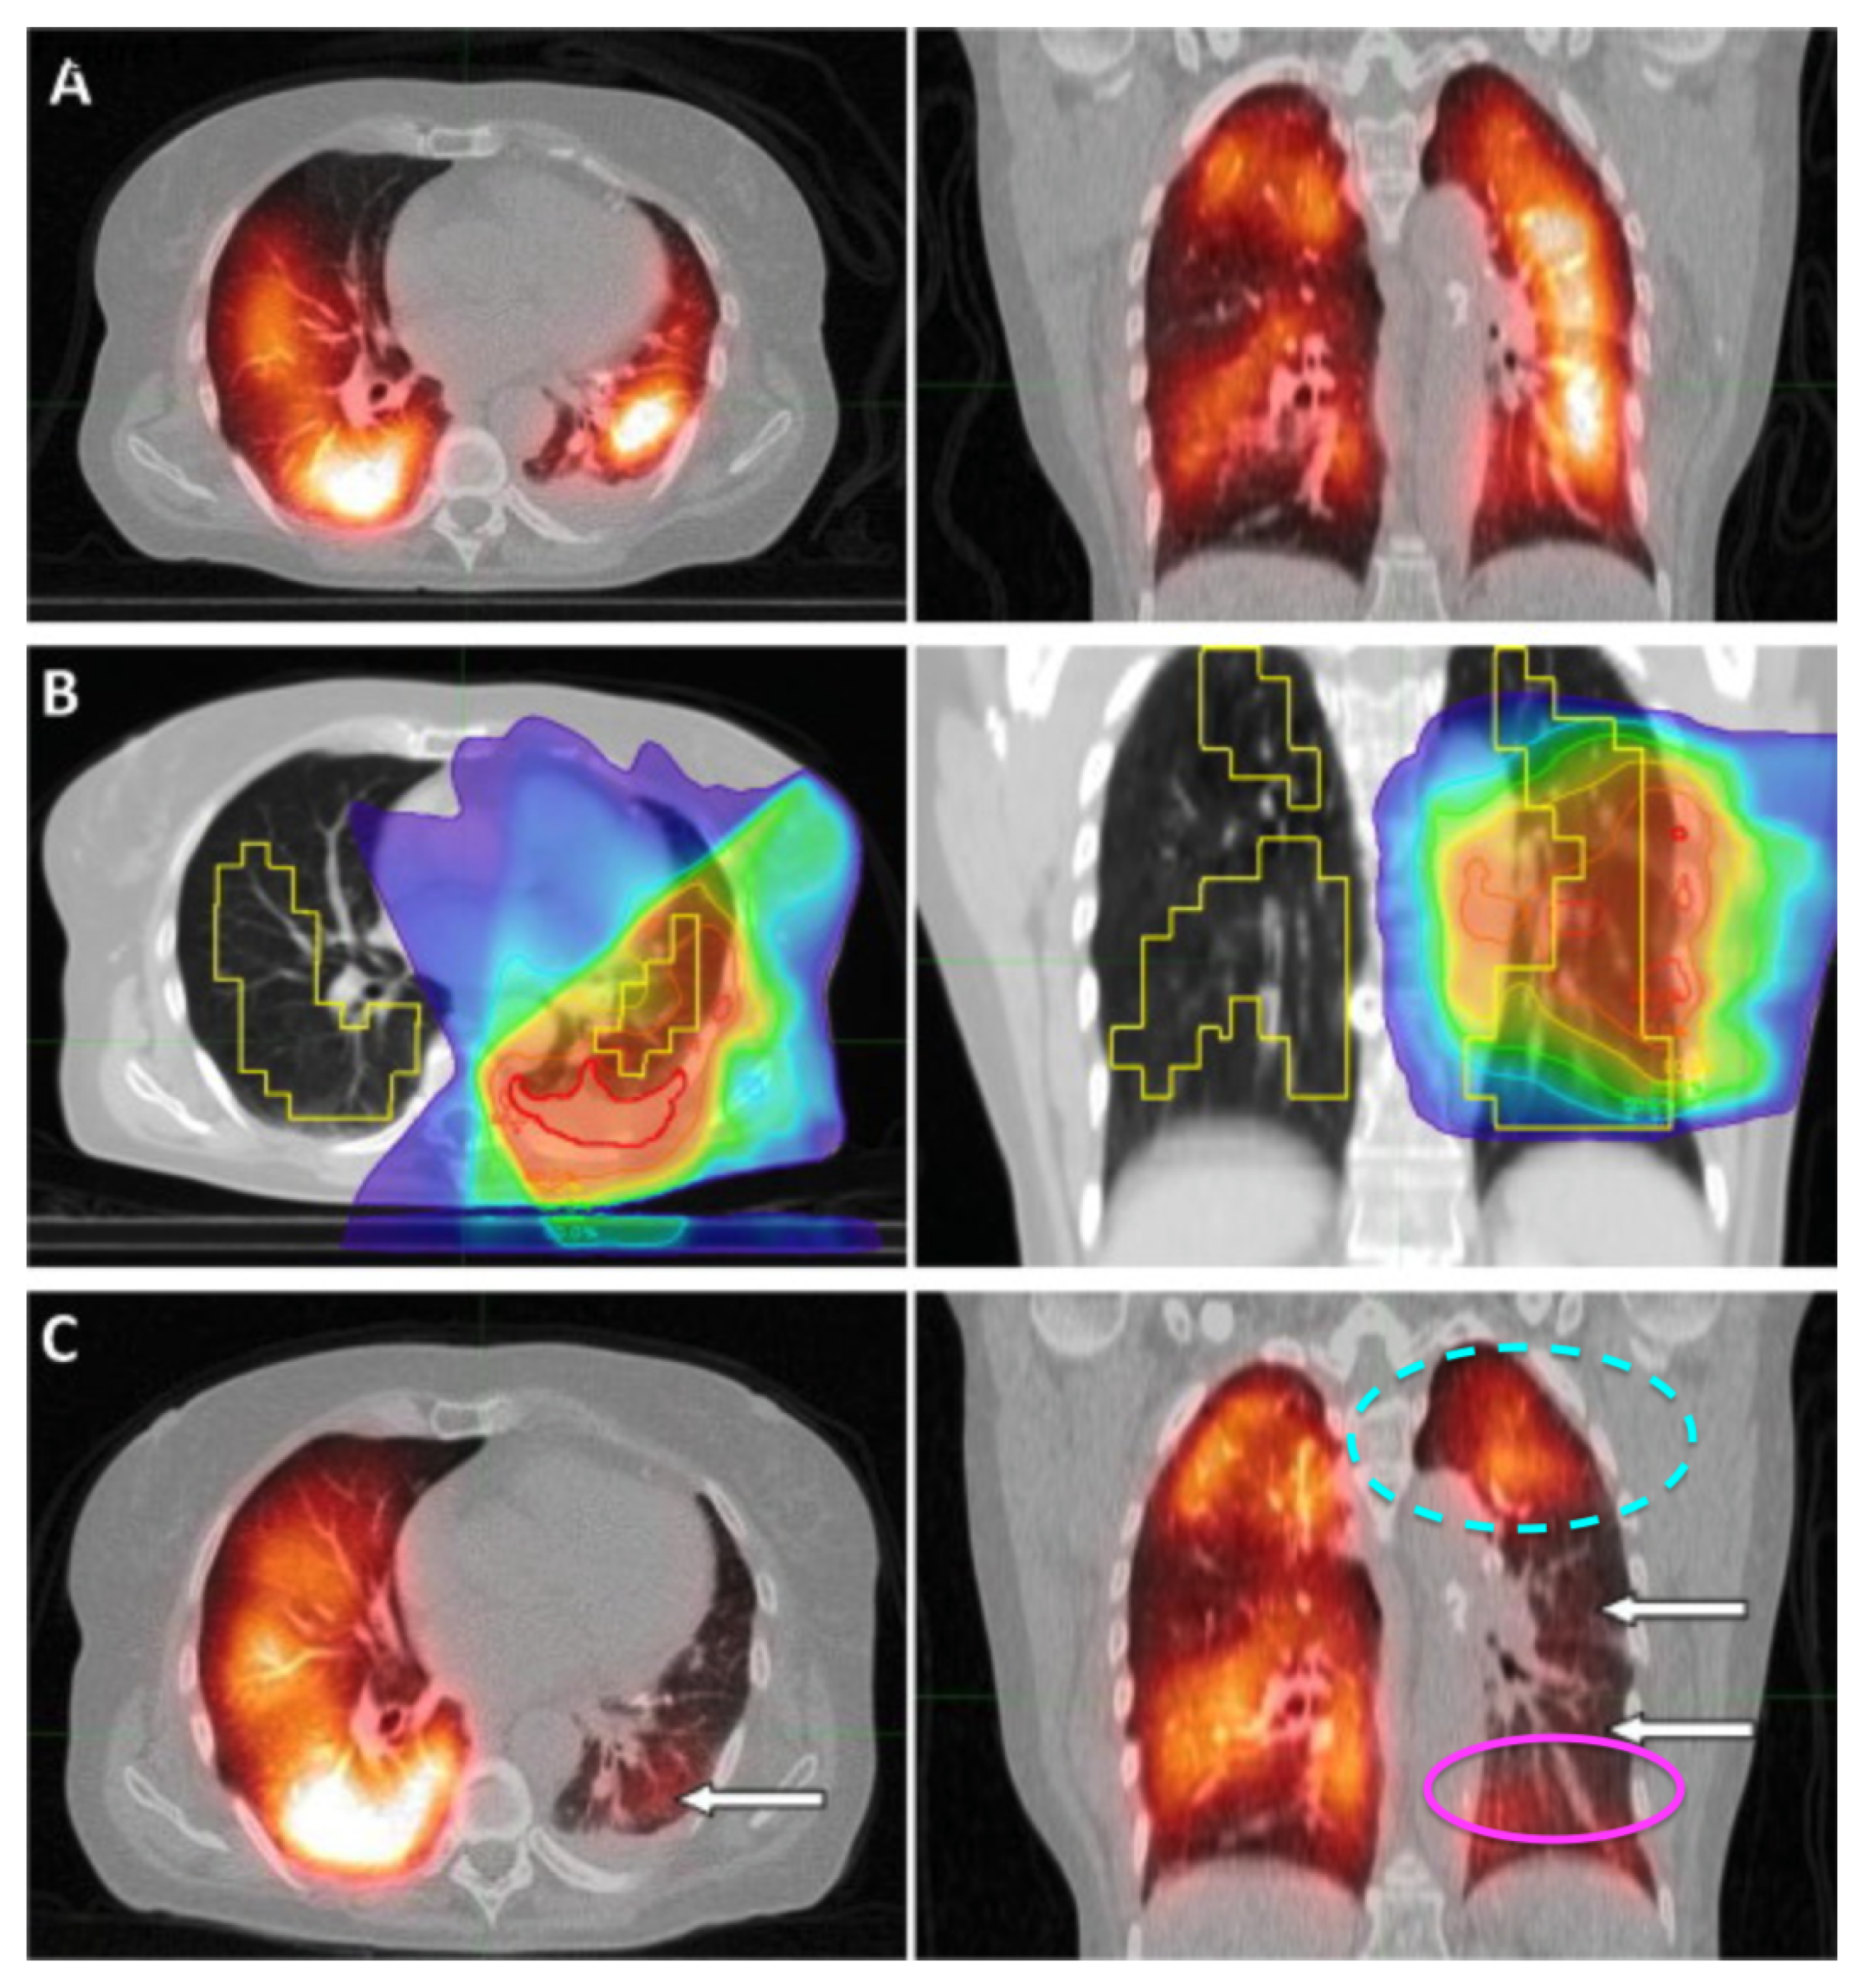
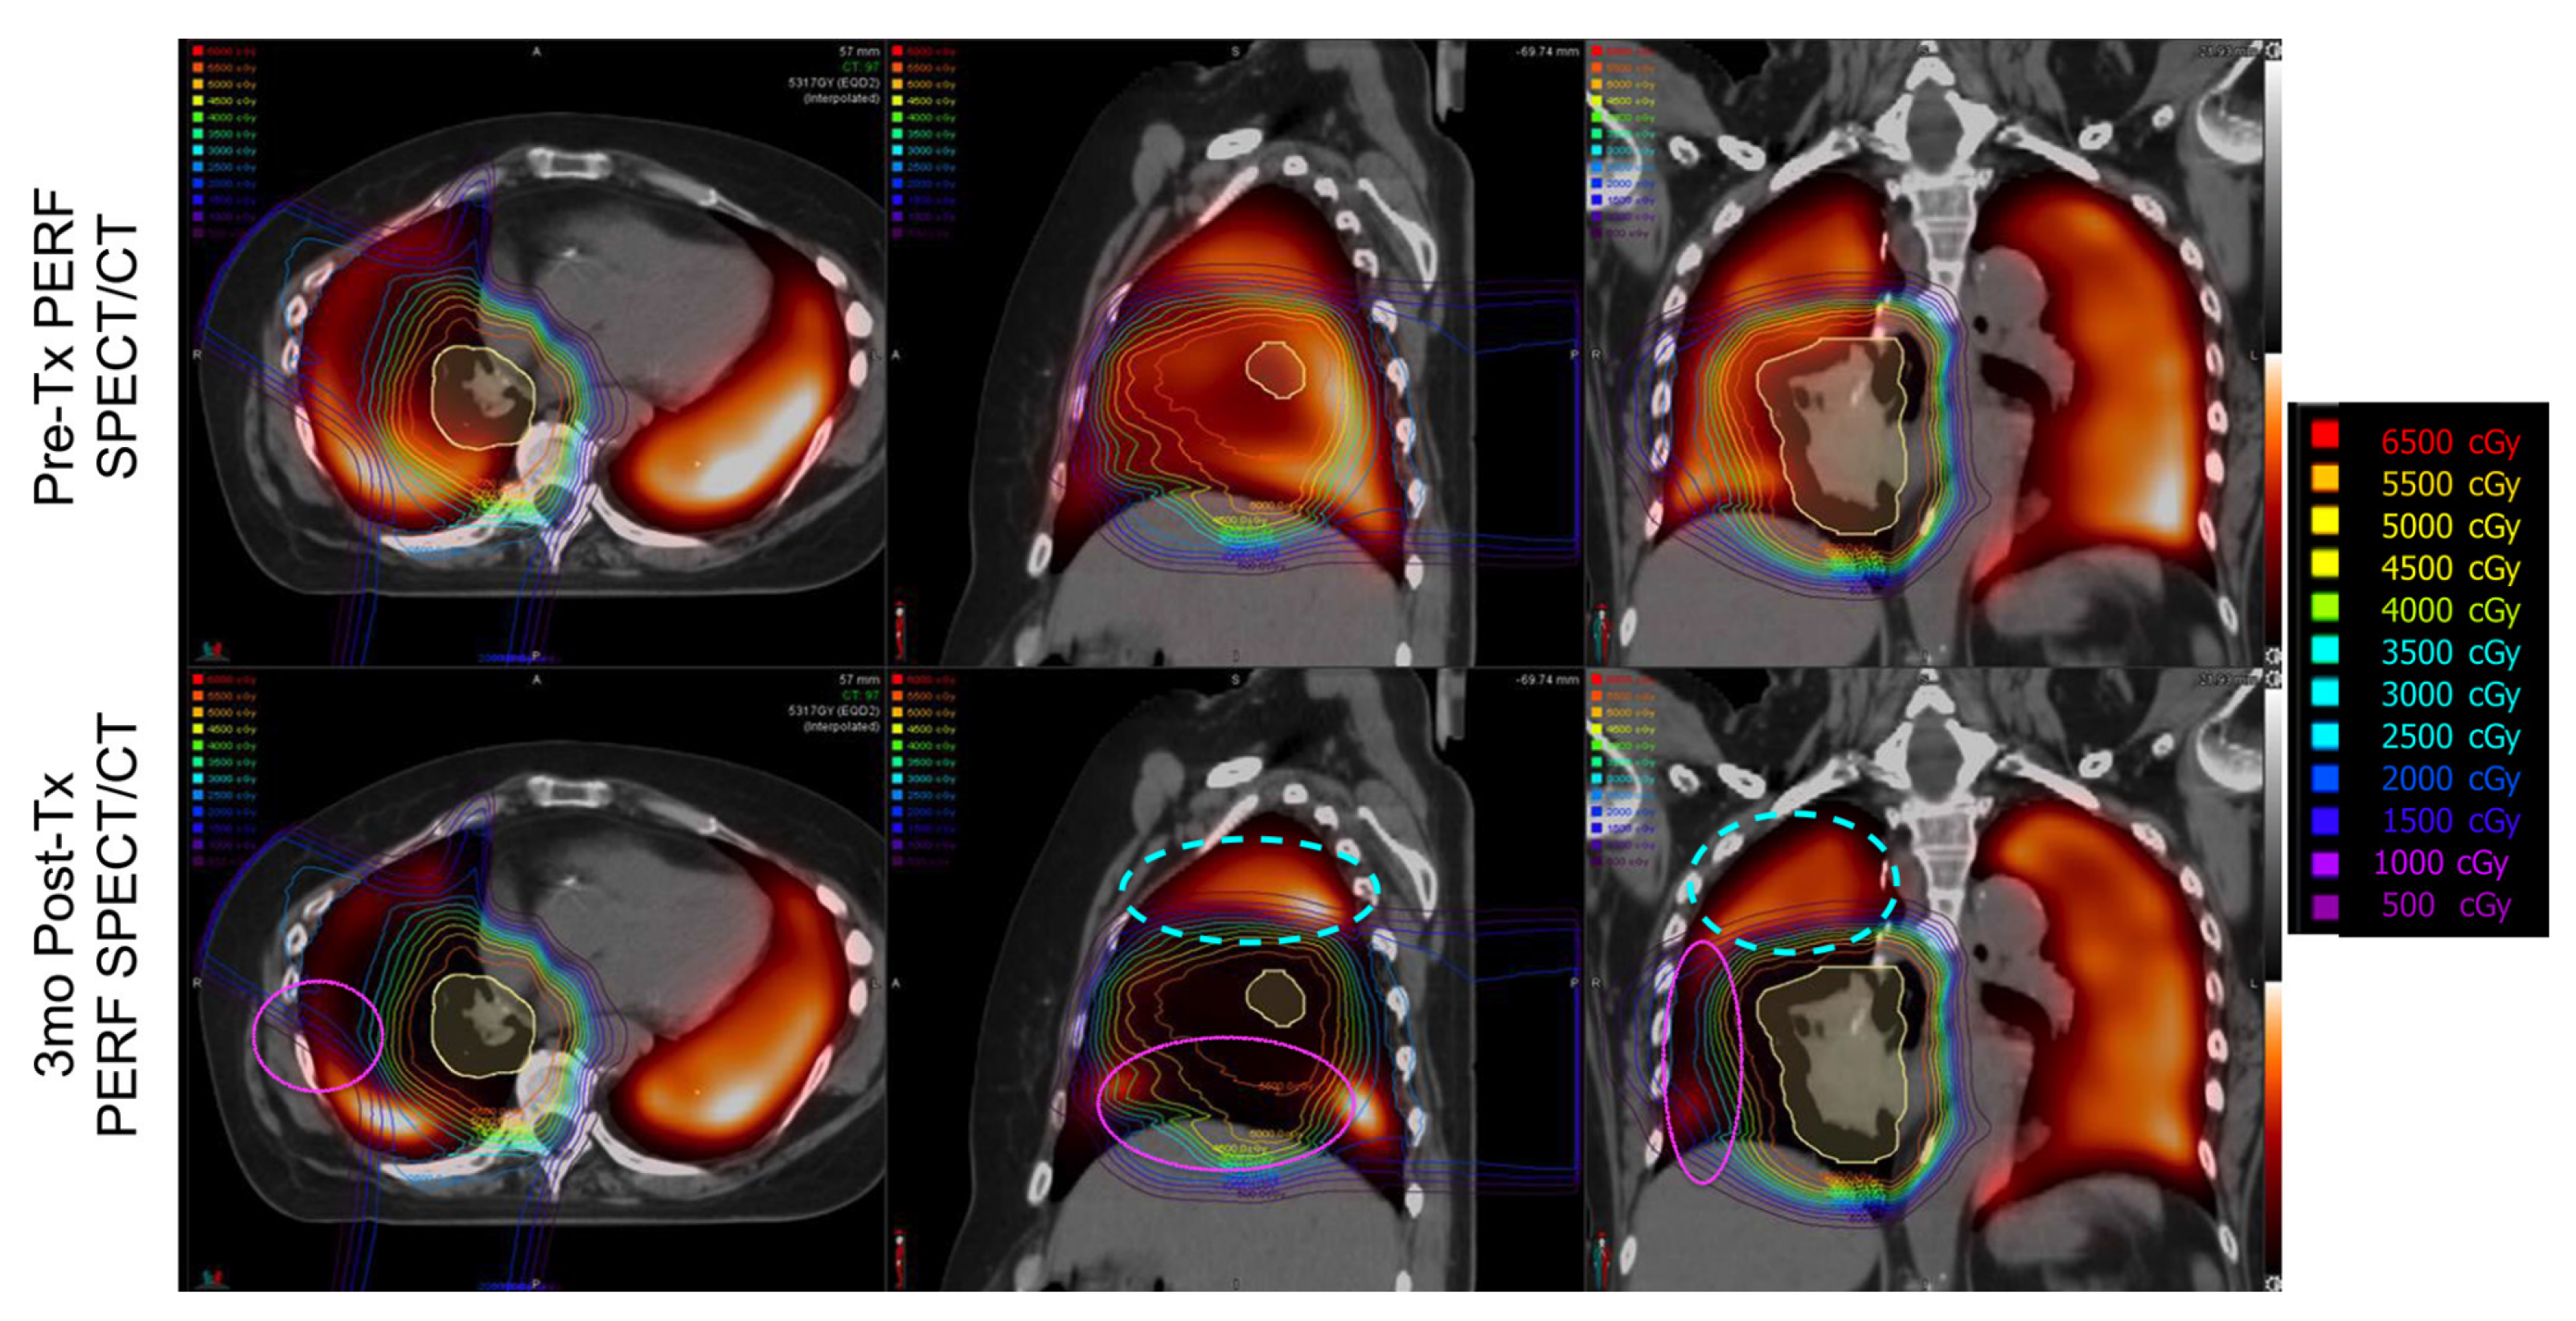
Imaging Results
4. Discussion
4.1. Changes in Kinetics
4.1.1. Ipsilateral Contours
4.1.2. Contralateral Lung
4.2. Use of a Novel Swine Model
4.3. Benefits of Dynamic Perfusion CT
4.4. Limitations of the Study
4.4.1. Partial Volume Effect and Registration Error
4.4.2. No Flow of Contrast in One Swine
4.4.3. Comment on “Not-Fed” Contours
4.4.4. Overestimation of Perfusion Reductions
4.5. Clinical Impact
5. Conclusions
Supplementary Materials
Author Contributions
Funding
Institutional Review Board Statement
Informed Consent Statement
Data Availability Statement
Acknowledgments
Conflicts of Interest
References
- American Cancer Society. 2022-Cancer-Facts-and-Figures; American Cancer Society: Atlanta, GA, USA, 2022. [Google Scholar]
- Bradley, J.D.; Paulus, R.; Komaki, R.; Masters, G.; Blumenschein, G.; Schild, S.; Bogart, J.; Hu, C.; Forster, K.; Magliocco, A.; et al. Standard-dose versus high-dose conformal radiotherapy with concurrent and consolidation carboplatin plus paclitaxel with or without cetuximab for patients with stage IIIA or IIIB non-small-cell lung cancer (RTOG 0617): A randomised, two-by-two factorial phase 3 study. Lancet Oncol. 2015, 16, 187–199. [Google Scholar] [CrossRef] [PubMed]
- Marks, L.; Yu, X.; Vujaskovic, Z.; Smalljr, W.; Folz, R.; Anscher, M. Radiation-induced lung injury. Semin. Radiat. Oncol. 2003, 13, 333–345. [Google Scholar] [CrossRef]
- Bates, E.L.; Bragg, C.M.; Wild, J.M.; Hatton, M.Q.; Ireland, R.H. Functional image-based radiotherapy planning for non-small cell lung cancer: A simulation study. Radiother. Oncol. 2009, 93, 32–36. [Google Scholar] [CrossRef] [PubMed]
- Patton, T.J.; Bayouth, J.E.; Bednarz, B.P.; Fain, S.B.; Reinhardt, J.M.; Smilowitz, J. Quantifying and Modeling Radiation Therapy-Induced Ventilation Changes and Investigating the Robustness of 4DCT-Based Functional Avoidance; Technical Report; The University of Wisconsin-Madison: Madison, WI, USA, 2018. [Google Scholar]
- Hoover, D.A.; Capaldi, D.P.; Sheikh, K.; Palma, D.A.; Rodrigues, G.B.; Dar, A.R.; Yu, E.; Dingle, B.; Landis, M.; Kocha, W.; et al. Functional lung avoidance for individualized radiotherapy (FLAIR): Study protocol for a randomized, double-blind clinical trial. BMC Cancer 2014, 14, 934. [Google Scholar] [CrossRef]
- Bayouth, J.; Wallat, E.; Wuschner, A.; Flakus, M.; Patton, T.; Shao, W.; Gerard, S.; Reinhardt, J.; Christensen, G.; Baschnagel, A. Longitudinal Changes in Lung Tissue Elasticity Following Radiation Therapy. Med. Phys. 2019, 46, E378. [Google Scholar]
- Mcdonald, S.; Rubin, P.; Phillips, T.L.; Andlawrence, F.A.C.R.; Marks, B. Injury to the Lung from Cancer Therapy: Clinical Syndromes, Measurable Endpoints, and Potential Scoring Systems. Int. J. Radiat. Oncol. Biol. Phys. 1995, 31, 1187–1203. [Google Scholar] [CrossRef]
- Mah, K.; Dyk, V. Quantitative Measurements of Human Lung Density Following Irradiation. Radiother. Oncol. 1988, 11, 169–179. [Google Scholar] [CrossRef]
- Mehta, V. Radiation pneumonitis and pulmonary fibrosis in non-small-cell lung cancer: Pulmonary function, prediction, and prevention. Int. J. Radiat. Oncol. Biol. Phys. 2005, 63, 5–24. [Google Scholar] [CrossRef]
- Graves, P.R.; Siddiqui, F.; Anscher, M.S.; Movsas, B. Radiation pulmonary toxicity: From mechanisms to management. Semin. Radiat. Oncol. 2010, 20, 201–207. [Google Scholar] [CrossRef] [PubMed]
- Koike, H.; Sueyoshi, E.; Sakamoto, I.; Uetani, M. Quantification of lung perfusion blood volume by dual-energy CT in patients with and without chronic obstructive pulmonary disease. J. Belg. Soc. Radiol. 2015, 99, 62–68. [Google Scholar] [CrossRef]
- Hopkins, S.R.; Wielpütz, M.O.; Kauczor, H.U. Imaging lung perfusion. J. Appl. Physiol. 2012, 113, 328–339. [Google Scholar] [CrossRef] [PubMed]
- Zhang, J.; Ma, J.; Zhou, S.; Hubbs, J.L.; Wong, T.Z.; Folz, R.J.; Evans, E.S.; Jaszczak, R.J.; Clough, R.; Marks, L.B. Radiation-Induced Reductions in Regional Lung Perfusion: 0.1–12 Year Data From a Prospective Clinical Study. Int. J. Radiat. Oncol. Biol. Phys. 2010, 76, 425–432. [Google Scholar] [CrossRef] [PubMed]
- Siva, S.; Thomas, R.; Callahan, J.; Hardcastle, N.; Pham, D.; Kron, T.; Hicks, R.J.; MacManus, M.P.; Ball, D.L.; Hofman, M.S. High-resolution pulmonary ventilation and perfusion PET/CT allows for functionally adapted intensity modulated radiotherapy in lung cancer. Radiother. Oncol. 2015, 115, 157–162. [Google Scholar] [CrossRef] [PubMed]
- Farr, K.P.; Møller, D.S.; Khalil, A.A.; Kramer, S.; Morsing, A.; Grau, C. Loss of lung function after chemo-radiotherapy for NSCLC measured by perfusion SPECT/CT: Correlation with radiation dose and clinical morbidity. Acta Oncol. 2015, 54, 1350–1354. [Google Scholar] [CrossRef]
- Faught, A.M.; Miyasaka, Y.; Kadoya, N.; Castillo, R.; Castillo, E.; Vinogradskiy, Y.; Yamamoto, T. Evaluating the Toxicity Reduction With Computed Tomographic Ventilation Functional Avoidance Radiation Therapy. Int. J. Radiat. Oncol. 2017, 99, 325–333. [Google Scholar] [CrossRef]
- Vinogradskiy, Y.; Diot, Q.; Kavanagh, B.; Schefter, T.; Gaspar, L.; Miften, M. Spatial and dose-response analysis of fibrotic lung changes after stereotactic body radiation therapy. Med. Phys. 2013, 40, 081712. [Google Scholar] [CrossRef]
- Yamamoto, T.; Kabus, S.; Klinder, T.; Lorenz, C.; von Berg, J.; Blaffert, T.; Loo, B.W.; Keall, P.J. Investigation of four-dimensional computed tomography-based pulmonary ventilation imaging in patients with emphysematous lung regions. Phys. Med. Biol. 2011, 56, 2279. [Google Scholar] [CrossRef]
- Shioyama, Y.; Jang, S.Y.; Liu, H.H.; Guerrero, T.; Wang, X.; Gayed, I.W.; Erwin, W.D.; Liao, Z.; Chang, J.Y.; Jeter, M.; et al. Preserving Functional Lung Using Perfusion Imaging and Intensity-Modulated Radiation Therapy for Advanced-Stage Non–Small Cell Lung Cancer. Int. J. Radiat. Oncol. 2007, 68, 1349–1358. [Google Scholar] [CrossRef]
- Yaremko, B.P.; Guerrero, T.M.; Noyola-Martinez, J.; Guerra, R.; Lege, D.G.; Nguyen, L.T.; Balter, P.A.; Cox, J.D.; Komaki, R. Reduction of Normal Lung Irradiation in Locally Advanced Non-Small-Cell Lung Cancer Patients, Using Ventilation Images for Functional Avoidance. Int. J. Radiat. Oncol. 2007, 68, 562–571. [Google Scholar] [CrossRef]
- El-Baz, A.; Suri, J.S. Lung Imaging and Computer Aided Diagnosi; CRC Press: Boca Raton, FL, USA, 2011. [Google Scholar]
- Vicente, E.; Modiri, A.; Kipritidis, J.; Hagan, A.; Yu, K.; Wibowo, H.; Yan, Y.; Owen, D.R.; Matuszak, M.M.; Mohindra, P.; et al. Functionally weighted airway sparing (FWAS): A functional avoidance method for preserving post-treatment ventilation in lung radiotherapy. Phys. Med. Biol. 2020, 65, 165010. [Google Scholar] [CrossRef]
- Wuschner, A.E.; Wallat, E.M.; Flakus, M.J.; Shanmuganayagam, D.; Meudt, J.; Christensen, G.E.; Reinhardt, J.M.; Miller, J.R.; Lawless, M.J.; Baschnagel, A.M.; et al. Radiation-induced Hounsfield unit change correlates with dynamic CT perfusion better than 4DCT-based ventilation measures in a novel-swine model. Sci. Rep. 2021, 11, 13156. [Google Scholar] [CrossRef] [PubMed]
- Farr, K.P.; Khalil, A.A.; Møller, D.S.; Bluhme, H.; Kramer, S.; Morsing, A.; Grau, C. Time and dose-related changes in lung perfusion after definitive radiotherapy for NSCLC. Radiother. Oncol. 2018, 126, 307–311. [Google Scholar] [CrossRef] [PubMed]
- Thomas, H.M.T.; Zeng, J.; Lee, H.J., Jr.; Sasidharan, B.K.; Kinahan, P.E.; Miyaoka, R.S.; Vesselle, H.J.; Rengan, R.; Bowen, S.R. Comparison of regional lung perfusion response on longitudinal MAA SPECT/CT in lung cancer patients treated with and without functional tissue-avoidance radiation therapy. Br. J. Radiol. 2019, 92, 20190174. [Google Scholar] [CrossRef]
- Kazemzadeh, N.; Modiri, A.; Samanta, S.; Yan, Y.; Bland, R.; Rozario, T.; Wibowo, H.; Iyengar, P.; Ahn, C.; Timmerman, R.; et al. Virtual Bronchoscopy-Guided Treatment Planning to Map and Mitigate Radiation-Induced Airway Injury in Lung SAbR. Int. J. Radiat. Oncol. 2018, 102, 210–218. [Google Scholar] [CrossRef]
- Wallat, E.M.; Wuschner, A.E.; Flakus, M.J.; Christensen, G.E.; Reinhardt, J.M.; Shanmuganayagam, D.; Bayouth, J.E. Radiation-induced airway changes and downstream ventilation decline in a swine model. Biomed. Phys. Eng. Express 2021, 7, 065039. [Google Scholar] [CrossRef]
- Vicente, E.M.; Modiri, A.; Kipritidis, J.; Yu, K.C.; Sun, K.; Cammin, J.; Gopal, A.; Xu, J.; Mossahebi, S.; Hagan, A.; et al. Combining Serial and Parallel Functionality in Functional Lung Avoidance Radiation Therapy. Int. J. Radiat. Oncol. Biol. Phys. 2022, 113, 456–468. [Google Scholar] [CrossRef]
- Ireland, R.; Tahir, B.; Wild, J.; Lee, C.; Hatton, M. Functional Image-guided Radiotherapy Planning for Normal Lung Avoidance. Clin. Oncol. 2016, 28, 695–707. [Google Scholar] [CrossRef]
- Hopewell, J.W.; Rezvani, M.; Moustafa, H.F. The pig as a model for the study of radiation effects on the lung. Int. J. Radiat. Biol. 2000, 76, 447–452. [Google Scholar] [CrossRef]
- Lee, J.G.; Park, S.; Bae, C.H.; Jang, W.S.; Lee, S.J.; Lee, D.N.; Myung, J.K.; Kim, C.H.; Jin, Y.W.; Lee, S.S.; et al. Development of a minipig model for lung injury induced by a single high-dose radiation exposure and evaluation with thoracic computed tomography. J. Radiat. Res. 2016, 57, 201–209. [Google Scholar] [CrossRef]
- Williams, J.P.; Brown, S.L.; Georges, G.E.; Hauer-Jensen, M.; Hill, R.P.; Huser, A.K.; Kirsch, D.G.; MacVittie, T.J.; Mason, K.A.; Medhora, M.M.; et al. Animal Models for Medical Countermeasures to Radiation Exposure. Radiat. Res. 2010, 173, 557–578. [Google Scholar] [CrossRef]
- Schomberg, D.T.; Tellez, A.; Meudt, J.J.; Brady, D.A.; Dillon, K.N.; Arowolo, F.K.; Wicks, J.; Rousselle, S.D.; Shanmuganayagam, D. Miniature Swine for Preclinical Modeling of Complexities of Human Disease for Translational Scientific Discovery and Accelerated Development of Therapies and Medical Devices. Toxicol. Pathol. 2016, 44, 299–314. [Google Scholar] [CrossRef]
- Reed, J.; Krueger, C.; Shanmuganayagam, D.; Crenshaw, T.; Reichert, J.; Parrish, J. Wisconsin Miniature Swine; Technical Report; University of Wisconsin-Madison: Madison, WI, USA, 2018. [Google Scholar]
- Schnarr, E.; Beneke, M.; Casey, D.; Chao, E.; Chappelow, J.; Cox, A.; Henderson, D.; Jordan, P.; Lessard, E.; Lucas, D.; et al. Feasibility of real-time motion management with helical tomotherapy. Med. Phys. 2018, 45, 1329–1337. [Google Scholar] [CrossRef] [PubMed]
- Cao, K.; Ding, K.; Reinhardt, J.M.; Christensen, G.E. Improving Intensity-Based Lung CT Registration Accuracy Utilizing Vascular Information. Int. J. Biomed. Imaging 2012, 2012, 1–17. [Google Scholar] [CrossRef]
- Yin, Y.; Hoffman, E.A.; Lin, C.L. Mass preserving nonrigid registration of CT lung images using cubic B-spline. Med. Phys. 2009, 36, 4213–4222. [Google Scholar] [CrossRef] [PubMed]
- Mathworks. Trapz Documentation; Mathworks: Cleveland, OH, USA, 2006. [Google Scholar]
- Borges, J.B.; Cronin, J.N.; Crockett, D.C.; Hedenstierna, G.; Larsson, A.; Formenti, F. Real-time effects of PEEP and tidal volume on regional ventilation and perfusion in experimental lung injury. Intensive Care Med. Exp. 2020, 8, 10. [Google Scholar] [CrossRef] [PubMed]
- Bezjak, A.; Paulus, R.; Gaspar, L.E.; Timmerman, R.D.; Straube, W.L.; Ryan, W.F.; Garces, Y.I.; Pu, A.T.; Singh, A.K.; Videtic, G.M.; et al. Safety and Efficacy of a Five-Fraction Stereotactic Body Radiotherapy Schedule for Centrally Located Non-Small-Cell Lung Cancer: NRG Oncology/RTOG 0813 Trial. J. Clin. Oncol. 2019, 37, 1316–1325. [Google Scholar] [CrossRef] [PubMed]


| Contour Name | Description |
|---|---|
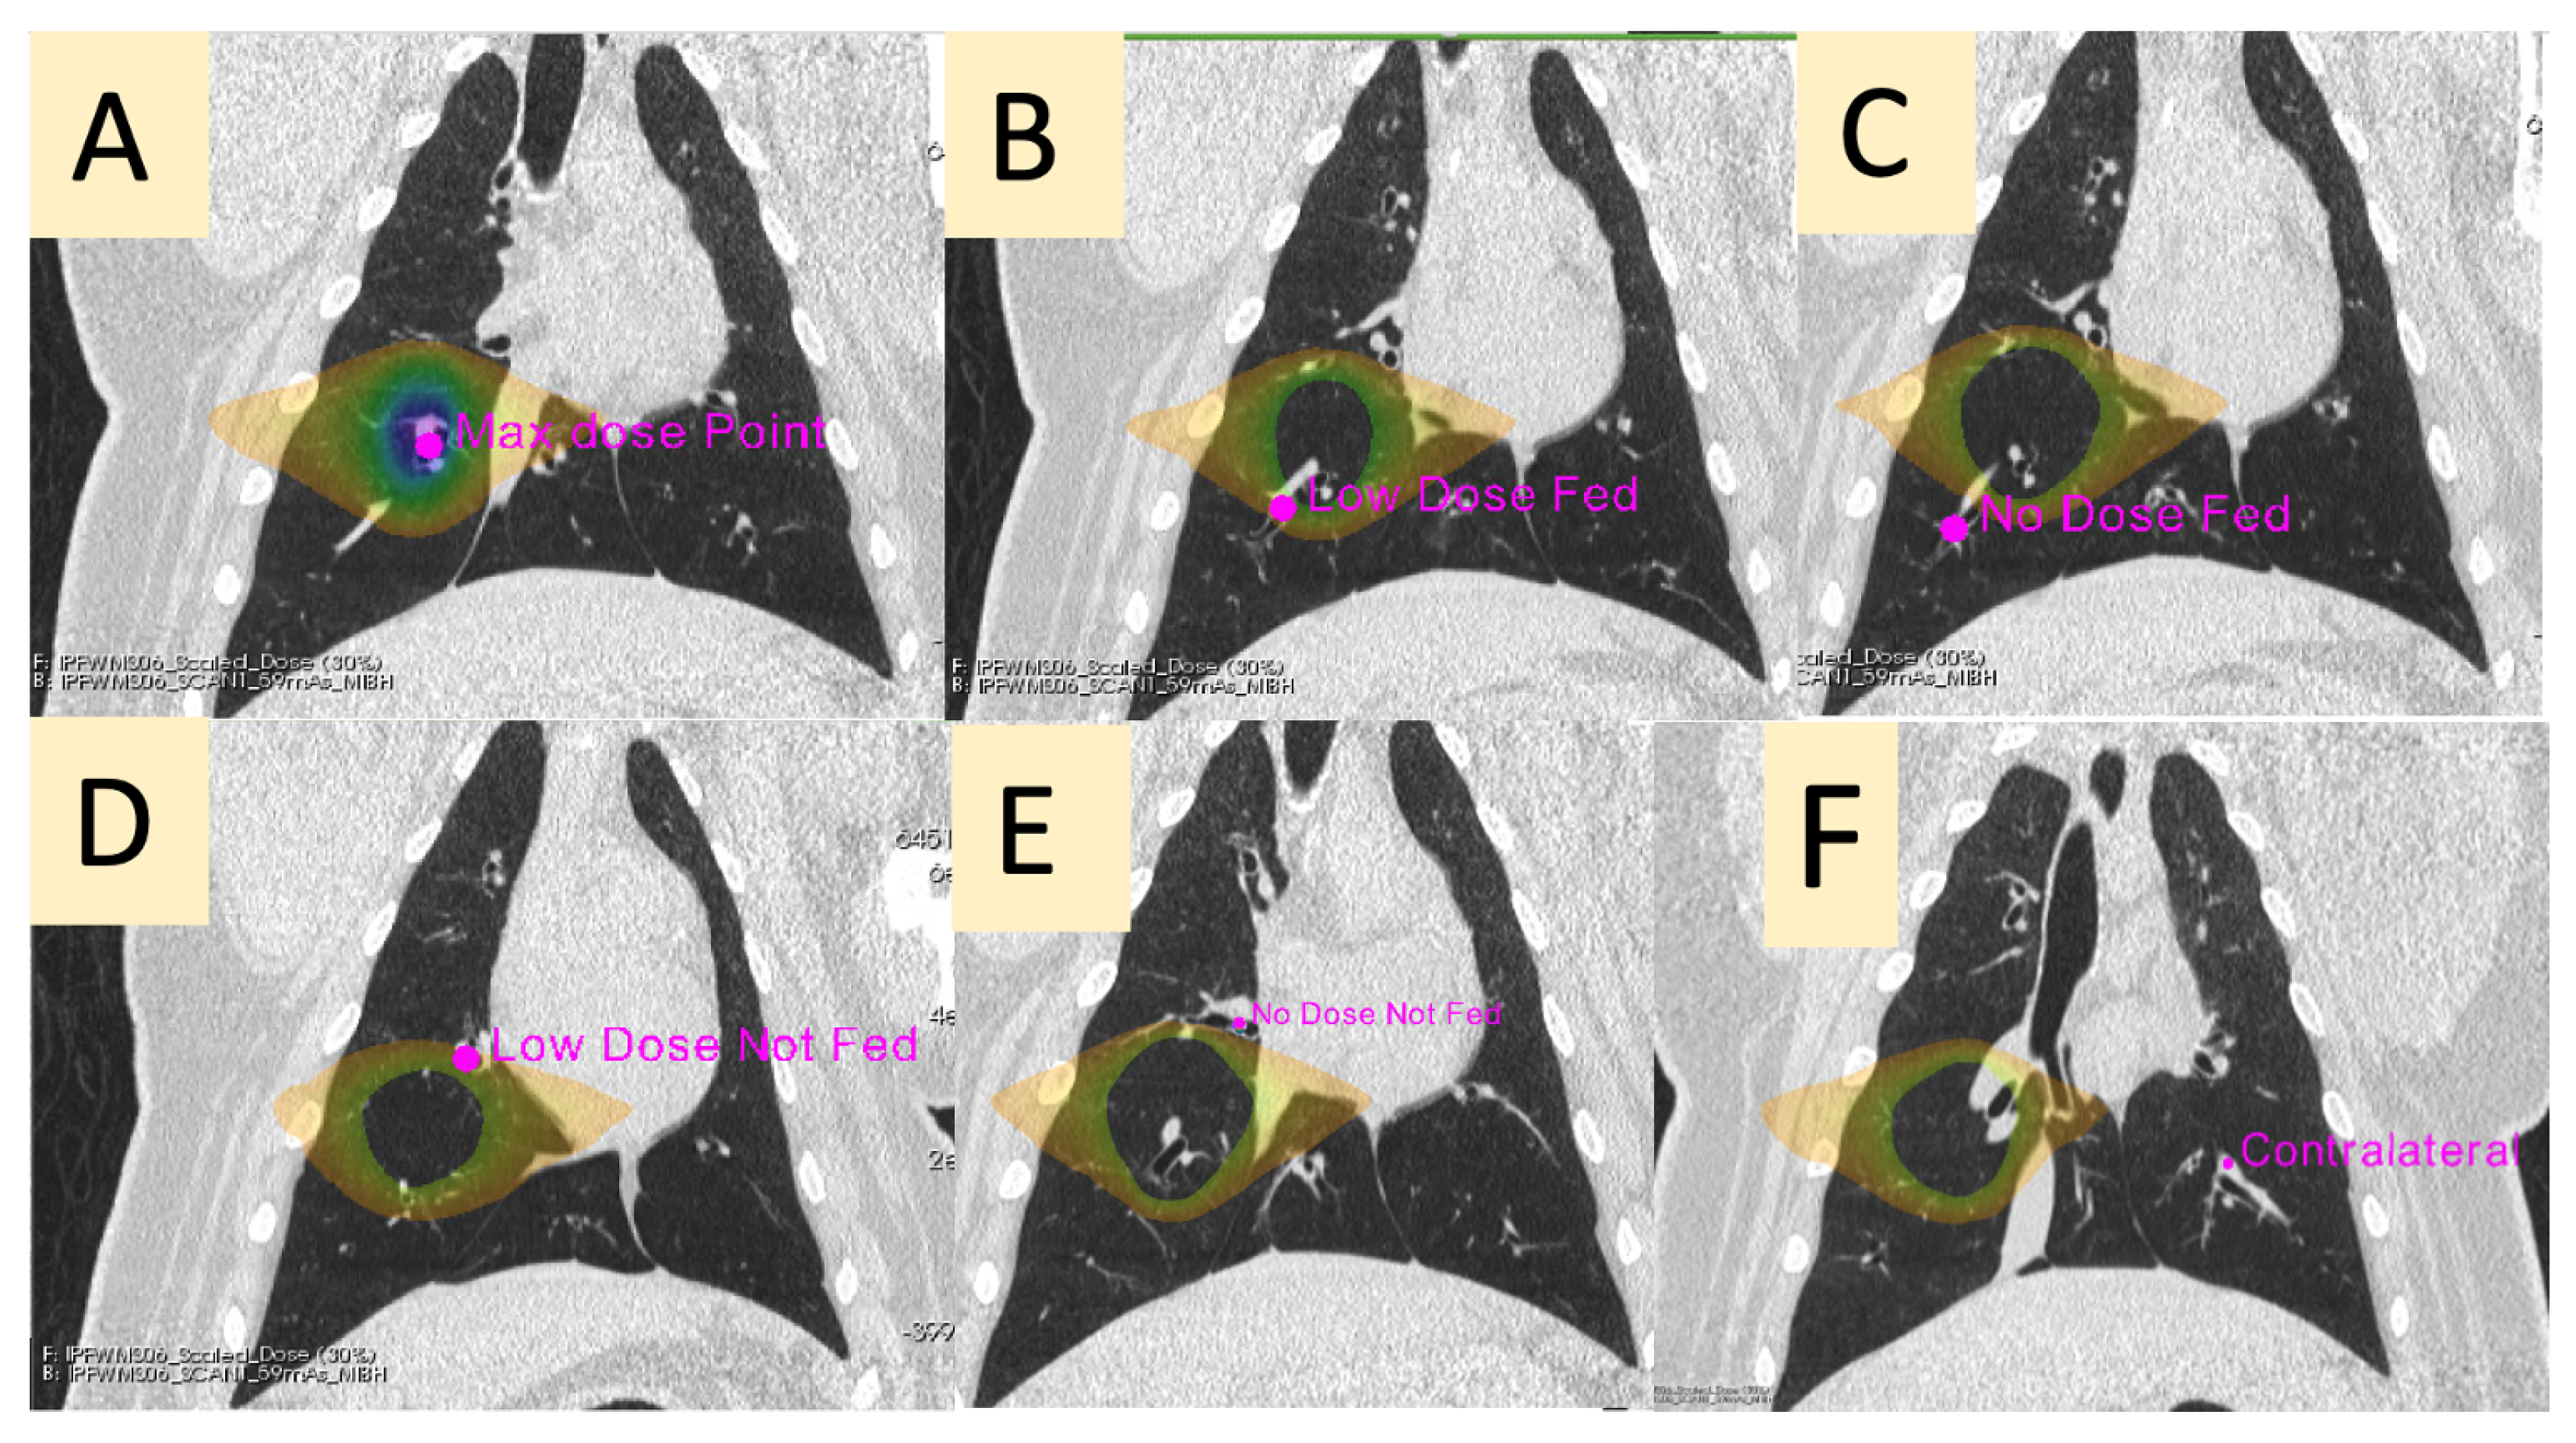
| Max Dose (MD) | The vessel contained in the PTV |
| Low-Dose Fed (LDF) | A vessel in the ipsilateral lung receiving between 5 and 20 Gy that branches downstream of the vessel irradiated to the max dose |
| No-Dose Fed (NDF) | A vessel in the ipsilateral lung receiving less than 5 Gy that branches downstream of the vessel irradiated to the max dose |
| Low-Dose Not-Fed (LDNF) | A vessel in the ipsilateral lung receiving between 5 and 20 Gy that does not branch from the vessel irradiated to the max dose |
| No-Dose Not-Fed (NDNF) | A vessel in the ipsilateral lung receiving less than 5 Gy that does not branch from the vessel irradiated to the max dose |
| Contralateral (CON) | A vessel in the contralateral lung (received no dose) at the approximate mirrored location as the point of max dose in the ipsilateral lung |
| Max Rise | Max Value | Baseline to Baseline Time | Baseline to Baseline Difference | Slope Up | Slope Down | Area under Curve | |
|---|---|---|---|---|---|---|---|
| Max Dose (Ipsilateral) | −40.7% (16.1%) * | −41.7% (18.1%) * | −26.3% (16.8%) * | −68.5% (23.1%) * | −43.0% (16.3%) * | −47.1% (19.2%) * | −56.0% (21.0%) * |
| Low-Dose Fed (Ipsilateral) | −42.6% (33.4%) * | 13.6% (201.6%) | −3.9% (32.9%) | −125.0% (99.1%) | −47.7% (34.0%) * | −66.4% (25.9%) * | −65.0% (24.0%) * |
| No-Dose Fed (Ipsilateral) | −28.4% (47.8%) | −128.1% (232.6%) | −20.8% (32.0%) | −32.7% (9.7%) * | −50.6% (33.3%) * | −36.7% (42.4%) * | −55.0% (27.0%) * |
| Low-Dose Not-Fed (Ipsilateral) | −24.3% (52.6%) | −14.9% (68.8%) | −9.7% (43.9%) | −46.9% (41.0%) | 80.3% (212.4%) | −38.6% (41.4%) | −36.0% (54.0%) |
| No-Dose Not-Fed (Ipsilateral) | −32.0% (32.0%) | −29.4% (35.3%) | 3.1% (38.4%) | −47.7% (18.0%) * | 79.9% (160.1%) | −1.3% (91.8%) | −24.0% (23%) |
| Contralateral | 5.8% (15.2 %) | 2.0% (12.1%) | −3.2% (33.2%) | −3.1% (5.0%) | 40.5% (114.9%) | 17.9% (40.1%) | −5.0% (25.0%) |
Publisher’s Note: MDPI stays neutral with regard to jurisdictional claims in published maps and institutional affiliations. |
© 2022 by the authors. Licensee MDPI, Basel, Switzerland. This article is an open access article distributed under the terms and conditions of the Creative Commons Attribution (CC BY) license (https://creativecommons.org/licenses/by/4.0/).
Share and Cite
Wuschner, A.E.; Flakus, M.J.; Wallat, E.M.; Reinhardt, J.M.; Shanmuganayagam, D.; Christensen, G.E.; Bayouth, J.E. Measuring Indirect Radiation-Induced Perfusion Change in Fed Vasculature Using Dynamic Contrast CT. J. Pers. Med. 2022, 12, 1254. https://doi.org/10.3390/jpm12081254
Wuschner AE, Flakus MJ, Wallat EM, Reinhardt JM, Shanmuganayagam D, Christensen GE, Bayouth JE. Measuring Indirect Radiation-Induced Perfusion Change in Fed Vasculature Using Dynamic Contrast CT. Journal of Personalized Medicine. 2022; 12(8):1254. https://doi.org/10.3390/jpm12081254
Chicago/Turabian StyleWuschner, Antonia E., Mattison J. Flakus, Eric M. Wallat, Joseph M. Reinhardt, Dhanansayan Shanmuganayagam, Gary E. Christensen, and John E. Bayouth. 2022. "Measuring Indirect Radiation-Induced Perfusion Change in Fed Vasculature Using Dynamic Contrast CT" Journal of Personalized Medicine 12, no. 8: 1254. https://doi.org/10.3390/jpm12081254