
Prediction of Vaccine Response and Development of a Personalized Anti-SARS-CoV-2 Vaccination Strategy in Kidney Transplant Recipients: Results from a Large Single-Center Study

 , ,
, ,
Abstract
:1. Introduction
2. Patients and Methods
2.1. Study Population
2.2. Monitoring of Serological Response and Vaccination Strategy
2.3. Statistical Analysis
3. Results
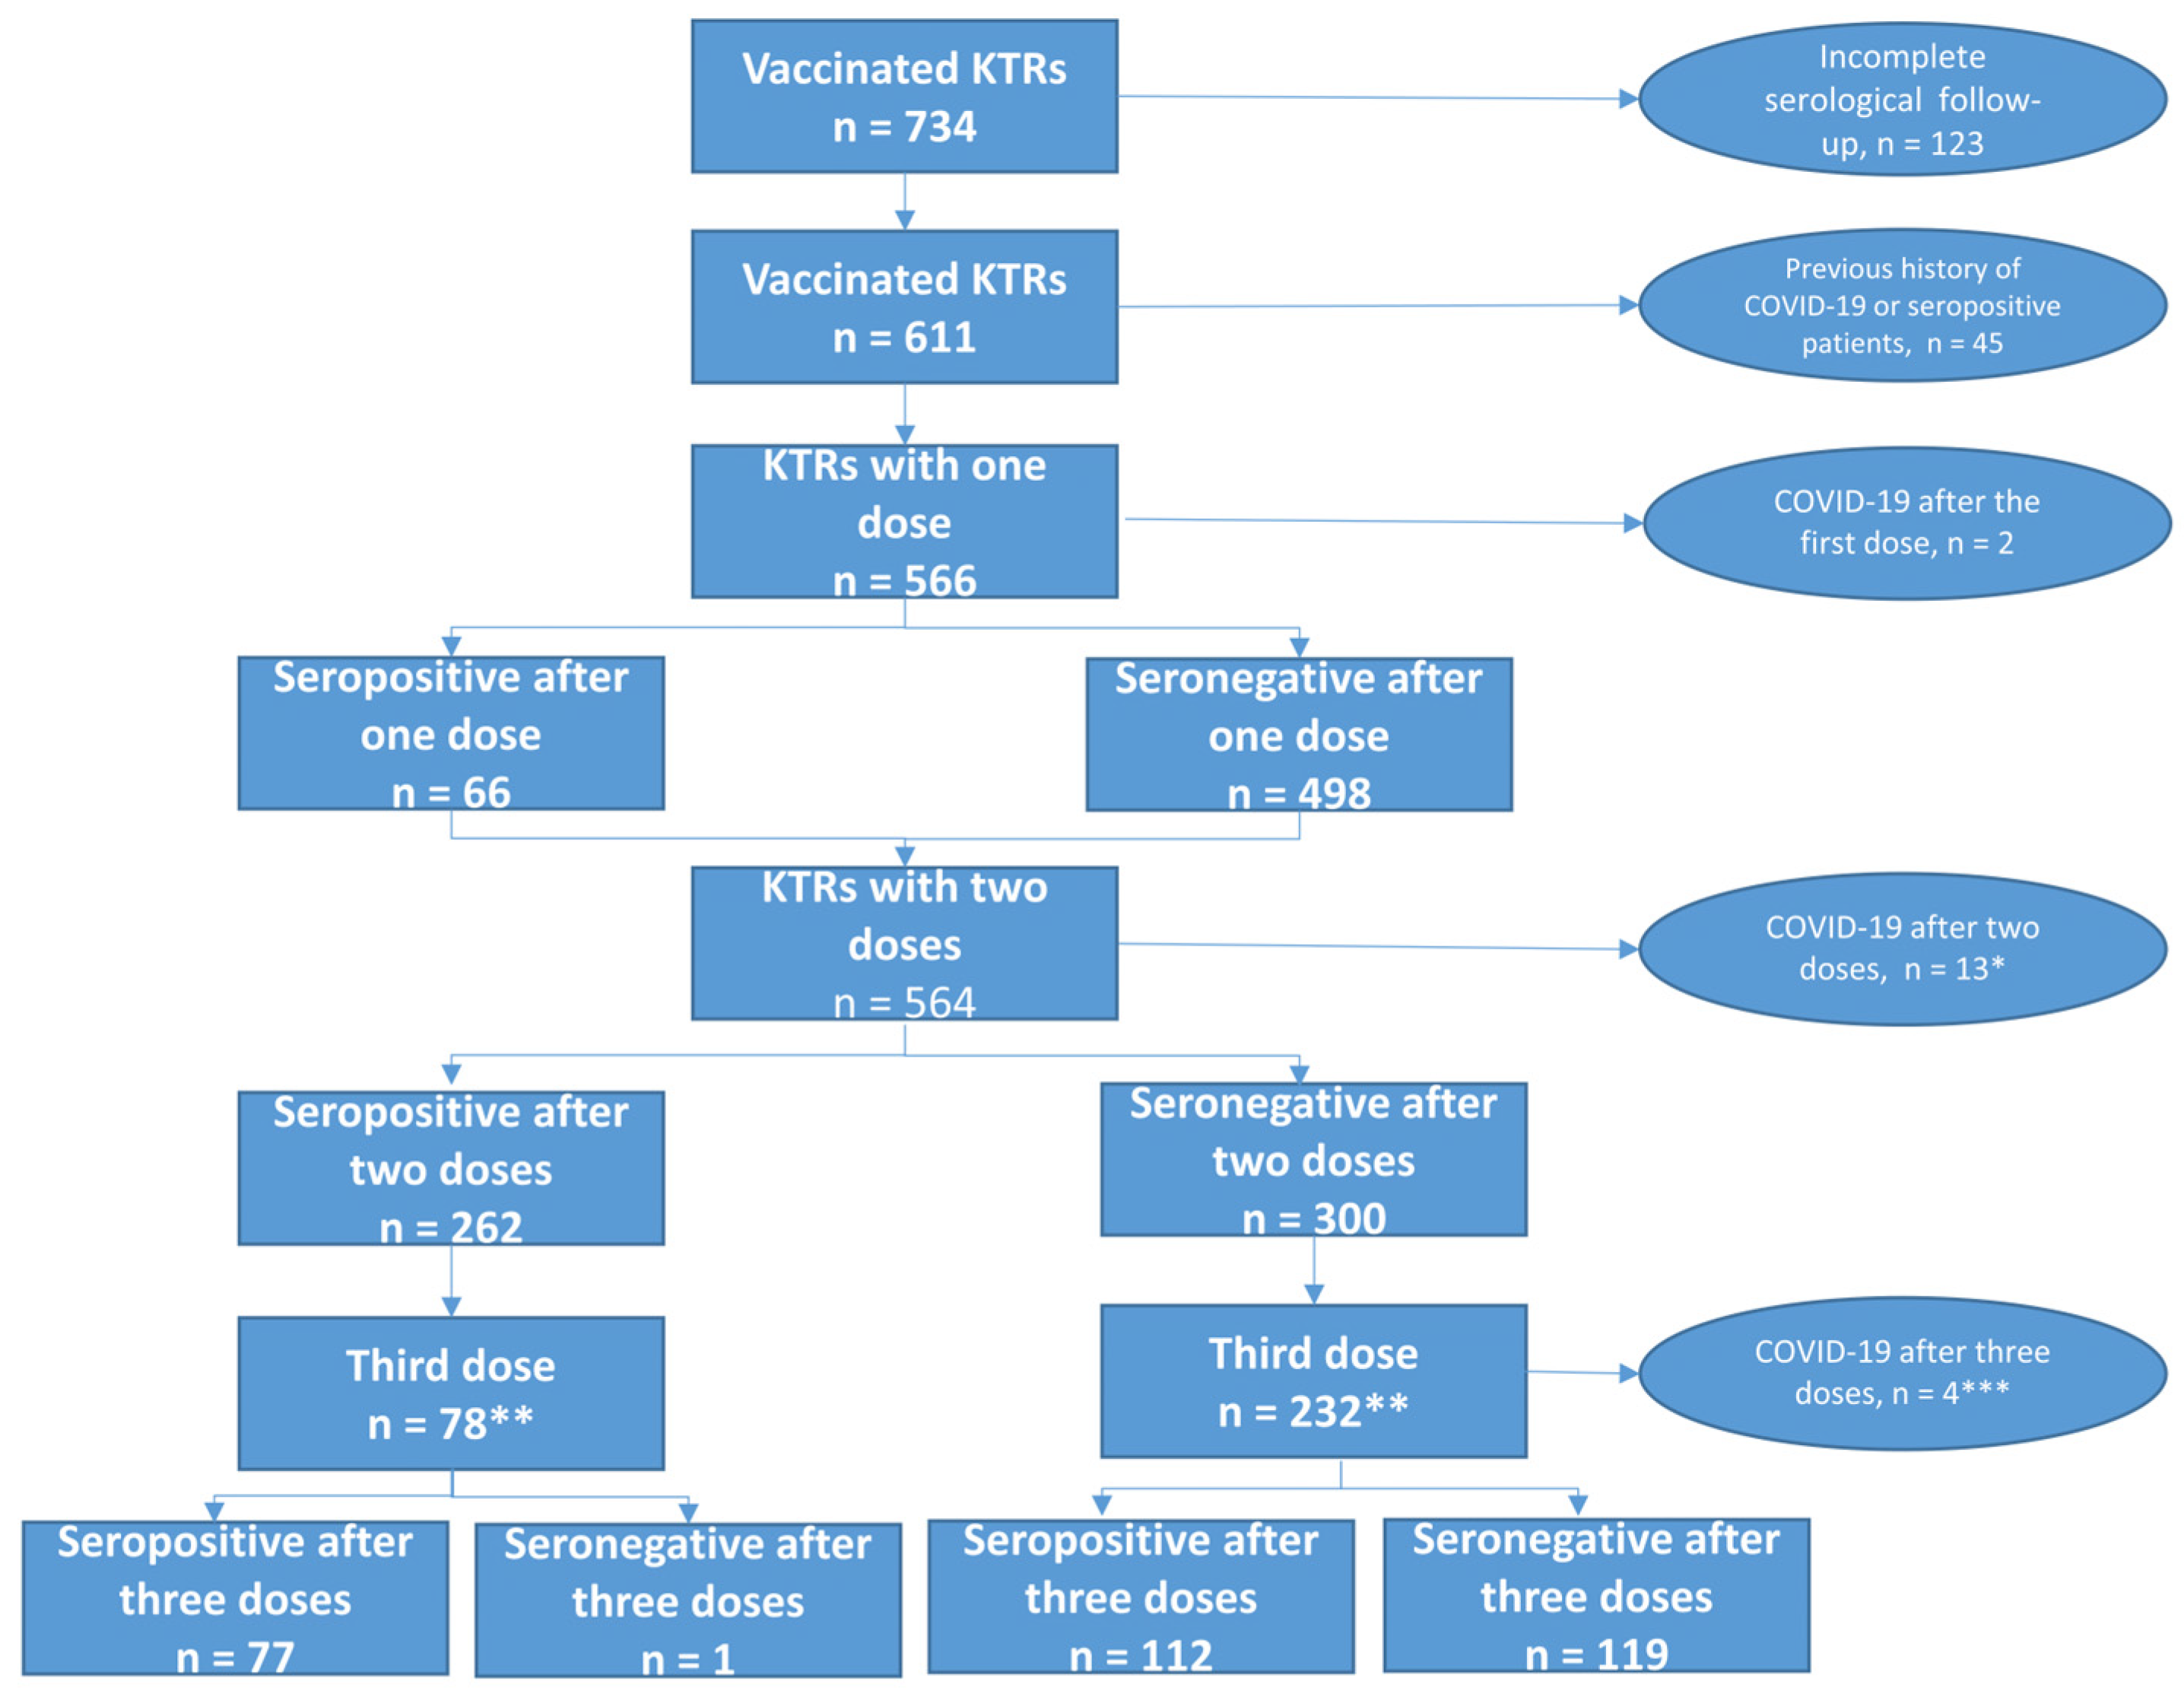
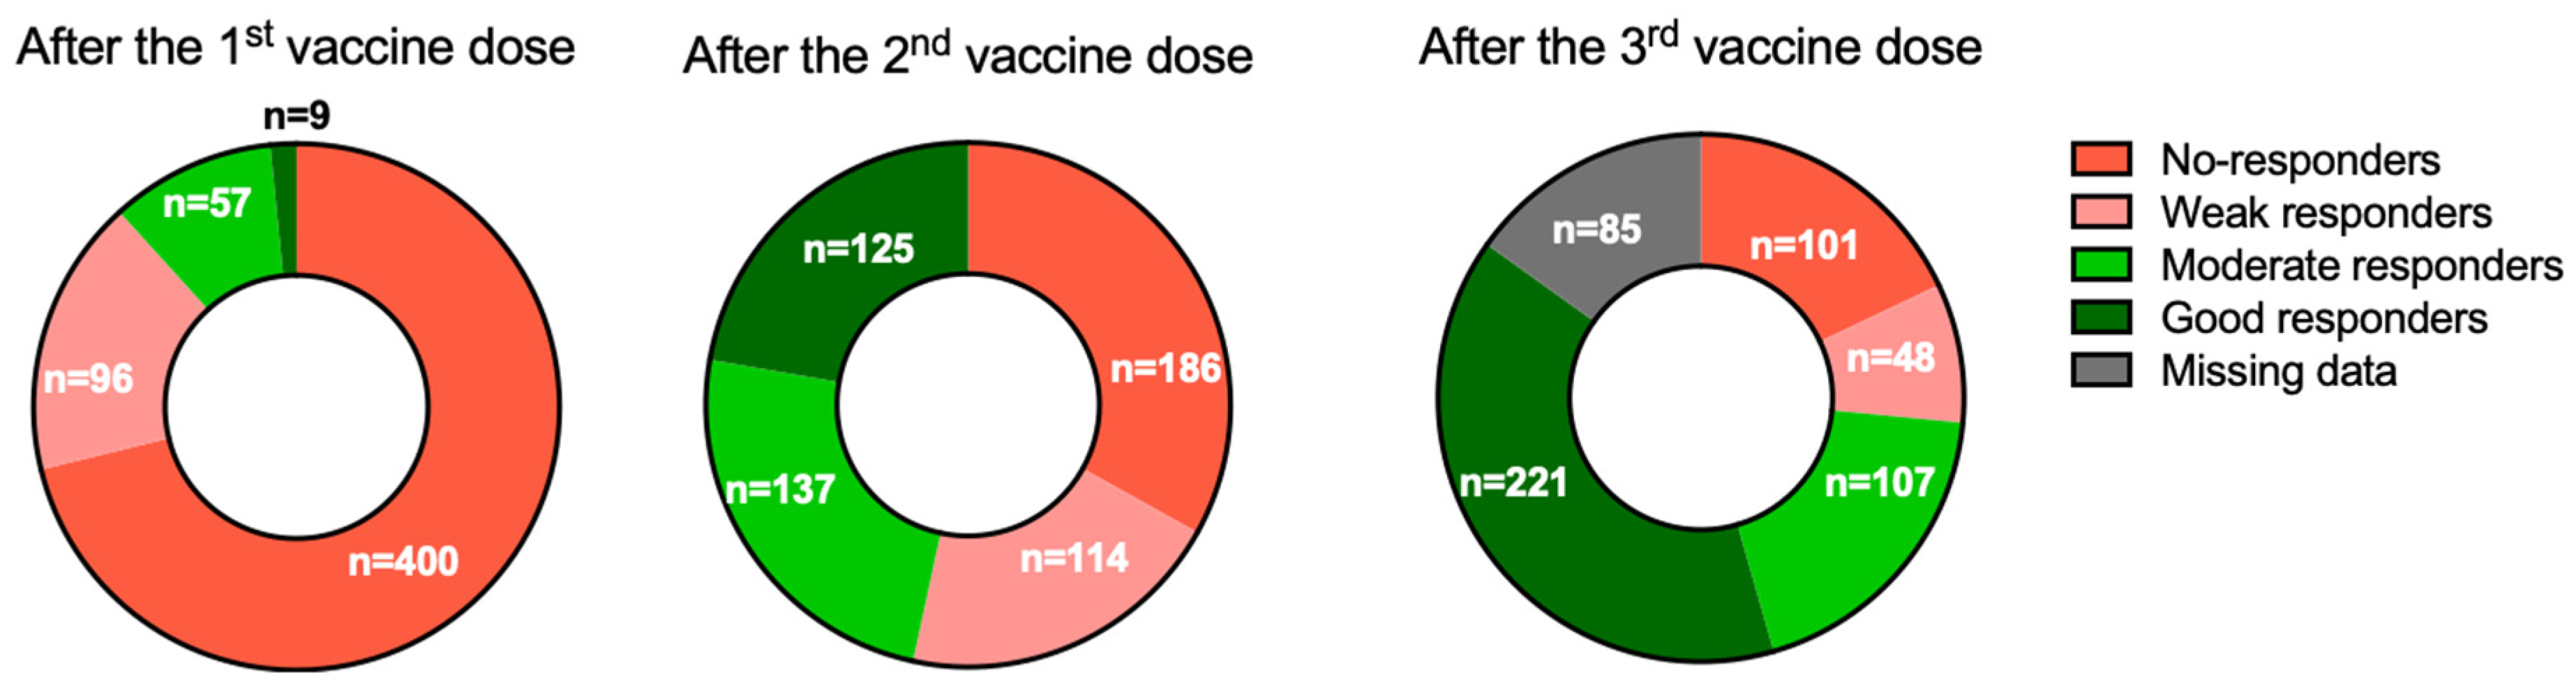
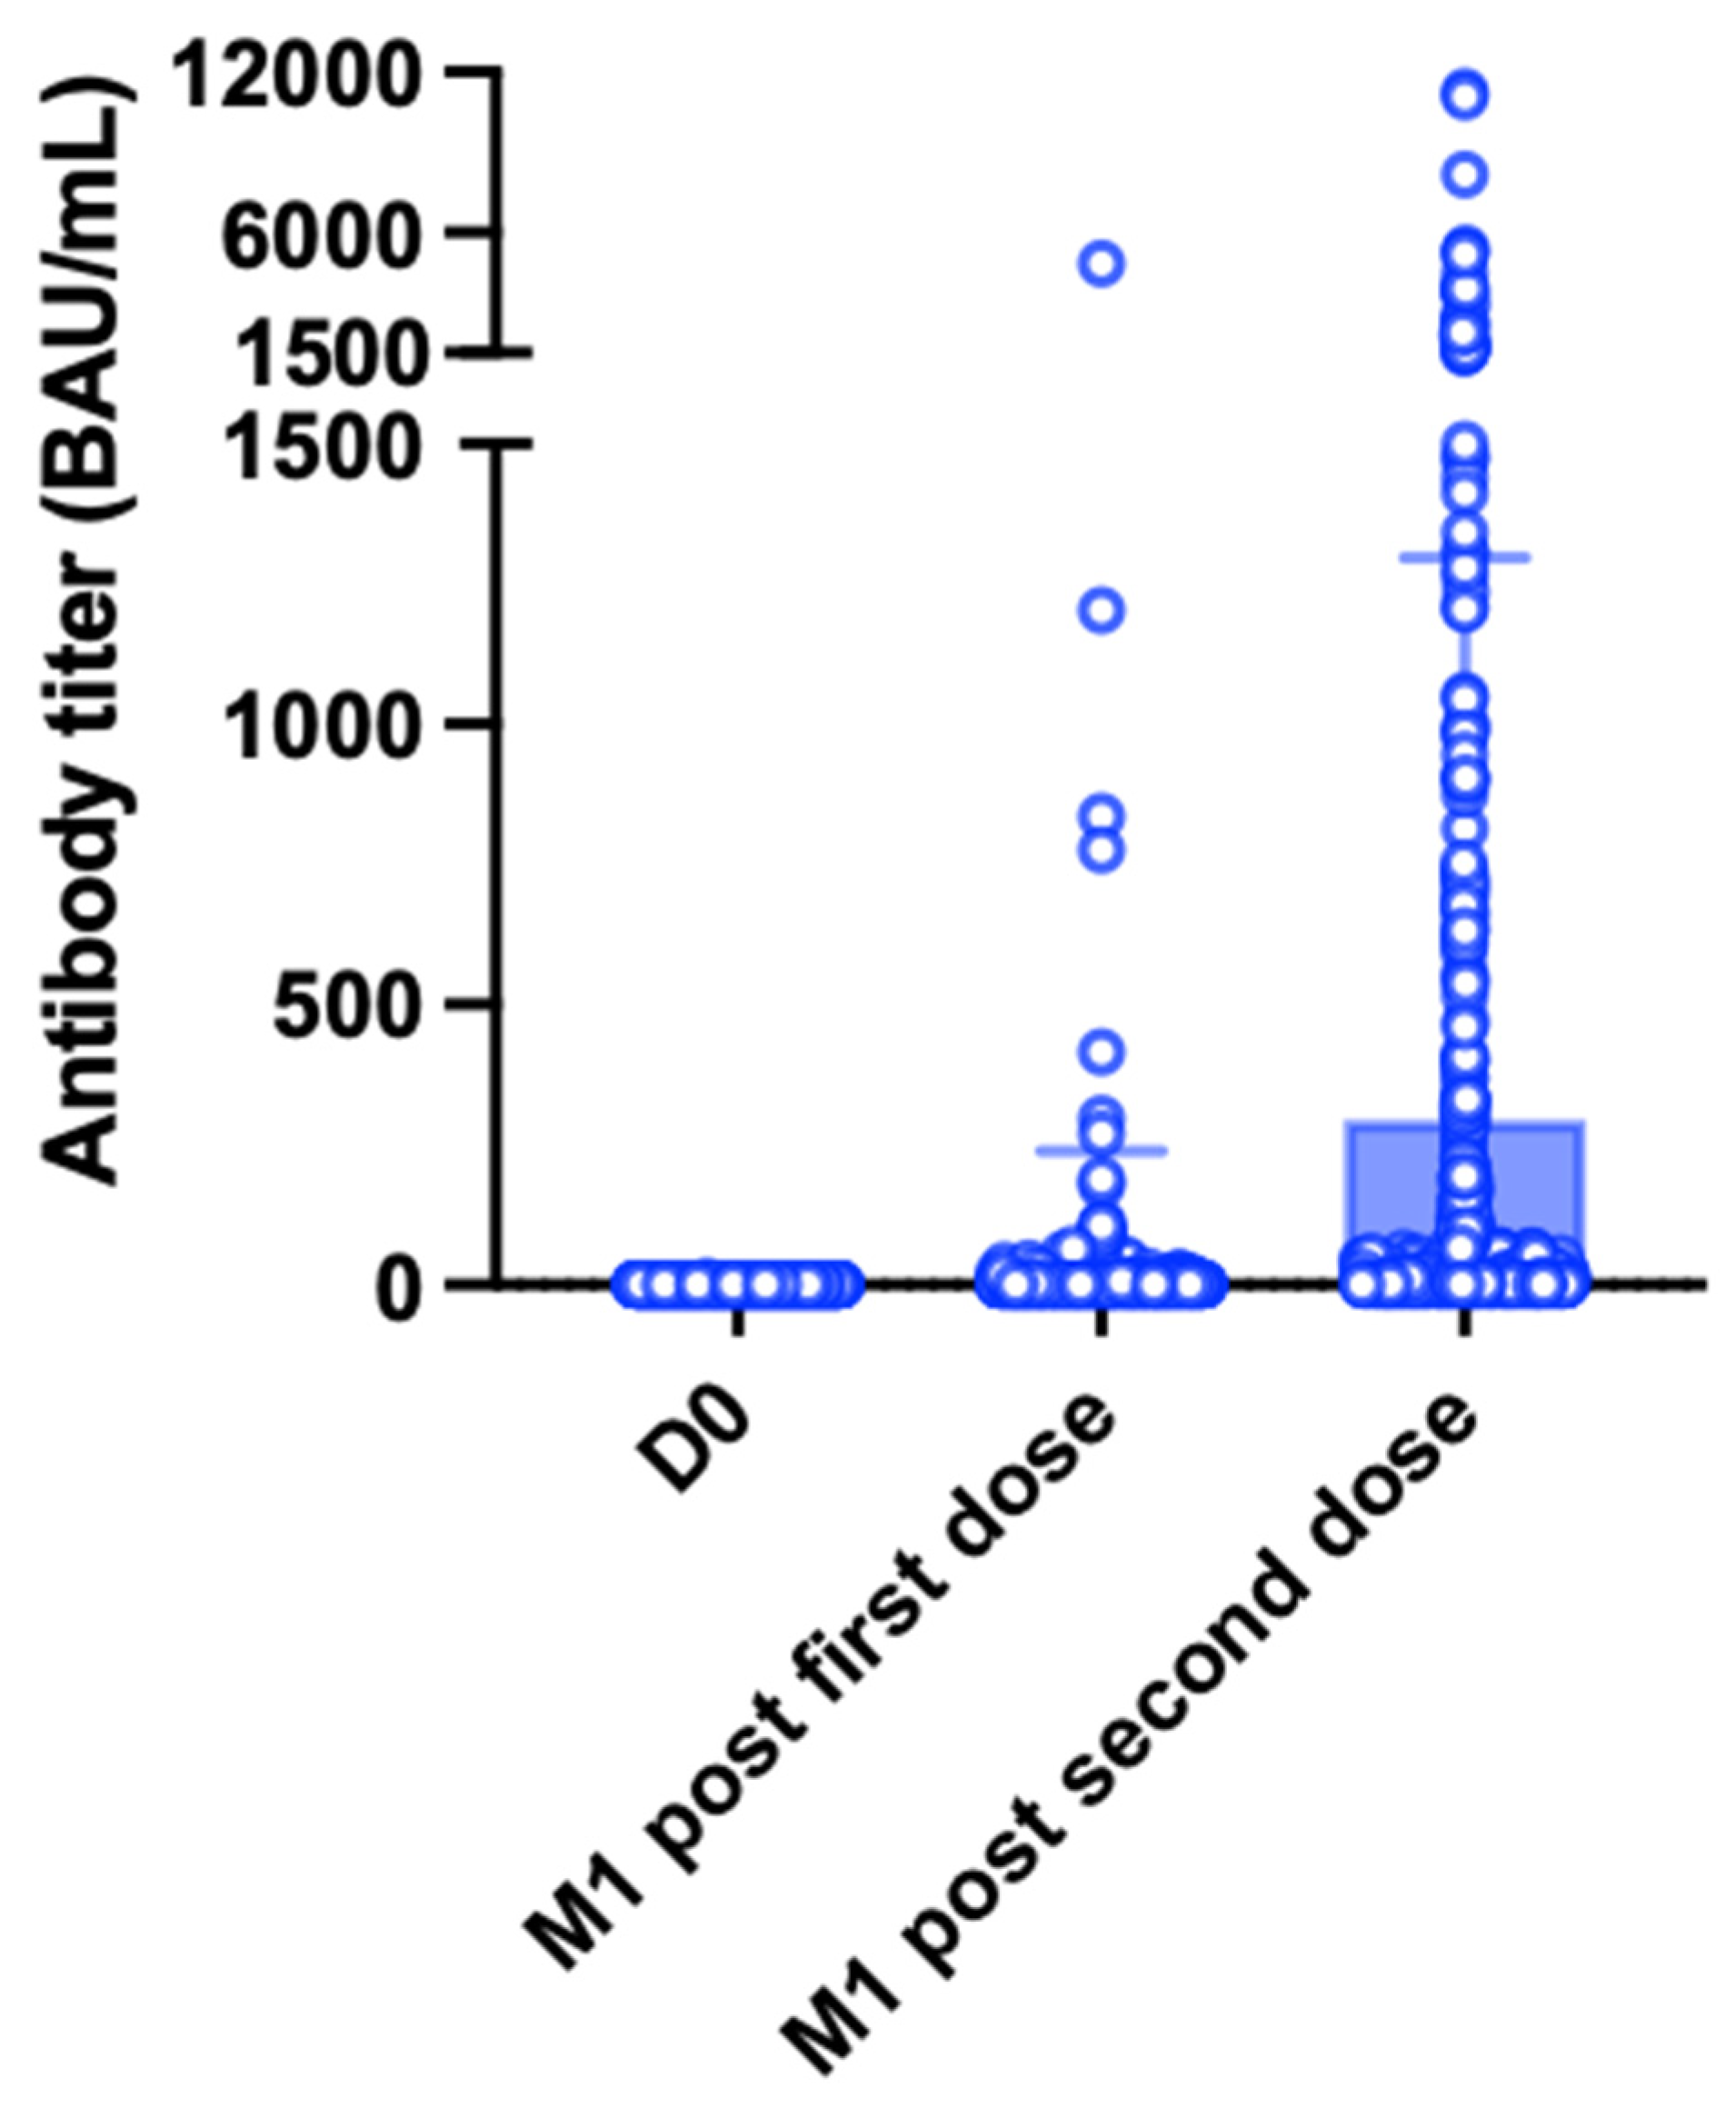
3.1. Patients Characteristics and Serological Response after the First Vaccine Dose
3.2. Serological Response after the Second Vaccine Dose
Examples
3.3. Serological Response after the Third Vaccine Dose
3.4. Overall Response in the Entire Cohort
3.5. Six-Month Antibody Kinetics after the Second Vaccine Dose
3.6. Three-Month Antibody Kinetics after the Third Vaccine Dose
4. Discussion
Supplementary Materials
Author Contributions
Funding
Institutional Review Board Statement
Informed Consent Statement
Data Availability Statement
Acknowledgments
Conflicts of Interest
References
- Caillard, S.; Anglicheau, D.; Matignon, M.; Durrbach, A.; Greze, C.; Frimat, L.; Thaunat, O.; Legris, T.; Moal, V.; Westeel, P.F.; et al. An initial report from the French SOT COVID Registry suggests high mortality due to COVID-19 in recipients of kidney transplants. Kidney Int. 2020, 98, 1549–1558. [Google Scholar] [CrossRef] [PubMed]
- Benotmane, I.; Perrin, P.; Vargas, G.G.; Bassand, X.; Keller, N.; Lavaux, T.; Ohana, M.; Bedo, D.; Baldacini, C.; Sagnard, M.; et al. Biomarkers of Cytokine Release Syndrome Predict Disease Severity and Mortality From COVID-19 in Kidney Transplant Recipients. Transplantation 2021, 105, 158–169. [Google Scholar] [CrossRef] [PubMed]
- Jackson, L.A.; Anderson, E.J.; Rouphael, N.G.; Roberts, P.C.; Makhene, M.; Coler, R.N.; McCullough, M.P.; Chappell, J.D.; Denison, M.R.; Stevens, L.J.; et al. An mRNA Vaccine against SARS-CoV-2—Preliminary Report. N. Engl. J. Med. 2020, 383, 1920–1931. [Google Scholar] [CrossRef] [PubMed]
- Benotmane, I.; Gautier-Vargas, G.; Cognard, N.; Olagne, J.; Heibel, F.; Braun-Parvez, L.; Martzloff, J.; Perrin, P.; Moulin, B.; Fafi-Kremer, S.; et al. Weak anti–SARS-CoV-2 antibody response after the first injection of an mRNA COVID-19 vaccine in kidney transplant recipients. Kidney Int. 2021, 99, 1487–1489. [Google Scholar] [CrossRef]
- Benotmane, I.; Gautier-Vargas, G.; Cognard, N.; Olagne, J.; Heibel, F.; Braun-Parvez, L.; Martzloff, J.; Perrin, P.; Moulin, B.; Fafi-Kremer, S.; et al. Low immunization rates among kidney transplant recipients who received 2 doses of the mRNA-1273 SARS-CoV-2 vaccine. Kidney Int. 2021, 99, 1498–1500. [Google Scholar] [CrossRef] [PubMed]
- Boyarsky, B.J.; Werbel, W.A.; Avery, R.K.; Tobian, A.A.R.; Massie, A.B.; Segev, D.L.; Garonzik-Wang, J.M. Antibody Response to 2-Dose SARS-CoV-2 mRNA Vaccine Series in Solid Organ Transplant Recipients. JAMA 2021, 325, 2204. [Google Scholar] [CrossRef]
- Rozen-Zvi, B.; Yahav, D.; Agur, T.; Zingerman, B.; Ben-Zvi, H.; Atamna, A.; Tau, N.; Mashraki, T.; Nesher, E.; Rahamimov, R. Antibody response to SARS-CoV-2 mRNA vaccine among kidney transplant recipients: A prospective cohort study. Clin. Microbiol. Infect. 2021, 27, 1173.e1–1173.e4. [Google Scholar] [CrossRef]
- Caillard, S.; Chavarot, N.; Bertrand, D.; Kamar, N.; Thaunat, O.; Moal, V.; Masset, C.; Hazzan, M.; Gatault, P.; Sicard, A.; et al. Occurrence of severe COVID-19 in vaccinated transplant patients. Kidney Int. 2021, 100, 477–479. [Google Scholar] [CrossRef]
- Benotmane, I.; Gautier, G.; Perrin, P.; Olagne, J.; Cognard, N.; Fafi-Kremer, S.; Caillard, S. Antibody Response After a Third Dose of the mRNA-1273 SARS-CoV-2 Vaccine in Kidney Transplant Recipients with Minimal Serologic Response to 2 Doses. JAMA J. Am. Med. Assoc. 2021, 326, 1063. [Google Scholar] [CrossRef]
- Hall, V.G.; Ferreira, V.H.; Ku, T.; Ierullo, M.; Majchrzak-Kita, B.; Chaparro, C.; Selzner, N.; Schiff, J.; McDonald, M.; Tomlinson, G.; et al. Randomized Trial of a Third Dose of mRNA-1273 Vaccine in Transplant Recipients. N. Engl. J. Med. 2021, 385, 1244–1246. [Google Scholar] [CrossRef]
- Del Bello, A.; Abravanel, F.; Marion, O.; Couat, C.; Esposito, L.; Lavayssière, L.; Izopet, J.; Kamar, N. Efficiency of a boost with a third dose of anti-SARS-CoV-2 messenger RNA-based vaccines in solid organ transplant recipients. Am. J. Transplant. 2021, 22, 322–323. [Google Scholar] [CrossRef] [PubMed]
- Feng, S.; Phillips, D.J.; White, T.; Sayal, H.; Aley, P.K.; Bibi, S.; Dold, C.; Fuskova, M.; Gilbert, S.C.; Hirsch, I.; et al. Correlates of protection against symptomatic and asymptomatic SARS-CoV-2 infection. Nat. Med. 2021, 27, 2032–2040. [Google Scholar] [CrossRef] [PubMed]
- Marion, O.; del Bello, A.; Abravanel, F.; Couat, M.C.; Faguer, S.; Esposito, L.; Hebral, A.L.; Izopet, J.; Kamar, N. Safety and Immunogenicity of Anti–SARS-CoV-2 Messenger RNA Vaccines in Recipients of Solid Organ Transplants. Ann. Intern. Med. 2021, 174, 1336–1338. [Google Scholar] [CrossRef]
- Cucchiari, D.; Egri, N.; Bodro, M.; Herrera, S.; del Risco-Zevallos, J.; Casals-Urquiza, J.; Cofan, F.; Moreno, A.; Rovira, J.; Banon-Maneus, E.; et al. Cellular and Humoral Response After mRNA-1273 SARS-CoV-2 Vaccine in Kidney Transplant Recipients. Am. J. Transplant. 2021, 21, 2727–2739. [Google Scholar] [CrossRef]
- Chavarot, N.; Ouedrani, A.; Marion, O.; Leruez-Ville, M.; Vilain, E.; Baaziz, M.; del Bello, A.; Burger, C.; Sberro-Soussan, R.; Martinez, F.; et al. Poor Anti-SARS-CoV-2 Humoral and T-cell Responses After 2 Injections of mRNA Vaccine in Kidney Transplant Recipients Treated with Belatacept. Transplantation 2021, 105, e94–e95. [Google Scholar] [CrossRef]
- Ou, M.T.; Boyarsky, B.J.; Chiang, T.P.; Bae, S.; Werbel, W.A.; Avery, R.K.; Tobian, A.A.; Massie, A.B.; Segev, D.L.; Garonzik-Wang, J.M. Immunogenicity and Reactogenicity After SARS-CoV-2 mRNA Vaccination in Kidney Transplant Recipients Taking Belatacept. Transplantation 2021, 105, 2119–2123. [Google Scholar] [CrossRef] [PubMed]
- Kantauskaite, M.; Müller, L.; Kolb, T.; Fischer, S.; Hillebrandt, J.; Ivens, K.; Andree, M.; Luedde, T.; Orth, H.M.; Adams, O.; et al. Intensity of mycophenolate mofetil treatment is associated with an impaired immune response to SARS-CoV-2 vaccination in kidney transplant recipients. Am. J. Transplant. 2021, 22, 634–639. [Google Scholar] [CrossRef]
- Connolly, C.M.; Chiang, T.P.-Y.; Boyarsky, B.J.; Ruddy, J.A.; Teles, M.; Alejo, J.L.; Massie, A.; Werbel, W.A.; Shah, A.A.; Christopher-Stine, L.; et al. Temporary hold of mycophenolate augments humoral response to SARS-CoV-2 vaccination in patients with rheumatic and musculoskeletal diseases: A case series. Ann. Rheum. Dis. 2021, 81, 293–295. [Google Scholar] [CrossRef]
- Hod, T.; Ben-David, A.; Olmer, L.; Levy, I.; Ghinea, R.; Mor, E.; Lustig, Y.; Rahav, G. Humoral Response of Renal Transplant Recipients to the BNT162b2 SARS-CoV-2 mRNA Vaccine Using Both RBD IgG and Neutralizing Antibodies. Transplantation 2021, 105, e234–e243. [Google Scholar] [CrossRef] [PubMed]
- Masset, C.; Kerleau, C.; Garandeau, C.; Ville, S.; Cantarovich, D.; Hourmant, M.; Kervella, D.; Houzet, A.; Guillot-Gueguen, C.; Guihard, I.; et al. A third injection of the BNT162b2 mRNA COVID-19 vaccine in kidney transplant recipients improves the humoral immune response. Kidney Int. 2021, 100, 1132–1135. [Google Scholar] [CrossRef] [PubMed]
- Bertrand, D.; Hamzaoui, M.; Lemée, V.; Lamulle, J.; Laurent, C.; Etienne, I.; Lemoine, M.; Lebourg, L.; Hanoy, M.; le Roy, F.; et al. Antibody and T-cell response to a third dose of SARS-CoV-2 mRNA BNT162b2 vaccine in kidney transplant recipients. Kidney Int. 2021, 100, 1337–1340. [Google Scholar] [CrossRef] [PubMed]
- Gallais, F.; Gantner, P.; Bruel, T.; Velay, A.; Planas, D.; Wendling, M.-J.; Bayer, S.; Solis, M.; Laugel, E.; Reix, N.; et al. Evolution of antibody responses up to 13 months after SARS-CoV-2 infection and risk of reinfection. eBioMedicine 2021, 71, 103561. [Google Scholar] [CrossRef] [PubMed]
- Dimeglio, C.; Herin, F.; Miedougé, M.; Martin-Blondel, G.; Soulat, J.-M.; Izopet, J. Protection of Healthcare Workers Against Severe Acute Respiratory Syndrome Coronavirus 2 (SARS-CoV-2) Reinfection. Clin. Infect. Dis. 2021, 73, 1323–1324. [Google Scholar] [CrossRef] [PubMed]
- Benotmane, I.; Vargas, G.G.; Gallais, F.; Gantner, P.; Cognard, N.; Olagne, J.; Velay, A.; Heibel, F.; Braun-Parvez, L.; Martzloff, J.; et al. Strong antibody response after a first dose of a SARS-CoV-2 mRNA-based vaccine in kidney transplant recipients with a previous history of COVID-19. Am. J. Transplant. 2021, 21, 3808–3810. [Google Scholar] [CrossRef]
- Caillard, S.; Thaunat, O.; Benotmane, I.; Masset, C.; Blancho, G. Antibody Response to a Fourth Messenger RNA COVID-19 Vaccine Dose in Kidney Transplant Recipients: A Case Series. Ann. Intern. Med. 2022, 175, 455–456. [Google Scholar] [CrossRef]
- Schrezenmeier, E.; Rincon-Arevalo, H.; Jens, A.; Stefanski, A.-L.; Hammett, C.; Osmanodja, B.; Koch, N.; Zukunft, B.; Beck, J.; Oellerich, M.; et al. Temporary antimetabolite treatment hold boosts SARS-CoV-2 vaccination–specific humoral and cellular immunity in kidney transplant recipients. JCI Insight 2022, 7. [Google Scholar] [CrossRef]
- Yahav, D.; Rozen-Zvi, B.; Mashraki, T.; Atamna, A.; Ben-Zvi, H.; Bar-Haim, E.; Rahamimov, R. Immunosuppression reduction when administering a booster dose of the BNT162b2 mRNA SARS-CoV-2 vaccine in kidney transplant recipients without adequate humoral response following two vaccine doses: Protocol for a randomised controlled trial (BECAME study). BMJ Open 2021, 11, e055611. [Google Scholar] [CrossRef]
- Alejo, J.L.; Mitchell, J.; Chiang, T.P.-Y.; Abedon, A.T.; Sidoti, C.N.; Boyarsky, B.J.; Avery, R.K.; Tobian, A.A.; Levan, M.L.; Warren, D.S.; et al. Six-month Antibody Kinetics and Durability in SARS-CoV-2 mRNA Vaccinated Solid Organ Transplant Recipients. Transplantation 2021, 106, e109–e110. [Google Scholar] [CrossRef]
- Boyarsky, B.J.; Chiang, T.P.-Y.; Teles, A.T.; Greenberg, R.S.; Krach, M.R.; Ou, M.T.; Massie, A.B.; Tobian, A.A.R.; Garonzik-Wang, J.M.; Segev, D.L.; et al. Antibody Kinetics and Durability in SARS-CoV-2 mRNA Vaccinated Solid Organ Transplant Recipients. Transplantation 2021, 105, e137–e138. [Google Scholar] [CrossRef]
- Kamar, N.; Abravanel, F.; Marion, O.; Esposito, L.; Hebral, A.L.; Médrano, C.; Guitard, J.; Lavayssière, L.; Cointault, O.; Nogier, M.B.; et al. Anti-SARS-CoV-2 spike protein and neutralizing antibodies at 1 and 3 months after three doses of SARS-CoV-2 vaccine in a large cohort of solid organ transplant patients. Am. J. Transplant. 2022, 22, 1467–1474. [Google Scholar] [CrossRef]
- Benotmane, I.; Vargas, G.G.; Velay, A.; Wendling, M.; Perrin, P.; Fafi-Kremer, S.; Caillard, S. Persistence of SARS-CoV-2 antibodies in kidney transplant recipients. Am. J. Transplant. 2020, 21, 2307–2310. [Google Scholar] [CrossRef] [PubMed]


| Entire Cohort (n = 562) | SARS-CoV-2 Seronegative Patients (n = 300) | SARS-CoV-2 Seropositive Patients (n = 262) | p | |
|---|---|---|---|---|
| Age (years) | 56.7 (±13.1) | 57.3 (±13) | 56 (±12.3) | 0.25 |
| Male sex | 344 (61.2%) | 180 (60%) | 164 (62.6%) | 0.53 |
| Comorbidities | ||||
| BMI (kg/m2) | 26.6 (±5.7) | 26.7 (±5.8) | 26.6 (±5.5) | 0.86 |
| Cardiovascular disease | 148 (26.34%) | 80 (26.7%) | 68 (26%) | 0.85 |
| Diabetes | 204 (36.3%) | 127 (42.3%) | 77 (29.4%) | 0.001 |
| History of cancer | 98 (17.4%) | 57 (19%) | 41 (15.7%) | 0.3 |
| Hypertension | 472 (84%) | 254 (84.7%) | 218 (83.2%) | 0.64 |
| Time from kidney transplantation (years) | 9.4 (±6.4) | 7.5 (±6.9) | 11.6 (±8.6) | <0.0001 |
| First transplantation | 474 (84.3%) | 243 (81%) | 231 (88.2%) | 0.02 |
| Living donor | 106 (18.9%) | 63 (21%) | 43 (16.4%) | 0.17 |
| CNI | <0.0001 | |||
| Tacrolimus | 328 (58.4%) | 201 (67%) | 127 (48.5%) | |
| Cyclosporine | 184 (32.7%) | 76 (25.3%) | 108 (41.2%) | |
| No CNI | 50 (8.9%) | 23 (7.7%) | 27 (10.3%) | |
| Tacrolimus dose (mg) * | 5.4 (±3.1) | 5.8 (±3.4) | 4.8 (±2.6) | 0.03 |
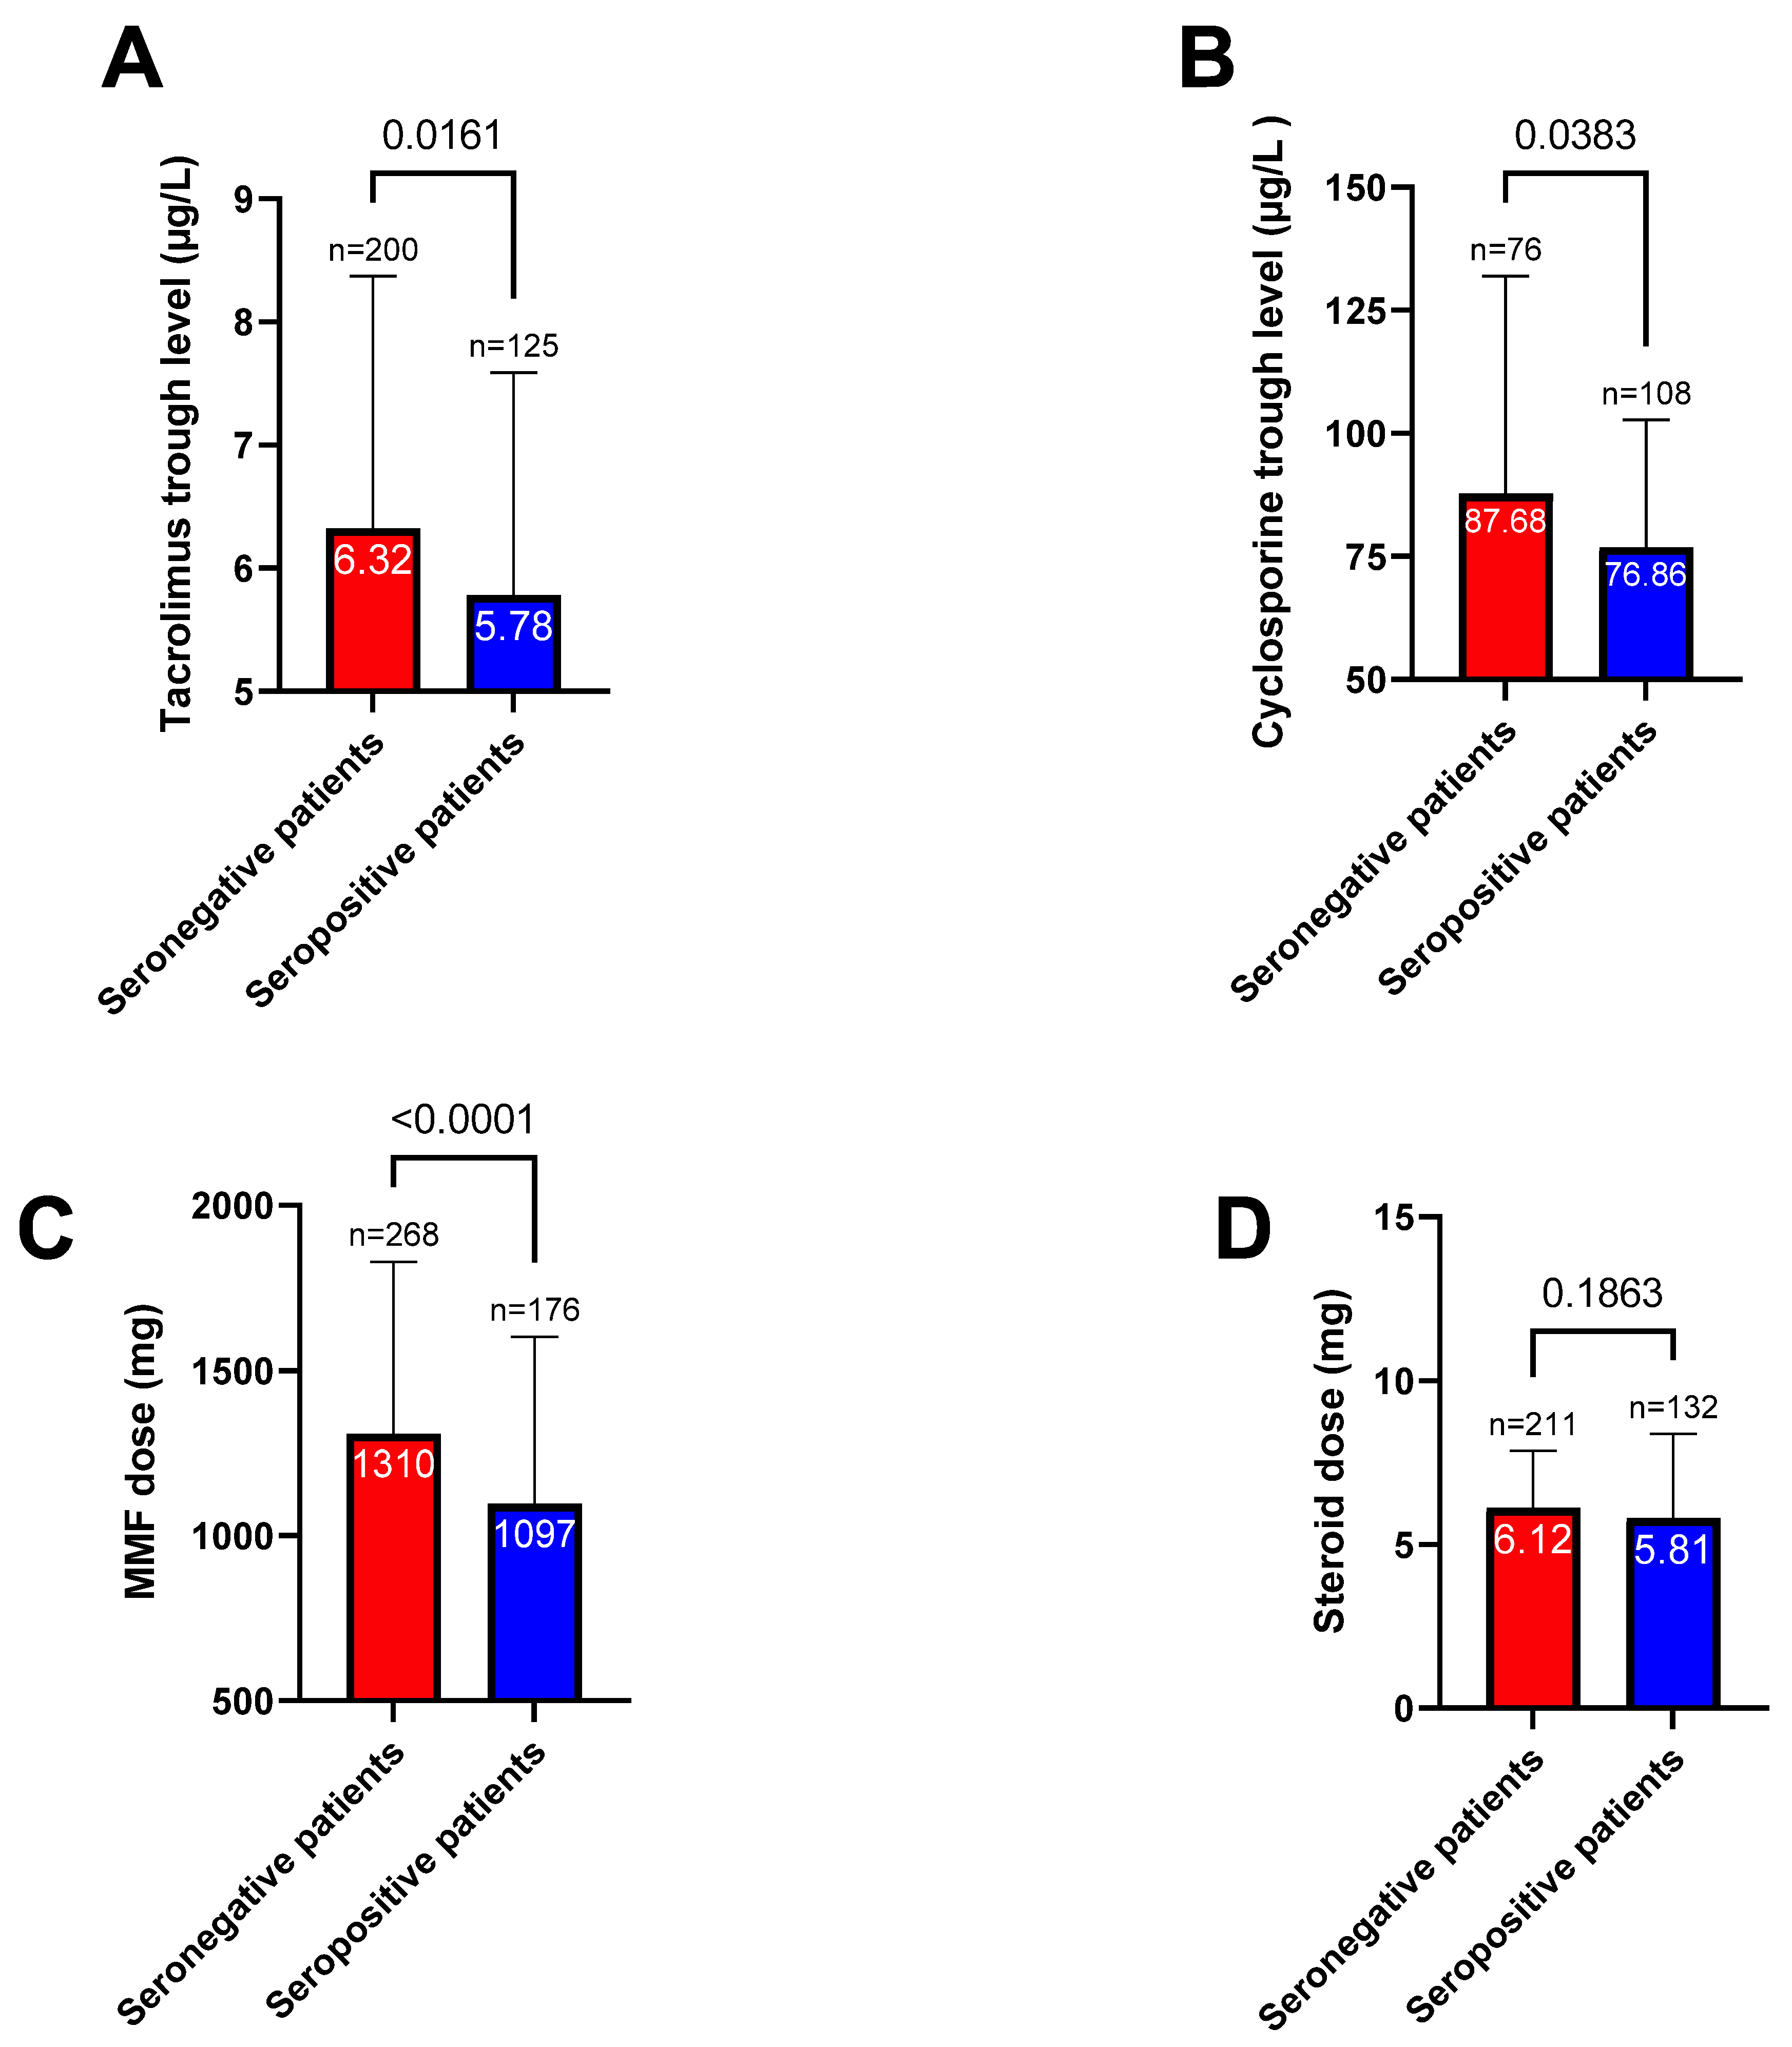
| Tacrolimus trough level (µg/L) ** | 6.1 (±2) | 6.3 (±2.1) | 5.8 (±1.8) | 0.02 |
| Cyclosporine dose (mg) | 151.1 (±55.7) | 155.8 (±65.6) | 147.8 (±47.6) | 0.33 |
| Cyclosporine trough level (µg/L) | 81.3 (±35) | 87.7 (±44.3) | 76.9 (±25.9) | 0.04 |
| MMF/MPA | 448 (79.7%) | 269 (89.7%) | 179 (68.3%) | <0.0001 |
| MMF/MPA dose (mg) *** | 1225 (±525.3) | 1310 (±521.4) | 1097 (±506.3) | <0.0001 |
| mTOR inhibitors | 89 (15.8%) | 27 (9%) | 62 (23.6%) | <0.0001 |
| mTOR inhibitors dose (mg) * | 2.2 (±1.1) | 2.1 (±0.9) | 2.2 (±1.1) | 0.51 |
| mTOR inhibitors trough level (µg/L) | 5.2 (±1.5) | 5 (±1.5) | 5.3 (±1.6) | 0.38 |
| Azathioprine | 13 (2.3%) | 0 | 13 (5%) | <0.0001 |
| Belatacept | 18 (3.2%) | 16 (5.3%) | 2 (0.8%) | 0.002 |
| Steroids | 344 (61.2%) | 212 (70.7%) | 132 (50.4%) | <0.0001 |
| Steroids dose (mg) * | 6 (±2.1) | 6.1 (±1.75) | 5.8 (±2.6) | 0.18 |
| Tacrolimus + MMF/MPA + steroids | 194 (34.5%) | 142 (47.3%) | 52 (19.9%) | <0.0001 |
| Serum creatinine (µmol/L) | 135.3 (±55.9) | 145.2 (±58.2) | 124 (±50.9) | <0.0001 |
| Antibody titer before the second dose **** | 146.4 (±1543.6) | 7.5 (±3.3) | 304.4 (±2249) | 0.02 |
| Univariate Odds Ratio (95% Confidence Interval) | p | Multivariate Odds Ratio (95% Confidence Interval) | p | |
|---|---|---|---|---|
| Age (for each 10-year increase) | 0.93 (0.81–1.05) | 0.2 | 0.82 (0.69–0.97) | 0.02 |
| Male sex | 1.12 (0.79–1.57) | 0.53 | ||
| Comorbidities | ||||
| BMI (for each 1 kg/m2) | 0.99 (0.97–1) | 0.87 | ||
| Cardiovascular disease | 1.0 (0.66–1.41) | 0.85 | ||
| Diabetes | 0.57 (0.4–0.81) | 0.002 | 0.70 (0.45–1.06) | 0.09 |
| Cancer | 0.79 (0.51–1.23) | 0.29 | ||
| Hypertension | 0.9 (0.57–1.41) | 0.63 | ||
| Time from transplantation (for each 10-year decrease) | 0.49 (0.38–0.61) | <0.0001 | 0.57 (0.42–0.77) | 0.0002 |
| First transplantation | 1.75 (1.1–2.8) | 0.02 | 1.15 (0.66–2.02) | 0.63 |
| Living donor | 0.74 (0.48–1.13) | 0.17 | 0.87 (0.53–1.44) | 0.60 |
| TAC vs. CS or no CNI | 0.46 (0.33–0.65) | <0.0001 | 0.54 (0.35–0.83) | 0.005 |
| MMF/MPA | 0.25 (0.16–0.39) | <0.0001 | 0.29 (0.15–0.56) | 0.0002 |
| mTOR inhibitors | 3.13 (1.93–5.1) | 0.003 | 1.64 (0.82–3.27) | 0.17 |
| Azathioprine | 32.5 (1.73–611.5) | 0.02 | ||
| Belatacept | 0.14 (0.03–0.60) | 0.008 | 0.18 (0.04–0.86) | 0.03 |
| Steroids | 0.42 (0.3–0.6) | 0.01 | 0.58 (0.38–0.88) | 0.01 |
| Serum creatinine (for each 100 µmol/L increase) | 0.46 (0.31–0.65) | <0.0001 | 0.37 (0.25–0.55) | <0.0001 |
| Variable | Coefficient |
|---|---|
| Belatacept | 5.6 |
| Tacrolimus | 1.9 |
| MMF/MPA | 3.4 |
| Steroids | 1.7 |
| Serum creatinine (for each 100 µmol/L increase) | 2.7 |
| Age (for each 10-year increase) | 1.2 |
| Time from transplantation (for each 10-year decrease) | −1.75 |
| Entire Cohort (n = 309) | SARS-CoV-2 Seronegative Patients (n = 120) | SARS-CoV-2 Seropositive Patients (n = 189) | p | |
|---|---|---|---|---|
| Age (years) | 57.2 (±12.5) | 59.1 (±13) | 55.9 (±12.1) | 0.02 |
| Male sex | 196 (63.4%) | 62 (51.7%) | 134 (70.9%) | 0.0006 |
| Comorbidities | ||||
| BMI (kg/m2) | 26.7 (±6) | 26.1 (±5.6) | 27 (±6.3) | 0.17 |
| Cardiovascular disease | 77 (24.9%) | 35 (29.2%) | 42 (22.2%) | 0.17 |
| Diabetes | 124 (40.1%) | 52 (43.3%) | 72 (38.1%) | 0.36 |
| Cancer | 61 (19.7%) | 28 (23.3%) | 33 (17.4%) | 0.21 |
| Hypertension | 265 (85.8%) | 104 (86.7%) | 161 (85.2%) | 0.72 |
| Time from kidney transplantation (years) | 7.9 (±7.1) | 6 (±6.2) | 9.2 (±7.4) | <0.0001 |
| First transplantation | 250 (80.9%) | 94 (78.3%) | 156 (82.5%) | 0.36 |
| Living donor | 63 (20.4%) | 20 (16.7%) | 43 (22.8%) | 0.2 |
| CNI | 0.001 | |||
| Tacrolimus | 201 (65.1%) | 89 (74.2%) | 112 (59.3%) | |
| Cyclosporine | 87 (28.2%) | 20 (16.7%) | 67 (35.5%) | |
| No CNI | 21 (6.8%) | 11 (9.2%) | 10 (5.3%) | |
| Tacrolimus dose (mg) * | 5.6 (±3.3) | 6.2 (±3.6) | 5.1 (±2.9) | 0.02 |
| Tacrolimus trough level (µg/L) * | 6.2 (±2) | 6.3 (±2) | 6.1 (±2) | 0.5 |
| Cyclosporine dose (mg) | 160 (±57) | 185 (±56) | 153 (±56) | 0.03 |
| Cyclosporine trough level (µg/L) | 85.4 (±42.7) | 98.1 (±31.3) | 81.6 (±45) | 0.07 |
| MMF/MPA | 266 (86.1%) | 113 (94.2%) | 153 (81%) | 0.001 |
| MMF/MPAs dose (mg) * | 1253 (±507) | 1290 (±529) | 1225 (±490) | 0.3 |
| mTOR inhibitors | 34 (11%) | 6 (5%) | 28 (14.8%) | 0.01 |
| mTOR inhibitors dose (mg) | 2 (±0.9) | 1.8 (±0.7) | 2 (±0.9) | 0.61 |
| mTOR inhibitors trough level (µg/L) | 5 (±1.6) | 4.9 (±1.4) | 5.1 (±1.6) | 0.82 |
| Azathioprine | 3 (1%) | 0 | 3 (1.6%) | 0.17 |
| Belatacept | 12 (3.9%) | 11 (9.2%) | 1 (0.5%) | 0.0004 |
| Steroids | 213 (68.9%) | 99 (82.5%) | 114 (60.3%) | <0.0001 |
| Steroids dose (mg) * | 6.1 (±2.3) | 6.2 (±1.8) | 6.1 (±2.7) | 0.58 |
| Tacrolimus + MMF/MPA + steroids | 137 (44.4%) | 73 (60.8%) | 64 (33.9%) | <0.0001 |
| Serum creatinine (µmol/L) | 139 (±54.2) | 150.3 (±62.6) | 131.8 (±46.9) | 0.003 |
| Antibody titer before the third dose | 142 (±637) | 10.5 (±23.5) | 226 (±804) | 0.0003 |
| Univariate Odds Ratio (95% Confidence Interval) | p | Multivariate Odds Ratio (95% Confidence Interval) | p | |
|---|---|---|---|---|
| Age (for each 10-year increase) | 0.81 (0.67–0.98) | 0.03 | 0.62 (0.47–0.81) | 0.0004 |
| Male sex | 2.28 (1.42–3.68) | 0.0007 | 3.07 (1.7–5.5) | 0.0002 |
| Comorbidities | ||||
| BMI (for each 1 kg/m2) | 1.03 (0.99–1.07) | 0.18 | 1.06 (1.01–1.12) | 0.01 |
| Cardiovascular disease | 0.69 (0.41–1.17) | 0.17 | 1.31 (0.68–2.52) | 0.42 |
| Diabetes | 0.81 (0.51–1.28) | 0.36 | ||
| Cancer | 0.67 (0.4–1.23) | 0.21 | ||
| Hypertension | 0.89 (0.45–1.70) | 0.72 | ||
| Time from transplantation (for each 10-year decrease) | 0.46 (0.30–0.67) | 0.0002 | 0.38 (0.23–0.62) | 0.0002 |
| First transplantation | 1.31 (0.73–2.32) | 0.36 | ||
| Living donor | 1.47 (0.83–2.7) | 0.2 | 1.49 (0.72–3.05) | 0.28 |
| TAC vs. CS or no CNI | 0.51 (0.30- 0.83) | 0.0078 | 0.44 (0.22–0.85) | 0.02 |
| MMF/MPA | 0.26 (0.10–0.58) | 0.002 | 0.27 (0.06–1.16) | 0.08 |
| mTOR inhibitors | 3.30 (1.41–9.07) | 0.01 | 1.4 (0.3–6.78) | 0.68 |
| Belatacept | 0.05 (0.003–0.28) | 0.005 | 0.03 (0.003–0.32) | 0.003 |
| Steroids | 0.32 (0.18–0.55) | <0.0001 | 0.4 (0.21–0.77) | 0.006 |
| Serum creatinine (for each 100 µmol/L increase) | 0.53 (0.33–0.81) | 0.005 | 0.42 (0.23–0.72) | 0.002 |
Publisher’s Note: MDPI stays neutral with regard to jurisdictional claims in published maps and institutional affiliations. |
© 2022 by the authors. Licensee MDPI, Basel, Switzerland. This article is an open access article distributed under the terms and conditions of the Creative Commons Attribution (CC BY) license (https://creativecommons.org/licenses/by/4.0/).
Share and Cite
Benotmane, I.; Gautier-Vargas, G.; Cognard, N.; Olagne, J.; Heibel, F.; Braun-Parvez, L.; Martzloff, J.; Perrin, P.; Pszczolinski, R.; Moulin, B.; et al. Prediction of Vaccine Response and Development of a Personalized Anti-SARS-CoV-2 Vaccination Strategy in Kidney Transplant Recipients: Results from a Large Single-Center Study. J. Pers. Med. 2022, 12, 1107. https://doi.org/10.3390/jpm12071107
Benotmane I, Gautier-Vargas G, Cognard N, Olagne J, Heibel F, Braun-Parvez L, Martzloff J, Perrin P, Pszczolinski R, Moulin B, et al. Prediction of Vaccine Response and Development of a Personalized Anti-SARS-CoV-2 Vaccination Strategy in Kidney Transplant Recipients: Results from a Large Single-Center Study. Journal of Personalized Medicine. 2022; 12(7):1107. https://doi.org/10.3390/jpm12071107
Chicago/Turabian StyleBenotmane, Ilies, Gabriela Gautier-Vargas, Noëlle Cognard, Jérôme Olagne, Françoise Heibel, Laura Braun-Parvez, Jonas Martzloff, Peggy Perrin, Romain Pszczolinski, Bruno Moulin, and et al. 2022. "Prediction of Vaccine Response and Development of a Personalized Anti-SARS-CoV-2 Vaccination Strategy in Kidney Transplant Recipients: Results from a Large Single-Center Study" Journal of Personalized Medicine 12, no. 7: 1107. https://doi.org/10.3390/jpm12071107