
Metabolic Profiling in Rheumatoid Arthritis, Psoriatic Arthritis, and Psoriasis: Elucidating Pathogenesis, Improving Diagnosis, and Monitoring Disease Activity


Abstract
:1. Introduction
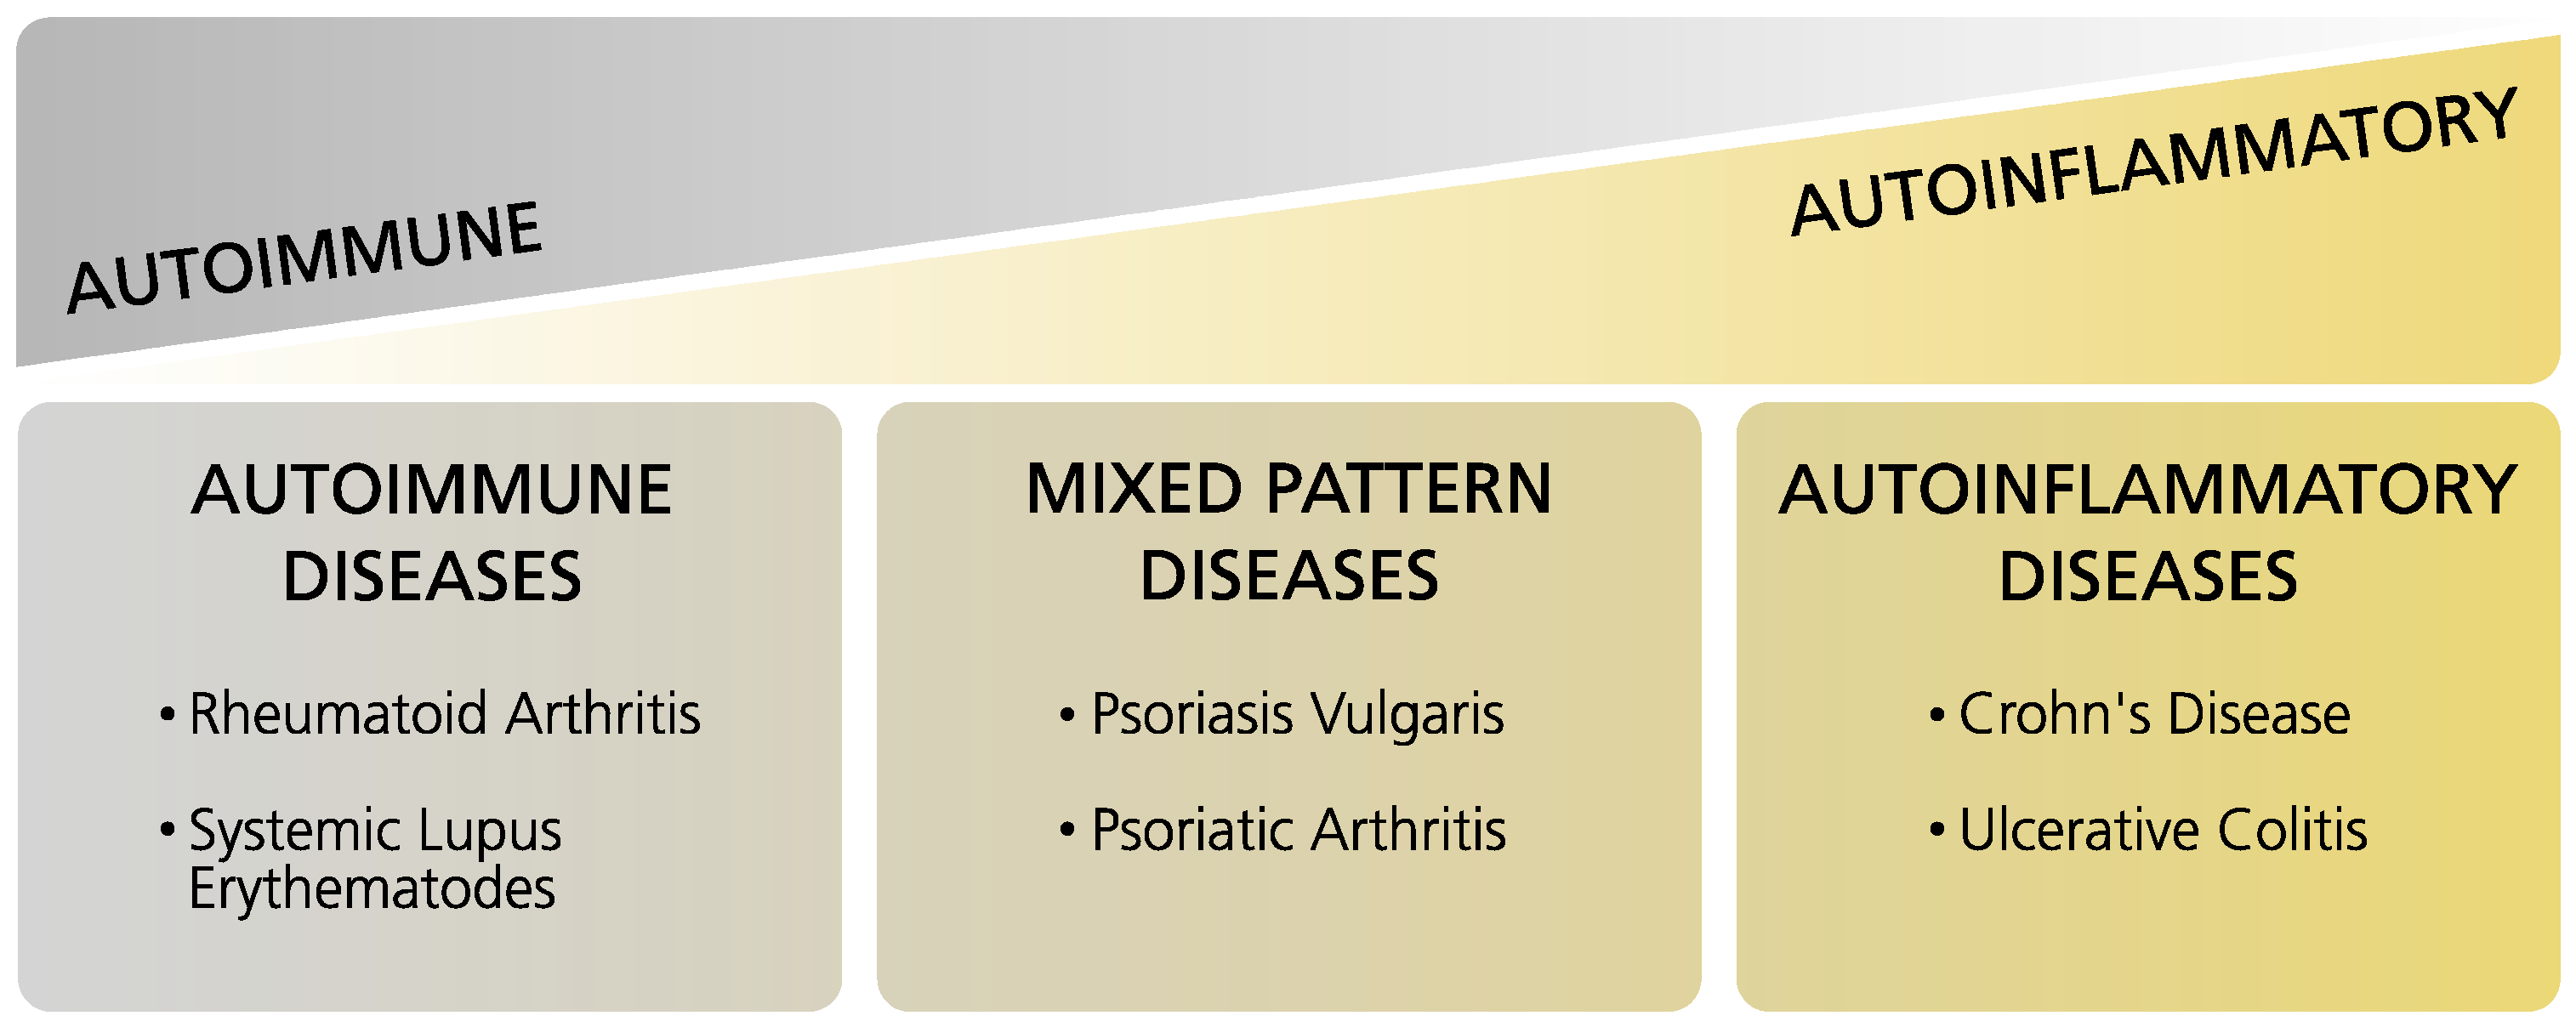
1.1. Immune-Mediated Inflammatory Diseases
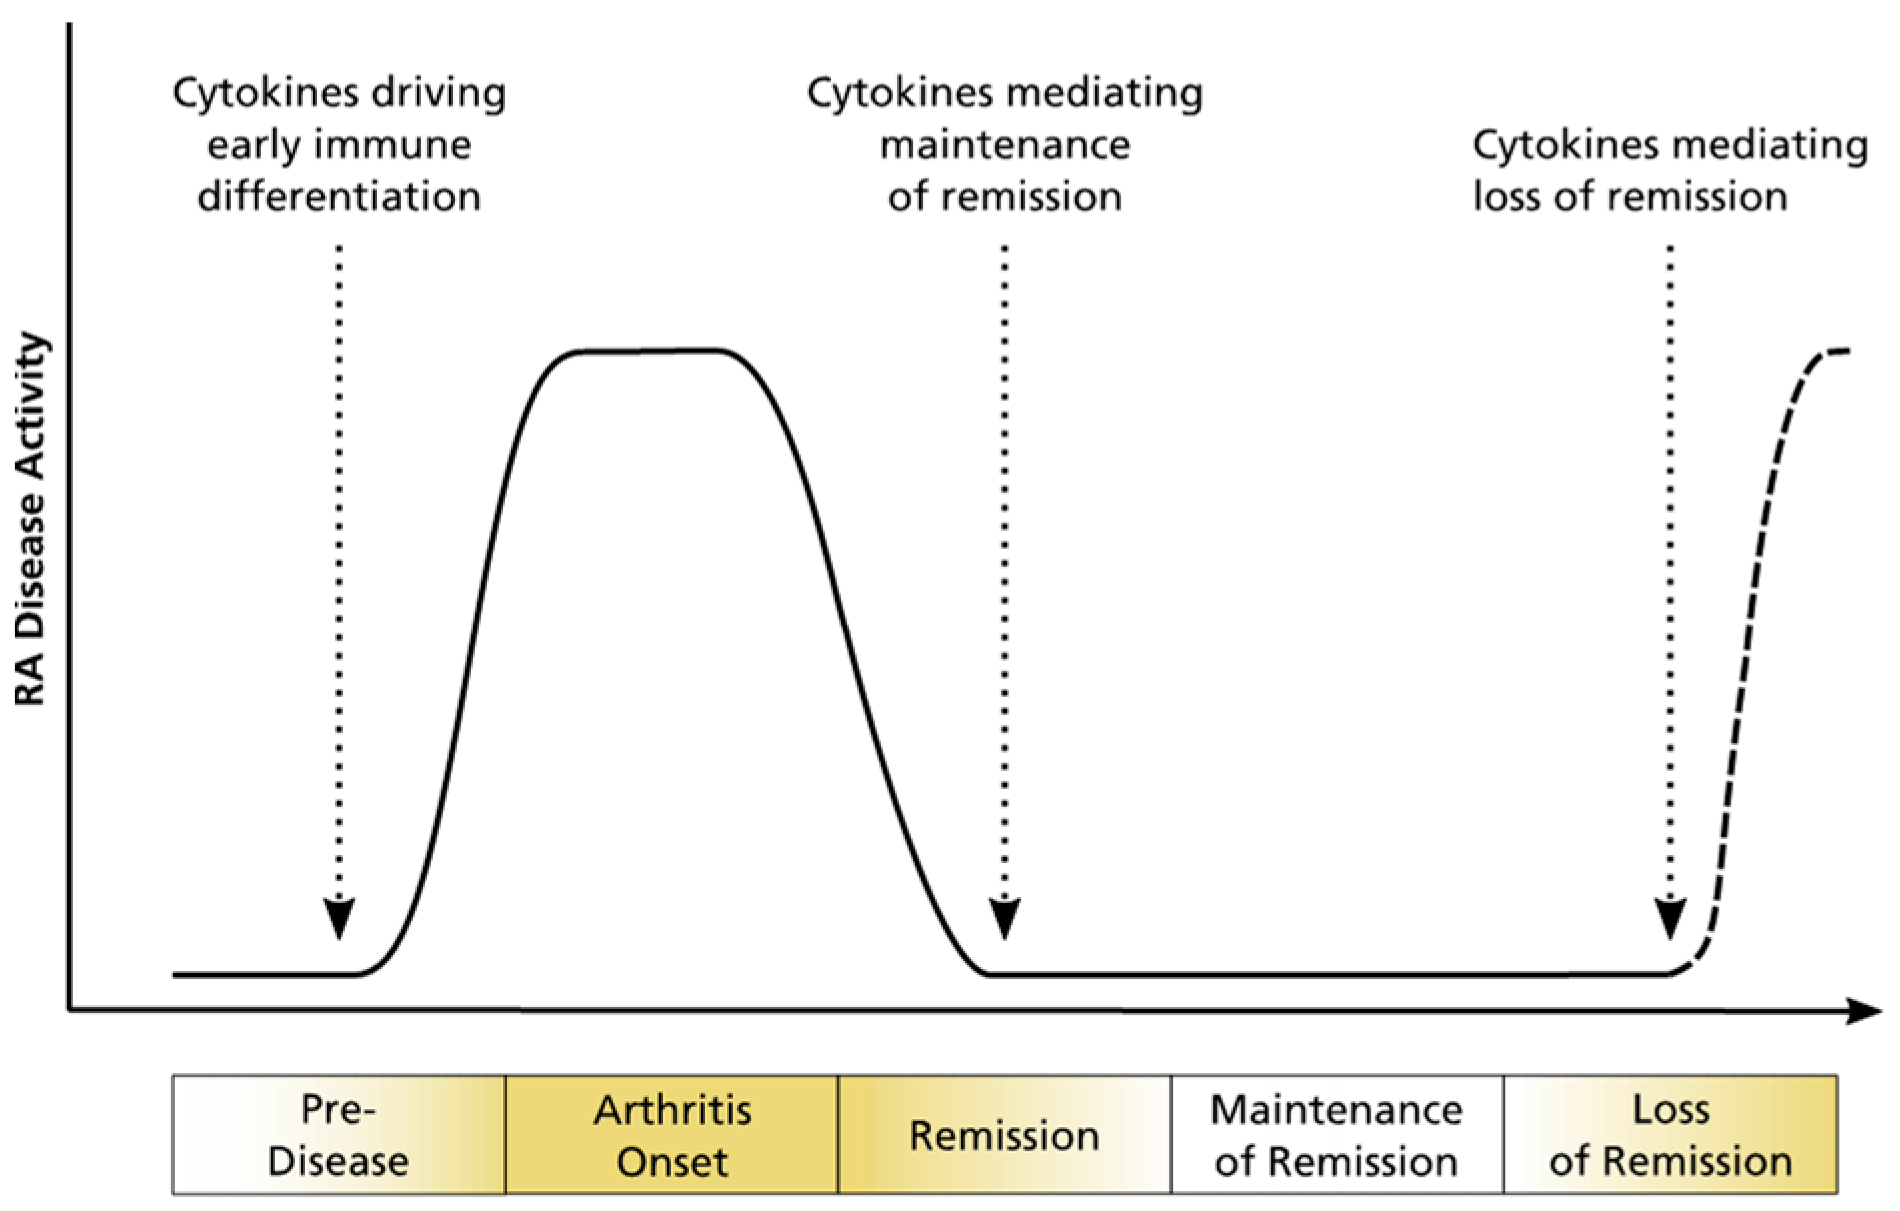
1.2. Rheumatoid Arthritis
1.3. Psoriatic Arthritis
1.4. Psoriasis
1.5. Disease Progression from Psoriasis to Psoriatic Arthritis
1.6. Precision Medicine, Biomarkers, and Metabolomics
2. Rheumatoid Arthritis

| Reference | Matrix | Instruments | Disease Activity and/or Severity | Patients Treated? | Biomarker Categories * | Results | |
|---|---|---|---|---|---|---|---|
| Rantapää-Dahlqvist 1991 [50] | Plasma | ELISA and radioimmunoassay kit | Median | Yes | D | ↑ | lipoprotein (a) |
| ↓ | cholesterol, HDL | ||||||
| Lauridsen 2010 [44] | Plasma | 1H-NMR | Mixed: DAS28 active (5.0), in remission (2.6) | N/A | D, M | ↑ | cholesterol C-21, lactate, acetylated glycoprotein, unsaturated lipid |
| ↓ | HDL | ||||||
| Chandrasekharan 2018 [36] | Plasma | LC–MS | DAS28 (2.7) | Yes (mixed) | D, Ri | ↑ | L-ornithine, ADMA, SDMA |
| ↓ | L-citrulline | ||||||
| Sasaki 2019 [32] | Plasma | CE–Q-TOF-MS | Mixed: DAS28-ESR active (>3.2), inactive (<3.2) | No biologicals | D, M | ↑ | N,N-dimethylglycine, urea |
| ↓ | guanidoacetic acid, histidine, homoarginine or N6,N6,N6-trimethyllysine | ||||||
| Kishikawa 2021 [60] | Plasma | CE–TOF-MS | N/A | N/A | D | ↑ | ethanolamine phosphate, ATP, GDP, ADP, 6-aminohexanoic acid, taurine |
| ↓ | xanthine | ||||||
| Liu 2021 [33] | Plasma | UPLC–LTQ/Orbitrap- MS | N/A | No (rat model) | D | ↑ | glutamic acid, arginine, methionine |
| ↓ | proline, valine, tyrosine, phenylalanine, leucine, glycine, tryptophan, histidine, threonine | ||||||
| He 2021 [28] | Plasma | GC–Q-TOF-MS | Mixed: medium, high | N/A | D | ↓ | glutamine, cysteine, citric acid |
| Krähenbühl 1999 [46] | Plasma, Urine | Radioenzymatic assay and HPLC | DAS (4.35) | N/A | D | ↑ | in plasma: long-chain acylcarnitine |
| ↓ | in urine: carnitine | ||||||
| Madsen 2011 [34] | Serum | GC–TOF-MS and UPLC–MS | Mixed: DAS28 (4.06) | Yes (mixed) | D | ↑ | glyceric acid, D-ribofuranose, hypoxanthine |
| ↓ | histidine, threonic acid, methionine, cholesterol, asparagine, threonine | ||||||
| Ouyang 2011 [29] | Serum | 1H-NMR | N/A | Yes (mixed) | D | ↑ | lactic acid |
| ↓ | glucose, creatinine, pyruvate, citrate, proteinogenic AAs, glycerides, phosphocholine | ||||||
| Young 2013 [43] | Serum | 1H-NMR | N/A | Naive for DMARDs | D, M | ↑ | 3-hydroxybutyrate, lactate, acetylglycine, taurine, glucose |
| ↓ | LDL-CH3, LDL-CH2, alanine, methylguanidine, lipids | ||||||
| Jiang 2013 [26] | Serum | GC–TOF-MS and UPLC–QTOF-MS | Mixed: active, mild, or moderate | N/A | D, M | ↑ | homoserine, glyceraldehyde, lactic acid, dihydroxyfumaric acid, aspartic acid |
| ↓ | 4,8-dimethylnonanoyl carnitine | ||||||
| Zabek 2016 [37] | Serum | 1H-NMR | DAS28 (6.84) | Yes (no TNFi) | D, M | ↑ | 3-hydroxyisobutyrate, acetate, NAC, acetoacetate, acetone |
| ↓ | valine, isoleucine, lactate, alanine, creatinine, GPC APC, histidine | ||||||
| Zhou 2016 [49] | Serum | GC–MS | N/A | N/A | D | ↑ | fatty acids, cholesterol, carbohydrates |
| ↓ | amino acids, glucose, 1,5-anhydrosorbitol, urate, 2-ketoisocaproate | ||||||
| Li 2018 [54] | Serum | UPLC–HRMS | DAS28 (median 6.40) | N/A | D | ↑ | 4-methoxyphenylacetic acid, glutamic acid, leucine, phenylalanine, tryptophan, proline, glyceraldehyde, fumaric acid, cholesterol |
| ↓ | capric acid, argininosuccinic acid, bilirubin | ||||||
| Dubey 2019 [30] | Serum | 1H-NMR | N/A | No DMARDs | D | ↓ | compared to reactive arthritis: leucine, valine, phenylalanine, arginine/lysine |
| Souto-Carneiro 2020 [61] | Serum | 1H-single-pulse NMR and CPMG NMR | DAS28-CRP (2.3) | Yes | D (RA/PsA) | ↑ | phenylalanine |
| ↓ | alanine, threonine, leucine, valine, acetate, creatine, lactate, choline, lipid ratios | ||||||
| Luan 2021 [35] | Serum | LC–HRMS | Mixed: low, moderate, high | N/A | D | ↑ | CAR 20:3, aspartyl-phenylalanine, pipecolic acid, PE (18:1), LPE (20:3) |
| ↓ | histidine, phosphatidic acid (28:0) | ||||||
| Koh 2022 [59] | Serum, SF | UPLC–Q-TOF-MS | Mixed: low, high | No lipid modulators | D, M | ↑ | LPC, PC, EtherPC, PE, SM subclasses |
| Liao 2013 [52] | Blood | N/A | N/A | Yes | D | ↓ | total cholesterol, LDL |
| Yang 2015 [45] | SF | GC–TOF-MS | Mixed: DAS28 inactive (<3.2), active (>3.2) | N/A | D | ↑ | lactic acid, carnitine, pipecolinic acid, diglycerol, beta-mannosylglycerate |
| ↓ | valine, citric acid, gluconic lactone, glucose, G-1-P, mannose, ribitol, 5-methoxytryptamine | ||||||
| Alonso 2016 [41] | Urine | 1H-NMR | Mixed: DAS28 very low (1.7), very high (5.5) | Yes | D, M | ↑ | tyrosine |
| ↓ | N-acetyl amino acids, citrate, alanine, carnitine | ||||||
| Sasaki 2019 [32] | Urine | CE–Q-TOF-MS | Mixed: DAS28-ESR active (>3.2), inactive (<3.2) | No biologicals | D, M | ↑ | 1-methyl-4-phenyl-1,2,3,6-tetrahydropyridine, 2-quinolinecarboxylic acid, gibberellic acid, hypotaurine, N-acetylglucosamine 1-phosphate, riboflavin |
| Hur 2021 [62] | Plasma | UPLC–MS | Mixed: DAS28-CRP (3.0) | Yes | M, D | ↑ | glucuronate |
| ↓ | 6-bromotryptophan, bilirubin, biliverdin, N-acetyltryptophan, N-acetyltyrosine, serine, trigonelline | ||||||
| Priori 2015 [39] | Serum | 1H-NMR | DAS28-CRP responders (median 4.56), non-res. (median 4.65) | Yes (etanercept plus DMARDs and/or GC) | Pre | ↑ | isoleucine, leucine, valine, alanine, glutamine, tyrosine, glucose |
| ↓ | 3-hydroxybutyrate | ||||||
| Cuppen 2016 [63] | Serum | LC–MS | DAS28 (4.5) | No biologicals | Pre, M | ↑ | in good responders: sn1-LPC (15:0), lysine |
| ↓ | in good responders: sn1-LPC (18:3-ω3/ω6), ethanolamine | ||||||
| Takahashi 2019 [40] | Serum | CE–TOF-MS | Mixed: moderate, high | Yes (TNFi or abatacept) | Pre | ↑ | TNFi responders: betonicine; ABT responders: citric acid, quinic acid |
| ↓ | TNFi res.: glycerol 3-phosphate, N-acetylalanine, hexanoic acid, taurine; ABT res.: 3-aminobutyric acid | ||||||
| Kapoor 2013 [42] | Urine | 1D-NMR | Severe | Yes | Pre | ↑ | histamine, glutamine, xanthurenic acid |
| ↓ | ethanolamine | ||||||
| Surowiec 2016 [64] | Plasma | LC–MS | None | No | Pro | ↑ | kynurenine, LPC (16:0), hypoxanthine, LPC (14:0), 3-indolelactic acid, PLs, SM |
| ↓ | oleic acid, β-hydroxypalmitic acid, fatty acids, acylcarnitines | ||||||
| Chu 2020 [47] | Plasma | UHPLC–HRMS | Healthy | No | Pro | ↓ | acylcarnitine, cholesterol ester, polyamine |
| van Halm 2007 [53] | Serum | ELISA, immunoturbidimetric method | Healthy | N/A | Pro | ↑ | total cholesterol, triglycerides, apo B |
| ↓ | HDLc | ||||||
| Myasoedova 2010 [51] | Blood | N/A | N/A | N/A | Pro | ↓ | total cholesterol, LDL |
| Jonsson 2001 [58] | Serum | Dry chemistry, ELISA | Early | Yes (mixed) | Ri | ↑ | cholesterol, LDL, LDL/HDL ratio |
3. Psoriatic Arthritis
| Reference | Matrix | Instruments | Disease Activity and/or Severity | Patients Treated? | Biomarker Categories * | Results | |
|---|---|---|---|---|---|---|---|
| Kishikawa 2021 [71] | Plasma | CE–TOF-MS LC–TOF-MS | Ps: PASI (1.8) | Yes (mixed) | D (PsA/Ps) | ↑ | tyramine |
| ↓ | mucic acid | ||||||
| Ambrożewicz 2018 [72] | Plasma | UPLC–QTOF-MS and GC–FID | N/A | No (4 weeks before the study) | D | ↑ | lipid peroxidation products (4-hydroxynonenal, isoprostanes, and neuroprostanes), endocannabinoids (AEA and 2-AG) |
| ↓ | phospholipids and free polyunsaturated fatty acids | ||||||
| Looby 2021 [65] | Serum | HPLC–HRMS (SPME) | Mixed: mild, moderate, severe | No (at baseline levels) | D, M | ↑ | long-chain fatty acids (e.g., 3-hydroxytetradecanedioic acid, 3-hydroxydo-decanedioic acid), 1,11-undecanedicarboxylic acid, eicosanoids (pro- or anti-inflammatory; including prostaglandins, leukotrienes, …) |
| Souto-Carneiro 2020 [61] | Serum | 1H-single-pulse NMR and CPMG NMR | DAS28-CRP (2.3) | Yes | D (PsA/RA) | ↑ | alanine, threonine, leucine, valine, acetate, creatine, lactate, choline, L3/L1, L5/L1, L6/L1 |
| ↓ | phenylalanine | ||||||
| Armstrong 2014 [66] | Serum | GC–TOF-MS | PASI (13.2) | Yes | D | ↑ | glucuronic acid |
| Madsen 2011 [34] | Serum | GC–TOF-MS and UPLC–MS | N/A | Yes (mixed) | D (PsA/RA) | ↑ | glutamine, heptanoic acid, pseudouridine, inosine, guanosine, arabitol, cystine, cysteine, phosphoric acid, succinic acid |
| ↓ | glutamic acid, histidine, cholesterol, threonic acid, aspartic acid, glutamic acid, 1-monooleoylglycerol, arachidonic acid, serine | ||||||
| Coras 2019 [67] | Serum | LC–MS | Mixed: DAS28-PCR (2.74) | Yes (mixed) | M | ↑ | TMAO |
| Coras 2019 [68] | Serum | UPLC–MS | Mixed: DAS28-CPR high and low (2.72) | Yes | M | ↑ | pro-inflammatory eicosanoids (PGE2, HXB3, 6,15-dk,dh,PGF1a), anti-inflammatory eicosanoids (11-HEPE, 12-HEPE, 15-HEPE) |
| ↓ | anti-inflammatory eicosanoids (8,9-diHETrE, 11,12-diHETrE, 14,15-diHETrE, 19,20-diHDPA, 7,17 DHDPA, resolvin D1, 17-HdoHE) | ||||||
| Alonso 2016 [41] | Urine | 1H-NMR | Mixed: DAS28-CPR high and low (2.72) | Yes | D, M | ↓ | N-acetyl amino acids, citrate, alanine, trigonelline, methylsuccinate, carnitine |
| Kapoor 2013 [42] | Urine | 1D-NMR | N/A | Yes | Pre | ↑ | histamine, glutamine, xanthurenic acid |
| ↓ | ethanolamine | ||||||
| Wójcik 2019 [69] | Mononuclear cells | UPLC–TOF-MS | N/A | No (4 weeks before the study) | D, Pro | ↑ | 8-isoPGF2α, free 4-HNE, endocannabinoids, eicosanoids (PGE1, LTB4, 13HODE, TXB2) |
| ↓ | eicosanoids (15-d-PGJ2, 15 15-HETE) |
4. Psoriasis
| Reference | Matrix | Instruments | Disease Activity and/or Severity | Patients Treated? | Biomarker Categories * | Results | |
|---|---|---|---|---|---|---|---|
| Chen 2021 [31] | Plasma | UHPLC–qTOF-MS | PASI (10.11) | No | D, M | ↑ | EAAs, BCAAs, carnitines (C6, C18:1-OH) |
| ↓ | glutamine, cysteine, asparagine, carnitines (C16) | ||||||
| Kishikawa 2021 [71] | Plasma | CE–TOF-MS LC–TOF-MS | PASI (1.8) | Yes (mixed) | D | ↑ | ethanolamine phosphate |
| ↓ | nicotinic acid, 20α-hydroxyprogesterone | ||||||
| Li 2019 [75] | Plasma | UPLC–Q-TOF-MS | PASI (9.93) | No | D | ↑ | threonine, leucine, phenylalanine, tryptophan, palmitamide, linoleic amide, oleamide, stearamide, cis-11- eicosenamide, trans-13-docosenamide, uric acid, LysoPCs |
| ↓ | oleic acid, arachidonic acid, N-linoleoyl taurine | ||||||
| Sorokin 2018 [76] | Plasma | LC–MS | N/A | No | D | ↑ | 9-,13-HODE, laurylcarnitine, glycerol, adenosine 5′-diphosphate, 7-beta-hydroxycholesterol, xanthosine, N-stearoyltaurine, serotonine |
| ↓ | 5-oxoproline, gamma-glutamylglutamine, methionine, cysteine, taurodeoxychoalte | ||||||
| Kamleh 2015 [73] | Plasma | UHPLC–HRMS | Mixed: PASI mild (1.4), severe (16.5) | Yes (mixed) | D, M | ↑ | several proteinogenic AA, citrulline, ornithine, hydroxyproline, cystine, taurine, cytidine, acetylglucosamine, GluCer (C16:0), S1P |
| ↓ | cystathionine | ||||||
| Li 2020 [79] | Serum | UHPLC–qTOF-MS | Mixed: PASI moderate to severe (>10) | N/A | D | ↑ | PAF, LPCs, PI (18:0/16:2) |
| ↓ | cholestane-3,7,12,25-tetrol-3-glucuronide, PCs, LacCer (d18:1/12:0), phenylalanylphenylalanine | ||||||
| Ottas 2017 [48] | Serum | HPLC–MS (biocrates) | Mixed: PASI (1–34) | No | D, M | ↑ | urea, Glu, ornithine, Phe, methioninesulfoxide, several PCs, phytol, taurine, phytol, 1,11-undecanedicarboxylic acid, PE (20:4/0:0) |
| ↓ | acylcarnitines (C9, C7 DC, C12, C10.2, multiple ratios) | ||||||
| Kang 2017 [74] | Serum | GC–MS | PASI (11.4) | No (4 weeks before the study) | D, M | ↑ | several proteinogenic AA, lactic acid, urea |
| ↓ | crotonic acid, azelaic acid, ethanolamine, cholesterol | ||||||
| Armstrong 2014 [66] | Serum | GC–TOF-MS | PASI (9.7) | Yes | D | ↑ | α-ketoglutaric acid |
| ↓ | asparagine, glutamine | ||||||
| Pohla 2020 [77] | Skin | HPLC–MS (biocrates) | N/A | N/A | D | ↑ | AA, acylcarnitines, biogenic amines, LPCs, PCs, histamine, ADMA (Ps lesional skin) |
| ↓ | 2 metabolite ratios—citrulline to ornithine and ornithine to arginine (Ps lesional skin) | ||||||
| Sorokin 2018 [76] | Skin | LC–MS | N/A | No | D | ↑ | arachidonic acid metabolites (such as 8-, 12-, 15-hydroxyeicosatetraenoic acid), linoleic acid-derived lipid mediators, 13-hydroxyoctadecadienoic acid |
5. The Differences
6. The Similarities
| Metabolites or Pathway | Trend | Indication | Matrix | Instruments | Biomarker Categories * | References |
|---|---|---|---|---|---|---|
| Alanine | ↓ | RA, PsA, Ps, SLE, CD | Urine | 1H-NMR | D | Alonso 2016 [41] |
| ↓ | RA, SLE | Serum | 1H-NMR | D | Ouyang 2011 [29] | |
| Glutamine | ↓ | RA | Plasma | GC–Q-TOF-MS | D | He 2021 [28] |
| ↓ | RA | Serum | 1H-NMR | D | Dubey 2019 [30] | |
| ↓ | Ps | Serum | GC–TOF-MS | D | Armstrong 2014 [66] | |
| ↓ | RA, SLE | Serum | 1H-NMR | D | Ouyang 2011 [29] | |
| Glutamic acid | ↑ | RA, Ps | Serum | 1H-NMR | D | Dubey 2019 [30] |
| Histidine | ↓ | RA, SLE | Serum | 1H-NMR | D | Ouyang 2011 [29] |
| ↓ | IBD | Serum | 1H-NMR | D | Dawiskiba 2014 [85] | |
| BCAAs | ↓ | RA | Serum | 1H-NMR | D, M | Zabek 2016 [37] |
| ↓ | RA | Serum | 1H-NMR | D | Dubey 2019 [30] | |
| ↓ | RA, SLE | Serum | 1H-NMR | D | Ouyang 2011 [29] | |
| ↑ | RA | SF | 1H-NMR | D | Dubey 2019 [30] | |
| ↑ | Rheumatic conditions | SF | GC–TOF-MS | D | Ahn 2015 [38] | |
| ↑ | Ps | Plasma | UHPLC–qTOF-MS | D, M | Chen 2021 [31] | |
| ↑ | Ps | Plasma | UPLC–Q-TOF-MS | D | Li 2019 [75] | |
| Ornithine | ↑ | RA | Plasma | LC–MS | D | Chandrasekharan 2018 [36] |
| ↑ | Ps | Plasma | UHPLC–HRMS | D, M | Kamleh 2015 [73] | |
| ↑ | Ps | Serum | HPLC–MS (biocrates) | D | Ottas 2017 [48] | |
| ↑ | Ps | Serum | GC–MS | D | Kang 2017 [74] | |
| TCA metabolites | ↓ | Ps, RA, IBD | Urine | GC–MS | D, Pre | Tsoukalas 2020 [90] |
| SLE | Serum | 1H-NMR | D | Ouyang 2011 [29] | ||
| Hippuric acid | ↓ | Ps, IBD | Urine | 1H-NMR | D | Alonso 2016 [41] |
| Methylsuccinic acid | ↓ | PsA, Ps, SLE, IBD | Urine | 1H-NMR | D | Alonso 2016 [41] |
| Citric acid | ↓ | RA, SLE | Serum | 1H-NMR | D | Ouyang 2011 [29] |
| ↓ | RA, PsA, Ps, SLE, IBD | Urine | 1H-NMR | D | Alonso 2016 [41] | |
| ↓ | PsA, SLE, CD | Urine | 1H-NMR | M | Alonso 2016 [41] | |
| Lactic acid | ↑ | RA | Serum | GC–TOF-MS UPLC–QTOF-MS | D, M | Jiang 2013 [26] |
| ↑ | RA | Serum | 1H-NMR | D, M | Young 2013 [43] | |
| ↑ | RA, SLE | Serum | 1H-NMR | D | Ouyang 2011 [29] | |
| ↑ | PsA | Serum | 1H-single-pulse NMR and CPMG NMR | D | Souto-Carneiro 2020 [61] | |
| ↑ | Ps | Serum | GC–MS | D, M | Kang 2017 [74] | |
| ↑ | IBD | Serum | 1H-NMR | D | Dawiskiba 2014 [85] | |
| Pyruvic acid | ↓ | RA, SLE | Serum | 1H-NMR | D | Ouyang 2011 [29] |
| Glucuronic acid | ↑ | PsA, Ps | Serum | GC–TOF-MS | D | Armstrong 2014 [66] |
| Trigonelline | ↓ | PsA, Ps, IBD | Urine | 1H-NMR | D | Alonso 2016 [41] |
| Carnitine | ↓ | RA, PsA | Urine | 1H-NMR | D | Alonso 2016 [41] |
| Acylcarnitines and free fatty acids | ↓ | RA | Plasma | LC–MS | Pro | Surowiec 2016 [64] |
| ↓ | RA | Serum | GC–TOF-MS UPLC–QTOF-MS | D, M | Jiang 2013 [26] | |
| ↓ | Ps | Serum | HPLC–MS (biocrates) | D, M | Ottas 2017 [48] | |
| 1,11-undecanedicarboxylic acid | ↑ | PsA, Ps | Serum | HPLC–HRMS (SPME) | D, M | Looby 2021 [65] |
| ↑ | Ps | Serum | HPLC–MS (biocrates) | D, M | Ottas 2017 [48] | |
| PC: Phosphocholine | ↓ | RA, SLE | Serum | 1H-NMR | D | Ouyang 2011 [29] |
| LPCs | ↑ | RA | SF | UHPLC–qTOF-MS | D | Nieminen 2022 [89] |
| ↑ | Ps | Plasma | UPLC–Q-TOF-MS | D | Li 2019 [75] | |
| ↑ | Ps | Serum | UPLC–Q-TOF-MS | D | Li 2020 [79] | |
| COX pathway | ↑↓ | RA, PsA | Serum | UPLC–MS | M | Coras 2019 [68] |
7. Conclusions
Supplementary Materials
Author Contributions
Funding
Institutional Review Board Statement
Informed Consent Statement
Data Availability Statement
Acknowledgments
Conflicts of Interest
References
- Surace, A.E.A.; Hedrich, C.M. The Role of Epigenetics in Autoimmune/Inflammatory Disease. Front. Immunol. 2019, 10, 1525. [Google Scholar] [CrossRef] [PubMed] [Green Version]
- Van Kempen, T.S.; Wenink, M.H.; Leijten, E.F.A.; Radstake, T.R.D.J.; Boes, M. Perception of self: Distinguishing autoimmunity from autoinflammation. Nat. Rev. Rheumatol. 2015, 11, 483–492. [Google Scholar] [CrossRef] [PubMed]
- McGonagle, D.; McDermott, M.F. A proposed classification of the immunological diseases. PLoS Med. 2006, 3, e297. [Google Scholar] [CrossRef] [Green Version]
- Simon, D.; Watad, A.; Rodrigues-Manica, S.; Perricone, C. Editorial: Early Origins of Psoriatic Arthritis. Front. Med. 2021, 8, 794229. [Google Scholar] [CrossRef] [PubMed]
- Gibofsky, A. Overview of Epidemiology, Pathophysiology, and Diagnosis of Rheumatoid Arthritis. Suppl. Featured Publ. 2012, 18, S295–S302. [Google Scholar]
- Kalinkovich, A.; Gabdulina, G.; Livshits, G. Autoimmunity, inflammation, and dysbiosis mutually govern the transition from the preclinical to the clinical stage of rheumatoid arthritis. Immunol. Res. 2018, 66, 696–709. [Google Scholar] [CrossRef]
- Wasserman, A.M. Diagnosis and management of rheumatoid arthritis. Am. Fam. Physician 2011, 84, 1245–1252. [Google Scholar] [PubMed]
- Weyand, C.M.; Goronzy, J.J. The immunology of rheumatoid arthritis. Nat. Immunol. 2021, 22, 10–18. [Google Scholar] [CrossRef]
- Arend, W.P.; Firestein, G.S. Pre-rheumatoid arthritis: Predisposition and transition to clinical synovitis. Nat. Rev. Rheumatol. 2012, 8, 573–586. [Google Scholar] [CrossRef]
- Agnihotri, P.; Monu; Ramani, S.; Chakraborty, D.; Saquib, M.; Biswas, S. Differential Metabolome in Rheumatoid Arthritis: A Brief Perspective. Curr. Rheumatol. Rep. 2021, 23, 42. [Google Scholar] [CrossRef]
- Ingegnoli, F.; Castelli, R.; Gualtierotti, R. Rheumatoid factors: Clinical applications. Dis. Markers 2013, 35, 727–734. [Google Scholar] [CrossRef] [PubMed] [Green Version]
- De Cock, D.; van der Elst, K.; Stouten, V.; Peerboom, D.; Joly, J.; Westhovens, R.; Verschueren, P. The perspective of patients with early rheumatoid arthritis on the journey from symptom onset until referral to a rheumatologist. Rheumatol. Adv. Pract. 2019, 3, rkz035. [Google Scholar] [CrossRef]
- McInnes, I.B.; Buckley, C.D.; Isaacs, J.D. Cytokines in rheumatoid arthritis-shaping the immunological landscape. Nat. Rev. Rheumatol. 2016, 12, 63–68. [Google Scholar] [CrossRef] [PubMed]
- Scher, J.U.; Ogdie, A.; Merola, J.F.; Ritchlin, C. Preventing psoriatic arthritis: Focusing on patients with psoriasis at increased risk of transition. Nat. Rev. Rheumatol. 2019, 15, 153–166. [Google Scholar] [CrossRef] [PubMed]
- Ogdie, A.; Schwartzman, S.; Husni, M.E. Recognizing and managing comorbidities in psoriatic arthritis. Curr. Opin. Rheumatol. 2015, 27, 118–126. [Google Scholar] [CrossRef] [PubMed]
- Ritchlin, C.T.; Colbert, R.A.; Gladman, D.D. Psoriatic Arthritis. N. Engl. J. Med. 2017, 376, 957–970. [Google Scholar] [CrossRef] [Green Version]
- Damiani, G.; Bragazzi, N.L.; Karimkhani Aksut, C.; Wu, D.; Alicandro, G.; McGonagle, D.; Guo, C.; Dellavalle, R.; Grada, A.; Wong, P.; et al. The Global, Regional, and National Burden of Psoriasis: Results and Insights from the Global Burden of Disease 2019 Study. Front. Med. 2021, 8, 743180. [Google Scholar] [CrossRef]
- Armstrong, A.W.; Read, C. Pathophysiology, Clinical Presentation, and Treatment of Psoriasis: A Review. JAMA 2020, 323, 1945–1960. [Google Scholar] [CrossRef]
- Pennington, S.R.; FitzGerald, O. Early Origins of Psoriatic Arthritis: Clinical, Genetic and Molecular Biomarkers of Progression from Psoriasis to Psoriatic Arthritis. Front. Med. 2021, 8, 723944. [Google Scholar] [CrossRef]
- Coates, L.C.; Helliwell, P.S. Psoriatic arthritis: State of the art review. Clin. Med. 2017, 17, 65–70. [Google Scholar] [CrossRef]
- Ghasemi, M.; Nabipour, I.; Omrani, A.; Alipour, Z.; Assadi, M. Precision medicine and molecular imaging: New targeted approaches toward cancer therapeutic and diagnosis. Am. J. Nucl. Med. Mol. Imaging 2016, 6, 310–327. [Google Scholar] [PubMed]
- Vargas, A.J.; Harris, C.C. Biomarker development in the precision medicine era: Lung cancer as a case study. Nat. Rev. Cancer 2016, 16, 525–537. [Google Scholar] [CrossRef] [PubMed]
- FDA-NIH Biomarker Working Group. BEST (Biomarkers, EndpointS, and Other Tools) Resource. Available online: https://www.ncbi.nlm.nih.gov/books/NBK326791/ (accessed on 22 December 2021).
- Liu, X.; Locasale, J.W. Metabolomics: A Primer. Trends Biochem. Sci. 2017, 42, 274–284. [Google Scholar] [CrossRef] [PubMed] [Green Version]
- Johnson, C.H.; Ivanisevic, J.; Siuzdak, G. Metabolomics: Beyond biomarkers and towards mechanisms. Nat. Rev. Mol. Cell. Biol. 2016, 17, 451–459. [Google Scholar] [CrossRef] [Green Version]
- Jiang, M.; Chen, T.; Feng, H.; Zhang, Y.; Li, L.; Zhao, A.; Niu, X.; Liang, F.; Wang, M.; Zhan, J.; et al. Serum metabolic signatures of four types of human arthritis. J. Proteome Res. 2013, 12, 3769–3779. [Google Scholar] [CrossRef]
- Yoon, N.; Jang, A.-K.; Seo, Y.; Jung, B.H. Metabolomics in Autoimmune Diseases: Focus on Rheumatoid Arthritis, Systemic Lupus Erythematous, and Multiple Sclerosis. Metabolites 2021, 11, 812. [Google Scholar] [CrossRef]
- He, Z.; Liu, Z.; Gong, L. Biomarker identification and pathway analysis of rheumatoid arthritis based on metabolomics in combination with ingenuity pathway analysis. Proteomics 2021, 21, e2100037. [Google Scholar] [CrossRef]
- Ouyang, X.; Dai, Y.; Wen, J.L.; Wang, L.X. ¹H NMR-based metabolomic study of metabolic profiling for systemic lupus erythematosus. Lupus 2011, 20, 1411–1420. [Google Scholar] [CrossRef]
- Dubey, D.; Kumar, S.; Chaurasia, S.; Guleria, A.; Ahmed, S.; Singh, R.; Kumari, R.; Modi, D.R.; Misra, R.; Kumar, D. NMR-Based Serum Metabolomics Revealed Distinctive Metabolic Patterns in Reactive Arthritis Compared with Rheumatoid Arthritis. J. Proteome Res. 2019, 18, 130–146. [Google Scholar] [CrossRef]
- Chen, C.; Hou, G.; Zeng, C.; Ren, Y.; Chen, X.; Peng, C. Metabolomic profiling reveals amino acid and carnitine alterations as metabolic signatures in psoriasis. Theranostics 2021, 11, 754–767. [Google Scholar] [CrossRef]
- Sasaki, C.; Hiraishi, T.; Oku, T.; Okuma, K.; Suzumura, K.; Hashimoto, M.; Ito, H.; Aramori, I.; Hirayama, Y. Metabolomic approach to the exploration of biomarkers associated with disease activity in rheumatoid arthritis. PLoS ONE 2019, 14, e0219400. [Google Scholar] [CrossRef] [PubMed] [Green Version]
- Liu, Y.; Xie, Y. Metabolomics Approach to the Exploration of Amino Acids Metabolism Changes Associated with Disease Progression in a Rat Model of Adjuvant-Induced Arthritis. J Environ. Pathol. Toxicol. Oncol. 2021, 40, 43–52. [Google Scholar] [CrossRef]
- Madsen, R.K.; Lundstedt, T.; Gabrielsson, J.; Sennbro, C.-J.; Alenius, G.-M.; Moritz, T.; Rantapää-Dahlqvist, S.; Trygg, J. Diagnostic properties of metabolic perturbations in rheumatoid arthritis. Arthritis Res. Ther. 2011, 13, R19. [Google Scholar] [CrossRef] [Green Version]
- Luan, H.; Gu, W.; Li, H.; Wang, Z.; Lu, L.; Ke, M.; Lu, J.; Chen, W.; Lan, Z.; Xiao, Y.; et al. Serum metabolomic and lipidomic profiling identifies diagnostic biomarkers for seropositive and seronegative rheumatoid arthritis patients. J. Transl. Med. 2021, 19, 500. [Google Scholar] [CrossRef] [PubMed]
- Chandrasekharan, U.M.; Wang, Z.; Wu, Y.; Wilson Tang, W.H.; Hazen, S.L.; Wang, S.; Elaine Husni, M. Elevated levels of plasma symmetric dimethylarginine and increased arginase activity as potential indicators of cardiovascular comorbidity in rheumatoid arthritis. Arthritis Res. Ther. 2018, 20, 123. [Google Scholar] [CrossRef] [PubMed] [Green Version]
- Zabek, A.; Swierkot, J.; Malak, A.; Zawadzka, I.; Deja, S.; Bogunia-Kubik, K.; Mlynarz, P. Application of 1H NMR-based serum metabolomic studies for monitoring female patients with rheumatoid arthritis. J. Pharm. Biomed. Anal. 2016, 117, 544–550. [Google Scholar] [CrossRef] [Green Version]
- Ahn, J.K.; Kim, S.; Kim, J.; Hwang, J.; Kim, K.H.; Cha, H.-S. A Comparative Metabolomic Evaluation of Behcet’s Disease with Arthritis and Seronegative Arthritis Using Synovial Fluid. PLoS ONE 2015, 10, e0135856. [Google Scholar] [CrossRef]
- Priori, R.; Casadei, L.; Valerio, M.; Scrivo, R.; Valesini, G.; Manetti, C. ¹H-NMR-Based Metabolomic Study for Identifying Serum Profiles Associated with the Response to Etanercept in Patients with Rheumatoid Arthritis. PLoS ONE 2015, 10, e0138537. [Google Scholar] [CrossRef]
- Takahashi, S.; Saegusa, J.; Onishi, A.; Morinobu, A. Biomarkers identified by serum metabolomic analysis to predict biologic treatment response in rheumatoid arthritis patients. Rheumatology 2019, 58, 2153–2161. [Google Scholar] [CrossRef]
- Alonso, A.; Julià, A.; Vinaixa, M.; Domènech, E.; Fernández-Nebro, A.; Cañete, J.D.; Ferrándiz, C.; Tornero, J.; Gisbert, J.P.; Nos, P.; et al. Urine metabolome profiling of immune-mediated inflammatory diseases. BMC Med. 2016, 14, 133. [Google Scholar] [CrossRef]
- Kapoor, S.R.; Filer, A.; Fitzpatrick, M.A.; Fisher, B.A.; Taylor, P.C.; Buckley, C.D.; McInnes, I.B.; Raza, K.; Young, S.P. Metabolic profiling predicts response to anti-tumor necrosis factor α therapy in patients with rheumatoid arthritis. Arthritis Rheum. 2013, 65, 1448–1456. [Google Scholar] [CrossRef] [PubMed]
- Young, S.P.; Kapoor, S.R.; Viant, M.R.; Byrne, J.J.; Filer, A.; Buckley, C.D.; Kitas, G.D.; Raza, K. The impact of inflammation on metabolomic profiles in patients with arthritis. Arthritis Rheum. 2013, 65, 2015–2023. [Google Scholar] [CrossRef] [PubMed] [Green Version]
- Lauridsen, M.B.; Bliddal, H.; Christensen, R.; Danneskiold-Samsøe, B.; Bennett, R.; Keun, H.; Lindon, J.C.; Nicholson, J.K.; Dorff, M.H.; Jaroszewski, J.W.; et al. 1H NMR spectroscopy-based interventional metabolic phenotyping: A cohort study of rheumatoid arthritis patients. J. Proteome Res. 2010, 9, 4545–4553. [Google Scholar] [CrossRef] [PubMed]
- Yang, X.Y.; Di Zheng, K.; Lin, K.; Zheng, G.; Zou, H.; Wang, J.M.; Lin, Y.Y.; Chuka, C.M.; Ge, R.S.; Zhai, W.; et al. Energy Metabolism Disorder as a Contributing Factor of Rheumatoid Arthritis: A Comparative Proteomic and Metabolomic Study. PLoS ONE 2015, 10, e0132695. [Google Scholar] [CrossRef] [PubMed]
- Krähenbühl, S.; Willer, B.; Brühlmann, P.; Hoppeler, H.; Stucki, G. Carnitine homeostasis in patients with rheumatoid arthritis. Clin. Chim. Acta 1999, 279, 35–45. [Google Scholar] [CrossRef]
- Chu, S.H.; Cui, J.; Sparks, J.A.; Lu, B.; Tedeschi, S.K.; Speyer, C.B.; Moss, L.; Feser, M.L.; Kelmenson, L.B.; Mewshaw, E.A.; et al. Circulating plasma metabolites and risk of rheumatoid arthritis in the Nurses’ Health Study. Rheumatology 2020, 59, 3369–3379. [Google Scholar] [CrossRef]
- Ottas, A.; Fishman, D.; Okas, T.-L.; Kingo, K.; Soomets, U. The metabolic analysis of psoriasis identifies the associated metabolites while providing computational models for the monitoring of the disease. Arch. Dermatol. Res. 2017, 309, 519–528. [Google Scholar] [CrossRef] [Green Version]
- Zhou, J.; Chen, J.; Hu, C.; Xie, Z.; Li, H.; Wei, S.; Wang, D.; Wen, C.; Xu, G. Exploration of the serum metabolite signature in patients with rheumatoid arthritis using gas chromatography-mass spectrometry. J. Pharm. Biomed. Anal. 2016, 127, 60–67. [Google Scholar] [CrossRef]
- Rantapää-Dahlqvist, S.; Wållberg-Jonsson, S.; Dahlén, G. Lipoprotein (a), lipids, and lipoproteins in patients with rheumatoid arthritis. Ann. Rheum. Dis. 1991, 50, 366–368. [Google Scholar] [CrossRef] [Green Version]
- Myasoedova, E.; Crowson, C.S.; Kremers, H.M.; Fitz-Gibbon, P.D.; Therneau, T.M.; Gabriel, S.E. Total cholesterol and LDL levels decrease before rheumatoid arthritis. Ann. Rheum. Dis. 2010, 69, 1310–1314. [Google Scholar] [CrossRef] [Green Version]
- Liao, K.P.; Cai, T.; Gainer, V.S.; Cagan, A.; Murphy, S.N.; Liu, C.; Churchill, S.; Shaw, S.Y.; Kohane, I.; Solomon, D.H.; et al. Lipid and lipoprotein levels and trend in rheumatoid arthritis compared to the general population. Arthritis Care Res. 2013, 65, 2046–2050. [Google Scholar] [CrossRef] [PubMed]
- Van Halm, V.P.; Nielen, M.M.J.; Nurmohamed, M.T.; van Schaardenburg, D.; Reesink, H.W.; Voskuyl, A.E.; Twisk, J.W.R.; van de Stadt, R.J.; de Koning, M.H.M.T.; Habibuw, M.R.; et al. Lipids and inflammation: Serial measurements of the lipid profile of blood donors who later developed rheumatoid arthritis. Ann. Rheum. Dis. 2007, 66, 184–188. [Google Scholar] [CrossRef] [PubMed] [Green Version]
- Li, J.; Che, N.; Xu, L.; Zhang, Q.; Wang, Q.; Tan, W.; Zhang, M. LC-MS-based serum metabolomics reveals a distinctive signature in patients with rheumatoid arthritis. Clin. Rheumatol. 2018, 37, 1493–1502. [Google Scholar] [CrossRef] [PubMed]
- Plutzky, J.; Liao, K.P. Lipids in RA: Is Less Not Necessarily More? Curr. Rheumatol. Rep. 2018, 20, 8. [Google Scholar] [CrossRef] [PubMed] [Green Version]
- Robertson, J.; Porter, D.; Sattar, N.; Packard, C.J.; Caslake, M.; McInnes, I.; McCarey, D. Interleukin-6 blockade raises LDL via reduced catabolism rather than via increased synthesis: A cytokine-specific mechanism for cholesterol changes in rheumatoid arthritis. Ann. Rheum. Dis. 2017, 76, 1949–1952. [Google Scholar] [CrossRef] [PubMed] [Green Version]
- Charles-Schoeman, C.; Fleischmann, R.; Davignon, J.; Schwartz, H.; Turner, S.M.; Beysen, C.; Milad, M.; Hellerstein, M.K.; Luo, Z.; Kaplan, I.V.; et al. Potential mechanisms leading to the abnormal lipid profile in patients with rheumatoid arthritis versus healthy volunteers and reversal by tofacitinib. Arthritis Rheumatol. 2015, 67, 616–625. [Google Scholar] [CrossRef] [PubMed]
- Jonsson, S.W.; Backman, C.; Johnson, O.; Karp, K.; Lundström, E.; Sundqvist, K.G.; Dahlqvist, S.R. Increased prevalence of atherosclerosis in patients with medium term rheumatoid arthritis. J. Rheumatol. 2001, 28, 2597–2602. [Google Scholar]
- Koh, J.H.; Yoon, S.J.; Kim, M.; Cho, S.; Lim, J.; Park, Y.; Kim, H.-S.; Kwon, S.W.; Kim, W.-U. Lipidome profile predictive of disease evolution and activity in rheumatoid arthritis. Exp. Mol. Med. 2022, 54, 143–155. [Google Scholar] [CrossRef]
- Kishikawa, T.; Maeda, Y.; Nii, T.; Arase, N.; Hirata, J.; Suzuki, K.; Yamamoto, K.; Masuda, T.; Ogawa, K.; Tsuji, S.; et al. Increased levels of plasma nucleotides in patients with rheumatoid arthritis. Int. Immunol. 2021, 33, 119–124. [Google Scholar] [CrossRef]
- Souto-Carneiro, M.; Tóth, L.; Behnisch, R.; Urbach, K.; Klika, K.D.; Carvalho, R.A.; Lorenz, H.-M. Differences in the serum metabolome and lipidome identify potential biomarkers for seronegative rheumatoid arthritis versus psoriatic arthritis. Ann. Rheum. Dis. 2020, 79, 499–506. [Google Scholar] [CrossRef] [Green Version]
- Hur, B.; Gupta, V.K.; Huang, H.; Wright, K.A.; Warrington, K.J.; Taneja, V.; Davis, J.M.; Sung, J. Plasma metabolomic profiling in patients with rheumatoid arthritis identifies biochemical features predictive of quantitative disease activity. Arthritis Res. Ther. 2021, 23, 164. [Google Scholar] [CrossRef] [PubMed]
- Cuppen, B.V.J.; Fu, J.; van Wietmarschen, H.A.; Harms, A.C.; Koval, S.; Marijnissen, A.C.A.; Peeters, J.J.W.; Bijlsma, J.W.J.; Tekstra, J.; van Laar, J.M.; et al. Exploring the Inflammatory Metabolomic Profile to Predict Response to TNF-α Inhibitors in Rheumatoid Arthritis. PLoS ONE 2016, 11, e0163087. [Google Scholar] [CrossRef] [PubMed] [Green Version]
- Surowiec, I.; Ärlestig, L.; Rantapää-Dahlqvist, S.; Trygg, J. Metabolite and Lipid Profiling of Biobank Plasma Samples Collected Prior to Onset of Rheumatoid Arthritis. PLoS ONE 2016, 11, e0164196. [Google Scholar] [CrossRef]
- Looby, N.; Roszkowska, A.; Reyes-Garcés, N.; Yu, M.; Bączek, T.; Kulasingam, V.; Pawliszyn, J.; Chandran, V. Serum metabolic fingerprinting of psoriasis and psoriatic arthritis patients using solid-phase microextraction-liquid chromatography-high-resolution mass spectrometry. Metab. Off. J. Metab. Soc. 2021, 17, 59. [Google Scholar] [CrossRef]
- Armstrong, A.W.; Wu, J.; Johnson, M.A.; Grapov, D.; Azizi, B.; Dhillon, J.; Fiehn, O. Metabolomics in psoriatic disease: Pilot study reveals metabolite differences in psoriasis and psoriatic arthritis. F1000Research 2014, 3, 248. [Google Scholar] [CrossRef] [Green Version]
- Coras, R.; Kavanaugh, A.; Boyd, T.; Huynh, D.; Lagerborg, K.A.; Xu, Y.-J.; Rosenthal, S.B.; Jain, M.; Guma, M. Choline metabolite, trimethylamine N-oxide (TMAO), is associated with inflammation in psoriatic arthritis. Clin. Exp. Rheumatol. 2019, 37, 481–484. [Google Scholar]
- Coras, R.; Kavanaugh, A.; Boyd, T.; Huynh, Q.; Pedersen, B.; Armando, A.M.; Dahlberg-Wright, S.; Marsal, S.; Jain, M.; Paravar, T.; et al. Pro- and anti-inflammatory eicosanoids in psoriatic arthritis. Metab. Off. J. Metab. Soc. 2019, 15, 65. [Google Scholar] [CrossRef]
- Wójcik, P.; Biernacki, M.; Wroński, A.; Łuczaj, W.; Waeg, G.; Žarković, N.; Skrzydlewska, E. Altered Lipid Metabolism in Blood Mononuclear Cells of Psoriatic Patients Indicates Differential Changes in Psoriasis Vulgaris and Psoriatic Arthritis. Int. J. Mol. Sci. 2019, 20, 4249. [Google Scholar] [CrossRef] [Green Version]
- Haroon, M.; Gallagher, P.; FitzGerald, O. Diagnostic delay of more than 6 months contributes to poor radiographic and functional outcome in psoriatic arthritis. Ann. Rheum. Dis. 2015, 74, 1045–1050. [Google Scholar] [CrossRef]
- Kishikawa, T.; Arase, N.; Tsuji, S.; Maeda, Y.; Nii, T.; Hirata, J.; Suzuki, K.; Yamamoto, K.; Masuda, T.; Ogawa, K.; et al. Large-scale plasma-metabolome analysis identifies potential biomarkers of psoriasis and its clinical subtypes. J. Dermatol. Sci. 2021, 102, 78–84. [Google Scholar] [CrossRef]
- Ambrożewicz, E.; Wójcik, P.; Wroński, A.; Łuczaj, W.; Jastrząb, A.; Žarković, N.; Skrzydlewska, E. Pathophysiological Alterations of Redox Signaling and Endocannabinoid System in Granulocytes and Plasma of Psoriatic Patients. Cells 2018, 7, 159. [Google Scholar] [CrossRef] [PubMed] [Green Version]
- Kamleh, M.A.; Snowden, S.G.; Grapov, D.; Blackburn, G.J.; Watson, D.G.; Xu, N.; Ståhle, M.; Wheelock, C.E. LC-MS metabolomics of psoriasis patients reveals disease severity-dependent increases in circulating amino acids that are ameliorated by anti-TNFα treatment. J. Proteome Res. 2015, 14, 557–566. [Google Scholar] [CrossRef] [PubMed] [Green Version]
- Kang, H.; Li, X.; Zhou, Q.; Quan, C.; Xue, F.; Zheng, J.; Yu, Y. Exploration of candidate biomarkers for human psoriasis based on gas chromatography-mass spectrometry serum metabolomics. Br. J. Dermatol. 2017, 176, 713–722. [Google Scholar] [CrossRef] [PubMed]
- Li, S.-S.; Liu, Y.; Li, H.; Wang, L.-P.; Xue, L.-F.; Yin, G.-S.; Wu, X.-S. Identification of psoriasis vulgaris biomarkers in human plasma by non-targeted metabolomics based on UPLC-Q-TOF/MS. Eur. Rev. Med. Pharmacol. Sci. 2019, 23, 3940–3950. [Google Scholar] [CrossRef]
- Sorokin, A.V.; Domenichiello, A.F.; Dey, A.K.; Yuan, Z.-X.; Goyal, A.; Rose, S.M.; Playford, M.P.; Ramsden, C.E.; Mehta, N.N. Bioactive Lipid Mediator Profiles in Human Psoriasis Skin and Blood. J. Investig. Dermatol. 2018, 138, 1518–1528. [Google Scholar] [CrossRef] [Green Version]
- Pohla, L.; Ottas, A.; Kaldvee, B.; Abram, K.; Soomets, U.; Zilmer, M.; Reemann, P.; Jaks, V.; Kingo, K. Hyperproliferation is the main driver of metabolomic changes in psoriasis lesional skin. Sci. Rep. 2020, 10, 3081. [Google Scholar] [CrossRef] [Green Version]
- Zeng, C.; Wen, B.; Hou, G.; Lei, L.; Mei, Z.; Jia, X.; Chen, X.; Zhu, W.; Li, J.; Kuang, Y.; et al. Lipidomics profiling reveals the role of glycerophospholipid metabolism in psoriasis. GigaScience 2017, 6, 1–11. [Google Scholar] [CrossRef] [Green Version]
- Li, L.; Yao, D.-N.; Lu, Y.; Deng, J.-W.; Wei, J.-A.; Yan, Y.-H.; Deng, H.; Han, L.; Lu, C.-J. Metabonomics Study on Serum Characteristic Metabolites of Psoriasis Vulgaris Patients with Blood-Stasis Syndrome. Front. Pharmacol. 2020, 11, 558731. [Google Scholar] [CrossRef]
- Koussiouris, J.; Looby, N.; Anderson, M.; Kulasingam, V.; Chandran, V. Metabolomics Studies in Psoriatic Disease: A Review. Metabolites 2021, 11, 375. [Google Scholar] [CrossRef]
- Lin, Z.-Y.; Xu, P.-B.; Yan, S.-K.; Meng, H.-B.; Yang, G.-J.; Dai, W.-X.; Liu, X.-R.; Li, J.-B.; Deng, X.-M.; Zhang, W.-D. A metabonomic approach to early prognostic evaluation of experimental sepsis by 1H NMR and pattern recognition. NMR Biomed. 2009, 22, 601–608. [Google Scholar] [CrossRef]
- Weljie, A.M.; Dowlatabadi, R.; Miller, B.J.; Vogel, H.J.; Jirik, F.R. An inflammatory arthritis-associated metabolite biomarker pattern revealed by 1H NMR spectroscopy. J. Proteome Res. 2007, 6, 3456–3464. [Google Scholar] [CrossRef] [PubMed]
- Coates, L.C.; FitzGerald, O.; Helliwell, P.S.; Paul, C. Psoriasis, psoriatic arthritis, and rheumatoid arthritis: Is all inflammation the same? Semin. Arthritis Rheum. 2016, 46, 291–304. [Google Scholar] [CrossRef] [PubMed] [Green Version]
- Blackmore, D.; Li, L.; Wang, N.; Maksymowych, W.; Yacyshyn, E.; Siddiqi, Z.A. Metabolomic profile overlap in prototypical autoimmune humoral disease: A comparison of myasthenia gravis and rheumatoid arthritis. Metab. Off. J. Metab. Soc. 2020, 16, 10. [Google Scholar] [CrossRef] [PubMed]
- Dawiskiba, T.; Deja, S.; Mulak, A.; Ząbek, A.; Jawień, E.; Pawełka, D.; Banasik, M.; Mastalerz-Migas, A.; Balcerzak, W.; Kaliszewski, K.; et al. Serum and urine metabolomic fingerprinting in diagnostics of inflammatory bowel diseases. World J. Gastroenterol. 2014, 20, 163–174. [Google Scholar] [CrossRef]
- Wu, T.; Xie, C.; Han, J.; Ye, Y.; Weiel, J.; Li, Q.; Blanco, I.; Ahn, C.; Olsen, N.; Putterman, C.; et al. Metabolic disturbances associated with systemic lupus erythematosus. PLoS ONE 2012, 7, e37210. [Google Scholar] [CrossRef] [Green Version]
- Bengtsson, A.A.; Trygg, J.; Wuttge, D.M.; Sturfelt, G.; Theander, E.; Donten, M.; Moritz, T.; Sennbro, C.-J.; Torell, F.; Lood, C.; et al. Metabolic Profiling of Systemic Lupus Erythematosus and Comparison with Primary Sjögren’s Syndrome and Systemic Sclerosis. PLoS ONE 2016, 11, e0159384. [Google Scholar] [CrossRef]
- Guleria, A.; Pratap, A.; Dubey, D.; Rawat, A.; Chaurasia, S.; Sukesh, E.; Phatak, S.; Ajmani, S.; Kumar, U.; Khetrapal, C.L.; et al. NMR based serum metabolomics reveals a distinctive signature in patients with Lupus Nephritis. Sci. Rep. 2016, 6, 35309. [Google Scholar] [CrossRef] [Green Version]
- Nieminen, P.; Hämäläinen, W.; Savinainen, J.; Lehtonen, M.; Lehtiniemi, S.; Rinta-Paavola, J.; Lehenkari, P.; Kääriäinen, T.; Joukainen, A.; Kröger, H.; et al. Metabolomics of Synovial Fluid and Infrapatellar Fat Pad in Patients with Osteoarthritis or Rheumatoid Arthritis. Inflammation 2022, 45, 1101–1117. [Google Scholar] [CrossRef]
- Tsoukalas, D.; Fragoulakis, V.; Papakonstantinou, E.; Antonaki, M.; Vozikis, A.; Tsatsakis, A.; Buga, A.M.; Mitroi, M.; Calina, D. Prediction of Autoimmune Diseases by Targeted Metabolomic Assay of Urinary Organic Acids. Metabolites 2020, 10, 502. [Google Scholar] [CrossRef]
- Yan, B.; Huang, J.; Zhang, C.; Hu, X.; Gao, M.; Shi, A.; Zha, W.; Shi, L.; Huang, C.; Yang, L. Serum metabolomic profiling in patients with systemic lupus erythematosus by GC/MS. Mod. Rheumatol. 2016, 26, 914–922. [Google Scholar] [CrossRef]
- Yan, D.; Afifi, L.; Jeon, C.; Trivedi, M.; Chang, H.W.; Lee, K.; Liao, W. The metabolomics of psoriatic disease. Psoriasis 2017, 7, 1–15. [Google Scholar] [CrossRef] [Green Version]


| Metabolites or Pathway | Trend | Indication | Matrix | Instruments | Biomarker Categories * | References |
|---|---|---|---|---|---|---|
| Nucleotides (ATP, GDP, ADP) | ↑ | RA (compared to PsA and SLE) | Plasma | CE–TOF-MS | D | Kishikawa 2021 [60] |
| Ethanolamine phosphate | ↑ | |||||
| 6-Aminohexanoic acid | ↑ | |||||
| Taurine | ↑ | |||||
| Xanthine | ↓ | |||||
| Glutamine | ↑ | RA (compared to PsA) | Serum | GC–TOF-MS UPLC–MS | D | Madsen 2011 [34] |
| Heptanoic acid | ↑ | |||||
| Succinic acid | ↑ | |||||
| Pseudouridine | ↑ | |||||
| Inosine | ↑ | |||||
| Guanosine | ↑ | |||||
| Arabitol | ↑ | |||||
| Cystine | ↑ | |||||
| Cysteine | ↑ | |||||
| Phosphoric acid | ↑ | |||||
| Aspartic acid | ↓ | |||||
| Glutamic acid | ↓ | |||||
| Histidine | ↓ | |||||
| Serine | ↓ | |||||
| Arachidonic acid | ↓ | |||||
| Cholesterol | ↓ | |||||
| Threonic acid | ↓ | |||||
| 1-Monooleoylglycerol | ↓ | |||||
| Alanine, Threonine, Leucine, Valine | ↑ | PsA (compared to seronegative RA) | Serum | 1H-single-pulse NMR and CPMG NMR | D | Souto-Carneiro 2020 [61] |
| Acetic acid | ↑ | |||||
| Lactic acid | ↑ | |||||
| Choline | ↑ | |||||
| Creatine | ↑ | |||||
| Phenylalanine | ↓ | |||||
| Specific lipid ratios | ↓ | |||||
| Lignoceric acid | ↑ | PsA (compared to Ps) | Serum | GC–TOF-MS | D | Armstrong 2014 [66] |
| α-Ketoglutaric acid | ↓ | |||||
| Tyramine | ↑ | PsA (compared to Ps) | Plasma | CE–TOF-MS LC–TOF-MS | D | Kishikawa 2021 [71] |
| Mucic acid | ↓ | |||||
| Phospholip. LA (18:2) | ↓ | PsA (compared to Ps) | Plasma | UPLC–QTOF-MS GC-FID | D | Ambrożewicz 2018 [72] |
| Phospholip. LA (18:3) | ↓ | |||||
| Free AA (20:4) | ↓ | |||||
| Free DHA (22:6) | ↓ | |||||
| Long-chain fatty acids | ↑ | PsA (compared to Ps) | Serum | HPLC–HRMS (SPME) | D, M | Looby 2021 [65] |
| 1,11-Undecanedicarboxylic acid | ↑ | |||||
| Eicosanoids | ↑ | |||||
| 8-isoPGF2α | ↑ | PsA (compared to Ps) | Mononuclear cells | UPLC–TOF-MS | D, Pro | Wójcik 2019 [69] |
| 4-HNE | ↑ | |||||
| 4-HNE adducts | ↓ | |||||
| 15-d-PGJ2 | ↓ | |||||
| 15-HETE | ↓ | |||||
| Formic acid | ↓ | SLE (compared to RA) | Serum | 1H-NMR | D | Ouyang 2011 [29] |
Publisher’s Note: MDPI stays neutral with regard to jurisdictional claims in published maps and institutional affiliations. |
© 2022 by the authors. Licensee MDPI, Basel, Switzerland. This article is an open access article distributed under the terms and conditions of the Creative Commons Attribution (CC BY) license (https://creativecommons.org/licenses/by/4.0/).
Share and Cite
Dorochow, E.; Köhm, M.; Hahnefeld, L.; Gurke, R. Metabolic Profiling in Rheumatoid Arthritis, Psoriatic Arthritis, and Psoriasis: Elucidating Pathogenesis, Improving Diagnosis, and Monitoring Disease Activity. J. Pers. Med. 2022, 12, 924. https://doi.org/10.3390/jpm12060924
Dorochow E, Köhm M, Hahnefeld L, Gurke R. Metabolic Profiling in Rheumatoid Arthritis, Psoriatic Arthritis, and Psoriasis: Elucidating Pathogenesis, Improving Diagnosis, and Monitoring Disease Activity. Journal of Personalized Medicine. 2022; 12(6):924. https://doi.org/10.3390/jpm12060924
Chicago/Turabian StyleDorochow, Erika, Michaela Köhm, Lisa Hahnefeld, and Robert Gurke. 2022. "Metabolic Profiling in Rheumatoid Arthritis, Psoriatic Arthritis, and Psoriasis: Elucidating Pathogenesis, Improving Diagnosis, and Monitoring Disease Activity" Journal of Personalized Medicine 12, no. 6: 924. https://doi.org/10.3390/jpm12060924