
Obesity-Associated Differentially Methylated Regions in Colon Cancer


Abstract
:1. Introduction
2. Materials and Methods
2.1. Demographic and Methylation Data
2.2. DMR Bioinformatics Analysis
2.3. Predictive Analysis
3. Results
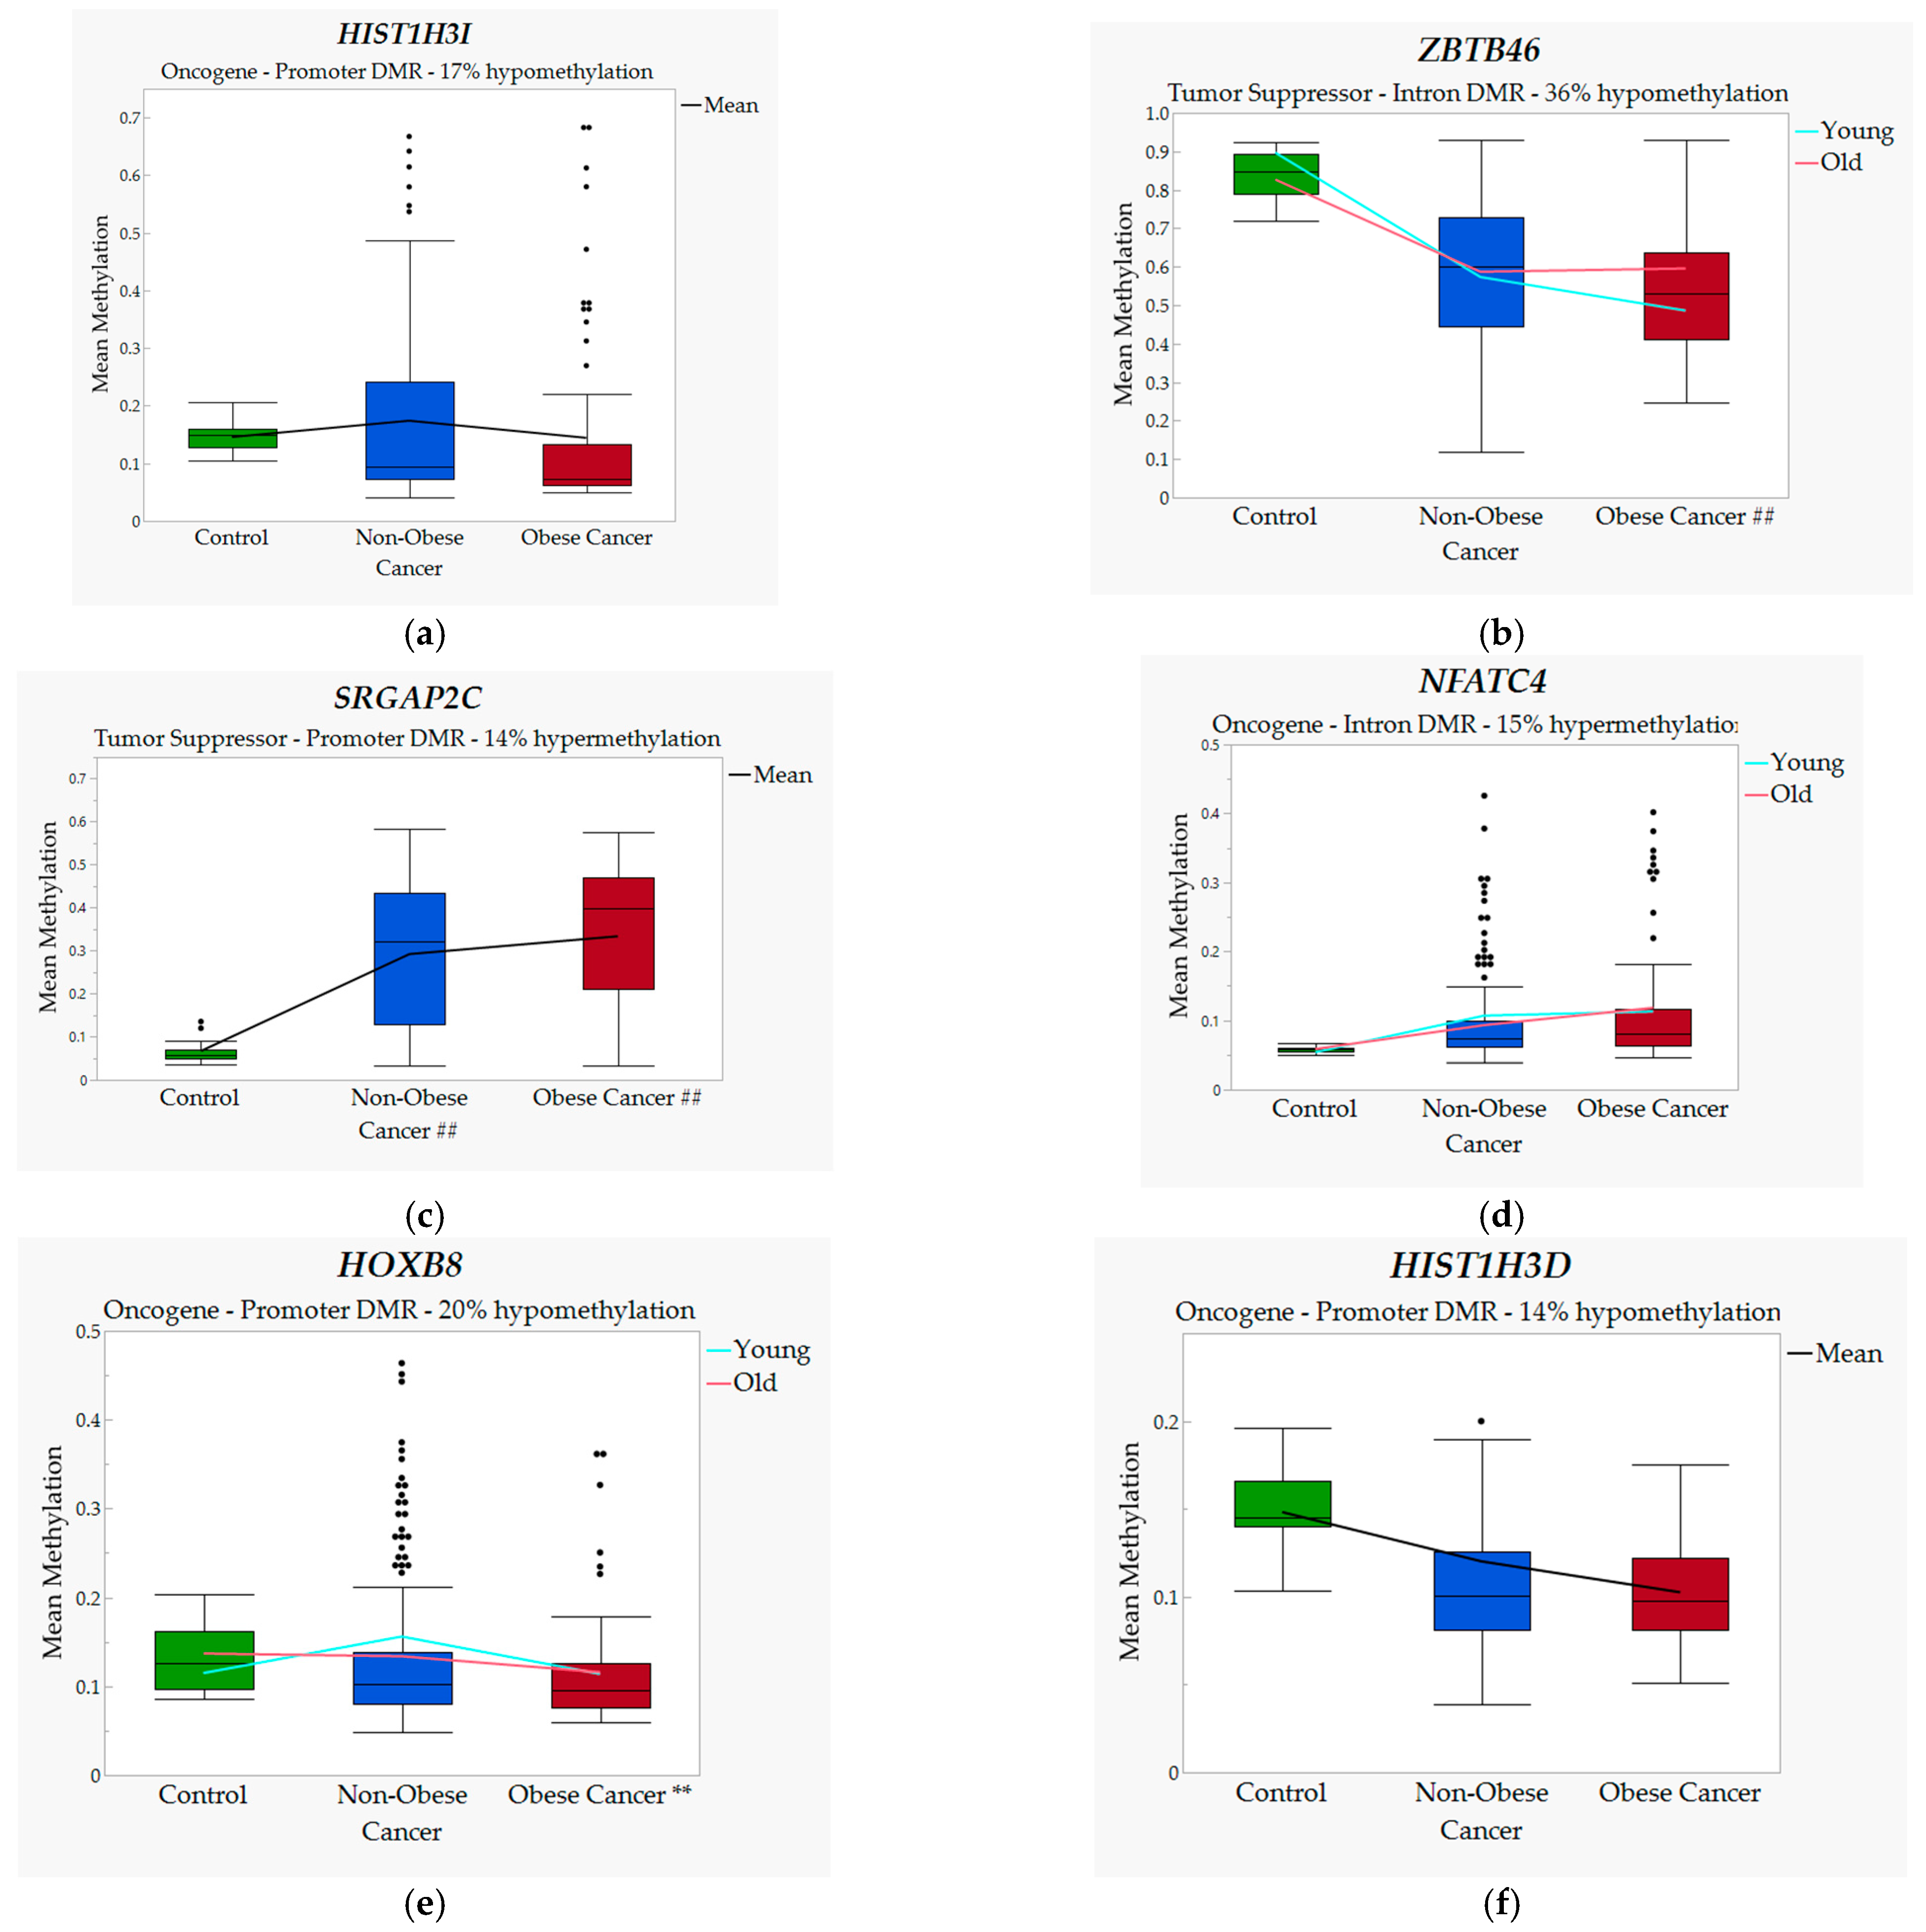
3.1. Significant DMRs and Associated Genes between Groups
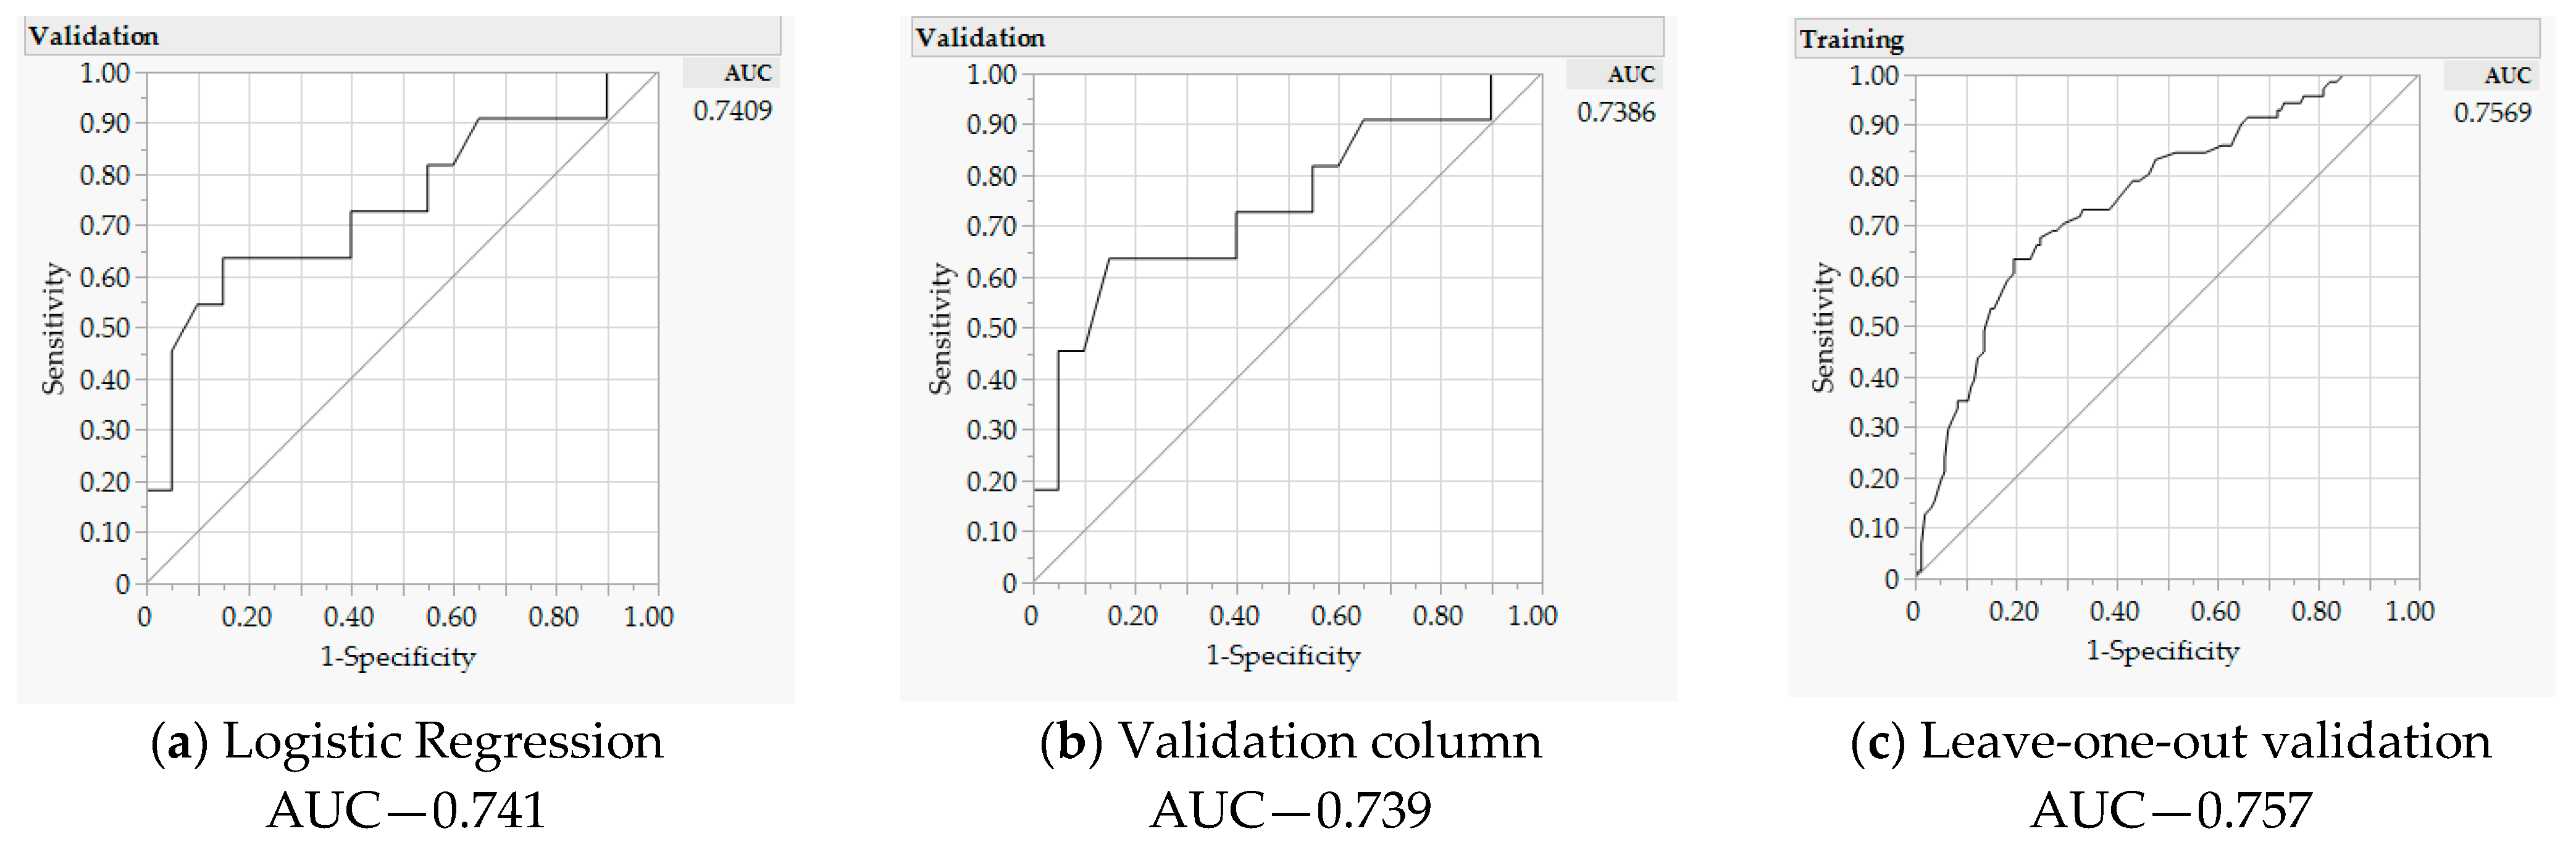
3.2. Significant Predictors
4. Discussion
Supplementary Materials
Author Contributions
Funding
Institutional Review Board Statement
Informed Consent Statement
Acknowledgments
Conflicts of Interest
References
- WHO. Obesity and Overweight. Available online: http://www.who.int/en/news-room/fact-sheets/detail/obesity-and-overweight (accessed on 3 January 2021).
- Almen, M.S.; Nilsson, E.K.; Jacobsson, J.A.; Kalnina, I.; Klovins, J.; Fredriksson, R.; Schioth, H.B. Genome-wide analysis reveals DNA methylation markers that vary with both age and obesity. Gene 2014, 548, 61–67. [Google Scholar] [CrossRef] [PubMed]
- Dick, K.J.; Nelson, C.P.; Tsaprouni, L.; Sandling, J.K.; Aïssi, D.; Wahl, S.; Meduri, E.; Morange, P.-E.; Gagnon, F.; Grallert, H.; et al. DNA methylation and body-mass index: A genome-wide analysis. Lancet 2014, 383, 1990–1998. [Google Scholar] [CrossRef] [Green Version]
- Printz, C. Extreme obesity may shorten life expectancy up to 14 years. Cancer 2014, 120, 3591. [Google Scholar] [CrossRef] [PubMed]
- Shiao, S.P.K.; Grayson, J.; Yu, C.H.; Wasek, B.; Bottiglieri, T. Gene Environment Interactions and Predictors of Colorectal Cancer in Family-Based, Multi-Ethnic Groups. J. Pers. Med. 2018, 8, 10. [Google Scholar] [CrossRef] [Green Version]
- Jones, P.A.; Baylin, S.B. The Epigenomics of Cancer. Cell 2007, 128, 683–692. [Google Scholar] [CrossRef] [Green Version]
- Ayers, D.; Boughanem, H.; Macías-González, M. Epigenetic Influences in the Obesity/Colorectal Cancer Axis: A Novel Theragnostic Avenue. J. Oncol. 2019, 2019, 7406078. [Google Scholar] [CrossRef] [Green Version]
- Luo, J.; Hendryx, M.; Manson, J.E.; Figueiredo, J.C.; LeBlanc, E.S.; Barrington, W.; Rohan, T.E.; Howard, B.V.; Reding, K.; Ho, G.Y.; et al. Intentional Weight Loss and Obesity-Related Cancer Risk. JNCI Cancer Spectr. 2019, 3, pkz054. [Google Scholar] [CrossRef]
- Wu, S.; Liu, J.; Wang, X.; Li, M.; Gan, Y.; Tang, Y. Association of obesity and overweight with overall survival in colorectal cancer patients: A meta-analysis of 29 studies. Cancer Causes Control 2014, 25, 1489–1502. [Google Scholar] [CrossRef]
- Gao, Y.; Cao, Y.; Tan, A.; Liao, C.; Mo, Z.; Gao, F. Glutathione S-transferase M1 polymorphism and sporadic colorectal cancer risk: An updating meta-analysis and HuGE review of 36 case-control studies. Ann. Epidemiol. 2010, 20, 108–121. [Google Scholar] [CrossRef]
- Society, A.C. Cancer Facts and Figures 2022; American Cancer Society: Atlanta, GA, USA, 2022; Volume 500822. [Google Scholar]
- Yu, M.; Hazelton, W.D.; Luebeck, G.E.; Grady, W.M. Epigenetic aging: More than just a clock when it comes to cancer. Cancer Res. 2019, 80, 367–374. [Google Scholar] [CrossRef] [Green Version]
- Zheng, C.; Li, L.; Xu, R. Association of Epigenetic Clock with Consensus Molecular Subtypes and Overall Survival of Colorectal Cancer. Cancer Epidemiol. Biomark. Prev. 2019, 28, 1720–1724. [Google Scholar] [CrossRef] [PubMed]
- Islami, F.; Goding Sauer, A.; Miller, K.D.; Siegel, R.L.; Fedewa, S.A.; Jacobs, E.J.; Mc Cullough, M.L.; Patel, A.V.; Ma, J.; Soerjomataram, I.; et al. Proportion and number of cancer cases and deaths attributable to potentially modifiable risk factors in the United States. CA Cancer J. Clin. 2018, 68, 31–54. [Google Scholar] [CrossRef] [PubMed]
- Andreasson, A.; Hagstrom, H.; Skoldberg, F.; Onnerhag, K.; Carlsson, A.C.; Schmidt, P.T.; Forsberg, A.M. The prediction of colorectal cancer using anthropometric measures: A Swedish population-based cohort study with 22 years of follow-up. United Eur. Gastroenterol. J. 2019, 7, 1250–1260. [Google Scholar] [CrossRef] [PubMed] [Green Version]
- Bjorge, T.; Haggstrom, C.; Ghaderi, S.; Nagel, G.; Manjer, J.; Tretli, S.; Ulmer, H.; Harlid, S.; Rosendahl, A.H.; Lang, A.; et al. BMI and weight changes and risk of obesity-related cancers: A pooled European cohort study. Int. J. Epidemiol. 2019, 48, 1872–1885. [Google Scholar] [CrossRef] [PubMed]
- Garcia, H.; Song, M. Early-life obesity and adulthood colorectal cancer risk: A meta-analysis. Rev. Panam. De Salud Publica Pan Am. J. Public Health 2019, 43, e3. [Google Scholar] [CrossRef] [PubMed] [Green Version]
- Naber, S.K.; Kundu, S.; Kuntz, K.M.; Dotson, W.D.; Williams, M.S.; Zauber, A.G.; Calonge, N.; Zallen, D.T.; Ganiats, T.G.; Webber, E.M.; et al. Cost-effectiveness of risk-stratified colorectal cancer screening based on polygenic risk—current status and future potential. JNCI Cancer Spectr. 2019, 4, pkz086. [Google Scholar] [CrossRef]
- Anania, G.; Resta, G.; Marino, S.; Fabbri, N.; Scagliarini, L.; Marchitelli, I.; Fiorica, F.; Cavallesco, G. Treatment of Colorectal Cancer: A Multidisciplinary Approach. J. Gastrointest. Cancer 2018, 50, 458–468. [Google Scholar] [CrossRef]
- Siegel, R.L.; Miller, K.D.; Goding Sauer, A.; Fedewa, S.A.; Butterly, L.F.; Anderson, J.C.; Cercek, A.; Smith, R.A.; Jemal, A. Colorectal cancer statistics, 2020. CA Cancer J. Clin. 2020, 70, 145–164. [Google Scholar] [CrossRef] [Green Version]
- Ahn, J.B.; Chung, W.B.; Maeda, O.; Shin, S.J.; Kim, H.S.; Chung, H.C.; Kim, N.K.; Issa, J.P. DNA methylation predicts recurrence from resected stage III proximal colon cancer. Cancer 2011, 117, 1847–1854. [Google Scholar] [CrossRef] [Green Version]
- Beaulieu, J.-F. (Ed.) Colorectal Cancer: Methods and Protocols; Humana Press: New York, NY, USA, 2018; Volume 1765, p. 348. [Google Scholar]
- Berger, S.L.; Kouzarides, T.; Shiekhattar, R.; Shilatifard, A. An operational definition of epigenetics. Genes Dev. 2009, 23, 781–783. [Google Scholar] [CrossRef] [Green Version]
- Borchiellini, M.; Ummarino, S.; Di Ruscio, A. The Bright and Dark Side of DNA Methylation: A Matter of Balance. Cells 2019, 8, 1243. [Google Scholar] [CrossRef] [PubMed] [Green Version]
- Ajonijebu, D.C.; Abboussi, O.; Russell, V.A.; Mabandla, M.V.; Daniels, W.M.U. Epigenetics: A link between addiction and social environment. Cell. Mol. Life Sci. CMLS 2017, 74, 2735–2747. [Google Scholar] [CrossRef] [PubMed]
- Andersen, V.; Holst, R.; Vogel, U. Systematic review: Diet-gene interactions and the risk of colorectal cancer. Aliment Pharm. 2013, 37, 383–391. [Google Scholar] [CrossRef] [PubMed] [Green Version]
- Crujeiras, A.B.; Morcillo, S.; Diaz-Lagares, A.; Sandoval, J.; Castellano-Castillo, D.; Torres, E.; Hervas, D.; Moran, S.; Esteller, M.; Macias-Gonzalez, M.; et al. Identification of an episignature of human colorectal cancer associated with obesity by genome-wide DNA methylation analysis. Int. J. Obes. 2019, 43, 176–188. [Google Scholar] [CrossRef] [PubMed]
- Carr, P.R.; Amitay, E.L.; Jansen, L.; Alwers, E.; Roth, W.; Herpel, E.; Kloor, M.; Schneider, M.; Blaker, H.; Chang-Claude, J.; et al. Association of BMI and major molecular pathological markers of colorectal cancer in men and women. Am. J. Clin. Nutr. 2020, 111, 562–569. [Google Scholar] [CrossRef] [PubMed]
- Ehrlich, M. DNA hypermethylation in disease: Mechanisms and clinical relevance. Epigenetics 2019, 14, 1141–1163. [Google Scholar] [CrossRef] [PubMed] [Green Version]
- Zhou, M.; Zhang, L.; Yang, Q.; Yan, C.; Jiang, P.; Lan, Y.; Wang, J.; Tang, R.; He, M.; Lei, G.; et al. Age-related gene expression and DNA methylation changes in rhesus macaque. Genomics 2020, 112, 5147–5156. [Google Scholar] [CrossRef]
- Tharakan, R.; Ubaida-Mohien, C.; Moore, A.Z.; Hernandez, D.; Tanaka, T.; Ferrucci, L. Blood DNA Methylation and Aging: A Cross-Sectional Analysis and Longitudinal Validation in the InCHIANTI Study. J. Gerontol. A Biol. Sci. Med. Sci. 2020, 75, 2051–2055. [Google Scholar] [CrossRef] [Green Version]
- Harris, C.J.; Davis, B.A.; Zweig, J.A.; Nevonen, K.A.; Quinn, J.F.; Carbone, L.; Gray, N.E. Age-Associated DNA Methylation Patterns Are Shared Between the Hippocampus and Peripheral Blood Cells. Front. Genet. 2020, 11, 111. [Google Scholar] [CrossRef] [Green Version]
- Cheng, X.; Hashimoto, H.; Horton, J.R.; Zhang, X. Chapter 2—Mechanisms of DNA Methylation, Methyl-CpG Recognition, and Demethylation in Mammals. In Handbook of Epigenetics; Tollefsbol, T., Ed.; Academic Press: San Diego, CA, USA, 2011; pp. 9–24. [Google Scholar] [CrossRef]
- Neidhart, M. DNA Methylation and Complex Human Disease; Academic Press: Oxford, MA, USA, 2016. [Google Scholar] [CrossRef]
- Brenet, F.; Moh, M.; Funk, P.; Feierstein, E.; Viale, A.; Socci, N.; Scandura, J. DNA Methylation of the First Exon Is Tightly Linked to Transcriptional Silencing. PLoS ONE 2011, 6, e14524. [Google Scholar] [CrossRef]
- Dorman, J.S.; Schmella, M.J.; Wesmiller, S.W. Primer in Genetics and Genomics, Article 1: DNA, Genes, and Chromosomes. Biol. Res. Nurs. 2016, 19, 7–17. [Google Scholar] [CrossRef] [PubMed]
- Du, X.; Han, L.; Guo, A.Y.; Zhao, Z. Features of methylation and gene expression in the promoter-associated CpG islands using human methylome data. Comp. Funct. Genom. 2012, 2012, 598987. [Google Scholar] [CrossRef] [PubMed] [Green Version]
- Poduval, D.B.; Ognedal, E.; Sichmanova, Z.; Valen, E.; Iversen, G.T.; Minsaas, L.; Lønning, P.E.; Knappskog, S. Assessment of tumor suppressor promoter methylation in healthy individuals. Clin. Epigenet. 2020, 12, 131. [Google Scholar] [CrossRef] [PubMed]
- Quan, Y.; Liang, F.; Wu, D.; Yao, X.; Hu, Z.; Zhu, Y.; Chen, Y.; Wu, A.; Tang, D.; Huang, B.; et al. Blood Cell DNA Methylation of Aging-Related Ubiquitination Gene DZIP3 Can Predict the Onset of Early Stage Colorectal Cancer. Front. Oncol. 2020, 10, 544330. [Google Scholar] [CrossRef]
- Jones, P.A.; Takai, D. The role of DNA methylation in mammalian epigenetics. Science 2001, 293, 1068–1070. [Google Scholar] [CrossRef]
- Ng, J.M.; Yu, J. Promoter hypermethylation of tumour suppressor genes as potential biomarkers in colorectal cancer. Int. J. Mol. Sci. 2015, 16, 2472–2496. [Google Scholar] [CrossRef] [Green Version]
- Ross, J.P.; Rand, K.N.; Molloy, P.L. Hypomethylation of repeated DNA sequences in cancer. Epigenomics 2010, 2, 245–269. [Google Scholar] [CrossRef]
- Suzuki, M.M.; Bird, A. DNA methylation landscapes: Provocative insights from epigenomics. Nat. Rev. Genet. 2008, 9, 465–476. [Google Scholar] [CrossRef]
- Yin, A.; Etcheverry, A.; He, Y.; Aubry, M.; Barnholtz-Sloan, J.; Zhang, L.M.; Mao, X.; Chen, W.; Liu, B.; Zhang, W.; et al. Integrative analysis of novel hypomethylation and gene expression signatures in glioblastomas. Oncotarget 2017, 8, 89607–89619. [Google Scholar] [CrossRef] [Green Version]
- Costello, J.F.; Plass, C. Methylation Matters. J. Med. Genet. 2001, 38, 285–303. [Google Scholar] [CrossRef] [Green Version]
- Society, A.C. Oncogenes and Tumor Suppressor Genes. Available online: https://www.cancer.org/cancer/cancer-causes/genetics/genes-and-cancer/oncogenes-tumor-suppressor-genes.html (accessed on 3 January 2021).
- Charrier, C.; Joshi, K.; Coutinho-Budd, J.; Kim, J.E.; Lambert, N.; de Marchena, J.; Jin, W.L.; Vanderhaeghen, P.; Ghosh, A.; Sassa, T.; et al. Inhibition of SRGAP2 function by its human-specific paralogs induces neoteny during spine maturation. Cell 2012, 149, 923–935. [Google Scholar] [CrossRef] [PubMed] [Green Version]
- NCBI. SRGAP2C: SLIT-ROBO Rho GTPase Activating Protein 2C [Homo sapiens]. Gene ID: 653464. Available online: https://www.ncbi.nlm.nih.gov/gene/653464 (accessed on 1 January 2020).
- Schmidt, E.R.E.; Kupferman, J.V.; Stackmann, M.; Polleux, F. The human-specific paralogs SRGAP2B and SRGAP2C differentially modulate SRGAP2A-dependent synaptic development. Sci. Rep. 2019, 9, 18692. [Google Scholar] [CrossRef] [PubMed] [Green Version]
- Chen, W.Y.; Zeng, T.; Wen, Y.C.; Yeh, H.L.; Jiang, K.C.; Chen, W.H.; Zhang, Q.; Huang, J.; Liu, Y.N. Androgen deprivation-induced ZBTB46-PTGS1 signaling promotes neuroendocrine differentiation of prostate cancer. Cancer. Lett. 2019, 440, 35–46. [Google Scholar] [CrossRef] [PubMed]
- NCBI. ZBTB46: Zinc Finger and BTB Domain Containing 46 [Homo sapiens]. Gene ID: 140685. Available online: https://www.ncbi.nlm.nih.gov/gene/140685 (accessed on 1 January 2020).
- Satpathy, A.T.; Brown, R.A.; Gomulia, E.; Briseño, C.G.; Mumbach, M.R.; Pan, Z.; Murphy, K.M.; Natkunam, Y.; Chang, H.Y.; Kim, J. Expression of the transcription factor ZBTB46 distinguishes human histiocytic disorders of classical dendritic cell origin. Mod. Pathol. 2018, 31, 1479–1486. [Google Scholar] [CrossRef]
- Kim, J.; Daniel, J.; Espejo, A.; Lake, A.; Krishna, M.; Xia, L.; Zhang, Y.; Bedford, M.T. Tudor, MBT and chromo domains gauge the degree of lysine methylation. EMBO Rep. 2006, 7, 397–403. [Google Scholar] [CrossRef] [PubMed]
- NCBI. HIST1H3I: H3 Clustered Histone 11 [Homo sapiens]. Gene ID: 8354. Available online: https://www.ncbi.nlm.nih.gov/gene/8354 (accessed on 1 January 2020).
- Tagami, H.; Ray-Gallet, D.; Almouzni, G.; Nakatani, Y. Histone H3.1 and H3.3 complexes mediate nucleosome assembly pathways dependent or independent of DNA synthesis. Cell 2004, 116, 51–61. [Google Scholar] [CrossRef] [Green Version]
- NCBI. HIST1H3D: H3 Clustered Histone 4 [Homo sapiens]. Gene ID: 8351. Available online: https://www.ncbi.nlm.nih.gov/gene/8351 (accessed on 1 January 2020).
- Li, X.; Wang, W.; Wang, J.; Malovannaya, A.; Xi, Y.; Li, W.; Guerra, R.; Hawke, D.H.; Qin, J.; Chen, J. Proteomic analyses reveal distinct chromatin-associated and soluble transcription factor complexes. Mol. Syst. Biol. 2015, 11, 775. [Google Scholar] [CrossRef]
- NCBI. NFATC4: Nuclear Factor of Activated T Cells 4 [Homo sapiens]. Gene ID: 4776. Available online: https://www.ncbi.nlm.nih.gov/gene/4776 (accessed on 1 January 2020).
- Qin, X.; Wang, X.H.; Yang, Z.H.; Ding, L.H.; Xu, X.J.; Cheng, L.; Niu, C.; Sun, H.W.; Zhang, H.; Ye, Q.N. Repression of NFAT3 transcriptional activity by estrogen receptors. Cell. Mol. Life Sci. CMLS 2008, 65, 2752–2762. [Google Scholar] [CrossRef]
- Zhang, X.; Kang, T.; Zhang, L.; Tong, Y.; Ding, W.; Chen, S. NFATc3 mediates the sensitivity of gastric cancer cells to arsenic sulfide. Oncotarget 2017, 8, 52735–52745. [Google Scholar] [CrossRef] [Green Version]
- Ding, W.J.; Zhou, M.; Chen, M.M.; Qu, C.Y. HOXB8 promotes tumor metastasis and the epithelial-mesenchymal transition via ZEB2 targets in gastric cancer. J. Cancer Res. Clin. Oncol. 2017, 143, 385–397. [Google Scholar] [CrossRef]
- NCBI. HOXB8: Homeobox B8 [Homo sapiens]. Gene ID: 3218. Available online: https://www.ncbi.nlm.nih.gov/gene/3218 (accessed on 1 January 2020).
- Shen, S.; Pan, J.; Lu, X.; Chi, P. Role of miR-196 and its target gene HoxB8 in the development and proliferation of human colorectal cancer and the impact of neoadjuvant chemotherapy with FOLFOX4 on their expression. Oncol. Lett. 2016, 12, 4041–4047. [Google Scholar] [CrossRef] [PubMed] [Green Version]
- Alzahrani, S.M.; Al Doghaither, H.A.; Al-Ghafari, A.B. General insight into cancer: An overview of colorectal cancer (Review). Mol. Clin. Oncol. 2021, 15, 271. [Google Scholar] [CrossRef] [PubMed]
- Gutierrez, A.; Demond, H.; Brebi, P.; Ili, C.G. Novel Methylation Biomarkers for Colorectal Cancer Prognosis. Biomolecules 2021, 11, 1722. [Google Scholar] [CrossRef] [PubMed]
- Sobhani, I. DNA Methylation Is a Main Key for Bacteria-Related Colon Carcinogenesis. Microorganisms 2021, 9, 2574. [Google Scholar] [CrossRef]
- Maugeri, A.; Barchitta, M.; Magnano San Lio, R.; Favara, G.; La Mastra, C.; La Rosa, M.C.; Agodi, A. The Relationship between Body Mass Index, Obesity, and LINE-1 Methylation: A Cross-Sectional Study on Women from Southern Italy. Dis. Markers 2021, 2021, 9910878. [Google Scholar] [CrossRef]
- Moreno-Ortiz, J.M.; Jiménez-García, J.; Gutiérrez-Angulo, M.; Ayala-Madrigal, M.L.; González-Mercado, A.; González-Villaseñor, C.O.; Flores-López, B.A.; Alvizo-Rodríguez, C.; Hernández-Sandoval, J.A.; Fernández-Galindo, M.A.; et al. High frequency of MLH1 promoter methylation mediated by gender and age in colorectal tumors from Mexican patients. Gac. Med. Mex. 2021, 157, 618–623. [Google Scholar] [CrossRef]
- Khodadadi, E.; Fahmideh, L.; Khodadadi, E.; Dao, S.; Yousefi, M.; Taghizadeh, S.; Asgharzadeh, M.; Yousefi, B.; Kafil, H.S. Current Advances in DNA Methylation Analysis Methods. BioMed. Res. Int. 2021, 2021, 8827516. [Google Scholar] [CrossRef]
- Baharudin, R.; Ishak, M.; Muhamad Yusof, A.; Saidin, S.; Syafruddin, S.E.; Wan Mohamad Nazarie, W.F.; Lee, L.H.; Ab Mutalib, N.S. Epigenome-Wide DNA Methylation Profiling in Colorectal Cancer and Normal Adjacent Colon Using Infinium Human Methylation 450K. Diagnostics 2022, 12, 198. [Google Scholar] [CrossRef]
- Paweł, K.; Maria Małgorzata, S. CpG Island Methylator Phenotype-A Hope for the Future or a Road to Nowhere? Int. J. Mol. Sci. 2022, 23, 830. [Google Scholar] [CrossRef]
- Khoury, M.J.; Bowen, M.S.; Clyne, M.; Dotson, W.D.; Gwinn, M.L.; Green, R.F.; Kolor, K.; Rodriguez, J.L.; Wulf, A.; Yu, W. From public health genomics to precision public health: A 20-year journey. Genet. Med. Off. J. Am. Coll. Med. Genet. 2018, 20, 574–582. [Google Scholar] [CrossRef] [Green Version]
- Khoury, M.J. No Shortcuts on the Long Road to Evidence-Based Genomic Medicine. JAMA 2017, 318, 27–28. [Google Scholar] [CrossRef] [PubMed]
- Khoury, M.J. Precision Medicine vs Preventive Medicine. JAMA 2019, 321, 406. [Google Scholar] [CrossRef] [PubMed]
- Khoury, M.J.; Engelgau, M.; Chambers, D.A.; Mensah, G.A. Beyond Public Health Genomics: Can Big Data and Predictive Analytics Deliver Precision Public Health? Public Health Genom. 2018, 21, 244–250. [Google Scholar] [CrossRef] [PubMed]
- Tomczak, K.; Czerwinska, P.; Wiznerowicz, M. The Cancer Genome Atlas (TCGA): An immeasurable source of knowledge. Contemp. Oncol. 2015, 19, A68–A77. [Google Scholar] [CrossRef]
- Colaprico, A.; Silva, T.C.; Olsen, C.; Garofano, L.; Cava, C.; Garolini, D.; Sabedot, T.S.; Malta, T.M.; Pagnotta, S.M.; Castiglioni, I.; et al. TCGAbiolinks: An R/Bioconductor package for integrative analysis of TCGA data. Nucleic Acids Res. 2016, 44, e71. [Google Scholar] [CrossRef]
- Liu, Y.; Qiu, P. Integrative analysis of methylation and gene expression data in TCGA. In Proceedings of the 2012 IEEE International Workshop on Genomic Signal Processing and Statistics (GENSIPS), Washington, DC, USA, 2–4 December 2012; pp. 1–4. [Google Scholar]
- Silva, T.C.; Colaprico, A.; Olsen, C.; D’Angelo, F.; Bontempi, G.; Ceccarelli, M.; Noushmehr, H. TCGA Workflow: Analyze cancer genomics and epigenomics data using Bioconductor packages. F1000 Res. 2016, 5, 1542. [Google Scholar] [CrossRef]
- Silva, T.C.; Colaprico, A.; Olsen, C.; Malta, T.M.; Bontempi, G.; Ceccarelli, M.; Berman, B.P.; Noushmehr, H. TCGAbiolinksGUI: A graphical user interface to analyze cancer molecular and clinical data. F1000 Res. 2018, 7, 439. [Google Scholar] [CrossRef] [Green Version]
- Babenko, V.N.; Chadaeva, I.V.; Orlov, Y.L. Genomic landscape of CpG rich elements in human. BMC Evol. Biol. 2017, 17, 19. [Google Scholar] [CrossRef] [Green Version]
- Chen, J.J.; Wang, A.Q.; Chen, Q.Q. DNA methylation assay for colorectal carcinoma. Cancer Biol. Med. 2017, 14, 42–49. [Google Scholar] [CrossRef] [Green Version]
- Morris, T.J.; Beck, S. Analysis pipelines and packages for Infinium HumanMethylation450 BeadChip (450k) data. Methods 2015, 72, 3–8. [Google Scholar] [CrossRef]
- Sandoval, J.; Heyn, H.A.; Moran, S.; Serra-Musach, J.; Pujana, M.A.; Bibikova, M.; Esteller, M. Validation of a DNA methylation microarray for 450,000 CpG sites in the human genome. Epigenetics 2011, 6, 692–702. [Google Scholar] [CrossRef]
- Ritchie, M.E.; Phipson, B.; Wu, D.; Hu, Y.; Law, C.W.; Shi, W.; Smyth, G.K. limma powers differential expression analyses for RNA-sequencing and microarray studies. Nucleic. Acids Res. 2015, 43, e47. [Google Scholar] [CrossRef]
- Jaffe, A.E.; Murakami, P.; Lee, H.; Leek, J.T.; Fallin, M.D.; Feinberg, A.P.; Irizarry, R.A. Bump hunting to identify differentially methylated regions in epigenetic epidemiology studies. Int. J. Epidemiol. 2012, 41, 200–209. [Google Scholar] [CrossRef] [PubMed] [Green Version]
- Lent, S.; Xu, H.; Wang, L.; Wang, Z.; Sarnowski, C.; Hivert, M.F.; Dupuis, J. Comparison of novel and existing methods for detecting differentially methylated regions. BMC Genet. 2018, 19, 84. [Google Scholar] [CrossRef]
- Hibler, E.; Huang, L.; Andrade, J.; Spring, B. Impact of a diet and activity health promotion intervention on regional patterns of DNA methylation. Clin. Epigenet. 2019, 11, 133. [Google Scholar] [CrossRef] [PubMed] [Green Version]
- Huang, G.; Cheng, W.; Xi, F. Integrated genomic and methylation profile analysis to identify candidate tumor marker genes in patients with colorectal cancer. Oncol. Lett. 2019, 18, 4503–4514. [Google Scholar] [CrossRef] [PubMed] [Green Version]
- Slieker, R.; Bos, S.; Goeman, J.; Bovee, J.; Talens, R.; Breggen, R.; Suchiman, E.; Lameijer, E.; Putter, H.; van den Akker, E.; et al. Identification and systematic annotation of tissue-specific differentially methylated regions using Illumina 450k chips. Epigenet. Chromatin 2013, 6, 26. [Google Scholar] [CrossRef] [Green Version]
- Zhang, B.; Hong, X.; Ji, H.; Tang, W.Y.; Kimmel, M.; Ji, Y.; Pearson, C.; Zuckerman, B.; Surkan, P.J.; Wang, X. Maternal smoking during pregnancy and cord blood DNA methylation: New insight on sex differences and effect modification by maternal folate levels. Epigenetics 2018, 13, 505–518. [Google Scholar] [CrossRef]
- Bamford, S.; Dawson, E.; Forbes, S.; Clements, J.; Pettett, R.; Dogan, A.; Flanagan, A.; Teague, J.; Futreal, P.A.; Stratton, M.R.; et al. The COSMIC (Catalogue of Somatic Mutations in Cancer) database and website. Br. J. Cancer 2004, 91, 355–358. [Google Scholar] [CrossRef]
- Forbes, S.A.; Beare, D.; Boutselakis, H.; Bamford, S.; Bindal, N.; Tate, J.; Cole, C.G.; Ward, S.; Dawson, E.; Ponting, L.; et al. COSMIC: Somatic cancer genetics at high-resolution. Nucleic Acids Res. 2017, 45, D777–D783. [Google Scholar] [CrossRef]
- Kent, W.J.; Sugnet, C.W.; Furey, T.S.; Roskin, K.M.; Pringle, T.H.; Zahler, A.M.; Haussler, D. The human genome browser at UCSC. Genome Res. 2002, 12, 996–1006. [Google Scholar] [CrossRef] [PubMed] [Green Version]
- Huang, D.W.; Sherman, B.T.; Lempicki, R.A. Bioinformatics enrichment tools: Paths toward the comprehensive functional analysis of large gene lists. Nucleic Acids Res. 2009, 37, 1–13. [Google Scholar] [CrossRef] [PubMed] [Green Version]
- Dasgupta, A.; Sun, Y.V.; König, I.R.; Bailey-Wilson, J.E.; Malley, J.D. Brief review of regression-based and machine learning methods in genetic epidemiology: The Genetic Analysis Workshop 17 experience. Genet. Epidemiol. 2011, 35, S5–S11. [Google Scholar] [CrossRef] [PubMed] [Green Version]
- Grinberg, N.F.; Orhobor, O.I.; King, R.D. An evaluation of machine-learning for predicting phenotype: Studies in yeast, rice, and wheat. Mach Learn. 2020, 109, 251–277. [Google Scholar] [CrossRef] [Green Version]
- Song, L.; Langfelder, P.; Horvath, S. Random generalized linear model: A highly accurate and interpretable ensemble predictor. BMC Bioinform. 2013, 14, 5. [Google Scholar] [CrossRef] [Green Version]
- Afzali, M.H.; Sunderland, M.; Stewart, S.; Masse, B.; Seguin, J.; Newton, N.; Teesson, M.; Conrod, P. Machine-learning prediction of adolescent alcohol use: A cross-study, cross-cultural validation. Addiction 2019, 114, 662–671. [Google Scholar] [CrossRef] [PubMed]
- Ogutu, J.O.; Schulz-Streeck, T.; Piepho, H.P. Genomic selection using regularized linear regression models: Ridge regression, lasso, elastic net and their extensions. BMC Proc. 2012, 6, S10. [Google Scholar] [CrossRef] [Green Version]
- Burnham, K.P.; Anderson, D.R. Multimodel Inference:Understanding AIC and BIC in Model Selection. Sociol. Methods Res. 2004, 33, 261–304. [Google Scholar] [CrossRef]
- Chase, E.C.; Boonstra, P.S. Accounting for established predictors with the multistep elastic net. Stat. Med. 2019, 38, 4534–4544. [Google Scholar] [CrossRef]
- Waldmann, P.; Mészáros, G.; Gredler, B.; Fuerst, C.; Sölkner, J. Evaluation of the lasso and the elastic net in genome-wide association studies. Front. Genet. 2013, 4, 270. [Google Scholar] [CrossRef] [Green Version]
- Xiao, J.; Ding, R.; Xu, X.; Guan, H.; Feng, X.; Sun, T.; Zhu, S.; Ye, Z. Comparison and development of machine learning tools in the prediction of chronic kidney disease progression. J. Transl. Med. 2019, 17, 119. [Google Scholar] [CrossRef] [PubMed] [Green Version]
- Cui, Z.; Gong, G. The effect of machine learning regression algorithms and sample size on individualized behavioral prediction with functional connectivity features. Neuroimage 2018, 178, 622–637. [Google Scholar] [CrossRef]
- Kirpich, A.; Ainsworth, E.A.; Wedow, J.M.; Newman, J.R.B.; Michailidis, G.; McIntyre, L.M. Variable selection in omics data: A practical evaluation of small sample sizes. PLoS ONE 2018, 13, e0197910. [Google Scholar] [CrossRef] [PubMed]
- Wen, H.; Li, Y.; Xi, Y.; Jiang, S.; Stratton, S.; Peng, D.; Tanaka, K.; Ren, Y.; Xia, Z.; Wu, J.; et al. ZMYND11 links histone H3.3K36me3 to transcription elongation and tumour suppression. Nature 2014, 508, 263–268. [Google Scholar] [CrossRef] [PubMed] [Green Version]
- Li, S.; Lu, X.; Chi, P.; Pan, J. Identification of HOXB8 and KLK11 expression levels as potential biomarkers to predict the effects of FOLFOX4 chemotherapy. Future Oncol. 2013, 9, 727–736. [Google Scholar] [CrossRef]
- Wang, Z.; Song, J.; Milne, T.A.; Wang, G.G.; Li, H.; Allis, C.D.; Patel, D.J. Pro isomerization in MLL1 PHD3-bromo cassette connects H3K4me readout to CyP33 and HDAC-mediated repression. Cell 2010, 141, 1183–1194. [Google Scholar] [CrossRef] [PubMed] [Green Version]


| Cancer | |||
|---|---|---|---|
| Mean ± SD (Range) | Control (n = 15) | Non-Obese (n = 154) | Obese (n = 71) |
| BMI, Kg/m2 | 25.5 ± 2.7 (20.1–29.8) | 24.9 ± 3.1 * (14.7–29.8) | 36.1 ± 2.8 * (30.0–54.1) |
| Age, years | 81.7 ± 13.7 (48–102) | 74.0 ± 15.1 * (41–106) | 72.0 ± 12.0 * (38–92) |
| Gender Female (%) | 9 (60) | 67 (43.5) | 37 (52) |
| Race White (%) | 13 (87) | 116 (75) | 49 (69) |
| Black (%) | 2 (13) | 30 (19) | 21 (30) |
| Other (%) | 0 | 8 (6) | 1 (1) |
| Groups | Non-Obese Cancer/Control | Obese Cancer/Control | Obese Cancer/Non-Obese Cancer | |||
|---|---|---|---|---|---|---|
| Differential Methylation | Hyper | Hypo | Hyper | Hypo | Hyper | Hypo |
| 5% | 4270 | 3744 | 4203 | 4073 | 178 | 340 |
| 10% | 2967 | 1644 | 2876 | 1909 | 25 | 48 |
| 15% | 2248 | 637 | 2173 | 828 | 6 | 10 |
| DMR | Dis to TSS | DNAm | Gene Function | |||
|---|---|---|---|---|---|---|
| Gene | # CpG | Region | Non-Obese | Obese | ||
| HIST3H2A‡ | 25 | Promoter | 860 | 8.61 | 6.80 | DNA repair, MMR |
| HIST3H2BB‡ | 25 | Promoter | 701 | 8.61 | 6.80 | DNA repair, MMR |
| HOXB8† | 18 | Promoter | −279 | 14.47 | 11.48 | Oncogene |
| HIST1H3I‡ | 11 | Promoter | −24 | 17.43 | 14.47 | Oncogene |
| TUBB2A‡ | 3 | Intron | −593 | 9.93 | 8.26 | GTP binding |
| TMCO1‡ | 13 | Promoter | 210 | 5.49 | 4.59 | Calcium homeostasis |
| PRAC2† | 4 | Promoter | 109 | 10.32 | 8.63 | Oncogene |
| AMOTL2‡ | 4 | Intron | −10,235 | 15.79 | 13.38 | Inhibits Wnt pathway |
| ARL4D^ | 13 | Promoter | 107 | 8.03 | 6.82 | Suppresses adipogenesis |
| HIST1H3D‡ | 13 | Promoter | 59 | 12.02 | 10.26 | Oncogene |
| DMR | Dis to TSS | DNAm | Gene Function | |||
|---|---|---|---|---|---|---|
| Gene | # CpG | Region | Non-Obese | Obese | ||
| GNPDA2^ | 12 | Promoter | 107 | 7.86 | 9.74 | Protein metabolism |
| LSM14A† | 9 | Promoter | 540 | 3.44 | 4.12 | Immune response |
| ZNF426† | 11 | Promoter | 107 | 21.70 | 25.80 | Transcription regulation |
| NFATC4‡ | 8 | Intron | −466 | 9.98 | 11.52 | Oncogene |
| ZNF852† | 3 | Promoter | 31 | 2.81 | 3.24 | Transcription regulation |
| FAM72B† | 9 | CDS | 3021 | 29.19 | 33.34 | Oncogene |
| SRGAP2C‡ | 9 | Promoter | 879 | 29.19 | 33.34 | Tumor Suppression Gene |
| TNFAIP2† | 3 | Promoter | 445 | 14.28 | 16.10 | Mediator of inflammation |
| ZNF747† | 7 | Promoter | 188 | 7.18 | 8.07 | Transcription regulation |
| TUBB3‡ | 3 | Intron | 2448 | 6.36 | 7.14 | Oncogene, immune response |
| Generalized Regression Adaptive Elastic Net | ||||||
|---|---|---|---|---|---|---|
| Logistic Regression | Leave-One-Out | Validation Column | ||||
| Parameters | Estimate | p (χ2) | Estimate | p (χ2) | Estimate | p (χ2) |
| Intercept | −0.1997 | 0.738 | 0.0114 | 0.984 | −0.2869 | 0.613 |
| Age (≥76) | −2.4211 | 0.004 | −2.3076 | 0.003 | −2.2997 | 0.004 |
| HIST1H3I (hypo, promoter) ‡ | 1.1541 | 0.003 | 1.2026 | 0.001 | 1.1243 | 0.002 |
| NFATC4 (hyper, intron) ‡ | −1.1034 | 0.046 | −1.3256 | 0.006 | −1.1133 | 0.027 |
| SRGAP2C (hyper, promoter) ‡ | −1.2821 | 0.026 | −1.4779 | 0.006 | −1.2355 | 0.025 |
| Age * ZBTB46 | 1.7993 | 0.020 | 1.8545 | 0.008 | 1.7343 | 0.024 |
| Age * NFATC4 | 1.3051 | 0.078 | 1.1752 | 0.078 | 1.3065 | 0.069 |
| Age * HOXB8 | 1.0252 | 0.163 | 1.1410 | 0.084 | 0.9161 | 0.081 |
| Age * SRGAP2C | 1.0565 | 0.153 | 1.1584 | 0.088 | 1.0062 | 0.168 |
| HIST1H3D (hypo, promoter) ‡ | −0.3225 | 0.401 | −0.6169 | 0.089 | −0.3119 | 0.419 |
| ZBTB46 (hypo, intron) † | −0.2551 | 0.637 | −0.2889 | 0.550 | −0.2036 | 0.702 |
| HOXB8 (hypo, promoter) † | −0.0984 | 0.856 | 0.0115 | 0.979 | 0.0000 | 1.000 |
| Misclassification rate | 0.290 | - | 0.277 | - | 0.290 | - |
| AICc | 76.63 | - | - | - | 71.067 | - |
| Area under the curve | 0.741 | - | 0.757 | - | 0.739 | - |
Publisher’s Note: MDPI stays neutral with regard to jurisdictional claims in published maps and institutional affiliations. |
© 2022 by the authors. Licensee MDPI, Basel, Switzerland. This article is an open access article distributed under the terms and conditions of the Creative Commons Attribution (CC BY) license (https://creativecommons.org/licenses/by/4.0/).
Share and Cite
Milner, J.J.; Chen, Z.-F.; Grayson, J.; Shiao, S.-Y.P.K. Obesity-Associated Differentially Methylated Regions in Colon Cancer. J. Pers. Med. 2022, 12, 660. https://doi.org/10.3390/jpm12050660
Milner JJ, Chen Z-F, Grayson J, Shiao S-YPK. Obesity-Associated Differentially Methylated Regions in Colon Cancer. Journal of Personalized Medicine. 2022; 12(5):660. https://doi.org/10.3390/jpm12050660
Chicago/Turabian StyleMilner, John J., Zhao-Feng Chen, James Grayson, and Shyang-Yun Pamela Koong Shiao. 2022. "Obesity-Associated Differentially Methylated Regions in Colon Cancer" Journal of Personalized Medicine 12, no. 5: 660. https://doi.org/10.3390/jpm12050660