
Comparison of Nine Early Warning Scores for Identification of Short-Term Mortality in Acute Neurological Disease in Emergency Department

 ,
,  , , , , , , , and
Abstract
:1. Introduction
2. Materials and Methods
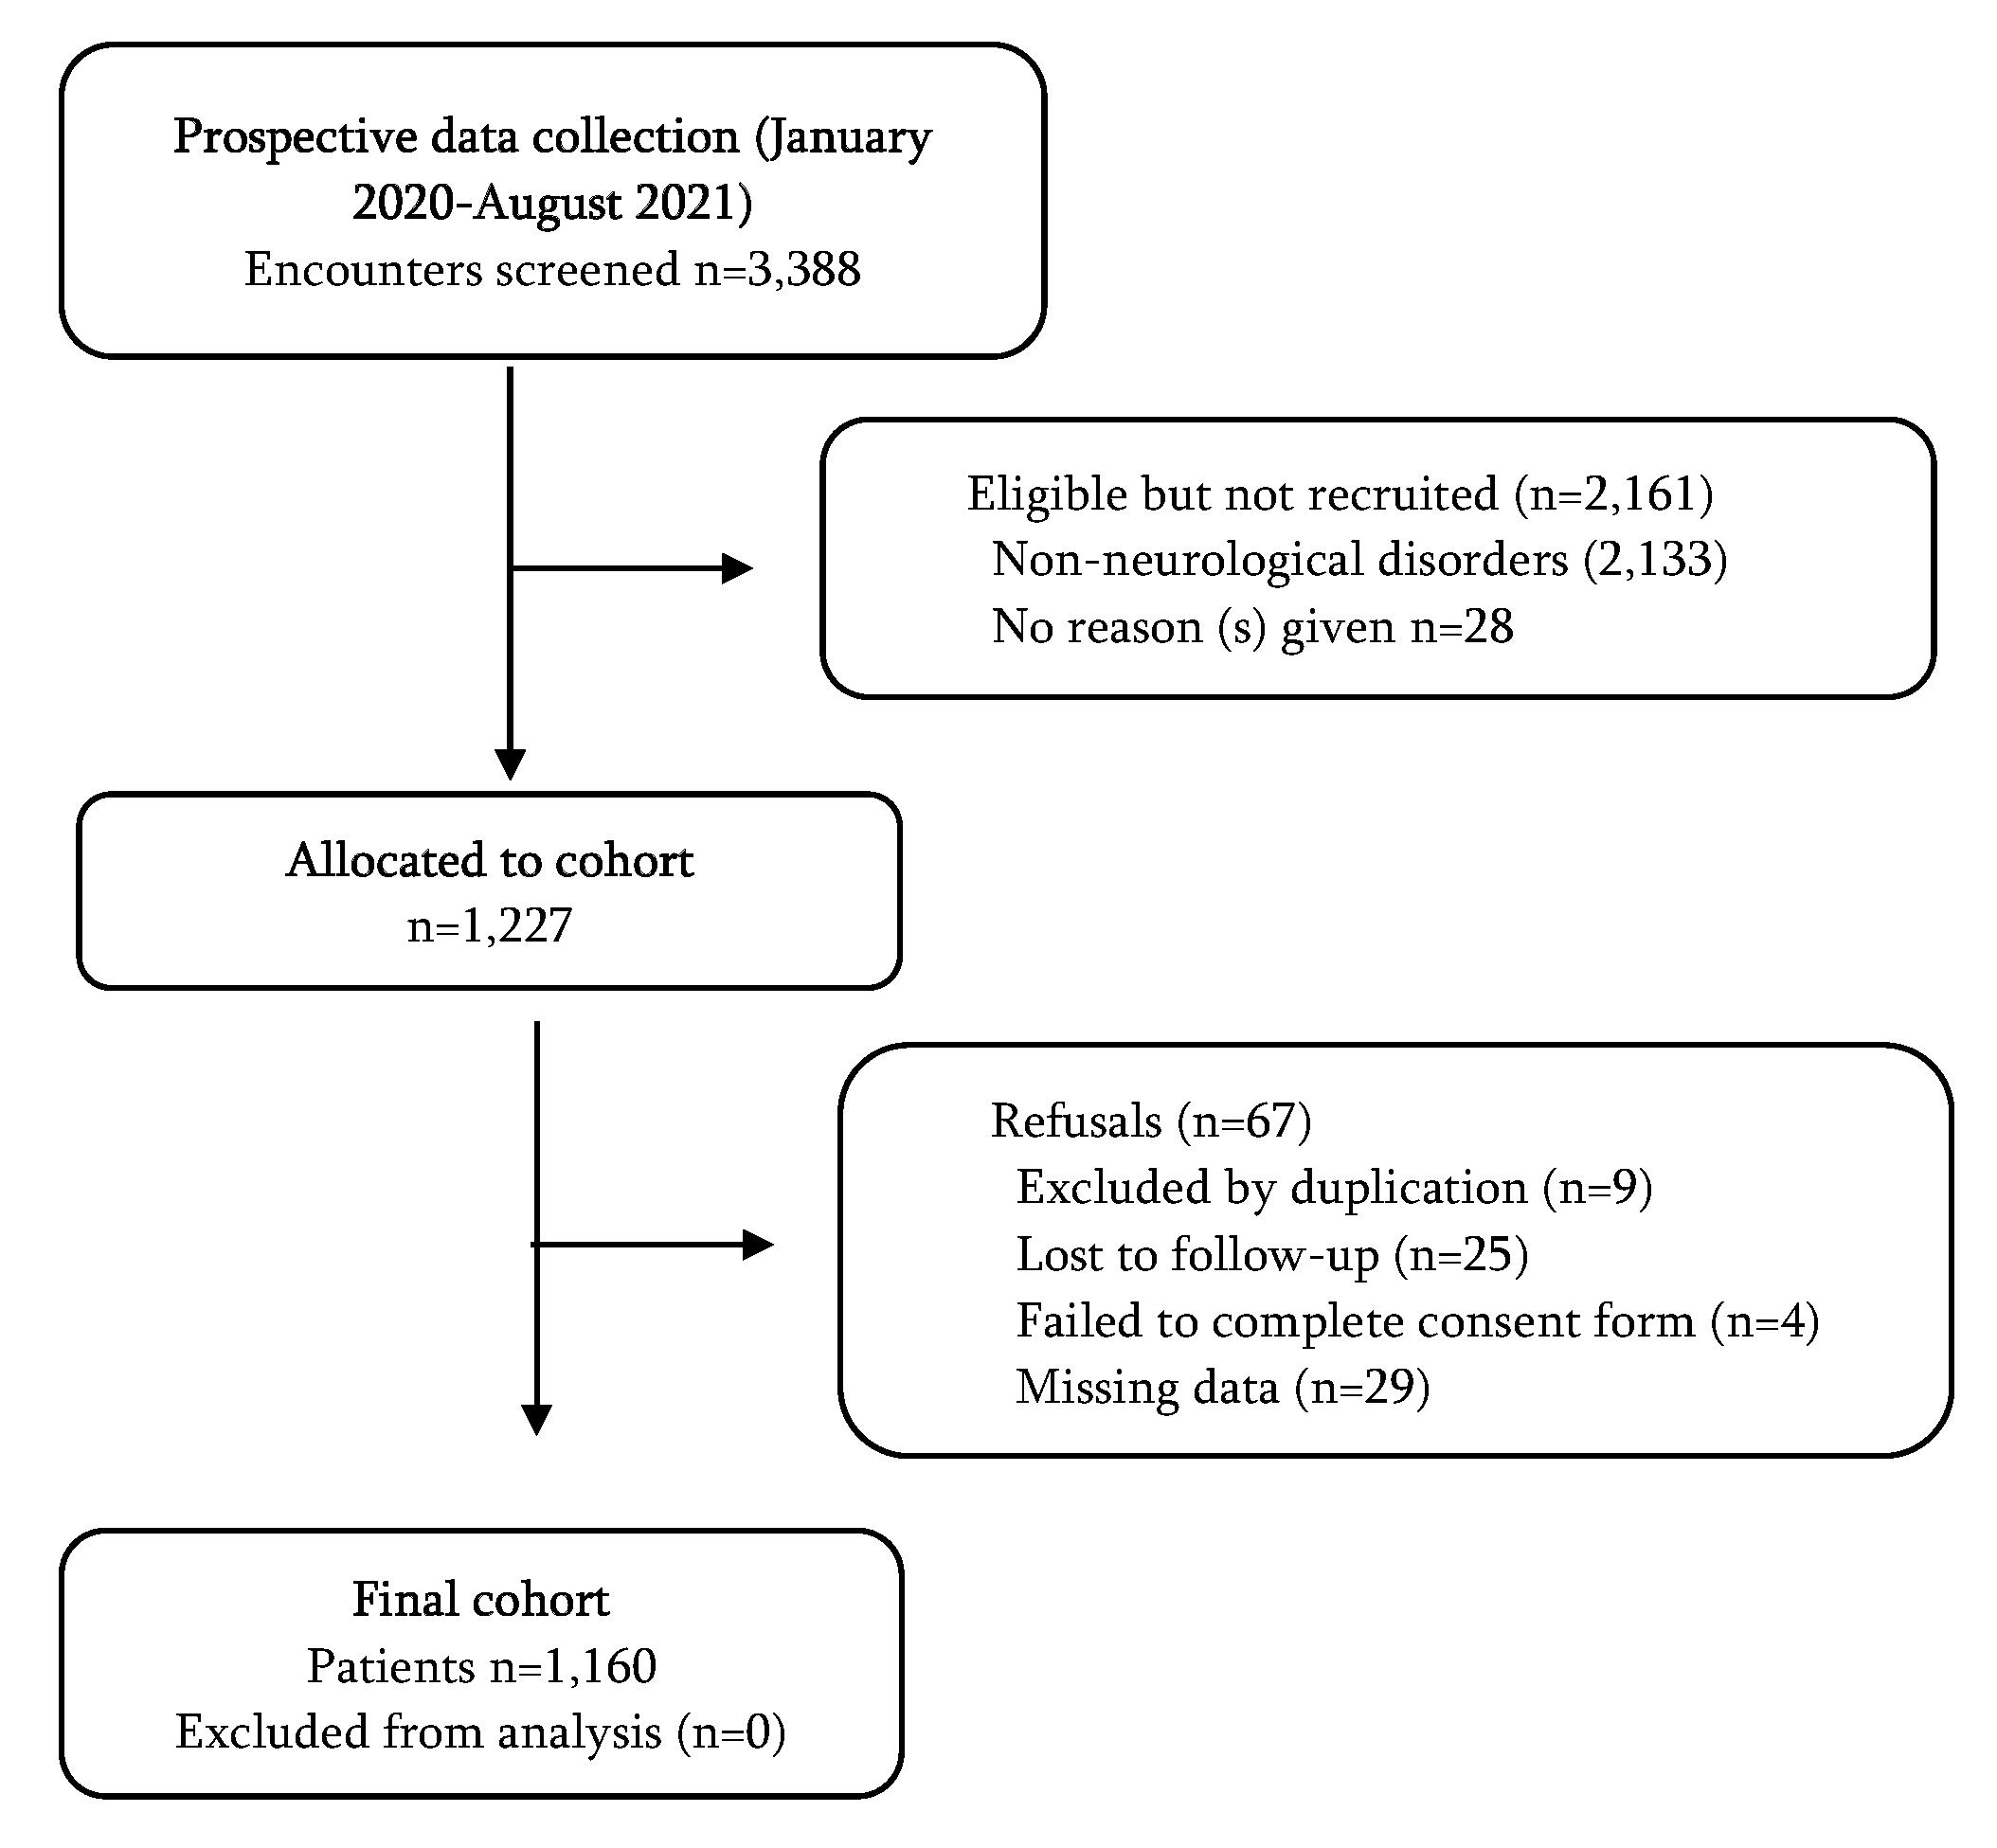
2.1. Study Design and Setting
2.2. Population
2.3. Outcomes
2.4. Early Warning Scores Selection
2.5. Collection of the Parameters
2.6. Statistical Analysis
3. Results
4. Discussion
Limitations
5. Conclusions
Supplementary Materials
Author Contributions
Funding
Institutional Review Board Statement
Informed Consent Statement
Data Availability Statement
Acknowledgments
Conflicts of Interest
References
- Moodley, K.K.; Nitkunan, A.; Pereira, A.C. Acute neurology: A suggested approach. Clin. Med. 2018, 18, 418–421. [Google Scholar] [CrossRef] [PubMed] [Green Version]
- Royal College of Physicians. Local Adult Neurology Services for the Next Decade. Report of A Working Party; RCP: London, UK, 2011; Available online: https://mstrust.org.uk/sites/default/files/files/Local%20adult%20neurology%20services%20for%20the%20next%20decade.pdf (accessed on 14 February 2022).
- Casado, V. Neurological patient care in emergency departments. A review of the current situation in Spain. Neurologia 2011, 26, 233–238. [Google Scholar] [CrossRef] [PubMed]
- Kanagaratnam, M.; Boodhoo, A.; MacDonald, B.K.; Nitkunan, A. Prevalence of acute neurology: A 2-week snapshot in a district general hospital. Clin. Med. 2020, 20, 169–173. [Google Scholar] [CrossRef] [PubMed] [Green Version]
- Martín-Rodríguez, F.; López-Izquierdo, R.; Mohedano-Moriano, A.; Polonio-López, B.; Maestre-Miquel, C.; Viñuela, A.; Durantez-Fernández, C.; Gómez-Correas, J.; Marques, G.; Martín-Conty, J.L. Identification of Serious Adverse Events in Patients with Traumatic Brain Injuries, from Prehospital Care to Intensive-Care Unit, Using Early Warning Scores. Int. J. Environ. Res. Public Health 2020, 17, 1504. [Google Scholar] [CrossRef] [Green Version]
- Bersano, A.; Kraemer, M.; Touzé, E.; Weber, R.; Alamowitch, S.; Sibon, I.; Pantoni, L. Stroke care during the COVID-19 pandemic: Experience from three large European countries. Eur. J. Neurol. 2020, 27, 1794–1800. [Google Scholar] [CrossRef]
- Douiri, A.; Muruet, W.; Bhalla, A.; James, M.; Paley, L.; Stanley, K.; Rudd, A.G.; Wolfe, C.D.; Bray, B.D.; SSNAP Collaboration. Stroke Care in the United Kingdom During the COVID-19 Pandemic. Stroke 2021, 52, 2125–2133. [Google Scholar] [CrossRef]
- Feigin, V.L.; Lawes, C.M.; Bennett, D.A.; Barker-Collo, S.L.; Parag, V. Worldwide stroke incidence and early case fatality reported in 56 population-based studies: A systematic review. Lancet Neurol. 2009, 8, 355–369. [Google Scholar] [CrossRef]
- GBD 2019 Stroke Collaborators. Global, regional, and national burden of stroke and its risk factors, 1990–2019: A systematic analysis for the Global Burden of Disease Study 2019. Lancet Neurol. 2021, 20, 795–820. [Google Scholar] [CrossRef]
- Alves Silva, L.M.; Moroço, D.M.; Pintya, J.P.; Miranda, C.H. Clinical impact of implementing a rapid-response team based on the Modified Early Warning Score in wards that offer emergency department support. PLoS ONE 2021, 16, e0259577. [Google Scholar] [CrossRef]
- Liljehult, J.; Christensen, T.; Christensen, K.B. Early Prediction of One-Year Mortality in Ischemic and Haemorrhagic Stroke. J. Stroke Cerebrovasc. Dis. 2020, 29, 104667. [Google Scholar] [CrossRef]
- Rodríguez-Pardo, J.; Fuentes, B.; de Leciñana, M.A.; Campollo, J.; Castaño, P.C.; Ruiz, J.C.; Herrero, J.E.; Leal, R.G.; Núñez, A.G.; Cerezo, J.G.; et al. Acute stroke care during the COVID-19 pandemic. Ictus Madrid Program recommendations. Atención al ictus agudo durante la pandemia por COVID-19. Recomendaciones Plan Ictus Madrid. Neurologia 2020, 35, 258–263. [Google Scholar] [CrossRef] [PubMed]
- Venketasubramanian, N.; Anderson, C.; Ay, H.; Aybek, S.; Brinjikji, W.; De Freitas, G.R.; Del Brutto, O.H.; Fassbender, K.; Fujimura, M.; Goldstein, L.B.; et al. Stroke Care during the COVID-19 Pandemic: International Expert Panel Review. Cerebrovasc. Dis. 2021, 50, 245–261. [Google Scholar] [CrossRef] [PubMed]
- Arévalo-Buitrago, P.; Morales-Cané, I.; Olivares Luque, E.; Guler, I.; Rodríguez-Borrego, M.A.; López-Soto, P.J. Predictive power of early-warning scores used in hospital emergency departments: A systematic review and meta-analysis. Emergencias 2021, 33, 374–381. [Google Scholar] [PubMed]
- Alhmoud, B.; Bonnici, T.; Patel, R.; Melley, D.; Williams, B.; Banerjee, A. Performance of universal early warning scores in different patient subgroups and clinical settings: A systematic review. BMJ Open 2021, 11, e045849. [Google Scholar] [CrossRef]
- Liljehult, J.; Christensen, T. Early warning score predicts acute mortality in stroke patients. Acta Neurol. Scand. 2016, 133, 261–267. [Google Scholar] [CrossRef]
- Saposnik, G.; Kapral, M.K.; Liu, Y.; Hall, R.; O’Donnell, M.; Raptis, S.; Tu, J.V.; Mamdani, M.; Austin, P.C. IScore: A risk score to predict death early after hospitalization for an acute ischemic stroke. Circulation 2011, 123, 739–749. [Google Scholar] [CrossRef]
- Knoery, C.; Barlas, R.S.; Vart, P.; Clark, A.B.; Musgrave, S.D.; Metcalf, A.K.; Day, D.J.; Bachmann, M.O.; Warburton, E.A.; Potter, J.F.; et al. Modified early warning score and risk of mortality after acute stroke. Clin. Neurol. Neurosurg. 2021, 202, 106547. [Google Scholar] [CrossRef]
- Kim, D.K.; Lee, D.H.; Lee, B.K.; Cho, Y.S.; Ryu, S.J.; Jung, Y.H.; Lee, J.H.; Han, J.H. Performance of Modified Early Warning Score (MEWS) for Predicting In-Hospital Mortality in Traumatic Brain Injury Patients. J. Clin. Med. 2021, 10, 1915. [Google Scholar] [CrossRef]
- Chen, G.; Ping, L.; Zhou, S.; Liu, W.; Liu, L.; Zhang, N.; Li, Z.; Tian, Y.; Chen, Z. Early prediction of death in acute hypertensive intracerebral hemorrhage. Exp. Ther. Med. 2016, 11, 83–88. [Google Scholar] [CrossRef] [Green Version]
- Saposnik, G.; Hill, M.; O’Donnell, M.; Fang, J.; Hachinski, V.; Kapral, M.K. Variables associated with 7-day, 30-day, and 1-year fatality after ischemic stroke. Stroke 2008, 39, 2318–2324. [Google Scholar] [CrossRef] [Green Version]
- Simera, I.; Moher, D.; Hoey, J.; Schulz, K.F.; Altman, D.G. A catalogue of reporting guidelines for health research. Eur. J. Clin. Investig. 2010, 40, 35–53. [Google Scholar] [CrossRef] [PubMed]
- Jiang, X.; Jiang, P.; Mao, Y. Performance of Modified Early Warning Score (MEWS) and Circulation, Respiration, Abdomen, Motor, and Speech (CRAMS) score in trauma severity and in-hospital mortality prediction in multiple trauma patients: A comparison study. PeerJ 2019, 7, e7227. [Google Scholar] [CrossRef] [PubMed]
- Bulut, M.; Cebicci, H.; Sigirli, D.; Sak, A.; Durmus, O.; Top, A.A.; Kaya, S.; Uz, K. The comparison of modified early warning score with rapid emergency medicine score: A prospective multicentre observational cohort study on medical and surgical patients presenting to emergency department. Emerg. Med. J. 2014, 31, 476–481. [Google Scholar] [CrossRef] [PubMed]
- Alam, N.; Vegting, I.L.; Houben, E.; Van Berkel, B.; Vaughan, L.; Kramer, M.H.H.; Nanayakkara, P.W.B. Exploring the performance of the National Early Warning Score (NEWS) in a European emergency department. Resuscitation 2015, 90, 111–115. [Google Scholar] [CrossRef] [PubMed]
- Mitsunaga, T.; Hasegawa, I.; Uzura, M.; Okuno, K.; Otani, K.; Ohtaki, Y.; Sekine, A.; Takeda, S. Comparison of the National Early Warning Score (NEWS) and the Modified Early Warning Score (MEWS) for predicting admission and in-hospital mortality in elderly patients in the pre-hospital setting and in the emergency department. PeerJ 2019, 7, e6947. [Google Scholar] [CrossRef] [Green Version]
- Wei, X.; Ma, H.; Liu, R.; Zhao, Y. Comparing the effectiveness of three scoring systems in predicting adult patient outcomes in the emergency department. Medicine 2019, 98, e14289. [Google Scholar] [CrossRef]
- Fernando, S.M.; Fox-Robichaud, A.E.; Rochwerg, B.; Cardinal, P.; Seely, A.J.E.; Perry, J.J.; McIsaac, D.I.; Tran, A.; Skitch, S.; Tam, B.; et al. Prognostic accuracy of the Hamilton Early Warning Score (HEWS) and the National Early Warning Score 2 (NEWS2) among hospitalized patients assessed by a rapid response team. Crit. Care 2019, 23, 60. [Google Scholar] [CrossRef] [Green Version]
- Paterson, R.; MacLeod, D.; Thetford, D.; Beattie, A.; Graham, C.; Lam, S.; Bell, D. Prediction of in-hospital mortality and length of stay using an early warning scoring system: Clinical audit. Clin. Med. 2006, 6, 281–284. [Google Scholar] [CrossRef]
- Della Porta, M.G.; Tuechler, H.; Malcovati, L.; Schanz, J.; Sanz, G.; Garcia-Manero, G.; Solé, F.; Bennett, J.M.; Bowen, D.; Fenaux, P.; et al. Validation of WHO classification-based Prognostic Scoring System (WPSS) for myelodysplastic syndromes and comparison with the revised International Prognostic Scoring System (IPSS-R). A study of the International Working Group for Prognosis in Myelodysplasia (IWG-PM). Leukemia 2015, 29, 1502–1513. [Google Scholar]
- Alam, N.; Hobbelink, E.L.; van Tienhoven, A.J.; van de Ven, P.M.; Jansma, E.P.; Nanayakkara, P.W. The impact of the use of the Early Warning Score (EWS) on patient outcomes: A systematic review. Resuscitation 2014, 85, 587–594. [Google Scholar] [CrossRef]
- Kyriacos, U.; Jelsma, J.; Jordan, S. Monitoring vital signs using early warning scoring systems: A review of the literature. J. Nurs. Manag. 2011, 19, 311–330. [Google Scholar] [CrossRef] [PubMed]
- McGaughey, J.; Alderdice, F.; Fowler, R.; Kapila, A.; Mayhew, A.; Moutray, M. Outreach and Early Warning Systems (EWS) for the prevention of intensive care admission and death of critically ill adult patients on general hospital wards. Cochrane Database Syst. Rev. 2007, 3, CD005529. [Google Scholar] [CrossRef] [PubMed]
- Sharobeam, A.; Yan, B. Advanced imaging in acute ischemic stroke: An updated guide to the hub-and-spoke hospitals. Curr. Opin. Neurol. 2022, 35, 24–30. [Google Scholar] [CrossRef] [PubMed]
- Abbas, R.; Herial, N.A.; Naamani, K.E.; Sweid, A.; Weinberg, J.H.; Habashy, K.J.; Tjoumakaris, S.; Gooch, M.R.; Rosenwasser, R.H.; Jabbour, P. Mechanical Thrombectomy in Patients Presenting with NIHSS Score <6: A Safety and Efficacy Analysis. J. Stroke Cerebrovasc. Dis. 2022, 31, 106282. [Google Scholar] [CrossRef]
- Chiu, A.H.; Hince, D.A.; McAuliffe, W. Glasgow Coma Scale on Presentation Predicts Outcome in Endovascular Treatment for Acute Posterior Large-Vessel Occlusion. AJNR Am. J. Neuroradiol. 2020, 41, 645–649. [Google Scholar] [CrossRef]
- Angus, D.C. Admitting Elderly Patients to the Intensive Care Unit-Is it the Right Decision? JAMA 2017, 318, 1443–1444. [Google Scholar] [CrossRef]
- Haas, L.; de Lange, D.W.; van Dijk, D.; van Delden, J. Should we deny ICU admission to the elderly? Ethical considerations in times of COVID-19. Crit. Care 2020, 24, 321. [Google Scholar] [CrossRef]
- Onder, G.; Giovannini, S.; Sganga, F.; Manes-Gravina, E.; Topinkova, E.; Finne-Soveri, H.; Garms-Homolová, V.; Declercq, A.; van der Roest, H.G.; Jónsson, P.V.; et al. Interactions between drugs and geriatric syndromes in nursing home and home care: Results from Shelter and IBenC projects. Aging Clin. Exp. Res. 2018, 30, 1015–1021. [Google Scholar] [CrossRef]


| Variables 1 | Total | Intensive-Care Unit | p-Value and Effect Size 2 | |
|---|---|---|---|---|
| Yes | No | |||
| Number | 1160 (100%) | 199 (17%) | 961 (83%) | - |
| Demographic | ||||
| Age (years) | 71 (53–82) | 64 (53–77) | 72 (54–83) | p = 0.001 * (0.10) T |
| Sex | ||||
| Male | 623 (54%) | 119 (60%) | 504 (52%) | p = 0.06 |
| Female | 537 (46%) | 80 (40%) | 457 (48%) | |
| Initial evaluation | ||||
| Pulse (bpm) | 81 (69–93) | 83 (70–96) | 80 (68–93) | p = 0.17 |
| Respiratory rate (bpm) | 15 (13–17) | 15 (14–16) | 14 (13–17) | p = 0.025 * (0.07) T |
| Temperature (°C) | 36.0 (35.8–36.5) | 36.0 (35.7–36.5) | 36.0 (35.8–36.5) | p = 0.25 |
| Systolic Blood Pressure (mmHg) | 138 (120–158) | 138 (117–167) | 138 (120–157) | p = 0.72 |
| Diastolic Blood Pressure (mmHg) | 77 (67–87) | 78 (65–93) | 77 (67–87) | p = 0.39 |
| Mean Blood Pressure (mmHg) | 98 (87–109) | 99 (85–119) | 98 (87–109) | p = 0.52 |
| SpO2 (%) | 97 (95–98) | 98 (95–100) | 96 (94–98) | p < 0.001 * (0.12) T |
| Air oxygen | 303 (26%) | 135 (68%) | 168 (18%) | p < 0.001 * (0.43) M |
| FiO2 (%) | 0.21 (0.21–0.24) | 0.50 (0.21–0.99) | 0.21 (0.21–0.21) | p < 0.001 * (0.48) S |
| Glasgow Coma Scale (total) | 15 (12–15) | 4 (3–14) | 15 (14–15) | p < 0.001 * (0.48) S |
| Eye Opening Response | 4 (3–4) | 1 (1–3) | 4 (4–4) | p < 0.001 * (0.48) S |
| Verbal Response | 5 (4–5) | 1 (1–5) | 5 (5–5) | p < 0.001 * (0.49) S |
| Motor Response | 6 (6–6) | 2 (1–6) | 6 (6–6) | p < 0.001 * (0.54) M |
| Hospital Triage | ||||
| Level I: Resuscitation | 121 (10%) | 93 (47%) | 28 (3%) | p < 0.001 * (0.54) L |
| Level II: Emergency | 577 (50%) | 91 (46%) | 486 (51%) | p = 0.21 |
| Level III: Urgency | 462 (40%) | 15 (7%) | 447 (46%) | p < 0.001 * (0.30) M |
| Pathology | ||||
| Ischaemic stroke | 369 (32%) | 37 (19%) | 332 (35%) | p < 0.001 * (0.13) S |
| Seizures | 282 (24%) | 29 (14%) | 253 (26%) | p < 0.001 * (0.10) S |
| Haemorrhage | 204 (18%) | 99 (50%) | 105 (11%) | p < 0.001 * (0.38) M |
| Confusion syndrome | 69 (6%) | 4 (2%) | 65 (7%) | p = 0.010 * (0.08) T |
| Degenerative disease | 66 (6%) | 2 (1%) | 64 (7%) | p = 0.002 * (0.09) T |
| Headache | 42 (3%) | 0 (0%) | 42 (4%) | p = 0.003 * (0.09) T |
| Vertigo | 31 (3%) | 0 (0%) | 31 (3%) | p = 0.010 * (0.08) T |
| Tumour | 30 (3%) | 2 (1%) | 28 (3%) | p = 0.12 |
| Infection | 24 (2%) | 14 (7%) | 10 (1%) | p < 0.001 * (0.16) S |
| Neuromediated syncope | 24 (2%) | 0 (0%) | 24 (2%) | p = 0.024 * (0.07) T |
| Coma | 19 (1%) | 12 (6%) | 7 (1%) | p < 0.001 * (0.16) S |
| Hospital outcomes | ||||
| Inpatients | 808 (70%) | 198 (99%) | 610 (64%) | p < 0.001 * (0.30) M |
| Hospitalization days (inpatients) | 7 (4–13) | 10 (4–20) | 7 (4–11) | p < 0.001 * (0.14) T |
| Mortality | ||||
| 2-day | 64 (6%) | 38 (19%) | 26 (3%) | p < 0.001 * (0.27) S |
| 7-day | 114 (10%) | 54 (27%) | 60 (6%) | p < 0.001 * (0.27) S |
| 14-day | 145 (13%) | 65 (33%) | 80 (8%) | p < 0.001 * (0.28) S |
| 21-day | 173 (15%) | 79 (40%) | 94 (10%) | p < 0.001 * (0.32) M |
| 28-day | 183 (16%) | 84 (42%) | 99 (10%) | p < 0.001 * (0.33) M |
| EWS analyzed | ||||
| NEWS | 4 (2–6) | 6 (5–8) | 3 (1–5) | p < 0.001 * (0.35) S |
| ViEWS | 3 (1–6) | 6 (5–8) | 3 (1–5) | p < 0.001 * (0.35) S |
| MEWS | 2 (1–3) | 4 (2–6) | 2 (1–3) | p < 0.001 * (0.38) S |
| MREMS | 5 (3–7) | 8 (5–10) | 4 (2–6) | p < 0.001 * (0.33) S |
| EWS | 1 (0–3) | 3 (2–5) | 1 (0–2) | p < 0.001 * (0.37) S |
| HEWS | 3 (2–4) | 5 (3–6) | 3 (1–4) | p < 0.001 * (0.30) S |
| SEWS | 1 (0–3) | 3 (2–5) | 1 (0–2) | p < 0.001 * (0.37) S |
| RAPS | 2 (0–4) | 4 (2–6) | 2 (0–3) | p < 0.001 * (0.39) S |
| WPSS | 2 (0–4) | 3 (3–6) | 2 (0–3) | p < 0.001 * (0.29) S |
| Variables | Survivors | Non-Survivors | p-Value | ||||
|---|---|---|---|---|---|---|---|
| 2-Day | 7-Day | 14-Day | 21-Day | 28-Day | |||
| Number | 977 (84%) | 64 (6%) | 114 (10%) | 145 (13%) | 173 (15%) | 183 (16%) | |
| Demographic | |||||||
| Age (years) | 67 (52–80) | 79 (66–84) | 80 (69–86) | 80 (70–87) | 80 (67–86) | 79 (67–86) | p < 0.001 * (0.23) S |
| Sex | |||||||
| Male | 528 (54%) | 36 (56%) | 60 (53%) | 70 (48%) | 90 (52%) | 95 (52%) | p = 0.60 |
| Female | 449 (46%) | 28 (44%) | 54 (47%) | 75 (52%) | 83 (48%) | 88 (48%) | |
| Initial evaluation | |||||||
| Pulse (bpm) | 81 (69–93) | 85 (68–100) | 81 (68–96) | 79 (68–93) | 80 (69–94) | 81 (69–95) | p = 0.70 |
| Respiratory rate (bpm) | 14 (13–17) | 15 (15–21) | 15 (15–19) | 15 (15–19) | 15 (15–18) | 15 (15–18) | p < 0.001 * (0.15) T |
| Temperature (°C) | 36.1 (35.8–36.5) | 36.0 (35.0–36.7) | 36.0 (35.3–36.5) | 36.0 (35.4–36.6) | 36.0 (35.5–36.6) | 36.0 (35.5–36.6) | p = 0.017 * (0.07) T |
| Systolic Blood Pressure (mmHg) | 137 (120–156) | 147 (107–174) | 145 (120–168) | 145 (120–170) | 144 (123–170) | 144 (123–170) | p = 0.006 * (0.08) T |
| Diastolic Blood Pressure (mmHg) | 77 (67–87) | 76 (60–96) | 75 (60–93) | 79 (61–93) | 80 (64–92) | 80 (65–93) | p = 0.16 |
| Mean Blood Pressure (mmHg) | 97 (87–108) | 101 (77–122) | 100 (82–121) | 100 (83–119) | 101 (86–119) | 101 (87–119) | p = 0.022 * (0.07) T |
| SpO2 (%) | 97 (95–98) | 96 (91–100) | 95 (92–99) | 95 (92–99) | 96 (93–99) | 96 (93–99) | p = 0.013 * (0.07) T |
| Air oxygen | 190 (19%) | 58 (91%) | 85 (75%) | 101 (70%) | 112 (65%) | 113 (62%) | p < 0.001 * (0.35) M |
| FiO2 (%) | 0.21 (0.21–0.21) | 0.50 (0.40–0.99) | 0.50 (0.21–0.99) | 0.40 (0.21–0.99) | 0.40 (0.21–0.99) | 0.31 (0.21–0.99) | p < 0.001 * (0.38) S |
| Glasgow Coma Scale | 15 (14–15) | 3 (3–7) | 5 (3–11) | 6 (3–12) | 7 (3–13) | 8 (3–13) | p < 0.001 * (0.48) S |
| Eye Opening Response | 4 (3–4) | 1 (1–1) | 1 (1–3) | 1 (1–3) | 2 (1–3) | 2 (1–3) | p < 0.001 * (0.46) S |
| Verbal Response | 5 (5–5) | 1 (1–1) | 1 (1–3) | 1 (1–4) | 1 (1–4) | 2 (1–4) | p < 0.001 * (0.50) M |
| Motor Response | 6 (6–6) | 1 (1–3) | 3 (1–5) | 3 (1–5) | 3 (1–6) | 4 (1–6) | p < 0.001 * (0.50) M |
| Hospital Triage | |||||||
| Level I: Resuscitation | 63 (6%) | 33 (52%) | 42 (37%) | 48 (33%) | 58 (34%) | 58 (32%) | p < 0.001 * (0.30) M |
| Level II: Emergency | 477 (49%) | 26 (40%) | 61 (53%) | 80 (55%) | 92 (53%) | 100 (54%) | p = 0.15 |
| Level III: Urgency | 437 (45%) | 5 (8%) | 11 (10%) | 17 (12%) | 23 (13%) | 25 (14%) | p < 0.001 * (0.23) S |
| Pathology | |||||||
| Ischaemic stroke | 318 (33%) | 7 (11%) | 26 (23%) | 36 (25%) | 46 (26%) | 51 (28%) | p = 0.21 |
| Seizures | 276 (28%) | 1 (2%) | 2 (2%) | 4 (3%) | 4 (2%) | 6 (3%) | p < 0.001 * (0.21) S |
| Haemorrhage | 112 (12%) | 42 (65%) | 67 (59%) | 79 (55%) | 90 (52%) | 92 (51%) | p < 0.001 * (0.37) M |
| Confusion syndrome | 65 (7%) | 1 (2%) | 1 (1%) | 2 (1%) | 3 (2%) | 4 (2%) | p = 0.019 * (0.07) T |
| Degenerative disease | 60 (6%) | 1 (2%) | 2 (2%) | 5 (3%) | 6 (4%) | 6 (3%) | p = 0.13 |
| Headache | 42 (4%) | 0 (0%) | 0 (0%) | 0 (0%) | 0 (0%) | 0 (0%) | p = 0.004 * (0.08) T |
| Vertigo | 31 (3%) | 0 (0%) | 0 (0%) | 0 (0%) | 0 (0%) | 0 (0%) | p = 0.015 * (0.07) T |
| Tumours | 24 (2%) | 0 (0%) | 1 (1%) | 3 (2%) | 6 (4%) | 6 (3%) | p = 0.52 |
| Neuromediated syncope | 24 (2%) | 0 (0%) | 0 (0%) | 0 (0%) | 0 (0%) | 0 (0%) | p = 0.032 * (0.06) T |
| Infections | 17 (2%) | 4 (6%) | 5 (4%) | 6 (4%) | 7 (4%) | 7 (4%) | p = 0.07 |
| Coma | 8 (1%) | 8 (12%) | 10 (8%) | 10 (7%) | 11 (6%) | 11 (6%) | p < 0.001 * (0.15) S |
| Hospital outcomes | |||||||
| Inpatients | 627 (64%) | 63 (98%) | 113 (99%) | 143 (99%) | 171 (99%) | 181 (99%) | p < 0.001 * (0.28) S |
| Hospitalization days (inpatients) | 8 (5–13) | 1 (1–2) | 2 (1–4) | 3 (1–7) | 4 (2–10) | 5 (2–11) | p < 0.001 * (0.18) T |
| Intensive care unit | 115 (12%) | 38 (59%) | 54 (47%) | 65 (45%) | 79 (46%) | 84 (46%) | p < 0.001 * (0.33) M |
| EWS analyzed | |||||||
| NEWS | 3 (1–5) | 9 (7–11) | 7 (6–10) | 7 (6–9) | 7 (5–9) | 7 (5–9) | p < 0.001 * (0.40) S |
| ViEWS | 3 (1–5) | 8 (6–11) | 7 (6–10) | 7 (5–9) | 7 (5–9) | 7 (5–9) | p < 0.001 * (0.40) S |
| MEWS | 2 (1–3) | 6 (4–7) | 5 (4–6) | 5 (3–6) | 5 (3–6) | 4 (3–6) | p < 0.001 * (0.41) S |
| MREMS | 4 (2–6) | 11 (9–13) | 10 (7–11) | 9 (7–11) | 9 (6–11) | 9 (6–11) | p < 0.001 * (0.45) S |
| EWS | 1 (0–2) | 4 (3–6) | 4 (3–5) | 4 (3–5) | 4 (2–5) | 4 (2–5) | p < 0.001 * (0.40) S |
| HEWS | 3 (1–4) | 6 (5–9) | 5 (4–7) | 5 (4–6) | 5 (3–6) | 5 (3–6) | p < 0.001 * (0.34) S |
| SEWS | 1 (0–2) | 4 (3–6) | 4 (3–5) | 4 (3–5) | 4 (2–5) | 4 (2–5) | p < 0.001 * (0.40) S |
| RAPS | 2 (0–3) | 6 (4–8) | 5 (3–7) | 5 (3–7) | 4 (3–6) | 4 (3–6) | p < 0.001 * (0.40) S |
| WPSS | 2 (0–3) | 5 (3–8) | 1 (1–2) | 5 (3–6) | 4 (3–6) | 4 (3–6) | p < 0.001 * (0.37) S |
| Scores | Intensive Care Unit | Non-Survivors 2-Day | Non-Survivors 28-Day | |
|---|---|---|---|---|
| NEWS | ||||
| Cut-off | 5 | 6 | 5 | |
| AUROC | 0.769 (0.728–0.809) | 0.908 (0.859–0.957) | 0.815 (0.776–0.854) | |
| Sensitivity | 77.4 (71.1–82.6) | 93.8 (85.0–97.5) | 80.3 (74.6–86.1) | |
| Specificity | 70.1 (67.2–72.9) | 75.5 (72.9–78.0) | 69.9 (67.0–72.8) | |
| PPV | 34.9 (30.6–39.5) | 18.3 (14.5–22.8) | 30.1 (27.3–33.0) | |
| NPV | 93.7 (91.7–95.3) | 99.5 (98.8–99.8) | 19.7 (14.6–26.0) | |
| Likelihood ratio + | 2.59 (2.29–2.93) | 3.83 (3.39–4.33) | 2.67 (2.37–3.01) | |
| Likelihood ratio − | 0.32 (0.25–0.42) | 0.08 (0.03–0.21) | 0.28 (0.21–0.38) | |
| Odds ratio | 8.04 (5.61–11.52) | 46.34 (16.69–128.71) | 9.49 (6.43–14.00) | |
| Diagnostic accuracy | 71.4 (68.7–73.9) | 76.6 (74.0–78.9) | 71.6 (68.9–74.1) | |
| ViEWS | ||||
| Cut-off | 5 | 5 | 5 | |
| AUROC | 0.768 (0.727–0.808) | 0.907 (0.857–0.956) | 0.813 (0.774–0.852) | |
| Sensitivity | 75.9 (69.5–81.3) | 100.0 (94.3–100.0) | 79.2 (72.8–84.5) | |
| Specificity | 72.3 (69.4–75.1) | 67.8 (65.0–70.5) | 72.2 (69.3–74.9) | |
| PPV | 36.2 (31.7–40.9) | 15.3 (12.2–19.1) | 34.8 (30.4–39.5) | |
| NPV | 93.5 (91.5–95.1) | 100.0 (99.5–100.0) | 94.9 (93.1–96.3) | |
| Likelihood ratio + | 2.74 (2.41–3.12) | 3.10 (2.85–3.38) | 2.85 (2.51–3.23) | |
| Likelihood ratio − | 0.33 (0.26–0.43) | 0.00 (0.00–0.00) | 0.29 (0.22–0.38) | |
| Odds ratio | 8.22 (5.77–11.71) | - | 9.89 (6.74–14.51) | |
| Diagnostic accuracy | 72.9 (70.3–75.4) | 69.6 (66.9–72.1) | 73.3 (70.7–75.7) | |
| MEWS | ||||
| Cut-off | 4 | 4 | 3 | |
| AUROC | 0.789 (0.750–0.828) | 0.914 (0.866–0.961) | 0.818 (0.780–0.857) | |
| Sensitivity | 64.8 (58.0–71.1) | 92.2 (83.0–96.6) | 81.4 (75.2–86.4) | |
| Specificity | 84.3 (81.9–86.5) | 79.8 (77.4–82.1) | 70.8 (67.9–73.6) | |
| PPV | 46.1 (40.3–51.9) | 21.1 (16.7–26.2) | 34.3 (30.0–38.9) | |
| NPV | 92.0 (90.1–93.7) | 99.4 (98.7–99.8) | 95.3 (93.5–96.6) | |
| Likelihood ratio + | 4.13 (3.45–4.93) | 4.57 (3.98–5.25) | 2.79 (2.48–3.15) | |
| Likelihood ratio − | 0.42 (0.34–0.51) | 0.10 (0.04–0.23) | 0.26 (0.19–0.36) | |
| Odds ratio | 9.89 (7.04–13.87) | 46.72 (18.53–117.79) | 10.64 (7.15–15.83) | |
| Diagnostic accuracy | 80.9 (78.6–83.1) | 80.5 (78.1–82.7) | 72.5 (69.9–75.0) | |
| MREMS | ||||
| Cut-off | 8 | 8 | 6 | |
| AUROC | 0.755 (0.714–0.796) | 0.929 (0.885–0.973) | 0.856 (0.820–0.891) | |
| Sensitivity | 50.8 (43.9–57.6) | 87.5 (77.2–93.5) | 83.6 (77.6–88.3) | |
| Specificity | 90.4 (88.4–92.1) | 87.5 (85.4–89.3) | 70.1 (67.2–72.9) | |
| PPV | 52.3 (45.3–59.3) | 29.0 (23.1–35.8) | 34.4 (30.1–38.9) | |
| NPV | 89.9 (87.8–91.6) | 99.2 (98.4–99.6) | 95.8 (94.1–97.0) | |
| Likelihood ratio + | 5.30 (4.18–6.72) | 7.00 (5.84–8.40) | 2.80 (2.49–3.14) | |
| Likelihood ratio − | 0.54 (0.47–0.63) | 0.14 (0.07–0.27) | 0.23 (0.17–0.33) | |
| Odds ratio | 9.73 (6.85–13.83) | 49.00 (22.87–105.00) | 11.96 (7.90–18.11) | |
| Diagnostic accuracy | 83.6 (81.4–85.6) | 87.5 (85.5–89.3) | 72.2 (69.6–74.7) | |
| EWS | ||||
| Cut-off | 3 | 3 | 3 | |
| AUROC | 0.774 (0.733–0.814) | 0.895 (0.843–0.947) | 0.810 (0.771–0.850) | |
| Sensitivity | 69.8 (63.1–75.8) | 92.2 (83.0–96.6) | 72.1 (65.2–78.1) | |
| Specificity | 81.2 (78.6–83.5) | 76.2 (73.6–78.6) | 80.8 (78.2–83.1) | |
| PPV | 43.4 (38.1–48.9) | 18.4 (14.6–23.1) | 41.3 (36.0–46.7) | |
| NPV | 92.9 (90.9–94.4) | 99.4 (98.6–99.7) | 93.9 (92.1–95.4) | |
| Likelihood ratio + | 3.71 (3.16–4.35) | 3.87 (3.41–4.40) | 3.75 (3.20–4.39) | |
| Likelihood ratio − | 0.37 (0.30–0.46) | 0.10 (0.04–0.24) | 0.35 (0.27–0.44) | |
| Odds ratio | 9.98 (7.08–14.07) | 37.75 (14.99–95.06) | 10.86 (7.58–15.57) | |
| Diagnostic accuracy | 79.2 (76.8–81.5) | 77.1 (74.6–79.4) | 79.4 (77.0–81.6) | |
| HEWS | ||||
| Cut-off | 4 | 5 | 4 | |
| AUROC | 0.728 (0.686–0.771) | 0.865 (0.807–0.922) | 0.769 (0.727–0.811) | |
| Sensitivity | 68.3 (61.6–74.4) | 79.7 (68.3–87.7) | 72.1 (65.2–78.1) | |
| Specificity | 70.9 (67.9–73.6) | 79.4 (76.9–81.7) | 70.9 (68.0–73.7) | |
| PPV | 32.7 (28.4–37.3) | 18.4 (14.3–23.4) | 31.7 (27.4–36.4) | |
| NPV | 91.5 (89.3–93.3) | 98.5 (97.5–99.1) | 93.1 (91.1–94.7) | |
| Likelihood ratio + | 2.35 (2.05–2.69) | 3.86 (3.26–4.58) | 2.48 (2.17–2.83) | |
| Likelihood ratio − | 0.45 (0.36–0.55) | 0.26 (0.16–0.42) | 0.39 (0.31–0.50) | |
| Odds ratio | 5.25 (3.78–7.30) | 15.10 (8.07–28.25) | 6.32 (4.44–8.98) | |
| Diagnostic accuracy | 70.4 (67.7–73.0) | 79.4 (77.9–81.6) | 71.1 (68.4–73.7) | |
| SEWS | ||||
| Cut-off | 3 | 3 | 3 | |
| AUROC | 0.773 (0.733–0.814) | 0.895 (0.843–0.947) | 0.810 (0.771–0.850) | |
| Sensitivity | 69.8 (63.1–75.8) | 92.2 (83.0–96.6) | 72.1 (65.2–78.1) | |
| Specificity | 81.2 (78.6–83.5) | 76.2 (73.6–78.6) | 80.8 (78.2–83.1) | |
| PPV | 43.4 (38.1–48.9) | 18.4 (14.6–23.1) | 41.3 (36.0–46.7) | |
| NPV | 92.9 (90.9–94.4) | 99.4 (98.6–99.7) | 93.9 (92.1–95.4) | |
| Likelihood ratio + | 3.71 (3.16–4.35) | 3.87 (3.41–4.40) | 3.75 (3.20–4.39) | |
| Likelihood ratio − | 0.37 (0.30–0.46) | 0.10 (0.04–0.24) | 0.35 (0.27–0.44) | |
| Odds ratio | 9.98 (7.08–14.07) | 37.75 (14.99–95.06) | 10.86 (7.58–15.57) | |
| Diagnostic accuracy | 79.2 (76.8–81.5) | 77.1 (74.6–79.4) | 79.4 (77.0–81.6) | |
| RAPS | ||||
| Cut-off | 4 | 4 | 3 | |
| AUROC | 0.790 (0.751–0.829) | 0.902 (0.852–0.953) | 0.806 (0.767–0.846) | |
| Sensitivity | 67.3 (60.5–73.5) | 87.5 (77.2–93.5) | 77.6 (71.0–83.0) | |
| Specificity | 82.5 (80.0–84.8) | 77.6 (75.0–79.9) | 72.2 (69.3–74.9) | |
| PPV | 44.4 (38.9–50.0) | 18.5 (14.6–23.3) | 34.3 (29.9–39.0) | |
| NPV | 92.4 (90.5–94.0) | 99.1 (98.2–99.5) | 94.5 (92.6–95.9) | |
| Likelihood ratio + | 3.85 (3.26–4.56) | 3.90 (3.38–4.50) | 2.79 (2.45–3.17) | |
| Likelihood ratio − | 0.40 (0.32–0.49) | 0.16 (0.08–0.31) | 0.31 (0.24–0.41) | |
| Odds ratio | 9.73 (6.93–13.67) | 24.19 (11.38–51.42) | 8.98 (6.17–13.06) | |
| Diagnostic accuracy | 79.9 (77.5–82.1) | 78.1 (75.6–80.4) | 73.0 (70.4–75.5) | |
| WPSS | ||||
| Cut-off | 3 | 3 | 3 | |
| AUROC | 0.716 (0.673–0.759) | 0.846 (0.785–0.906) | 0.790 (0.749–0.830) | |
| Sensitivity | 83.9 (78.2–88.4) | 100.0 (94.3–100.0) | 89.6 (84.4–93.3) | |
| Specificity | 58.0 (54.8–61.0) | 53.7 (50.8–56.7) | 58.3 (55.2–61.4) | |
| PPV | 29.2 (25.7–33.1) | 11.2 (8.9–14.1) | 28.7 (25.2–32.6) | |
| NPV | 94.6 (92.4–96.1) | 100.0 (99.4–100.0) | 96.8 (95.0–97.9) | |
| Likelihood ratio + | 2.00 (1.81–2.20) | 2.16 (2.03–2.30) | 2.15 (1.97–2.35) | |
| Likelihood ratio − | 0.28 (0.20–0.38) | 0.00 (0.00–0.00) | 0.18 (0.12–0.27) | |
| Odds ratio | 7.20 (4.83–10.73) | - | 12.09 (7.39–19.77) | |
| Diagnostic accuracy | 62.4 (59.6–65.2) | 56.3 (53.4–59.1) | 63.3 (60.5–66.0) | |
Publisher’s Note: MDPI stays neutral with regard to jurisdictional claims in published maps and institutional affiliations. |
© 2022 by the authors. Licensee MDPI, Basel, Switzerland. This article is an open access article distributed under the terms and conditions of the Creative Commons Attribution (CC BY) license (https://creativecommons.org/licenses/by/4.0/).
Share and Cite
Durantez-Fernández, C.; Polonio-López, B.; Martín-Conty, J.L.; Maestre-Miquel, C.; Viñuela, A.; López-Izquierdo, R.; Mordillo-Mateos, L.; Jorge-Soto, C.; Otero-Agra, M.; Dileone, M.; et al. Comparison of Nine Early Warning Scores for Identification of Short-Term Mortality in Acute Neurological Disease in Emergency Department. J. Pers. Med. 2022, 12, 630. https://doi.org/10.3390/jpm12040630
Durantez-Fernández C, Polonio-López B, Martín-Conty JL, Maestre-Miquel C, Viñuela A, López-Izquierdo R, Mordillo-Mateos L, Jorge-Soto C, Otero-Agra M, Dileone M, et al. Comparison of Nine Early Warning Scores for Identification of Short-Term Mortality in Acute Neurological Disease in Emergency Department. Journal of Personalized Medicine. 2022; 12(4):630. https://doi.org/10.3390/jpm12040630
Chicago/Turabian StyleDurantez-Fernández, Carlos, Begoña Polonio-López, José L. Martín-Conty, Clara Maestre-Miquel, Antonio Viñuela, Raúl López-Izquierdo, Laura Mordillo-Mateos, Cristina Jorge-Soto, Martín Otero-Agra, Michele Dileone, and et al. 2022. "Comparison of Nine Early Warning Scores for Identification of Short-Term Mortality in Acute Neurological Disease in Emergency Department" Journal of Personalized Medicine 12, no. 4: 630. https://doi.org/10.3390/jpm12040630