Article

Association of Elevated Expression Levels of COL4A1 in Stromal Cells with an Immunosuppressive Tumor Microenvironment in Low-Grade Glioma, Pancreatic Adenocarcinoma, Skin Cutaneous Melanoma, and Stomach Adenocarcinoma

1
Department of Biological Sciences, Konkuk University, 120 Neungdong-ro, Gwangjin-gu, Seoul 05029, Korea
2
Department of Stem Cell and Regenerative Biotechnology, Konkuk University, 120 Neungdong-ro, Gwangjin-gu, Seoul 05029, Korea
*
Authors to whom correspondence should be addressed.
J. Pers. Med. 2022, 12(4), 534; https://doi.org/10.3390/jpm12040534
Submission received: 25 February 2022 / Revised: 24 March 2022 / Accepted: 25 March 2022 / Published: 28 March 2022

Abstract

:
Aberrant expression of collagen type IV alpha chain 1 (COL4A1) can influence tumor cell behavior. To examine the association of COL4A1 expression in the tumor microenvironment (TME) with tumor progression, we performed bioinformatics analyses of The Cancer Genome Atlas RNA sequencing and RNA microarray datasets available in public databases and identified upregulated COL4A1 expression in most examined tumor types compared to their normal counterparts. The elevated expression of COL4A1 was correlated with low survival rates of patients with low-grade glioma, pancreatic adenocarcinoma, skin cutaneous melanoma, and stomach adenocarcinoma, thus suggesting its potential use as a biomarker for the poor prognosis of these tumors. However, COL4A1 was mostly expressed in adjacent stromal cells, such as cancer-associated fibroblasts (CAFs) and endothelial cells. Additionally, COL4A1 expression was highly correlated with the signatures of CAFs and endothelial cells in all four tumor types. The expression of marker genes for the infiltration of pro-tumoral immune cells, such as Treg, M2, and TAM, and those of immunosuppressive cytokines exhibited very strong positive correlations with COL4A1 expression. Collectively, our data suggest that COL4A1 overexpression in stromal cells may be a potential regulator of tumor-supporting TME composition associated with poor prognosis.

1. Introduction

Collagens are the most abundant proteins in mammals and play structural roles in supporting the mechanical properties, organization, and shape of various tissues, in addition to their regulatory roles in the physiological processes of cells, such as proliferation, migration, and differentiation, via receptors [1]. The collagen superfamily consists of 28 vertebrate types, which are distinguished by triple Gly-X-Y repeats in alpha chains forming collagen trimers [1]. COL4A1 encodes the alpha 1 chain of type IV collagen (Col IV), which combines with alpha 1 and alpha 2 chains to form the complete IV collagen alpha 1-1-2 molecule [2]. Notably, the clinical phenotypes of patients with COL4A1 variants are extremely variable and mutations in COL4A1 cause a wide spectrum of conditions called “COL4A1-related disorders” with eye defects, cerebral small vessel disease with or without ocular anomalies, and systemic defects, such as the hereditary angiopathy with nephropathy, aneurysms, and muscle cramps syndrome [3,4].
Col IV activates intracellular signaling events to promote cell survival, proliferation, and tumorigenesis [5], and the aberrant expression of COL4A1 is associated with tumor progression. For example, COL4A1 overexpression plays a pivotal role in the carcinogenesis and metastasis of various cancers [6,7,8,9,10]. In gastric cancer, COL4A1 overexpression is related to trastuzumab resistance and tumor recurrence, leading to poor patient outcomes [11,12,13]. Furthermore, in gliomas, collagen genes, including COL4A1, are involved in immune infiltration and epithelial–mesenchymal transition [14].
The tumor microenvironment (TME) plays an essential role in the progression and development of treatment resistance in numerous malignancies [15,16,17]. The TME is an ecosystem that surrounds a tumor, consisting of immune cells, stromal fibroblasts, endothelial cells, and non-cellular components, such as the extracellular matrix and soluble factors [15,16,17,18,19]. Macrophages affect tumor cells by releasing cytokines, chemokines, enzymes, arachidonic acid metabolites, and reactive radicals via cell–cell interactions and fluid phase-mediated mechanisms [20]. The macrophages recruited in the TME, namely tumor-associated macrophages (TAMs), are the most abundant immune cells in the TME [21] and play an important role in tumor progression. In response to different stimuli, TAMs can differentiate into two distinct phenotypes, M1 and M2; the M1 phenotype enhances the Th1 response and mediates pro-inflammatory behaviors, whereas the M2 phenotype promotes the Th2 response and displays anti-inflammatory functions associated with tumor progression, invasion, and metastasis, and suppression of T cell immunity [22,23,24]. Therefore, M1 macrophages are generally considered potent effector cells that kill tumor cells and produce various proinflammatory cytokines [25]. In contrast, M2 macrophages promote angiogenesis, tissue remodeling, and repair induced by various signals (such as interleukin (IL)-4, IL-13, glucocorticoids, IL-10, and immunoglobulin complexes/TLR ligands) [23,26]. Immunosuppression is a well-known mechanism of tumor progression that leads to tumor growth and metastasis [27]. Regulatory T cells (Tregs) are potent immune suppressors. Tregs as well as M2 macrophages inhibit the anticancer functions of various effector cells, such as the natural killer (NK), CD8+ T, and γδ T cells, thereby inducing metastasis and tumor cell growth in the TME [21,28,29,30,31,32]. Furthermore, stromal cells, other than immune cells in the TME, such as cancer-associated fibroblasts (CAFs) and tumor endothelial cells (TECs), play multifaceted roles as regulators of tumor progression. Thus, CAFs that construct the stroma of the TME support tumor angiogenesis and function as key mediators of immune regulation [33]. Similar to the positive roles of CAFs in tumor progression, TECs serve as major gatekeepers for TMEs infiltrating immune cells and are involved in direct anti-cancer immune responses [34].
The TME represents a complex network of tumor cells that interacts with various cell types. Recently, new technology platforms have shed light on the analysis of the cellular composition of TME at high resolutions and identified a complex landscape of multi-lineage immune and stromal cells, such as CAF and TECs. In this study, using various bioinformatics databases available from public resources, we analyzed the levels of COL4A1 expression in 33 types of tumor tissues and examined whether elevated COL4A1 levels are associated with poor prognosis depending on the type of tumor. Furthermore, we investigated the potential role of elevated COL4A1 expression on the modulation of the immune landscape of TME to assess the prognostic value of COL4A1 expression as a biomarker, thereby providing novel insights into immunotherapeutic avenues for better treatment of patients with cancer.

2. Material and Methods

2.1. Analysis of COL4A1 mRNA Expression Levels between Cancer and Normal Tissues

We compared the mRNA expression levels of COL4A1 between tumor and normal tissues of multiple cancer types using Gene Expression Profiling Interactive Analysis (GEPIA, available at http://gepia.cancer-pku.cn/detail.php; accessed on 26 January 2021) and the Gene Expression Database of Normal and Tumor Tissues 2 (GENT2, available at http://gent2.appex.kr/gent2/; accessed on 26 January 2021). In GEPIA web tool, we compared COL4A1 expression levels across tumor samples using The Cancer Genome Atlas (TCGA) and Gene Expression database of Normal and Tumor tissues (GTEx) datasets [35]. A Dot blot of COL4A1 expression profile was retrieved from the Single Gene Analysis module. In GENT2, an integrated database of microarray-based expression datasets, we compared the transcription levels of COL4A1 between tumors and corresponding normal tissues for multiple types of cancer in the HG-U133_Plus_2 datasets [36,37]. A box plot was obtained by search with “COL4A1” term in Tissue Type option. Significant test result provided as a table was integrated with bar graph by marking significant differences with asterisks.

2.2. Survival Analyses of Cancer Patient Groups with High and Low Expression Levels of COL4A1

Survival analyses were performed using two web-based analysis tools: Easy effective survival analysis tool (ESurv, https://easysurv.net/; accessed on 31 October 2021) [38] and R2 Genomics Analysis and Visualization Platform (R2 platform, https://hgserver1.amc.nl/; accessed on 2 February 2022) [39]. ESurv was used to analyze the relationship between COL4A1 expression levels and the overall survival of patients with the optimal cut-off option in TCGA datasets. The analysis results for pancreatic adenocarcinoma (PAAD), skin cutaneous melanoma (SKCM), stomach adenocarcinoma (STAD), and low-grade glioma (LGG) datasets are shown in the ESurv webpages (PAAD: https://easysurv.net/#/app/result/general/detail/2608; accessed on 31 October 2021, SKCM: https://easysurv.net/#/app/result/general/detail/2611; accessed on 31 October 2021, STAD: https://easysurv.net/#/app/result/general/detail/2610; accessed on 31 October 2021, and LGG: https://easysurv.net/#/app/result/general/detail/2612; accessed on 31 October 2021). The R2 platform was utilized to analyze the correlation between COL4A1 gene expression levels and patient survival using the optimal cut-off option to split patient groups into microarray-based datasets of tumor glioma (GSE43378), mixed tumor pancreas (GSE28735), tumor melanoma (GSE65904), and tumor gastric (GSE15459). A COX p-value less than 0.05 was regarded to be statistically significant.

2.3. Analysis of Heterogenic Expression of COL4A1 and Its Association with Infiltrated CAFs and Endothelial Cells

To examine the expression levels of COL4A1 in various tumor-associated cell types in glioma, PAAD, melanoma, and STAD tissues, we employed two single-cell RNA-sequencing data resources: single cell portal (https://singlecell.broadinstitute.org/single_cell; accessed on 30 April 2021) and Tumor Immune Single Cell Hub (TISCH, http://tisch.comp-genomics.org; accessed on 18 March 2022). In single cell portal, we used a specific accessible study, “Study: Melanoma intra-tumor heterogeneity”, in which profiled 4656 single cells isolated from 19 patients with melanoma [40] to check heterogenic COL4A1 expression in melanoma TME. The gene expression measured by single-cell RNA-sequencing was visualized in various ways, including scatter and violin plots. In TISCH, we retrieved the expression characteristics of heterogenic COL4A1 in glioma, PAAD, SKCM, and STAD tumors through 4 different studies (Glioma: 17,185 cells isolated from 8 patients using GSE103224 dataset [41], PAAD: 57,443 cells isolated from 35 patients using CRA001160 dataset [42], SKCM: 4645 cells isolated from 19 patients using GSE72056 [40], STAD: 41,554 cells isolated from 13 patients using GSE134520 [43]). Each single-cell expression data was visualized as a scatter plot.
The immune association module in Tumor IMmune Estimation Resource (TIMER) 2.0 (http://timer.cistrome.org/; accessed on 30 September 2021) [44] was used to examine the correlation between COL4A1 expression levels and infiltration of CAFs and TECs. The correlations of COL4A1 expression levels with infiltrated CAFs estimated using the EPIC, MCP-COUNTER, and XCELL algorithms and TECs estimated using TIDE, EPIC, MCP-COUNTER, and XCELL were retrieved from TIMER 2.0.

2.4. Analysis of Correlation between Tumor Infiltration and COL4A1 Expression

Correlation of immune infiltration with COL4A1 expression in TCGA datasets was visualized using a gene module through TIMER [45]. Gene module in the TIMER database (available at https://cistrome.shinyapps.io/timer/; accessed on 31 March 2021) was used to analyze the immune cell infiltration in over 10,897 RNA-sequencing samples in 32 different types of cancer from TCGA [46]. The correlations among COL4A1 expression and tumor purity and tumor-infiltrating immune cell (B cells, CD8+ T cells, CD4+ T cells, macrophages, neutrophils, and dendritic cells) infiltration was explored for each cancer. Scatterplots were generated after entering the gene symbol, showing partial Spearman’s rho values and statistical significance at the purity correction [45].

2.5. Analyses of Correlations among COL4A1 Expression Levels and Immune Cell Marker Gene and Cytokine Expression Levels

Correlations among the expression levels of COL4A1 and marker genes of immune cells and immune-suppressive cytokines were analyzed using the TIMER and R2 platforms. A list of marker genes for each type of immune cell was used as previously described [47,48]. Spearman′s correlation values for the expression levels of COL4A1 and each marker gene in PAAD, SKCM, STAD, and LGG in the TCGA database were explored using the Gene_Corr module in the TIMER tool [44,45]. The “correlated 2 gene” module of R2 platform was utilized to examine the correlation between the expression levels of COL4A1 and marker genes in the microarray-based datasets GSE43378, GSE28735, GSE65904, and GSE15459.

3. Results

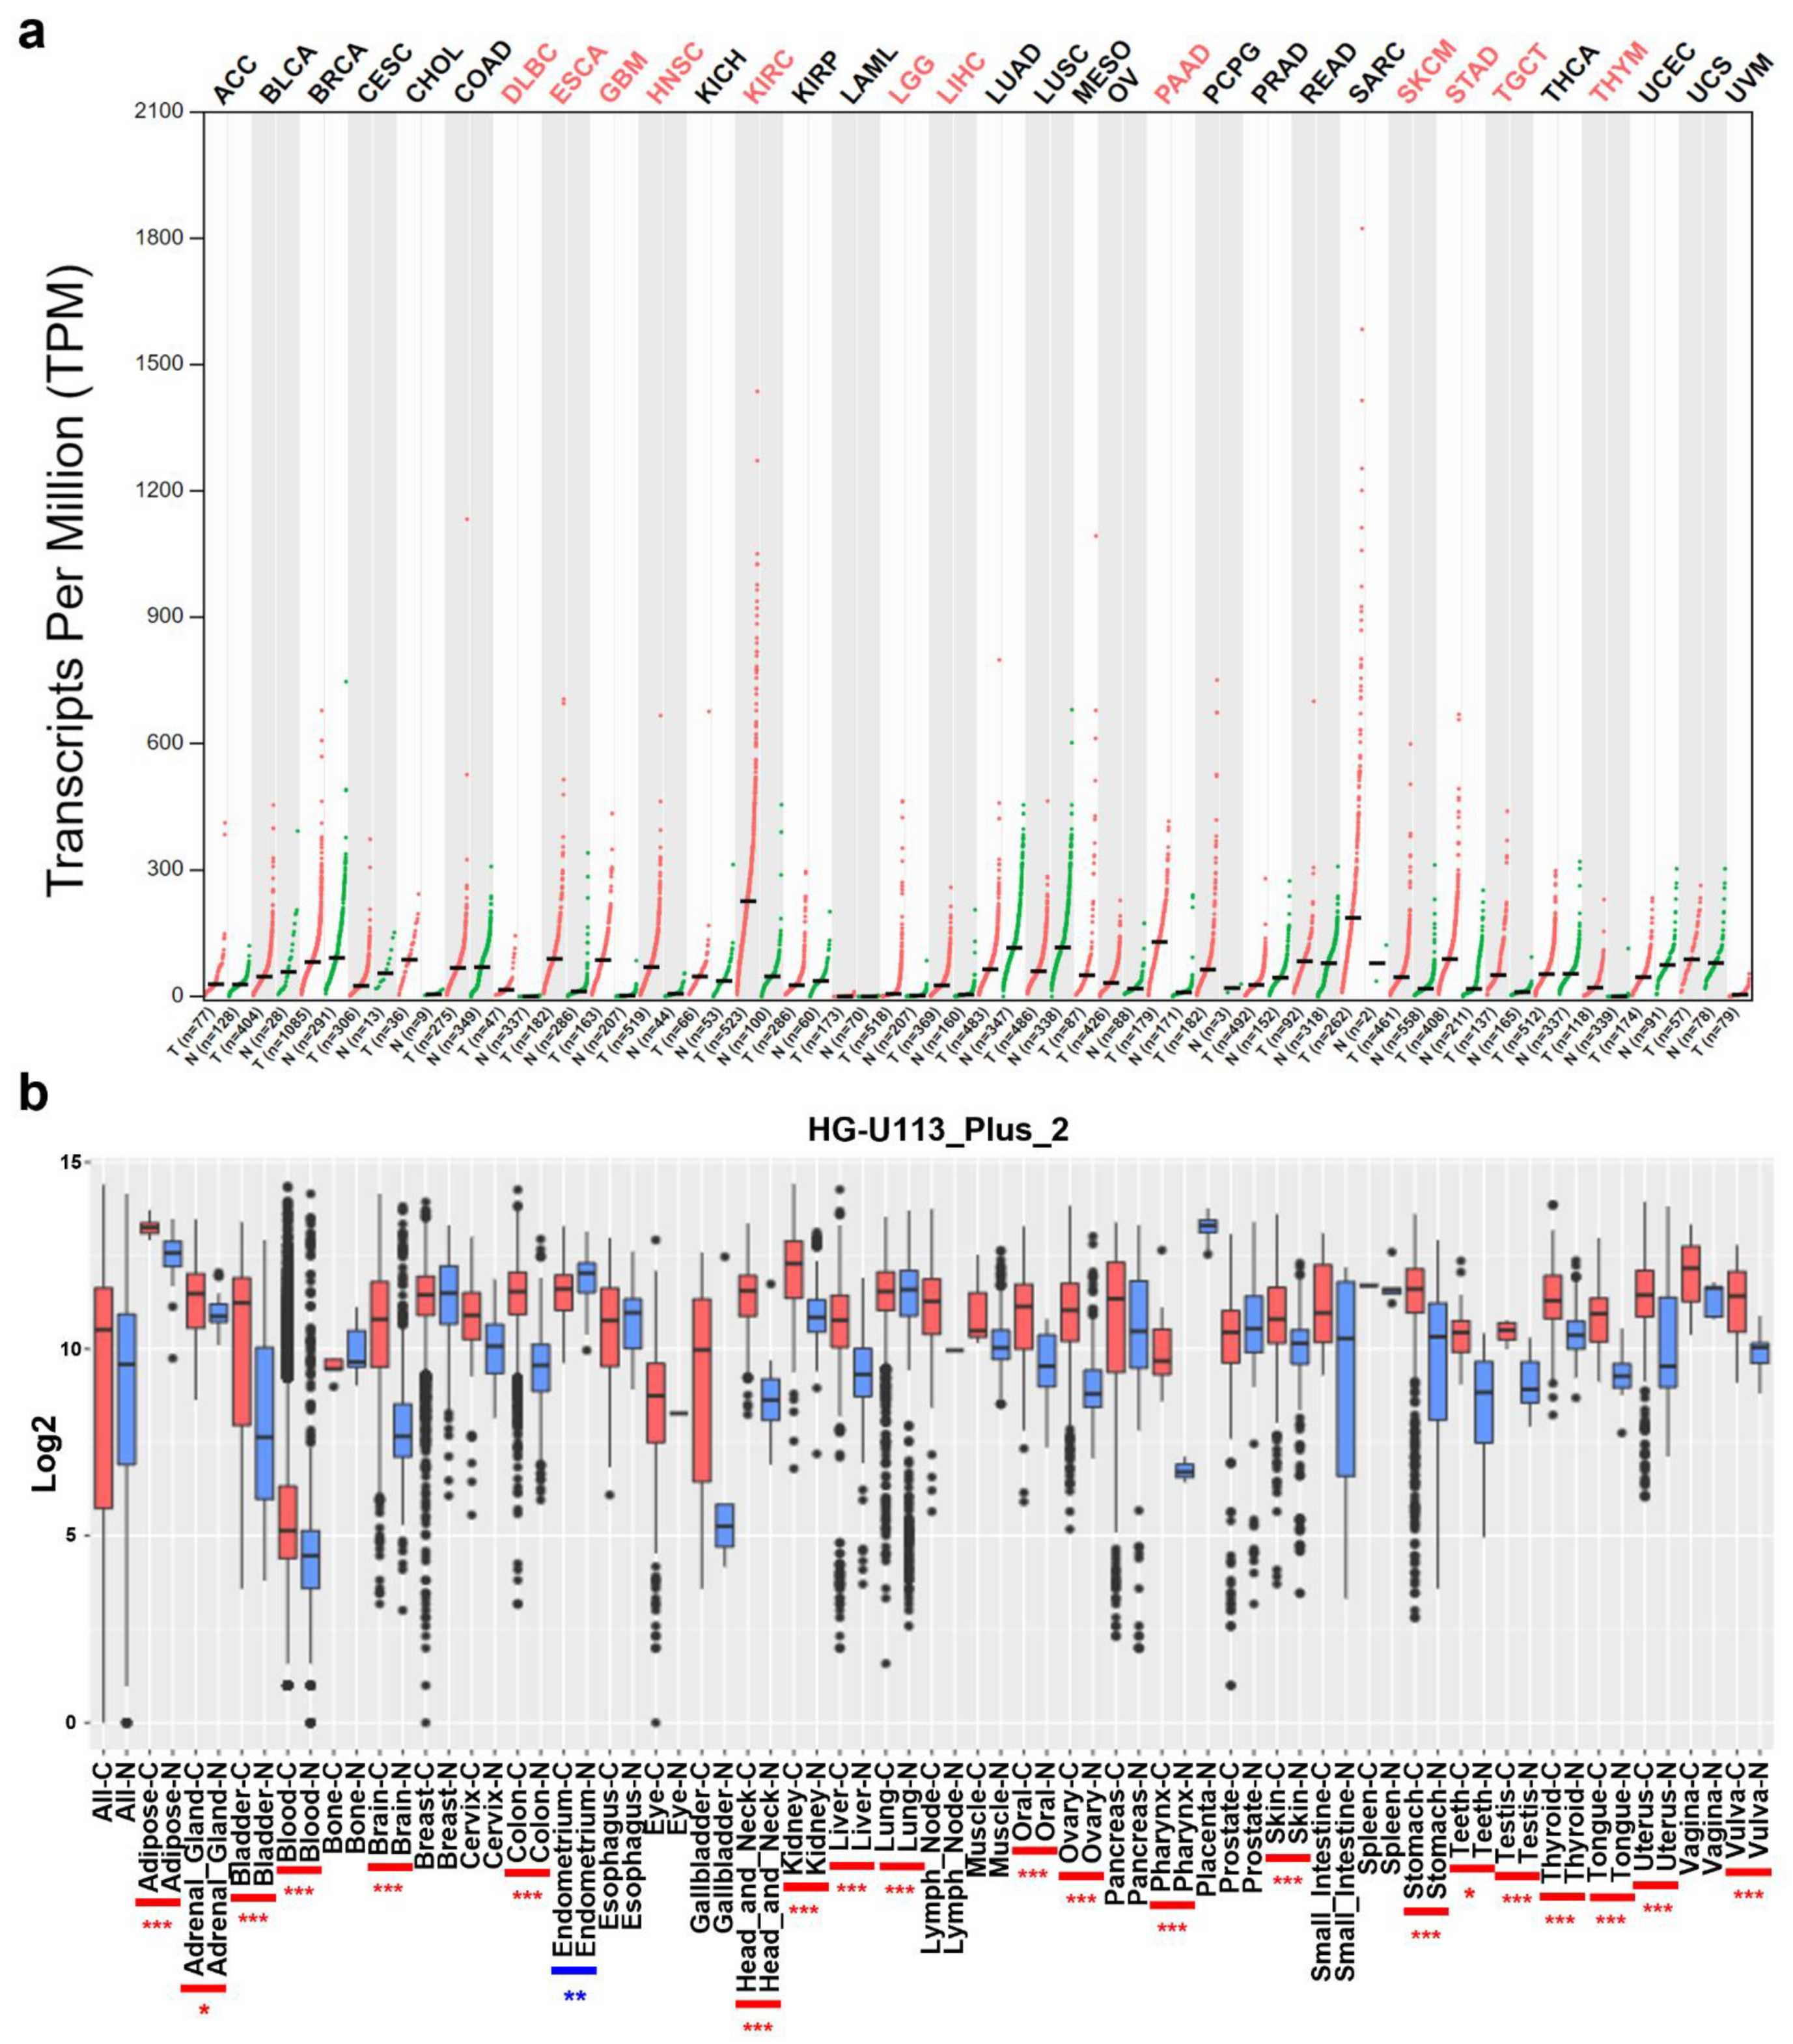
3.1. mRNA Levels of COL4A1 in Various Types of Tumors

To compare the mRNA levels of COL4A1 in various types of tumors with those in normal tissues, we used the GEPIA and GENT2 tools. In GEPIA, the majority of the examined tumors exhibited enhanced COL4A1 expression, and its expression was significantly upregulated, especially in 12 tumor types, including diffuse large B-cell lymphoma (DLBC), esophageal carcinoma (ESCA), glioblastoma multiforme (GBM), head and neck squamous cell carcinoma (HNSC), kidney renal clear cell carcinoma (KIRC), low-grade glioma (LGG), liver hepatocellular carcinoma (LIHC), pancreatic adenocarcinoma (PAAD), skin cutaneous melanoma (SKCM), stomach adenocarcinoma (STAD), testicular germ cell tumors (TGCT), and thymoma (THYM) (Figure 1a). Additionally, in GENT2 using the platform “HG-U133_Plus_2”, significantly increased COL4A1 expression was also observed in all the examined tumor tissues from adipose, adrenal gland, bladder, blood, brain, colon, head and neck, kidney, liver, lung, oral, ovary, pharynx, skin, stomach, teeth, testis, thyroid, tongue, uterus, and vulva tumors, except for endometrium tumors in comparison to their normal counterpart tissues (Figure 1b). Collectively, the data from the two analyses showed that COL4A1 expression was upregulated in most cancer types.

3.2. Analysis of Correlation between COL4A1 Expression and Patient Survival

In the previous section, RNA-sequencing data from the TCGA database showed that COL4A1 was significantly upregulated in 12 different types of tumors. Moreover, tissue-wide RNA microarray data revealed that COL4A1 was overexpressed in 21 tumor tissues. To identify the cancer types in which increased expression of COL4A1 was correlated with patient survival, we performed a Kaplan–Meier survival analysis of two patient groups split by optimal cut-off to maximize survival differences in TCGA datasets depending on the expression levels of COL4A1. Among the tested types, those with LGG, PAAD, SKCM, STAD, or TGCT displayed a significant correlation between poor prognosis and high COL4A1 expression (Figure 2 and Figure S1), indicating that the survival probability of patients with LGG, PAAD, SKCM, STAD, and TGCT may be dependent on the level of COL4A1 expression. Furthermore, in microarray-based datasets of gliomas, pancreatic tumors, melanomas, and gastric cancers, we identified a correlation between the poor survival rates of the four patient groups and high expression levels of COL4A1. These results are noteworthy because the four groups are closely related to the tumor cell origins of LGG, PAAD, SKCM, and STAD (Figure S2). Hence, the four tumor types, LGG, PAAD, SKCM, and STAD, were subjected to further analysis in this study, except for TGCT, because no further microarray-based datasets were available for patients with this type of tumor.

3.3. High Expression Levels of COL4A1 in Infiltrated CAFs and TECs among Heterogeneous TME Cells

The TME is composed of diverse cell types and secreted factors, and each cell group has divergent gene expression levels that contribute to tumor progression [49,50]. The nature of the TME is closely related to the aggressiveness of malignant cells by orchestrating the immune landscape, subsequently affecting the patient’s prognosis [51,52,53]. As it is not clear which cell types in TME mainly express COL4A1, we next analyzed COL4A1 expression levels in individual cells by “Study: Melanoma intra-tumor heterogeneity” [40] through a Single Cell Portal. Upon analysis, we found that the two major cell types with high COL4A1 mRNA levels in TME were CAFs and TECs, which are nonmalignant stromal cells (Figure 3a). High expression of COL41 exclusively in CAFs and TECs among various cell types present in TME was also observed in glioma, PAAD, STAD, and SKCM in the analysis using the TISCH database albeit some strong COL41 expression in glioma and STAD malignant cells (Figure S3).
Next, we examined the correlation between high COL4A1 expression levels and the infiltration of the two types of stromal cells, CAFs and TECs, in LGG, PAAD, SKCM, and STAD as high expression levels of COL4A1 in these tumor types were correlated with poor patient survival rates in the previously conducted analysis using the TIMER 2.0 tool. The CAF signatures of LGG, PAAD, SKCM, and STAD showed a very strong positive correlation with COL4A1 expression levels in all four algorithms, except for the result with the XCELL algorithm of SKCM (Figure 3b). In addition, TEC signatures were also highly correlated with COL4A1 expression levels (Figure 3c). Collectively, these results suggest that the infiltrated levels of CAFs and TECs in the TME are responsible for the increased expression levels of COL4A1.

3.4. Correlation between COL4A1 Expression and Immune Cell Infiltration

To investigate whether the upregulation of COL4A1 expression induced poor prognosis in LGG, PAAD, SKCM, and STAD by modulating the immune landscape in the TME, we analyzed the association between COL4A1 expression and infiltration of immune cells into the TME. We utilized the TIMER database using TCGA datasets for correlation studies with the basic types of immune cells frequently seen in TME (29092952). In LGG, the infiltrated levels of B cells (cor. = 0.308, p = 6.14 × 10⁻¹²), CD8+ T cells (cor. = 0.347, p = 5.49 × 10⁻¹⁵), CD4+ T cells (cor. = 0.305. p = 1.05 × 10⁻¹¹), macrophages (cor. = 0.421, p = 1.01 × 10⁻²¹), neutrophils (cor. = 0.389, p = 1.22 × 10⁻¹⁸), and dendritic cells (cor. = 0.399, p = 1.19 × 10⁻¹⁹) were positively correlated with COL4A1 expression levels (Figure 4a). In PAAD, the infiltrated levels of B cells (cor. = 0.261, p = 5.78 × 10⁻⁴), CD8+ T cells (cor. = 0.51, p = 9.91 × 10⁻¹³), macrophages (cor. = 0.68, p = 1.35 × 10⁻²⁴), neutrophils (cor. = 0.57, p = 4.26 × 10⁻¹⁶), and dendritic cells (cor. = 0.62, p = 1.49 × 10⁻¹⁹) were positively correlated with COL4A1 expression levels (Figure 4b). However, infiltration of CD4+ T cells (cor. = 0.067, p = 3.88 × 10⁻¹) was not significantly associated with the COL4A1 expression level in PAAD. In SKCM, the infiltrated levels of B cells (cor. = 0.122, p = 9.69 × 10⁻³), CD8+ T cells (cor. = 0.031, p = 5.19 × 10⁻¹), CD4+ T cells (cor. = 0.17, p = 3.07 × 10⁻⁴), macrophages (cor. = 0.367, p = 7.17 × 10⁻¹⁶), neutrophils (cor. = 0.205, p = 1.10 × 10⁻⁵), and dendritic cells (cor. = 0.161, p = 6.46 × 10⁻⁴) were positively correlated with COL4A1 expression levels (Figure 4c). In STAD, the infiltrated levels of B cells (cor. = –0.079, p = 1.28 × 10⁻¹) showed a weak negative correlation, while CD8+ T cells (cor. = 0.039, p = 4.52 × 10⁻¹), CD4+ T cells (cor. = 0.281, p = 4.60 × 10⁻⁸), macrophages (cor.= 0.369, p = 2.30 × 10⁻¹³), neutrophils (cor.= 0.133, p = 1.05 × 10⁻²), and dendritic cells (cor.= 0.203, p = 8.34 × 10⁻⁵) showed positive correlation with COL4A1 expression levels (Figure 4d). Notably, macrophage signatures among the examined immune cell types displayed the highest correlation with COL4A1 expression in all four cancer types. In SKCM and STAD, macrophage signatures showed a highly significant correlation with COL4A1 expression levels, unlike those of CD8+ T cells, indicating the potential effect of high COL4A1 expression on the infiltration of macrophages but not on CD8+ T cells as an immune modulator for tumor progression in the TME. In LGG and PAAD cases, despite the relatively high infiltration values of CD8+ T cells, their macrophages were even more highly infiltrated, depending on the expression levels of COL4A1. These results suggest that the expression levels of COL4A1 in LGG, PAAD, SKCM, and STAD have a potential influence on the regulation of immune cell recruitment, especially of macrophages, in tumor tissues.

3.5. Correlation between the Expression Levels of COL4A1 and Marker Genes Specific to Immune-Suppressive Subtypes

In the previous section, we identified a high correlation between COL4A1 expression and macrophage infiltration in LGG, PAAD, SKCM, and STAD. We further examined whether infiltrated macrophages in the four cancer types were tumor-promoting M2-type macrophages as M1-type macrophages are tumor-resistant due to their intrinsic phagocytosis and enhanced antitumor reactions. To identify the type of immune cells influenced by COL4A1 expression in TME, we further analyzed the correlation between the expression levels of COL4A1 and the marker genes of various immune cell subtypes, including TAMs that are not a typical type of macrophages and are different from M1 or M2 macrophages, using the TIMER web tool (Table 1 and Table S2). Most of the immune cell marker genes showed a positive correlation with COL4A1 expression, among which the marker genes specific for M2 macrophages, TAMs, and Treg cells showed a strong positive correlation with COL4A1 expression levels in LGG, PAAD, SKCM, and STAD (Table 1 and Figure 5). Although some COL4A1-expressing cases correlated with specific marker genes for cells with anticancer effects, such as CD8+ T cells, M1 macrophages, Th1 cells, and neutrophils, TAM and M2 markers were much more strongly correlated than M1 markers, as shown in Table 1. These data indicate that COL4A1 expression is exclusively correlated with the marker genes of TAMs and M2 macrophages. Furthermore, we performed additional expression correlation analyses of COL4A1 with more M1 marker genes (IL12b and CXCL11) and M2 marker genes (STAT6, IL6, and CD206) using TIMER. IL12b is a pro-M1 gene to regulate macrophage activation and polarization [54]. CXCL11 is a chemokine highly expressed in M1 macrophages, which recruits activated T cells [55]. STAT6 is a well-known driver to polarize macrophages to M2 [56]. IL6 is an M2 macrophage-secreted cytokine that facilitates metastatic activity in cancer cells [57,58]. CD206 is commonly expressed on M2 macrophages [59]. Upon examining their expression correlation, we revealed that the M2-related genes have a stronger positive correlation with COL4A1 than the M1-related genes (Figure S4). Treg markers also showed a strong correlation with COL4A1 expression levels in all four types of tumors, with some variations. In PAAD and STAD cases, a significant positive correlation with all four Treg markers was detected, but the expression levels of forkhead box protein P3 (FOXP3) and C-C motif chemokine receptor 8 (CCR8) were not significantly correlated with COL4A1 expression levels in LGG, SKCM, and LGG (Table 1 and Figure 5). COL4A1 expression was also significantly correlated with the expression levels of T cell exhaustion marker genes such as PDCD1, CTLA4, LAG3, and HAVCR2 in all the four tumor types with only two exceptions (CTLA4 in SKCM and LAG3 in STAD) (Table S2).
Furthermore, to confirm the results with LGG, PAAD, SKCM, and STAD, we examined whether COL4A1 expression levels were correlated with those of immune marker genes in gliomas, pancreatic tumors, melanomas, and gastric cancers using microarray-based datasets as the COL4A1 expression predicted poor overall survival in patients with these tumors, as shown in Figure S2. Similar to the TIMER analysis of TCGA datasets, COL4A1 expression levels were highly correlated with the expression levels of marker genes for TAMs and M2 macrophages (Table S3). In particular, the expression levels of all three marker genes of M2 macrophages were strongly correlated with COL4A1 expression levels. However, the overall correlation with other immune cells analyzed using microarray-based datasets was less apparent than that using TCGA datasets. Together, these analyses revealed that COL4A1 expression is highly associated with the infiltration of immune-suppressing cells, such as M2 macrophages, TAMs, and Tregs, suggesting the potential role of high COL4A1 expression in poor prognosis of patients via immune modulation of the TME, at least in the tumor types analyzed in this study.

3.6. Correlation between the Expression Levels of COL4A1 and Immunosuppressive Cytokines

As shown in Figure 5 and Table 1, there was a strong positive correlation between COL4A1 expression levels and the marker-specific expression levels of Treg cells, M2 macrophages, and TAMs, indicating the potential role of COL4A1 expression in the infiltration of immune-suppressing cells. To investigate whether the expression levels of cytokine markers derived from these immunosuppressive cells were also increased by COL4A1 expression, we analyzed the expression levels of cytokine genes (IL10, transforming growth factor (TGF)-β1, Epstein–Barr virus induced 3 (EBI3), and colony-stimulating factor 1 (CSF1)) in LGG, PAAD, SKAM, and STAD using the TIMER database. IL-10 promotes monocyte differentiation towards an M2 phenotype macrophage and reinforces tumor characteristics, including cell proliferation and metastasis, by exerting immunosuppressive effects [60,61]. TGFβ1 promotes epithelial–mesenchymal transition and is associated with increased tumor cell motility and invasion [62]. EBI3, composed of IL-35, inhibits the differentiation and functions of Th1 and Th17 cells by promoting the expansion of Tregs and production of IL-10 [63,64,65]. CSF1 increases the levels of immune-suppressing M2 macrophages by regulating macrophage proliferation and differentiation [66]. As shown in Figure 6, the expression levels of COL4A1 were positively correlated with the gene expression levels of these immunosuppressive cytokines in all four analyzed tumor types, LGG (IL10: cor. = 0.287, p = 1.71 × 10⁻¹⁰; TGFβ1: cor. = 0.316, p = 1.42 × 10⁻¹²; EBI3: cor. = 0.185, p = 4.50 × 10⁻⁵; CSF1: cor. = 0.131, p = 4.23 × 10⁻³), PAAD (IL10: cor. = 0.4, p = 6.03 × 10⁻⁸; TGFβ1: cor. = 0.419, p = 1.16 × 10⁻⁸; EBI3: cor. = 0.206, p = 6.82 × 10⁻³; CSF1: cor. = 0.54, p = 2.35 × 10⁻¹⁴), SKCM (IL10: cor. = 0.265, p = 8.26 × 10⁻⁹; TGFβ1: cor. = 0.451, p = 3.02 × 10⁻²⁴; EBI3: cor. = 0.01, p = 8.39 × 10⁻¹; CSF1: cor. = 0.257, p = 2.51 × 10⁻⁸), and STAD (IL10: cor. = 0.341, p = 8.88 × 10⁻¹²; TGFβ1: cor. = 0.442, p = 1.43 × 10⁻¹⁹; EBI3: cor. = 0.262, p = 2.18 × 10⁻⁷; CSF1: cor. = 0.489, p = 3.26 × 10⁻²⁴). The levels of these immunosuppressive cytokines are frequently elevated in the TME, and they play a crucial role in predicting the poor prognosis of affected patients [67,68,69,70]. Collectively, our data showed that high expression levels of COL4A1 are associated with pro-tumor effects via upregulation of the expression levels of immunosuppressive cytokines, thereby potentially affecting the poor prognosis of patients with LGG, PAAD, SKCM, and STAD.
TGF-β is a well-known EMT driver, high signaling of which promotes metastatic and invasive growth of tumor cells [71]. Since the COL4A1 expression level was positively correlated with that of TGF-β1 (Figure 6), we further examined the correlation of COL4A1 expression with epithelial-mesenchymal transition (EMT)-related genes by retrieving epithelial signature genes (CDH1, DSP, OCLN, and DSG3) and mesenchymal signature genes (CDH2, VIM, FN1, TWIST1, and ACTA2) using TIMER. Among the examined genes, the mesenchymal signatures have a stronger positive correlation with COL4A1 expression with a high statistical significance, compared to epithelial signatures (Figure S5).

4. Discussion

Despite the improvements in patient survival in the last 30 years due to the development of novel innovative therapies, including targeted therapy, cancer still is one of the most serious diseases threatening human health worldwide. In 2017, 24.5 million cancer cases were reported worldwide, with 9.6 million deaths [72]. Elucidation of novel molecular targets and/or markers is necessary to develop novel targeted therapies. COL4A1 is generally located in the basement membrane and is thought to be a barrier to tumor invasion. However, recent studies have revealed that the expression levels of COL4A1 in the TME have a positive relationship with drug resistance and tumor recurrence or progression in certain types of cancer [7,9,13,73]. In this study, we demonstrated that COL4A1 mRNA expression levels are upregulated in various cancer types, and high expression of COL4A1 correlates with poor prognosis in at least four tumor types: LGG, PAAD, SKCM, and STAD. LGGs account for 10–20% of all primary brain tumors and show slower growth than their high-grade counterparts [74,75]. However, any LGG can become life-threatening as the growing tumor may damage vital areas of the brain. PAAD accounts for approximately 85% of all pancreatic cancer cases and has a very poor prognosis, with only 24% of all patients surviving for one year and 6% surviving for five years or more after diagnosis. [76,77]. SKCM is a type of malignant skin cancer that originates from melanocytes and shows an increasing incidence [78,79]. STAD is the third leading cause of cancer-related deaths worldwide and the fifth most diagnosed cancer according to statistics from GLOBOCAN 2018 [80]. Therefore, our study suggests that modulation of COL4A1 expression may be a potential target for the development of novel therapeutic strategies for the treatment of patients with these tumors that show poor prognosis.
Interestingly, COL4A1 expression levels were significantly upregulated in most cancer types in RNA-sequencing-based TCGA datasets and the integrated microarray-based cancer-expression database GENT (Figure 1), implying the potential correlation of COL4A1 expression with tumorigenesis or tumor progression. Furthermore, we found statistically significant differences in the overall survival of patients between the high and low COL4A1 expression level groups in LGG, PAAD, SKCM, and STAD TCGA and microarray-based datasets of corresponding cancer types, suggesting that high COL4A1 expression is a possible marker for predicting the poor prognosis of patients (Figure 2). Unlike the other three cancer types, the survival rates of the LGG patient group with low COL4A1 expression declined significantly from approximately 150 months, eventually disappearing after approximately 170 months (Figure 2a). All patients with LGGs eventually progress to high-grade gliomas and die [81]. As the pathological significance of COL4A1 expression in the progression of LGG remains unknown, it is worth examining the role of COL4A1 overexpression at the late stage of disease progression after 150 months. Despite some discrepancies in late-stage LGG progression, the association of COL4A1 overexpression with patient overall survival suggests the existence of a common tumor-promoting mechanism related to COL4A1 expression, at least in the four tumors analyzed.
The predominant expression of COL4A1 in CAFs has been previously reported in pancreatic ductal adenocarcinoma [82]. Together with this report, single-cell sequencing data showing that COL4A1 mRNA is expressed mainly in CAFs and TECs (Figure 3a and Figure S3), is noteworthy because recent studies have proved that CAFs directly and/or indirectly influence immunosuppression in the TME [83,84,85]. CAF-educated myeloid cells are transformed into pro-tumor macrophages, leading to the suppression of T cell proliferation by upregulating TGFB1 expression and IL10 production [86]. This might be the reason for the strong correlations among COL4A1, TGFB1, and IL10 expression levels. CAF markers are positively correlated with FoxP3+ cells and negatively correlated with CD8+ T cells, which may lead to poor prognosis [87,88]. In our study, COL4A1 expression levels were positively correlated with those of most Treg markers, except FoxP3, in LGG and SKCM (Table 1 and Figure 5). The cytotoxic activity of NK cells is also affected by CAFs [89]. In this context, COL4A1 is potentially associated with CAF by modulating the immunosuppressive TME toward pro-tumor effects, resulting in worse prognostic outcomes.
We also found that COL4A1 mRNA is highly expressed in TECs and that high COL4A1 expression correlates with the level of endothelial infiltration in the tumor mass. Endothelial cells constitute blood vessels, supply metabolic substrates to tumors, and secrete angiocrine factors to facilitate the metastasis of angiogenesis-dependent cancers [90,91,92]. Endothelial cells in the tumor vasculature actively induce the escape of malignant cells and suppress the effects of T cells [93]. COL4A1 is a structural component of the basement membrane in the blood vessels [94]. As angiogenesis enhances tumor progression, it is a representative prognostic factor that worsens patient survival [95]. In addition, tumor-associated blood vessels promote the inflow of immune cells into the tumors [96]. Therefore, our finding showing a positive correlation between COL4A1 expression levels and TEC signatures suggests that COL4A1 may be involved in angiogenesis, which is a critical step in tumor progression.
T cells and macrophages are regulators of tumor immunity. Among them, Treg, M2 macrophages, and TAMs suppress immunity and stimulate tumor progression [97,98,99]. In our study, COL4A1 expression levels showed strong correlations with the levels of infiltrated Tregs, TAMs, and M2 macrophages as well as immunosuppressive cytokine expression levels (Figure 4, Figure 5 and Figure 6, Figure S4 and Table 1). High infiltration of Tregs, TAMs, and M2 macrophages is associated with poor prognosis in patients with cancer [100,101,102]. Interestingly, COL4A1 expression is highly correlated with T cell exhaustion makers including PDCD1, CTLA4, LAG3, and HAVCR2, which are immune checkpoint targets of immunotherapy. However, the immunological roles of COL4A1 and its relevance to immune cells in tumors have not yet been explored. Therefore, this study indicates the potential relationship between COL4A1, which is overexpressed in the TME, and cancer immunity.
We found a higher correlation of COL4A1 expression with the expression levels of mesenchymal signature genes than epithelial signature genes (Figure S5). However, this correlation cannot imply that elevated expression of COL4A1 enhances poor prognosis by promoting the epithelial-to-mesenchymal transition of tumor cells because these results may reflect altered expression patterns of COL4A1 in mesenchymal origin cells like fibroblasts and endothelial cells in TME, rather in the malignant cells. Indeed, the single-cell RNA-sequencing analysis shown in Figure S3 demonstrated that the COL4A1 is dominantly expressed in fibroblasts and endothelial cells, but not in the malignant cells of LGG, PAAD, and SKCM TME.
Expression of COL4A2 is highly correlated with that of COL4A1 in all types of cancers in TIMER2 analysis and exclusively expressed in stromal cells like COL4A1 in single-cell sequencing data (data not shown). However, other members of Col IV did not show a redundant expression pattern with COL4A1 (data not shown). The COL4A1 and the COL4A2 genes are located adjacently in the head-to-head position and share a bidirectional promoter in chromosome 13 [103]. The coordinated expression driven by the shared promoter could provide proper amounts of COL4A1 and COL4A2 to form a functional 1-1-2 triplex helix. Therefore, it would be intriguing to examine that our results with COL4A1 may be applied equally to COL4A2.
Although our data clearly show the relevance of COL4A1 expression and immunosuppressive TME in LGG, PAAD, SKCM, and STAD, there are several limitations to our study. First, our analysis used only publicly available transcriptional data from the TCGA database, microarray-based datasets, and single-cell sequencing databases. Second, our analysis was based only on the mRNA expression levels of COL4A1; therefore, further studies should be conducted to elucidate the underlying molecular mechanisms. The noncollagenous 1 domain of COL4A1 binds to α1β1 integrin and subsequently regulates the FAK/c-Raf/MEK/ERK1/2/p38 MAPK in endothelial cells [104]. However, although this study revealed that COL4A1 expression affects macrophage differentiation in TME, the downstream nor COL4A1 receptors of the myeloid cells have not been reported and remain to be explored. Moreover, to confirm the role of COL4A1 expression in immune infiltration into the TME during tumor growth, further in vitro and in vivo studies should be conducted in the future.
Overall, the results of our study suggest that COL4A1 overexpression in stromal cells may function as a potential regulator of the tumor-supporting TME composition associated with the poor prognosis of patients with LGG, PAAD, SKCM, and STAD.

Supplementary Materials

The following are available online at https://www.mdpi.com/article/10.3390/jpm12040534/s1, Figure S1: Overall patient survival according to the expression levels of collagen type IV alpha chain 1 (COL4A1) in diffuse large B-cell lymphoma (DLBC), esophageal carcinoma (ESCA), glioblastoma multiforme (GBM), head and neck squamous cell carcinoma (HNSC), kidney renal clear cell carcinoma (KIRC), liver hepatocellular carcinoma (LIHC), testicular germ cell tumors (TGCT), and thymoma (THYM); Figure S2: Kaplan–Meier survival curves of patient groups with high and low COL4A1 expression levels retrieved from the R2 platform; Figure S3: Single cell RNA-sequencing analysis of COL4A1 gene in TME cells of LGG, PAAD, SKCM, and STAD; Figure S4: The correlation between polarized macrophage-related genes with COL4A1 expression in LGG, PAAD, SKCM, and STAD; Figure S5: The correlation between EMT signature genes with COL4A1 expression in LGG, PAAD, SKCM, and STAD; Table S1: List of The Cancer Genome Atlas (TCGA) abbreviations for different types of cancer; Table S2: Correlation analyses among the expression levels of collagen type IV alpha chain 1 (COL4A1) and related marker genes of T, B, monocytes, natural killer (NK), dendritic, Th2, Tfh, Th17, and exhausted T cells in low-grade glioma (LGG), pancreatic adenocarcinoma (PAAD), skin cutaneous melanoma (SKCM), and stomach adenocarcinoma (STAD)-TCGA datasets using the Tumor Immune Estimation Resource (TIMER) web tool; Table S3: Correlation analyses among the expression levels of COL4A1 and related marker genes of the tumor microenvironment (TME) immune cells of four tumor groups from different origins using the R2 tool.

Author Contributions

Conceptualization, M.G. and I.-S.L.; methodology, H.-J.S.; validation, M.G.; formal analysis, M.G. and I.-S.L.; investigation, M.G., H.-J.S. and I.-S.L.; data curation, M.G. and I.-S.L.; writing—original draft preparation, H.-J.S.; writing—review & editing, M.G. and I.-S.L.; supervision, M.G. and I.-S.L.; project administration, M.G.; funding acquisition, M.G. and I.-S.L. All authors have read and agreed to the published version of the manuscript.

Funding

This research was supported by the Basic Science Research Program through the National Research Foundation of Korea (NRF) funded by the Ministry of Education, Science, and Technology (NRF-2020R1I1A1A01071652 for M.G.; NRF-2018R1D1A1B07050206 for I.-S.L.).

Institutional Review Board Statement

Not applicable.

Informed Consent Statement

Not applicable.

Data Availability Statement

The data presented in this study are available upon request from the corresponding authors.

Conflicts of Interest

The authors declare no conflict of interest.

References

  1. Ricard-Blum, S. The collagen family. Cold Spring Harb. Perspect. Biol. 2011, 3, a004978. [Google Scholar] [CrossRef] [PubMed] [Green Version]
  2. Alamowitch, S.; Plaisier, E.; Favrole, P.; Prost, C.; Chen, Z.; Van Agtmael, T.; Marro, B.; Ronco, P. Cerebrovascular disease related to COL4A1 mutations in HANAC syndrome. Neurology 2009, 73, 1873–1882. [Google Scholar] [CrossRef] [PubMed] [Green Version]
  3. Meuwissen, M.E.; Halley, D.J.; Smit, L.S.; Lequin, M.H.; Cobben, J.M.; de Coo, R.; van Harssel, J.; Sallevelt, S.; Woldringh, G.; van der Knaap, M.S.; et al. The expanding phenotype of COL4A1 and COL4A2 mutations: Clinical data on 13 newly identified families and a review of the literature. Genet. Med. 2015, 17, 843–853. [Google Scholar] [CrossRef] [Green Version]
  4. Kitzler, T.M.; Schneider, R.; Kohl, S.; Kolvenbach, C.M.; Connaughton, D.M.; Dai, R.; Mann, N.; Nakayama, M.; Majmundar, A.J.; Wu, C.W.; et al. COL4A1 mutations as a potential novel cause of autosomal dominant CAKUT in humans. Hum. Genet. 2019, 138, 1105–1115. [Google Scholar] [CrossRef] [PubMed]
  5. Khoshnoodi, J.; Pedchenko, V.; Hudson, B.G. Mammalian collagen IV. Microsc. Res. Tech. 2008, 71, 357–370. [Google Scholar] [CrossRef] [PubMed] [Green Version]
  6. Liu, Y.; Zhang, J.; Chen, Y.; Sohel, H.; Ke, X.; Chen, J.; Li, Y.X. The correlation and role analysis of COL4A1 and COL4A2 in hepatocarcinogenesis. Aging (Albany NY) 2020, 12, 204–223. [Google Scholar] [CrossRef]
  7. Wang, T.; Jin, H.; Hu, J.; Li, X.; Ruan, H.; Xu, H.; Wei, L.; Dong, W.; Teng, F.; Gu, J.; et al. COL4A1 promotes the growth and metastasis of hepatocellular carcinoma cells by activating FAK-Src signaling. J. Exp. Clin. Cancer Res. 2020, 39, 148. [Google Scholar] [CrossRef]
  8. Jin, R.; Shen, J.; Zhang, T.; Liu, Q.; Liao, C.; Ma, H.; Li, S.; Yu, Z. The highly expressed COL4A1 genes contributes to the proliferation and migration of the invasive ductal carcinomas. Oncotarget 2017, 8, 58172–58183. [Google Scholar] [CrossRef] [Green Version]
  9. Miyake, M.; Hori, S.; Morizawa, Y.; Tatsumi, Y.; Toritsuka, M.; Ohnishi, S.; Shimada, K.; Furuya, H.; Khadka, V.S.; Deng, Y.; et al. Collagen type IV alpha 1 (COL4A1) and collagen type XIII alpha 1 (COL13A1) produced in cancer cells promote tumor budding at the invasion front in human urothelial carcinoma of the bladder. Oncotarget 2017, 8, 36099–36114. [Google Scholar] [CrossRef] [Green Version]
  10. Zhang, H.; Teng, X.; Liu, Z.; Zhang, L.; Liu, Z. Gene expression profile analyze the molecular mechanism of CXCR7 regulating papillary thyroid carcinoma growth and metastasis. J. Exp. Clin. Cancer Res. 2015, 34, 16. [Google Scholar] [CrossRef] [Green Version]
  11. Zhang, Q.N.; Zhu, H.L.; Xia, M.T.; Liao, J.; Huang, X.T.; Xiao, J.W.; Yuan, C. A panel of collagen genes are associated with prognosis of patients with gastric cancer and regulated by microRNA-29c-3p: An integrated bioinformatics analysis and experimental validation. Cancer Manag. Res. 2019, 11, 4757–4772. [Google Scholar] [CrossRef] [PubMed] [Green Version]
  12. Li, F.; Wang, N.N.; Chang, X.; Wang, S.L.; Wang, L.S.; Yao, J.; Li, Z.S.; Bai, Y. Bioinformatics analysis suggests that COL4A1 may play an important role in gastric carcinoma recurrence. J. Dig. Dis. 2019, 20, 391–400. [Google Scholar] [CrossRef] [PubMed]
  13. Huang, R.; Gu, W.; Sun, B.; Gao, L. Identification of COL4A1 as a potential gene conferring trastuzumab resistance in gastric cancer based on bioinformatics analysis. Mol. Med. Rep. 2018, 17, 6387–6396. [Google Scholar] [CrossRef]
  14. Yin, W.; Zhu, H.; Tan, J.; Xin, Z.; Zhou, Q.; Cao, Y.; Wu, Z.; Wang, L.; Zhao, M.; Jiang, X.; et al. Identification of collagen genes related to immune infiltration and epithelial-mesenchymal transition in glioma. Cancer Cell Int. 2021, 21, 276. [Google Scholar] [CrossRef] [PubMed]
  15. Giraldo, N.A.; Sanchez-Salas, R.; Peske, J.D.; Vano, Y.; Becht, E.; Petitprez, F.; Validire, P.; Ingels, A.; Cathelineau, X.; Fridman, W.H.; et al. The clinical role of the TME in solid cancer. Br. J. Cancer 2019, 120, 45–53. [Google Scholar] [CrossRef]
  16. Wang, M.; Zhao, J.; Zhang, L.; Wei, F.; Lian, Y.; Wu, Y.; Gong, Z.; Zhang, S.; Zhou, J.; Cao, K.; et al. Role of tumor microenvironment in tumorigenesis. J. Cancer 2017, 8, 761–773. [Google Scholar] [CrossRef]
  17. Quail, D.F.; Joyce, J.A. Microenvironmental regulation of tumor progression and metastasis. Nat. Med. 2013, 19, 1423–1437. [Google Scholar] [CrossRef]
  18. Jahanban-Esfahlan, R.; Seidi, K.; Banimohamad-Shotorbani, B.; Jahanban-Esfahlan, A.; Yousefi, B. Combination of nanotechnology with vascular targeting agents for effective cancer therapy. J. Cell Physiol. 2018, 233, 2982–2992. [Google Scholar] [CrossRef]
  19. Jahanban-Esfahlan, R.; Seidi, K.; Zarghami, N. Tumor vascular infarction: Prospects and challenges. Int. J. Hematol. 2017, 105, 244–256. [Google Scholar] [CrossRef]
  20. Sica, A.; Larghi, P.; Mancino, A.; Rubino, L.; Porrta, C.; Totaro, M.G.; Rimoldi, M.; Biswas, S.K.; Allavena, P.; Mantovani, A. Macrophage polarization in tumour progression. Semin. Cancer Biol. 2008, 18, 349–355. [Google Scholar] [CrossRef]
  21. Mantovani, A.; Marchesi, F.; Malesci, A.; Laghi, L.; Allavena, P. Tumour-associated macrophages as treatment targets in oncology. Nat. Rev. Clin. Oncol. 2017, 14, 399–416. [Google Scholar] [CrossRef] [PubMed]
  22. Mantovani, A.; Sica, A.; Locati, M. Macrophage polarization comes of age. Immunity 2005, 23, 344–346. [Google Scholar] [CrossRef] [PubMed] [Green Version]
  23. Mantovani, A.; Sica, A.; Sozzani, S.; Allavena, P.; Vecchi, A.; Locati, M. The chemokine system in diverse forms of macrophage activation and polarization. Trends Immunol. 2004, 25, 677–686. [Google Scholar] [CrossRef] [PubMed]
  24. Mosmann, T.R.; Cherwinski, H.; Bond, M.W.; Giedlin, M.A.; Coffman, R.L. Two types of murine helper T cell clone. I. Definition according to profiles of lymphokine activities and secreted proteins. J. Immunol. 1986, 136, 2348–2357. [Google Scholar]
  25. Gordon, S.; Taylor, P.R. Monocyte and macrophage heterogeneity. Nat. Rev. Immunol. 2005, 5, 953–964. [Google Scholar] [CrossRef]
  26. Mantovani, A.; Sozzani, S.; Locati, M.; Allavena, P.; Sica, A. Macrophage polarization: Tumor-associated macrophages as a paradigm for polarized M2 mononuclear phagocytes. Trends Immunol. 2002, 23, 549–555. [Google Scholar] [CrossRef]
  27. Gonzalez, H.; Hagerling, C.; Werb, Z. Roles of the immune system in cancer: From tumor initiation to metastatic progression. Genes Dev. 2018, 32, 1267–1284. [Google Scholar] [CrossRef] [Green Version]
  28. Maimela, N.R.; Liu, S.; Zhang, Y. Fates of CD8+ T cells in Tumor Microenvironment. Comput. Struct. Biotechnol. J. 2019, 17, 1–13. [Google Scholar] [CrossRef]
  29. Noy, R.; Pollard, J.W. Tumor-associated macrophages: From mechanisms to therapy. Immunity 2014, 41, 49–61. [Google Scholar] [CrossRef] [Green Version]
  30. Chang, L.Y.; Lin, Y.C.; Mahalingam, J.; Huang, C.T.; Chen, T.W.; Kang, C.W.; Peng, H.M.; Chu, Y.Y.; Chiang, J.M.; Dutta, A.; et al. Tumor-derived chemokine CCL5 enhances TGF-beta-mediated killing of CD8(+) T cells in colon cancer by T-regulatory cells. Cancer Res. 2012, 72, 1092–1102. [Google Scholar] [CrossRef] [Green Version]
  31. Roland, C.L.; Lynn, K.D.; Toombs, J.E.; Dineen, S.P.; Udugamasooriya, D.G.; Brekken, R.A. Cytokine levels correlate with immune cell infiltration after anti-VEGF therapy in preclinical mouse models of breast cancer. PLoS ONE 2009, 4, e7669. [Google Scholar] [CrossRef] [PubMed]
  32. Smyth, M.J.; Dunn, G.P.; Schreiber, R.D. Cancer immunosurveillance and immunoediting: The roles of immunity in suppressing tumor development and shaping tumor immunogenicity. Adv. Immunol. 2006, 90, 1–50. [Google Scholar] [CrossRef] [PubMed]
  33. Liu, T.; Han, C.; Wang, S.; Fang, P.; Ma, Z.; Xu, L.; Yin, R. Cancer-associated fibroblasts: An emerging target of anti-cancer immunotherapy. J. Hematol. Oncol. 2019, 12, 86. [Google Scholar] [CrossRef] [PubMed]
  34. Goveia, J.; Rohlenova, K.; Taverna, F.; Treps, L.; Conradi, L.C.; Pircher, A.; Geldhof, V.; de Rooij, L.; Kalucka, J.; Sokol, L.; et al. An Integrated Gene Expression Landscape Profiling Approach to Identify Lung Tumor Endothelial Cell Heterogeneity and Angiogenic Candidates. Cancer Cell 2020, 37, 21–36.e13. [Google Scholar] [CrossRef]
  35. Tang, Z.; Li, C.; Kang, B.; Gao, G.; Li, C.; Zhang, Z. GEPIA: A web server for cancer and normal gene expression profiling and interactive analyses. Nucleic Acids Res. 2017, 45, W98–W102. [Google Scholar] [CrossRef] [Green Version]
  36. Shin, H.J.; Lee, K.J.; Gil, M. Multiomic Analysis of Cereblon Expression and Its Prognostic Value in Kidney Renal Clear Cell Carcinoma, Lung Adenocarcinoma, and Skin Cutaneous Melanoma. J. Pers. Med. 2021, 11, 263. [Google Scholar] [CrossRef]
  37. Park, S.J.; Yoon, B.H.; Kim, S.K.; Kim, S.Y. GENT2: An updated gene expression database for normal and tumor tissues. BMC Med. Genomics 2019, 12, 101. [Google Scholar] [CrossRef]
  38. Pak, K.; Oh, S.O.; Goh, T.S.; Heo, H.J.; Han, M.E.; Jeong, D.C.; Lee, C.S.; Sun, H.; Kang, J.; Choi, S.; et al. A User-Friendly, Web-Based Integrative Tool (ESurv) for Survival Analysis: Development and Validation Study. J. Med. Internet Res. 2020, 22, e16084. [Google Scholar] [CrossRef]
  39. Koster, J.; Volckmann, R.; Zwijnenburg, D.; Molenaar, P.; Versteeg, R. Abstract 2490: R2: Genomics analysis and visualization platform. Cancer Res. 2019, 79, 2490. [Google Scholar] [CrossRef]
  40. Tirosh, I.; Izar, B.; Prakadan, S.M.; Wadsworth, M.H., 2nd; Treacy, D.; Trombetta, J.J.; Rotem, A.; Rodman, C.; Lian, C.; Murphy, G.; et al. Dissecting the multicellular ecosystem of metastatic melanoma by single-cell RNA-seq. Science 2016, 352, 189–196. [Google Scholar] [CrossRef] [Green Version]
  41. Yuan, J.; Levitin, H.M.; Frattini, V.; Bush, E.C.; Boyett, D.M.; Samanamud, J.; Ceccarelli, M.; Dovas, A.; Zanazzi, G.; Canoll, P.; et al. Single-cell transcriptome analysis of lineage diversity in high-grade glioma. Genome Med. 2018, 10, 57. [Google Scholar] [CrossRef] [PubMed] [Green Version]
  42. Peng, J.; Sun, B.F.; Chen, C.Y.; Zhou, J.Y.; Chen, Y.S.; Chen, H.; Liu, L.; Huang, D.; Jiang, J.; Cui, G.S.; et al. Single-cell RNA-seq highlights intra-tumoral heterogeneity and malignant progression in pancreatic ductal adenocarcinoma. Cell Res. 2019, 29, 725–738. [Google Scholar] [CrossRef] [PubMed]
  43. Zhang, P.; Yang, M.; Zhang, Y.; Xiao, S.; Lai, X.; Tan, A.; Du, S.; Li, S. Dissecting the Single-Cell Transcriptome Network Underlying Gastric Premalignant Lesions and Early Gastric Cancer. Cell Rep. 2019, 27, 1934–1947.e1935. [Google Scholar] [CrossRef] [PubMed] [Green Version]
  44. Li, T.; Fu, J.; Zeng, Z.; Cohen, D.; Li, J.; Chen, Q.; Li, B.; Liu, X.S. TIMER2.0 for analysis of tumor-infiltrating immune cells. Nucleic Acids Res. 2020, 48, W509–W514. [Google Scholar] [CrossRef] [PubMed]
  45. Li, T.; Fan, J.; Wang, B.; Traugh, N.; Chen, Q.; Liu, J.S.; Li, B.; Liu, X.S. TIMER: A Web Server for Comprehensive Analysis of Tumor-Infiltrating Immune Cells. Cancer Res. 2017, 77, e108–e110. [Google Scholar] [CrossRef] [PubMed] [Green Version]
  46. Li, B.; Severson, E.; Pignon, J.C.; Zhao, H.; Li, T.; Novak, J.; Jiang, P.; Shen, H.; Aster, J.C.; Rodig, S.; et al. Comprehensive analyses of tumor immunity: Implications for cancer immunotherapy. Genome Biol. 2016, 17, 174. [Google Scholar] [CrossRef] [Green Version]
  47. Kang, J.Y.; Gil, M.; Kim, K.E. Neuropilin1 Expression Acts as a Prognostic Marker in Stomach Adenocarcinoma by Predicting the Infiltration of Treg Cells and M2 Macrophages. J. Clin. Med. 2020, 9, 1430. [Google Scholar] [CrossRef]
  48. Pan, J.H.; Zhou, H.; Cooper, L.; Huang, J.L.; Zhu, S.B.; Zhao, X.X.; Ding, H.; Pan, Y.L.; Rong, L. LAYN Is a Prognostic Biomarker and Correlated With Immune Infiltrates in Gastric and Colon Cancers. Front. Immunol. 2019, 10, 6. [Google Scholar] [CrossRef] [Green Version]
  49. Zhang, Y.; You, W.H.; Li, X.; Wang, P.; Sha, B.; Liang, Y.; Qiu, J.; Zhou, J.; Hu, H.; Lu, L. Single-cell RNA-seq reveals transcriptional landscape and intratumor heterogenicity in gallbladder cancer liver metastasis microenvironment. Ann. Transl. Med. 2021, 9, 889. [Google Scholar] [CrossRef]
  50. Zhang, Y.; Song, J.; Zhao, Z.; Yang, M.; Chen, M.; Liu, C.; Ji, J.; Zhu, D. Single-cell transcriptome analysis reveals tumor immune microenvironment heterogenicity and granulocytes enrichment in colorectal cancer liver metastases. Cancer Lett. 2020, 470, 84–94. [Google Scholar] [CrossRef]
  51. Ling, B.; Huang, Z.; Huang, S.; Qian, L.; Li, G.; Tang, Q. Microenvironment Analysis of Prognosis and Molecular Signature of Immune-Related Genes in Lung Adenocarcinoma. Oncol Res. 2021, 28, 561–578. [Google Scholar] [CrossRef] [PubMed]
  52. Baghban, R.; Roshangar, L.; Jahanban-Esfahlan, R.; Seidi, K.; Ebrahimi-Kalan, A.; Jaymand, M.; Kolahian, S.; Javaheri, T.; Zare, P. Tumor microenvironment complexity and therapeutic implications at a glance. Cell Commun. Signal. 2020, 18, 59. [Google Scholar] [CrossRef] [PubMed] [Green Version]
  53. Zhang, D.; He, W.; Wu, C.; Tan, Y.; He, Y.; Xu, B.; Chen, L.; Li, Q.; Jiang, J. Scoring System for Tumor-Infiltrating Lymphocytes and Its Prognostic Value for Gastric Cancer. Front. Immunol. 2019, 10, 71. [Google Scholar] [CrossRef] [PubMed] [Green Version]
  54. Orecchioni, M.; Ghosheh, Y.; Pramod, A.B.; Ley, K. Macrophage Polarization: Different Gene Signatures in M1(LPS+) vs. Classically and M2(LPS-) vs. Alternatively Activated Macrophages. Front. Immunol. 2019, 10, 1084. [Google Scholar] [CrossRef] [PubMed]
  55. Furusato, E.; Shen, D.; Cao, X.; Furusato, B.; Nussenblatt, R.B.; Rushing, E.J.; Chan, C.C. Inflammatory cytokine and chemokine expression in sympathetic ophthalmia: A pilot study. Histol. Histopathol. 2011, 26, 1145–1151. [Google Scholar] [CrossRef]
  56. Yu, T.; Gan, S.; Zhu, Q.; Dai, D.; Li, N.; Wang, H.; Chen, X.; Hou, D.; Wang, Y.; Pan, Q.; et al. Modulation of M2 macrophage polarization by the crosstalk between Stat6 and Trim24. Nat. Commun. 2019, 10, 4353. [Google Scholar] [CrossRef] [Green Version]
  57. Mauer, J.; Chaurasia, B.; Goldau, J.; Vogt, M.C.; Ruud, J.; Nguyen, K.D.; Theurich, S.; Hausen, A.C.; Schmitz, J.; Bronneke, H.S.; et al. Signaling by IL-6 promotes alternative activation of macrophages to limit endotoxemia and obesity-associated resistance to insulin. Nat. Immunol. 2014, 15, 423–430. [Google Scholar] [CrossRef]
  58. Zhao, Z.; Cheng, X.; Wang, Y.; Han, R.; Li, L.; Xiang, T.; He, L.; Long, H.; Zhu, B.; He, Y. Metformin inhibits the IL-6-induced epithelial-mesenchymal transition and lung adenocarcinoma growth and metastasis. PLoS ONE 2014, 9, e95884. [Google Scholar] [CrossRef] [Green Version]
  59. Curl, D.D.; Antovich, T.J. Addressing the issue of cataloging and making chiropractic literature accessible: Part I. Defining the problem. J. Manip. Physiol. Ther. 1991, 14, 79–85. [Google Scholar]
  60. Sheikhpour, E.; Noorbakhsh, P.; Foroughi, E.; Farahnak, S.; Nasiri, R.; Neamatzadeh, H. A Survey on the Role of Interleukin-10 in Breast Cancer: A Narrative. Rep. Biochem. Mol. Biol. 2018, 7, 30–37. [Google Scholar]
  61. Sica, A.; Saccani, A.; Bottazzi, B.; Polentarutti, N.; Vecchi, A.; van Damme, J.; Mantovani, A. Autocrine production of IL-10 mediates defective IL-12 production and NF-kappa B activation in tumor-associated macrophages. J. Immunol. 2000, 164, 762–767. [Google Scholar] [CrossRef] [PubMed]
  62. Massague, J. TGFbeta signalling in context. Nat. Rev. Mol. Cell Biol. 2012, 13, 616–630. [Google Scholar] [CrossRef] [PubMed]
  63. Collison, L.W.; Chaturvedi, V.; Henderson, A.L.; Giacomin, P.R.; Guy, C.; Bankoti, J.; Finkelstein, D.; Forbes, K.; Workman, C.J.; Brown, S.A.; et al. IL-35-mediated induction of a potent regulatory T cell population. Nat. Immunol. 2010, 11, 1093–1101. [Google Scholar] [CrossRef] [PubMed] [Green Version]
  64. Collison, L.W.; Workman, C.J.; Kuo, T.T.; Boyd, K.; Wang, Y.; Vignali, K.M.; Cross, R.; Sehy, D.; Blumberg, R.S.; Vignali, D.A. The inhibitory cytokine IL-35 contributes to regulatory T-cell function. Nature 2007, 450, 566–569. [Google Scholar] [CrossRef]
  65. Niedbala, W.; Wei, X.Q.; Cai, B.; Hueber, A.J.; Leung, B.P.; McInnes, I.B.; Liew, F.Y. IL-35 is a novel cytokine with therapeutic effects against collagen-induced arthritis through the expansion of regulatory T cells and suppression of Th17 cells. Eur. J. Immunol. 2007, 37, 3021–3029. [Google Scholar] [CrossRef]
  66. Pyonteck, S.M.; Akkari, L.; Schuhmacher, A.J.; Bowman, R.L.; Sevenich, L.; Quail, D.F.; Olson, O.C.; Quick, M.L.; Huse, J.T.; Teijeiro, V.; et al. CSF-1R inhibition alters macrophage polarization and blocks glioma progression. Nat. Med. 2013, 19, 1264–1272. [Google Scholar] [CrossRef] [Green Version]
  67. Jiang, J.; Liu, X. Upregulated EBI3 Correlates with Poor Outcome and Tumor Progression in Breast Cancer. Oncol. Res. Treat. 2018, 41, 111–115. [Google Scholar] [CrossRef]
  68. Peng, L.; Yuan, X.Q.; Zhang, C.Y.; Ye, F.; Zhou, H.F.; Li, W.L.; Liu, Z.Y.; Zhang, Y.Q.; Pan, X.; Li, G.C. High TGF-beta1 expression predicts poor disease prognosis in hepatocellular carcinoma patients. Oncotarget 2017, 8, 34387–34397. [Google Scholar] [CrossRef] [Green Version]
  69. Liu, H.; Zhang, H.; Shen, Z.; Lin, C.; Wang, X.; Qin, J.; Qin, X.; Xu, J.; Sun, Y. Increased Expression of CSF-1 Associates With Poor Prognosis of Patients With Gastric Cancer Undergoing Gastrectomy. Medicine 2016, 95, e2675. [Google Scholar] [CrossRef]
  70. Li, Y.; Gao, P.; Yang, J.; Yu, H.; Zhu, Y.; Si, W. Relationship between IL-10 expression and prognosis in patients with primary breast cancer. Tumour Biol. 2014, 35, 11533–11540. [Google Scholar] [CrossRef]
  71. Serrano-Gomez, S.J.; Maziveyi, M.; Alahari, S.K. Regulation of epithelial-mesenchymal transition through epigenetic and post-translational modifications. Mol. Cancer 2016, 15, 18. [Google Scholar] [CrossRef] [PubMed] [Green Version]
  72. Global Burden of Disease Cancer Collaboration; Fitzmaurice, C.; Abate, D.; Abbasi, N.; Abbastabar, H.; Abd-Allah, F.; Abdel-Rahman, O.; Abdelalim, A.; Abdoli, A.; Abdollahpour, I.; et al. Global, Regional, and National Cancer Incidence, Mortality, Years of Life Lost, Years Lived With Disability, and Disability-Adjusted Life-Years for 29 Cancer Groups, 1990 to 2017: A Systematic Analysis for the Global Burden of Disease Study. JAMA Oncol. 2019, 5, 1749–1768. [Google Scholar] [CrossRef] [PubMed] [Green Version]
  73. Cao, H.; Cheng, L.; Yu, J.; Zhang, Z.; Luo, Z.; Chen, D. Identifying the mRNAs associated with Bladder cancer recurrence. Cancer Biomark. 2020, 28, 429–437. [Google Scholar] [CrossRef] [PubMed]
  74. Jones, D.T.W.; Bandopadhayay, P.; Jabado, N. The Power of Human Cancer Genetics as Revealed by Low-Grade Gliomas. Annu. Rev. Genet. 2019, 53, 483–503. [Google Scholar] [CrossRef] [PubMed]
  75. Kumthekar, P.; Raizer, J.; Singh, S. Low-grade glioma. Cancer Treat. Res. 2015, 163, 75–87. [Google Scholar] [CrossRef] [PubMed]
  76. Vareedayah, A.A.; Alkaade, S.; Taylor, J.R. Pancreatic Adenocarcinoma. Mo. Med. 2018, 115, 230–235. [Google Scholar]
  77. Ryan, D.P.; Hong, T.S.; Bardeesy, N. Pancreatic adenocarcinoma. N. Engl. J. Med. 2014, 371, 1039–1049. [Google Scholar] [CrossRef]
  78. Lodde, G.; Zimmer, L.; Livingstone, E.; Schadendorf, D.; Ugurel, S. [Malignant melanoma]. Hautarzt 2020, 71, 63–77. [Google Scholar] [CrossRef]
  79. Whiteman, D.C.; Green, A.C.; Olsen, C.M. The Growing Burden of Invasive Melanoma: Projections of Incidence Rates and Numbers of New Cases in Six Susceptible Populations through 2031. J. Investig. Dermatol. 2016, 136, 1161–1171. [Google Scholar] [CrossRef] [Green Version]
  80. Bray, F.; Ferlay, J.; Soerjomataram, I.; Siegel, R.L.; Torre, L.A.; Jemal, A. Global cancer statistics 2018: GLOBOCAN estimates of incidence and mortality worldwide for 36 cancers in 185 countries. CA Cancer J. Clin. 2018, 68, 394–424. [Google Scholar] [CrossRef] [Green Version]
  81. Claus, E.B.; Walsh, K.M.; Wiencke, J.K.; Molinaro, A.M.; Wiemels, J.L.; Schildkraut, J.M.; Bondy, M.L.; Berger, M.; Jenkins, R.; Wrensch, M. Survival and low-grade glioma: The emergence of genetic information. Neurosurg. Focus 2015, 38, E6. [Google Scholar] [CrossRef] [PubMed]
  82. Elyada, E.; Bolisetty, M.; Laise, P.; Flynn, W.F.; Courtois, E.T.; Burkhart, R.A.; Teinor, J.A.; Belleau, P.; Biffi, G.; Lucito, M.S.; et al. Cross-Species Single-Cell Analysis of Pancreatic Ductal Adenocarcinoma Reveals Antigen-Presenting Cancer-Associated Fibroblasts. Cancer Discov. 2019, 9, 1102–1123. [Google Scholar] [CrossRef] [PubMed] [Green Version]
  83. Barrett, R.L.; Pure, E. Cancer-associated fibroblasts and their influence on tumor immunity and immunotherapy. Elife 2020, 9, e57243. [Google Scholar] [CrossRef]
  84. Truffi, M.; Mazzucchelli, S.; Bonizzi, A.; Sorrentino, L.; Allevi, R.; Vanna, R.; Morasso, C.; Corsi, F. Nano-Strategies to Target Breast Cancer-Associated Fibroblasts: Rearranging the Tumor Microenvironment to Achieve Antitumor Efficacy. Int. J. Mol. Sci. 2019, 20, 1263. [Google Scholar] [CrossRef] [Green Version]
  85. Ziani, L.; Chouaib, S.; Thiery, J. Alteration of the Antitumor Immune Response by Cancer-Associated Fibroblasts. Front. Immunol. 2018, 9, 414. [Google Scholar] [CrossRef] [PubMed]
  86. Takahashi, H.; Sakakura, K.; Kudo, T.; Toyoda, M.; Kaira, K.; Oyama, T.; Chikamatsu, K. Cancer-associated fibroblasts promote an immunosuppressive microenvironment through the induction and accumulation of protumoral macrophages. Oncotarget 2017, 8, 8633–8647. [Google Scholar] [CrossRef] [Green Version]
  87. Kato, T.; Noma, K.; Ohara, T.; Kashima, H.; Katsura, Y.; Sato, H.; Komoto, S.; Katsube, R.; Ninomiya, T.; Tazawa, H.; et al. Cancer-Associated Fibroblasts Affect Intratumoral CD8(+) and FoxP3(+) T Cells Via IL6 in the Tumor Microenvironment. Clin. Cancer Res. 2018, 24, 4820–4833. [Google Scholar] [CrossRef] [Green Version]
  88. Kinoshita, T.; Ishii, G.; Hiraoka, N.; Hirayama, S.; Yamauchi, C.; Aokage, K.; Hishida, T.; Yoshida, J.; Nagai, K.; Ochiai, A. Forkhead box P3 regulatory T cells coexisting with cancer associated fibroblasts are correlated with a poor outcome in lung adenocarcinoma. Cancer Sci. 2013, 104, 409–415. [Google Scholar] [CrossRef]
  89. Bassani, B.; Baci, D.; Gallazzi, M.; Poggi, A.; Bruno, A.; Mortara, L. Natural Killer Cells as Key Players of Tumor Progression and Angiogenesis: Old and Novel Tools to Divert Their Pro-Tumor Activities into Potent Anti-Tumor Effects. Cancers 2019, 11, 461. [Google Scholar] [CrossRef] [Green Version]
  90. Sobierajska, K.; Ciszewski, W.M.; Sacewicz-Hofman, I.; Niewiarowska, J. Endothelial Cells in the Tumor Microenvironment. Adv. Exp. Med. Biol. 2020, 1234, 71–86. [Google Scholar] [CrossRef]
  91. Maishi, N.; Hida, K. Tumor endothelial cells accelerate tumor metastasis. Cancer Sci. 2017, 108, 1921–1926. [Google Scholar] [CrossRef] [PubMed] [Green Version]
  92. Folkman, J. Tumor angiogenesis: Therapeutic implications. N. Engl. J. Med. 1971, 285, 1182–1186. [Google Scholar] [CrossRef] [PubMed]
  93. Schaaf, M.B.; Garg, A.D.; Agostinis, P. Defining the role of the tumor vasculature in antitumor immunity and immunotherapy. Cell Death Dis. 2018, 9, 115. [Google Scholar] [CrossRef] [PubMed] [Green Version]
  94. Hudson, B.G.; Tryggvason, K.; Sundaramoorthy, M.; Neilson, E.G. Alport's syndrome, Goodpasture's syndrome, and type IV collagen. N. Engl. J. Med. 2003, 348, 2543–2556. [Google Scholar] [CrossRef]
  95. Craft, P.S.; Harris, A.L. Clinical prognostic significance of tumour angiogenesis. Ann. Oncol. 1994, 5, 305–311. [Google Scholar] [CrossRef]
  96. Solimando, A.G.; Summa, S.; Vacca, A.; Ribatti, D. Cancer-Associated Angiogenesis: The Endothelial Cell as a Checkpoint for Immunological Patrolling. Cancers 2020, 12, 3380. [Google Scholar] [CrossRef] [PubMed]
  97. Ohue, Y.; Nishikawa, H. Regulatory T (Treg) cells in cancer: Can Treg cells be a new therapeutic target? Cancer Sci. 2019, 110, 2080–2089. [Google Scholar] [CrossRef]
  98. Najafi, M.; Hashemi Goradel, N.; Farhood, B.; Salehi, E.; Nashtaei, M.S.; Khanlarkhani, N.; Khezri, Z.; Majidpoor, J.; Abouzaripour, M.; Habibi, M.; et al. Macroph.hage polarity in cancer: A review. J. Cell Biochem. 2019, 120, 2756–2765. [Google Scholar] [CrossRef]
  99. Chanmee, T.; Ontong, P.; Konno, K.; Itano, N. Tumor-associated macrophages as major players in the tumor microenvironment. Cancers 2014, 6, 1670–1690. [Google Scholar] [CrossRef] [Green Version]
  100. Xue, Y.; Tong, L.; LiuAnwei Liu, F.; Liu, A.; Zeng, S.; Xiong, Q.; Yang, Z.; He, X.; Sun, Y.; Xu, C. Tumorinfiltrating M2 macrophages driven by specific genomic alterations are associated with prognosis in bladder cancer. Oncol. Rep. 2019, 42, 581–594. [Google Scholar] [CrossRef]
  101. Zhao, X.; Qu, J.; Sun, Y.; Wang, J.; Liu, X.; Wang, F.; Zhang, H.; Wang, W.; Ma, X.; Gao, X.; et al. Prognostic significance of tumor-associated macrophages in breast cancer: A meta-analysis of the literature. Oncotarget 2017, 8, 30576–30586. [Google Scholar] [CrossRef] [PubMed] [Green Version]
  102. Ino, Y.; Yamazaki-Itoh, R.; Shimada, K.; Iwasaki, M.; Kosuge, T.; Kanai, Y.; Hiraoka, N. Immune cell infiltration as an indicator of the immune microenvironment of pancreatic cancer. Br. J. Cancer 2013, 108, 914–923. [Google Scholar] [CrossRef] [PubMed]
  103. Kuo, D.S.; Labelle-Dumais, C.; Gould, D.B. COL4A1 and COL4A2 mutations and disease: Insights into pathogenic mechanisms and potential therapeutic targets. Hum. Mol. Genet. 2012, 21, R97–R110. [Google Scholar] [CrossRef] [PubMed] [Green Version]
  104. Sudhakar, A.; Nyberg, P.; Keshamouni, V.G.; Mannam, A.P.; Li, J.; Sugimoto, H.; Cosgrove, D.; Kalluri, R. Human alpha1 type IV collagen NC1 domain exhibits distinct antiangiogenic activity mediated by alpha1beta1 integrin. J. Clin. Investig. 2005, 115, 2801–2810. [Google Scholar] [CrossRef] [PubMed]
Figure 1. Collagen type IV alpha chain 1 (COL4A1) mRNA expression levels in various types of cancer and normal tissues. (a) High or low expression levels of COL4A1 in datasets of 33 types of cancers compared with normal tissues in the Gene expression Profiling Interactive Analysis (GEPIA) database (http://gepia.cancer-pku.cn/detail.php; accessed on 26 January 2021). The graph shown as a dot plot indicates the mRNA expression of each sample. Cancer samples are indicated in red and normal samples in green. Cancer type abbreviations are listed in Table S1. (b) Tissue-wide patterns of COL4A1 expression in 35 human tumors from different tissue origins using the Gene Expression database of Normal and Tumor tissues 2 (GENT2) (http://gent2.appex.kr/gent2/; accessed on 26 January 2021). Boxes show the median, 25th, and 75th percentiles; dots represent the outliers. Significant differences between each tumor tissue and its normal counterpart were indicated by blue or red asterisks (* p < 0.05, ** p < 0.01, *** p < 0.001) for high expression levels in normal tissues or in tumors, respectively.
Jpm 12 00534 g001
Figure 2. Patient overall survival according to COL4A1 expression levels in low-grade glioma (LGG), pancreatic adenocarcinoma (PAAD), skin cutaneous melanoma (SKCM), and stomach adenocarcinoma (STAD). Kaplan–Meier survival curves of patient groups with high (red) and low (blue) COL4A1 expression levels split by optimal cut-off to minimize the p-value were retrieved from The Cancer Genome Atlas (TCGA) datasets with ESurv online analysis tool. (a) LGG (n = 524), (b) PAAD (n = 169) (c) SKCM (n = 458), and (d) STAD (n = 381).
Jpm 12 00534 g002
Figure 3. COL4A1 expression levels in various non-tumoral cells in melanoma TME and correlation of signatures of infiltrated cancer-associated fibroblasts (CAFs) and tumor endothelial cells (TECs) in LGG, PAAD, SKCM, and STAD. (a) Analysis of COL4A1 expression levels in various TME cells using single cell RNA-sequencing data in “Study: Melanoma intra-tumor heterogeneity.” The data are visualized with scatter and violin plots in single cell portal. Correlation values between COL4A1 expression levels and the signatures of CAFs (b) or endothelial cells (c) were retrieved using multiple algorithms (EPIC, MC-COUNTER, XCELL, and TIDE for CAFs and EPIC; MC-COUNTER and XCELL for TEC) in TIMER 2.0.
Jpm 12 00534 g003
Figure 4. Correlations between immune cell infiltration and COL4A1 expression levels in LGG, PAAD, SKCM, and STAD. Correlation values between COL4A1 expression levels and the abundance of various types of infiltrating immune cells in TCGA datasets were retrieved using the TIMER web tool. Correlation analysis between immune infiltration and COL4A1 expression in (a) LGG, (b) PAAD, (c) SKCM, (d) STAD; e.g., 1.19e-19 mean 1.19 × 10⁻¹⁹.
Jpm 12 00534 g004
Figure 5. Correlations of COL4A1 expression levels with the expression levels of M1, M2, TAM, and Treg markers in LGG, PAAD, SKCM, and STAD. M1 macrophages, M2 macrophages, TAM, and Treg cells infiltration levels are portrayed based on COL4A1 expression with various gene markers using TIMER. Nitric oxide synthase 2 (NOS2), interferon regulatory factor 5 (IRF5), and prostaglandin-endoperoxide synthase 2 (PTGS2) were used as markers for M1 macrophages; CD163, V-set and immunoglobulin domain containing 4 (VSIG4), and membrane-spanning 4-domains A4A (MS4A4A) were used as markers for M2 macrophages; C–C chemokine ligand 2 (CCL2), CD68, and interleukin-10 (IL10) were used as markers for TAM; Forkhead box protein P3 (FOXP3), C-C motif chemokine receptor 8 (CCR8), signal transducer and activator of transcription 5B (STAT5B), and transforming growth factor-β1 (TGFβ1) were used as markers for Treg cells. COL4A1 expression levels were positively correlated with those of various gene markers for M2, TAM, and Treg cells in LGG, PAAD, SKCM, and STAD. Rates of correlation and p-values are shown in Table 1, e.g., 1.71e-10 mean 1.71 × 10⁻¹⁰.
Jpm 12 00534 g005
Figure 6. Correlation of COL4A1 expression levels with the expression levels of immune-suppressive cytokines (IL-10, TGFβ1, Epstein–Barr virus induced 3 (EBI3), and colony-stimulating factor 1 (CSF1)). Correlation analyses among expression levels of COL4A1 and four cytokine gene markers are depicted using TIMER. Significant positive correlations between the expression levels of COL4A1 and the four cytokines, IL-10, CSF1, TGFβ1, IL-10, and EBI3, were observed in LGG, PAAD, SKCM, and STAD, e.g., 3.26e-24 mean 3.26 × 10⁻²⁴.
Jpm 12 00534 g006
Table 1. Correlation analyses among the expression levels of COL4A1 and related marker genes of immune cells in the tumor microenvironment (TME) of four tumor types using the Tumor Immune Estimation Resource (TIMER) tool.
DescriptionGene MarkersLGGPAADSKCMSTAD
NonePurityNonePurityNonePurityNonePurity
CorpCorpCorpCorpCorpCorpCorpCorp
CD8+ T cellsCD8A0.149***0.203***0.367***0.303***−0.0010.984−0.0880.0590.133**0.109*
CD8B0.0690.1170.11*0.297***0.227**−0.0250.583−0.126**0.0440.370.0310.55
TAMsCCL20.282***0.3***0.344***0.303***0.302***0.278***0.385***0.366***
CD680.35***0.382***0.533***0.491***0.179***0.14**0.171***0.142**
IL100.28***0.287***0.442***0.4***0.283***0.265***0.349***0.341***
M1 macrophagesNOS2−0.0390.377−0.0060.8940.315***0.338***0.326***0.318***0.105*0.117*
IRF50.235***0.29***0.2**0.177*0.129**0.0830.0770.107*0.0960.063
PTGS20.0790.0730.0880.0540.354***0.373***0.3***0.284***0.369***0.357***
M2 macrophagesCD1630.486***0.473***0.631***0.577***0.332***0.322***0.4***0.378***
VSIG40.232***0.253***0.595***0.538***0.263***0.244***0.341***0.337***
MS4A4A0.393***0.4***0.614***0.562***0.28***0.262***0.319***0.305***
NeutrophilsCEACAM8−0.0030.944−0.0220.6280.171*0.1150.1330.0750.1020.0860.0660.0640.1910.0840.103
ITGAM0.181***0.226***0.513***0.444***0.263***0.237***0.362***0.35***
CCR70.368***0.395***0.274***0.219**0.0450.327−0.040.3980.27***0.261***
Th1TBX210.439***0.434***0.237**0.183*0.0340.465−0.0540.2470.187***0.188***
STAT4−0.0760.086−0.0360.430.274***0.27***0.122**0.0710.130.246***0.233***
STAT10.507***0.515***0.518***0.472***0.0620.1770.0170.7210.129**0.112*
IFNG0.206***0.224***0.264***0.216**−0.0250.585−0.114*−0.010.837−0.0140.781
TNF−0.0310.486−0.0320.4870.263***0.233**0.0460.323−0.0280.5550.163***0.146**
TregFOXP30.0040.9270.0270.5560.495***0.448***0.0660.152−0.010.8390.256***0.244***
CCR80.22***0.236***0.578***0.539***0.112*0.0590.2090.324***0.312***
STAT5B0.166***0.137**0.443***0.499***0.13**0.136**0.469***0.458***
TGFB10.292***0.316***0.441***0.419***0.454***0.451***0.465***0.442***
TAM, tumor-associated macrophage; Th, T helper cell; Tfh, follicular helper T cell; Treg, regulatory T cell; Cor, R value of Spearman’s correlation; None, correlation without adjustment. Purity, correlation adjusted for purity. * p < 0.05, ** p < 0.01, *** p < 0.001.
Publisher’s Note: MDPI stays neutral with regard to jurisdictional claims in published maps and institutional affiliations.

