Article

Multi-Omics Analysis Reveals Myelin, Presynaptic and Nicotinate Alterations in the Hippocampus of G72/G30 Transgenic Mice

by
Michaela D. Filiou
1,2,3,*,
Larysa Teplytska
1,
Markus Nussbaumer
2,3,
David-M. Otte
4,5,
Andreas Zimmer
4 and
Christoph W. Turck
1,*
1
Proteomics and Biomarkers, Max Planck Institute of Psychiatry, 80804 Munich, Germany
2
Department of Biological Applications and Technology, School of Health Sciences, University of Ioannina, 45110 Ioannina, Greece
3
Biomedical Research Ιnstitute, Foundation for Research and Technology-Hellas, 45110 Ioannina, Greece
4
Institute of Molecular Psychiatry, University of Bonn, 53125 Bonn, Germany
5
Center of Aptamer Research and Development, LIMES Institute, University of Bonn, 53121 Bonn, Germany
*
Authors to whom correspondence should be addressed.
J. Pers. Med. 2022, 12(2), 244; https://doi.org/10.3390/jpm12020244
Submission received: 23 December 2021 / Revised: 20 January 2022 / Accepted: 25 January 2022 / Published: 9 February 2022
(This article belongs to the Special Issue Biomarkers in Psychiatric Disorders)

Abstract

:
The primate-specific G72/G30 gene locus has been associated with major psychiatric disorders, such as schizophrenia and bipolar disorder. We have previously generated transgenic mice which carry the G72/G30 locus and express the longest G72 splice variant (LG72) protein encoded by this locus with schizophrenia-related symptoms. Here, we used a multi-omics approach, including quantitative proteomics and metabolomics to investigate molecular alterations in the hippocampus of G72/G30 transgenic (G72Tg) mice. Our proteomics analysis revealed decreased expression of myelin-related proteins and NAD-dependent protein deacetylase sirtuin-2 (Sirt2) as well as increased expression of the scaffolding presynaptic proteins bassoon (Bsn) and piccolo (Pclo) and the cytoskeletal protein plectin (Plec1) in G72Tg compared to wild-type (WT) mice. Metabolomics analysis indicated decreased levels of nicotinate in G72Tg compared to WT hippocampi. Decreased hippocampal protein expression for selected proteins, namely myelin oligodentrocyte glycoprotein (Mog), Cldn11 and myelin proteolipid protein (Plp), was confirmed with Western blot in a larger population of G72Tg and WT mice. The identified molecular pathway alterations shed light on the hippocampal function of LG72 protein in the context of neuropsychiatric phenotypes.

1. Introduction

The G72/G30 gene area on human chromosome 13q is a susceptibility locus for major psychiatric disorders, including schizophrenia and bipolar disorder [1,2]. The main protein product of this locus is the longest G72 splice variant (LG72) protein (G72 protein, also termed D-amino acid oxidase activator (DAOA)), whose function in relation to psychiatric disorders remains obscure [3]. Elevated G72 protein levels were found in the serum of patients suffering from schizophrenia [4] and a tendency towards increased expression of the G72 gene has been observed in brains of schizophrenia patients [5].
To study the function of the G72 protein in vivo, we have generated humanized transgenic mice carrying the G72/G30 locus (G72Tg) that express the G72 protein [6]. G72Tg mice exhibit schizophrenia-related symptoms, including impaired motor coordination, sensorimotor gating and olfactory discrimination, increased compulsive behavior as well as spatial memory deficits [6,7]. Intriguingly, treatment with the antipsychotic haloperidol was shown to reverse sensorimotor gating impairment in a prepulse inhibition paradigm in G72Tg mice [6]. At the molecular level, we have characterized the cerebellar profiles of G72Tg mice using complementary proteomics approaches, including quantitative mass spectrometry (MS) [8] and 2D-gel electrophoresis, and found protein expression alterations in myelin-, mitochondria- and oxidative stress-related processes in G72Tg compared to wild-type (WT) mice [7,9].
Here, our aim was to investigate G72-induced changes in the mouse hippocampus in order to shed light on the LG72 function in vivo and in relation to neuropsychiatric phenotypes. For this purpose, we implemented a multi-omics approach, based on quantitative proteomics and metabolomics in order to explore altered molecular biosignatures and networks in the hippocampi of G72Tg vs. WT mice. Selected protein changes identified by quantitative proteomics were then verified by Western blot analysis.

2. Materials and Methods

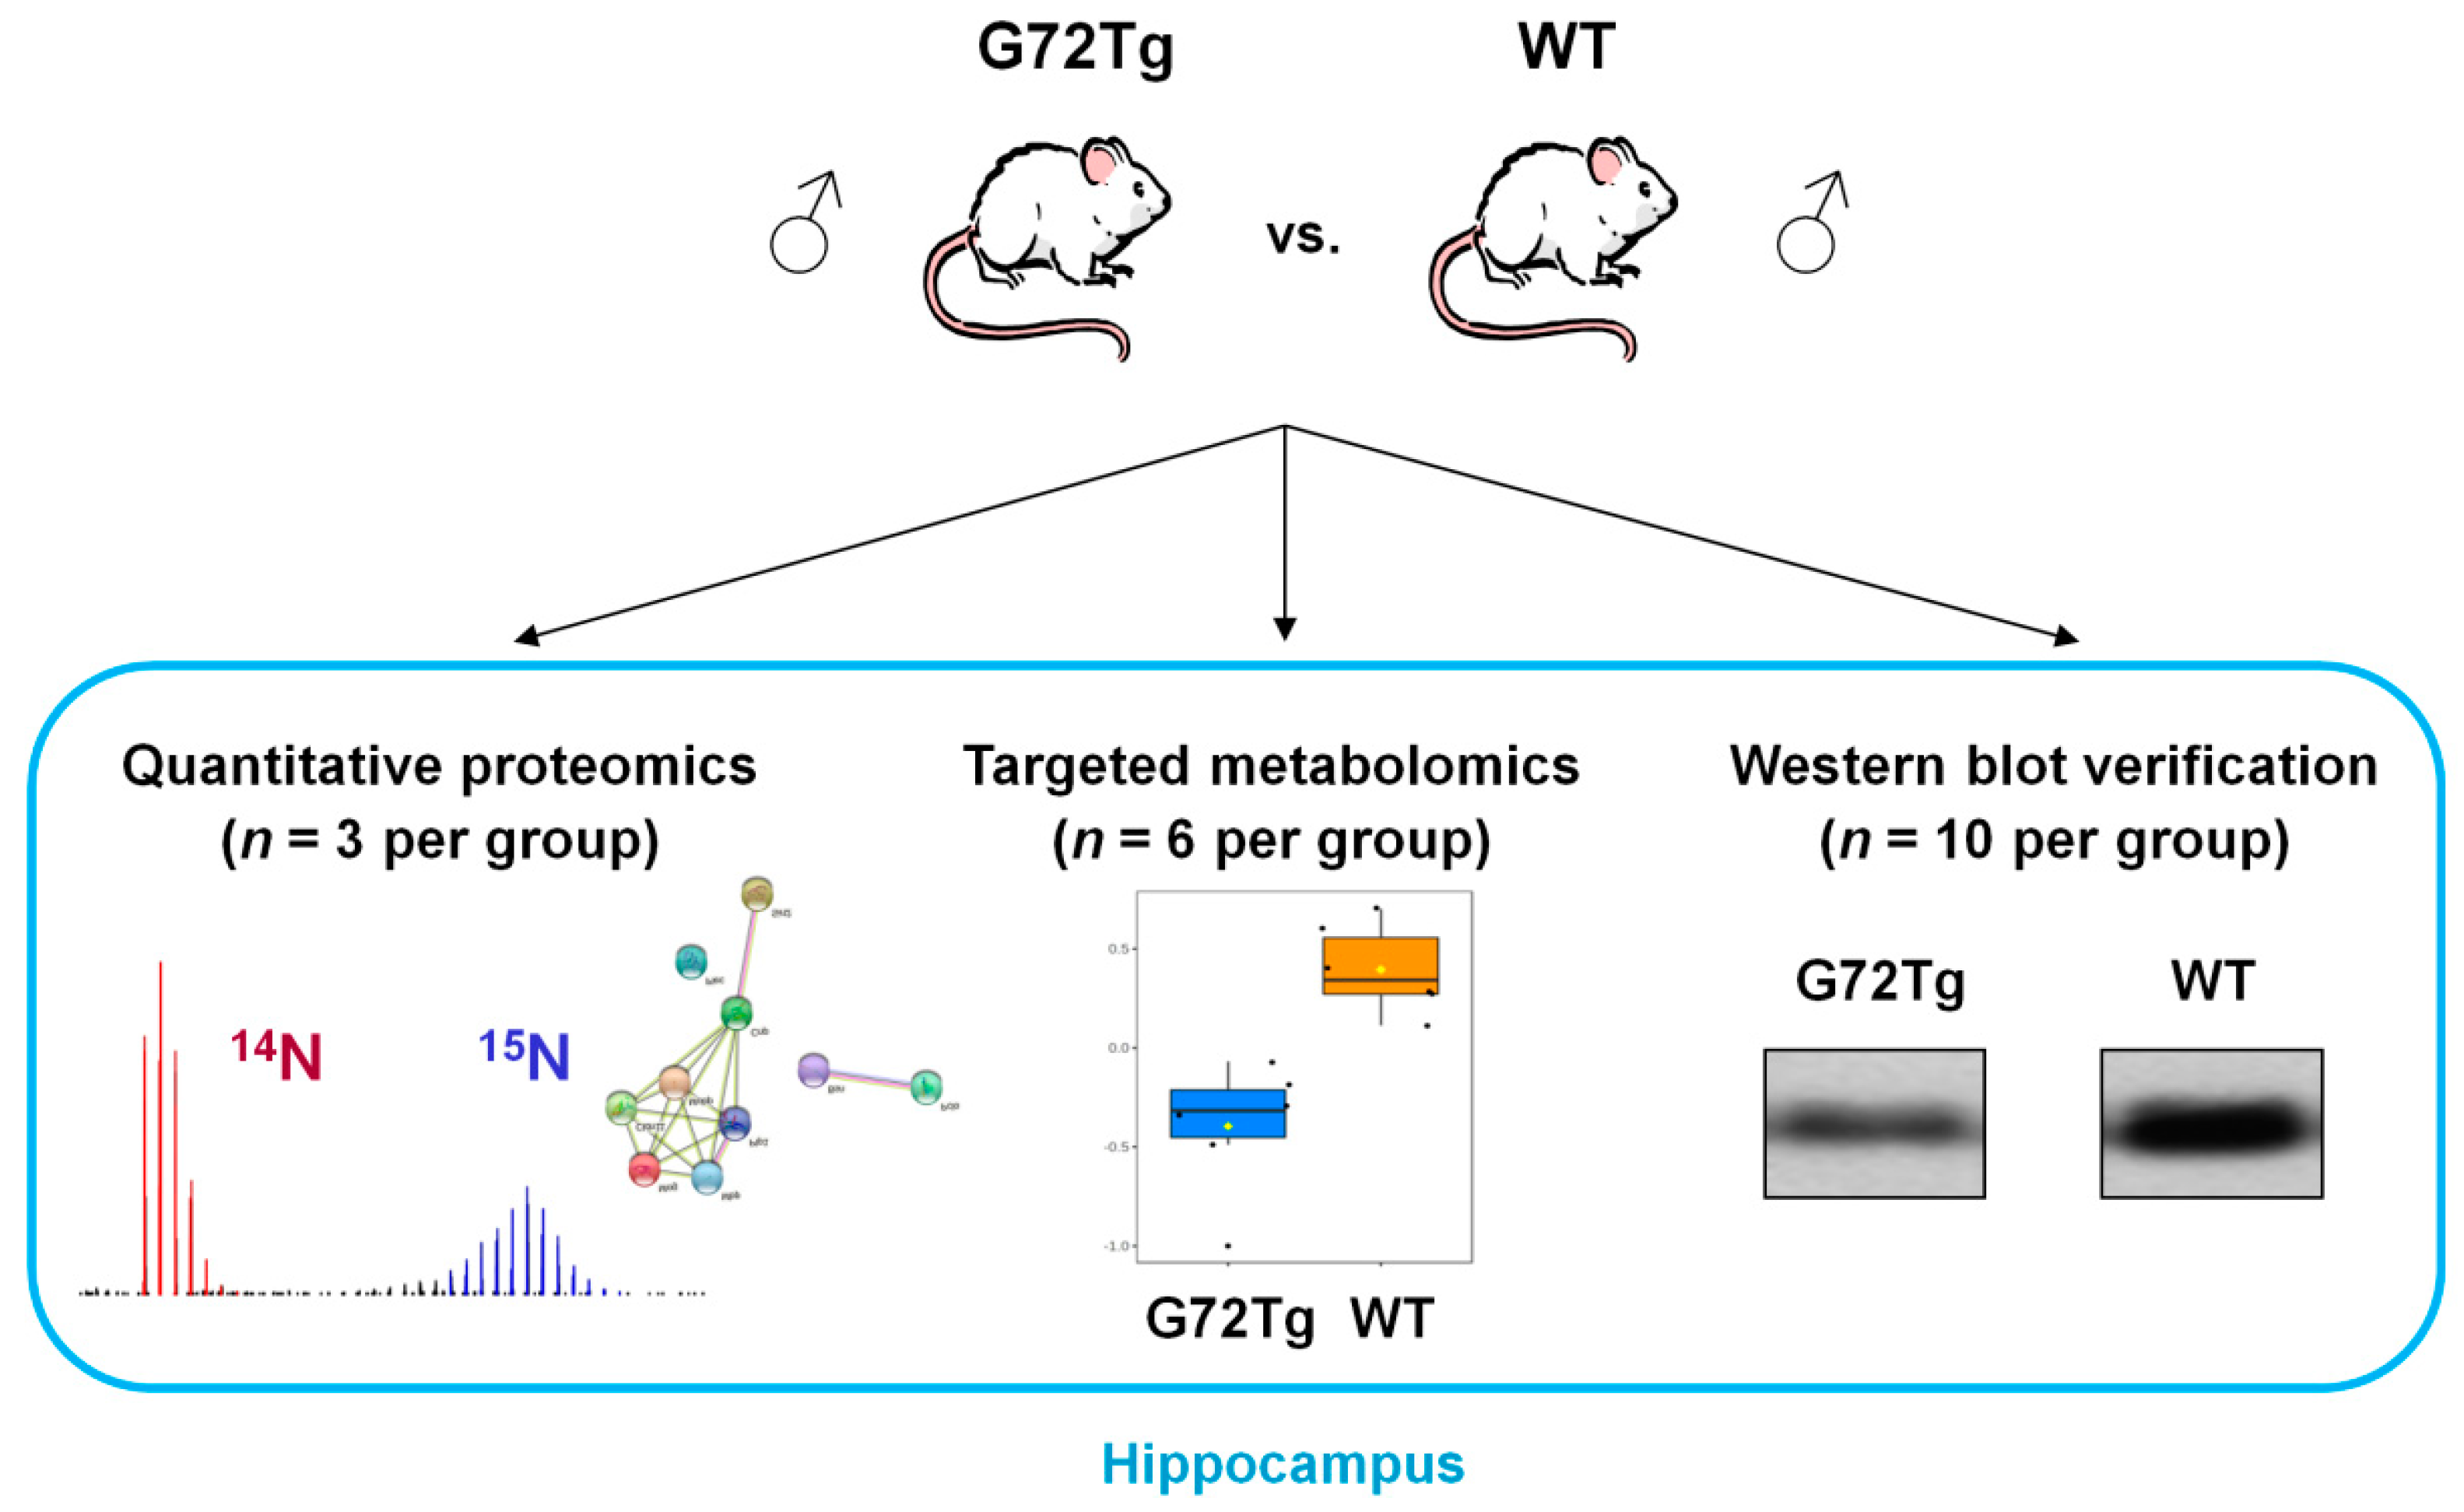
2.1. Experimental Design

All mice studied were males, eight weeks old of CD1 background. For quantitative proteomics, we compared three hippocampi each of G72Tg and WT mice by quantitative MS, using 15N metabolically labeled hippocampi of CD1 mice as internal standards. For targeted metabolomics, we compared the hippocampi from six G72Tg and six WT mice. Ten G72Tg and 10 WT mice were used for verification of the identified proteomics results. The experimental design of the study is provided in Figure 1.

2.2. Transgenic Mice Carrying the G72/G30 Locus (G72Tg) and Wild-Type (WT) Mice

G72Tg mice were generated, bred and genotyped as described previously [6,7]. The G72Tg and WT mice used for this study were group-housed in the animal facility of the Institute of Molecular Psychiatry under standard conditions (12 h light/dark cycle, lights on at 7 a.m., tap water and food ad libitum, room temperature 22 °C, humidity 48%).

2.3. 15N Metabolic Labeling of CD1 Mice

The 15N metabolic labeling of CD1 mice was performed as previously described [9], according to the protocol established by Frank et al. [10], using a 15N-labeled, bacterial, protein-based diet (Silantes GmbH, Munich, Germany) which results in > 91% 15N incorporation both in mouse brain tissue and plasma [11].

2.4. Sample Collection

At eight weeks of age, hippocampi from G72Tg, WT and 15N-labeled CD1 animals were dissected after perfusion with 0.9% saline. Hippocampi were snap frozen in liquid nitrogen and stored at −80 °C.

2.5. Quantitative Proteomics Sample Preparation and Measurement

The hippocampal cytoplasmic fraction from G72Tg, WT and 15N-labeled CD1 mice was collected as previously described [9]. 15N-labeled CD1 mouse hippocampal tissue was used as internal standard so as to compare the unlabeled G72Tg and WT mice. The experimental design for the quantitative proteomics analysis is as previously described (Figure 1 in [9]). The Bradford assay (BioRad Laboratories, Hercules, CA, USA) was used to quantitate total protein amount. For each G72Tg/WT pair, the cytoplasmic fractions of G72Tg and WT hippocampi were mixed 1:1 (w/w) with the cytoplasmic fraction of the same 15N-labeled CD1 mouse reference based on protein amount. Proteomics sample preparation for sodium dodecyl sulfate-polyacrylamide gel electrophoresis (SDS-PAGE), in gel digestion and peptide extraction was performed as previously described [9,10]. Peptide extracts were lyophilized, re-dissolved in 0.1% formic acid, filtered and analyzed using liquid chromatography-electrospray ionization-tandem mass spectrometry (LC-ESI-MS/MS) by a nanoflow HPLC-2D system (Eksigent, Dublin, CA, USA) which was coupled online to an LTQ Orbitrap XL™ Hybrid FT Mass Spectrometer (Thermo Fisher Scientific, Bremen, Germany), as previously described [9]. Detailed MS parameters were as previously described [12].

2.6. Quantitative Proteomics Data Analysis

Quantitative proteomics data analysis was performed based on established workflows [9,13], including the Trans-Proteomic Pipeline [14] in order to identify protein groups [15]. Protein quantification results were manually evaluated to exclude inaccurate quantifications due to incorrect isotopologue pattern assignment or protein contaminants. Protein groups with adjusted p < 0.05 were considered differentially expressed, however, only protein groups with a fold change > 1.3 were considered biologically relevant and were further discussed. MS raw data and the quantification analysis result files are available upon request.

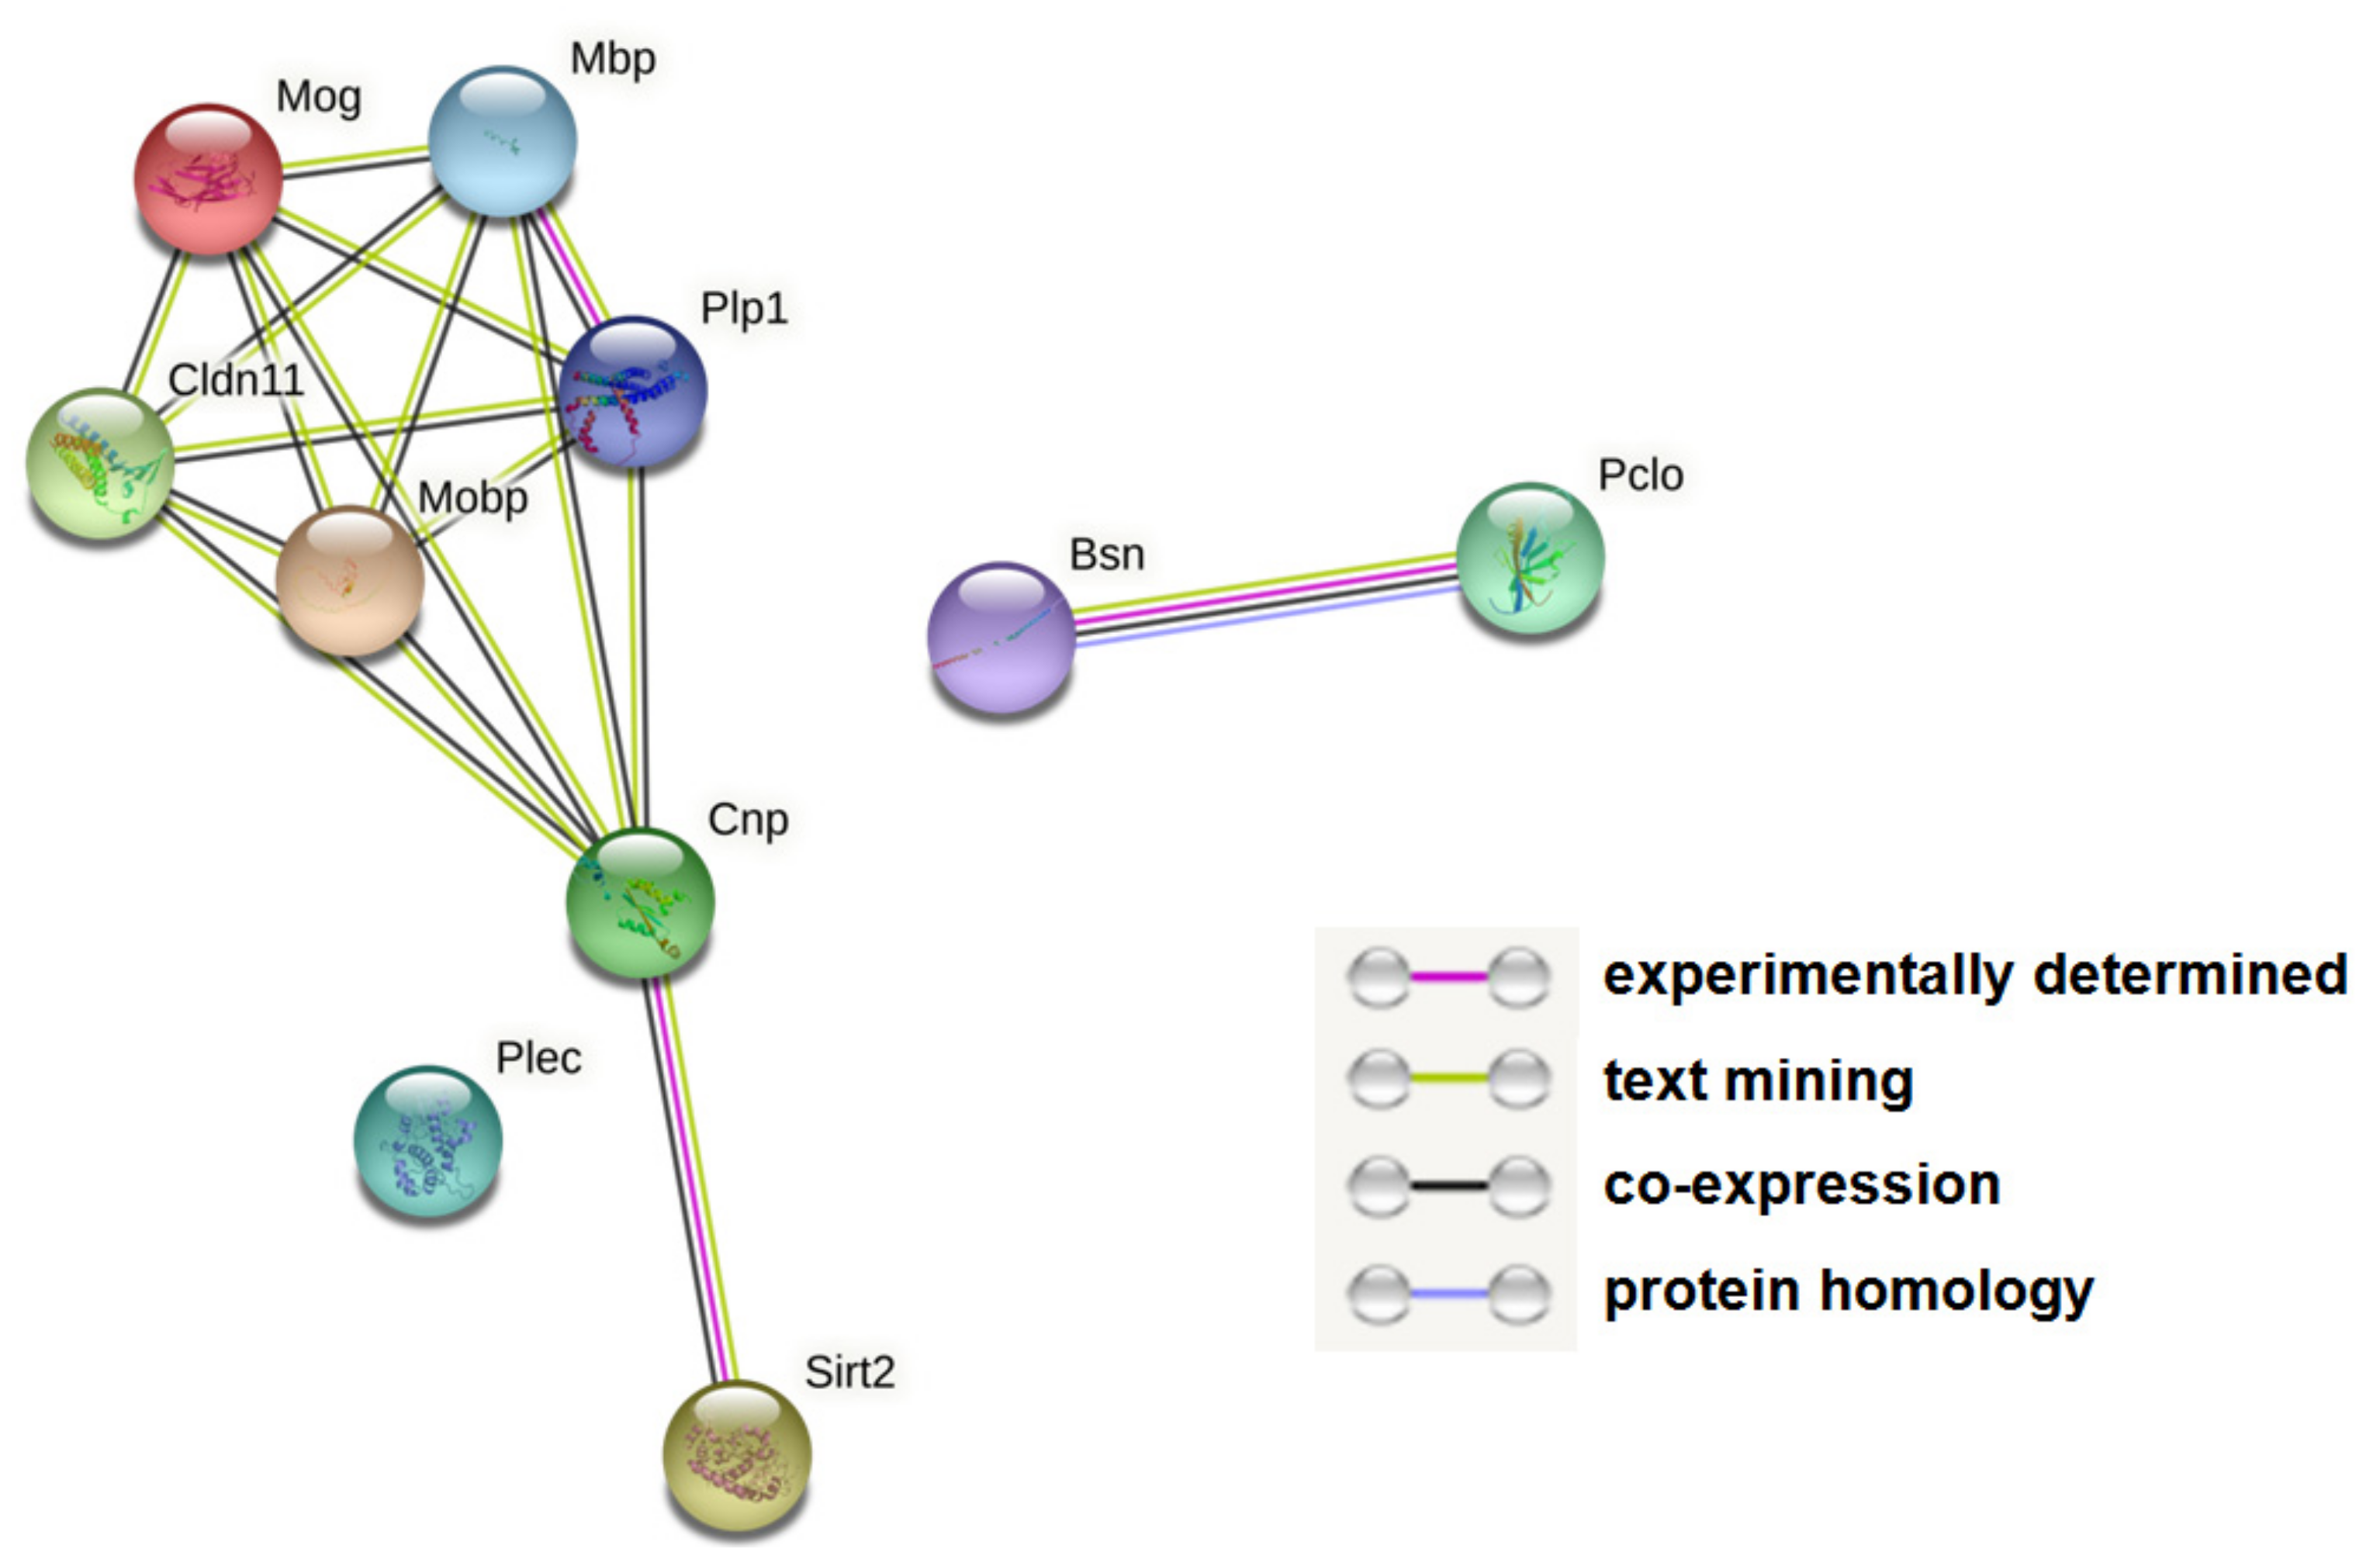
2.7. Protein Network Visualization

To visualize altered protein networks between G72Tg and WT hippocampi, we used the list of differentially expressed proteins as input for STRING (https://string-db.org, v.11.5). Mus musculus was selected as the organism and the default settings, including both functional and physical protein associations, were kept in order to identify protein networks.

2.8. Targeted Metabolomics

Sample preparation for metabolomics of G72Tg and WT hippocampi (n = 6 per group) was performed as previously described [16,17]. Samples were measured with a 5500 QTRAP® triple quadrupole mass spectrometer (AB/SCIEX, Framingham, MA, USA) which was coupled to a Prominence UFCL HPLC system (Shimadzu, Columbia, MD, USA) at the Mass Spectrometry Core of Beth Israel Deaconess Medical Center, Harvard Medical School (Boston, MA, USA), using a selected reaction monitoring (SRM)-based platform [18].

2.9. Targeted Metabolomics Data Analysis

Metaboanalyst 5.0 (https://www.metaboanalyst.ca) [19] was used to analyze targeted metabolomics data. For metabolites which were measured both in positive and negative ion mode, the measurement with higher intensities/fewer missing values was kept for further analysis. Hippocampal metabolite raw peak intensity data that were used for Metaboanalyst are provided in Table S1. Metabolites with > 10% missing values were not considered for further analysis and the remaining missing values were replaced by the 1/5 of the minimum positive value of each variable. No data filtering was applied. Data were then median-normalized, log-transformed and Pareto-scaled. Data were assessed using a univariate method (significance analysis of microarrays (SAM)). For SAM analysis, features with false discovery rate (FDR) < 0.05, p < 0.05 and q < 0.05 were considered significant.

2.10. Western Blot

G72Tg and WT mouse hippocampal cytoplasmic Mog, Cldn11, Plp protein expression (n = 10 per group) was assessed using anti-Mog (ab28766, Abcam, Cambridge, UK, 1:15,000 dilution, 10 μg loaded per sample), anti-Cldn11 (Osp) (ab53041, Abcam, 1:5000 dilution, 2 μg loaded per sample) and anti-Plp (ab28486, Abcam, 1:5000 dilution, 2 μg loaded per sample) primary antibodies, respectively. Western blot was performed as previously described [12]. Transfer membranes were stained with Coomassie Brilliant Blue R-250 (BioRad Laboratories, Hercules, CA, USA) and signal intensities were compared to ensure equal protein loading. For signal intensity quantification QuantityOne (version 4.4.0, BioRad Laboratories, Hercules, CA, USA) was used. G72Tg and WT group differences in Western blots were assessed by the non-parametric, Mann–Whitney test using GraphPad Prism 8.0 (GraphPad Software, San Diego, CA, USA). Results were considered statistically significant for p < 0.05.

3. Results

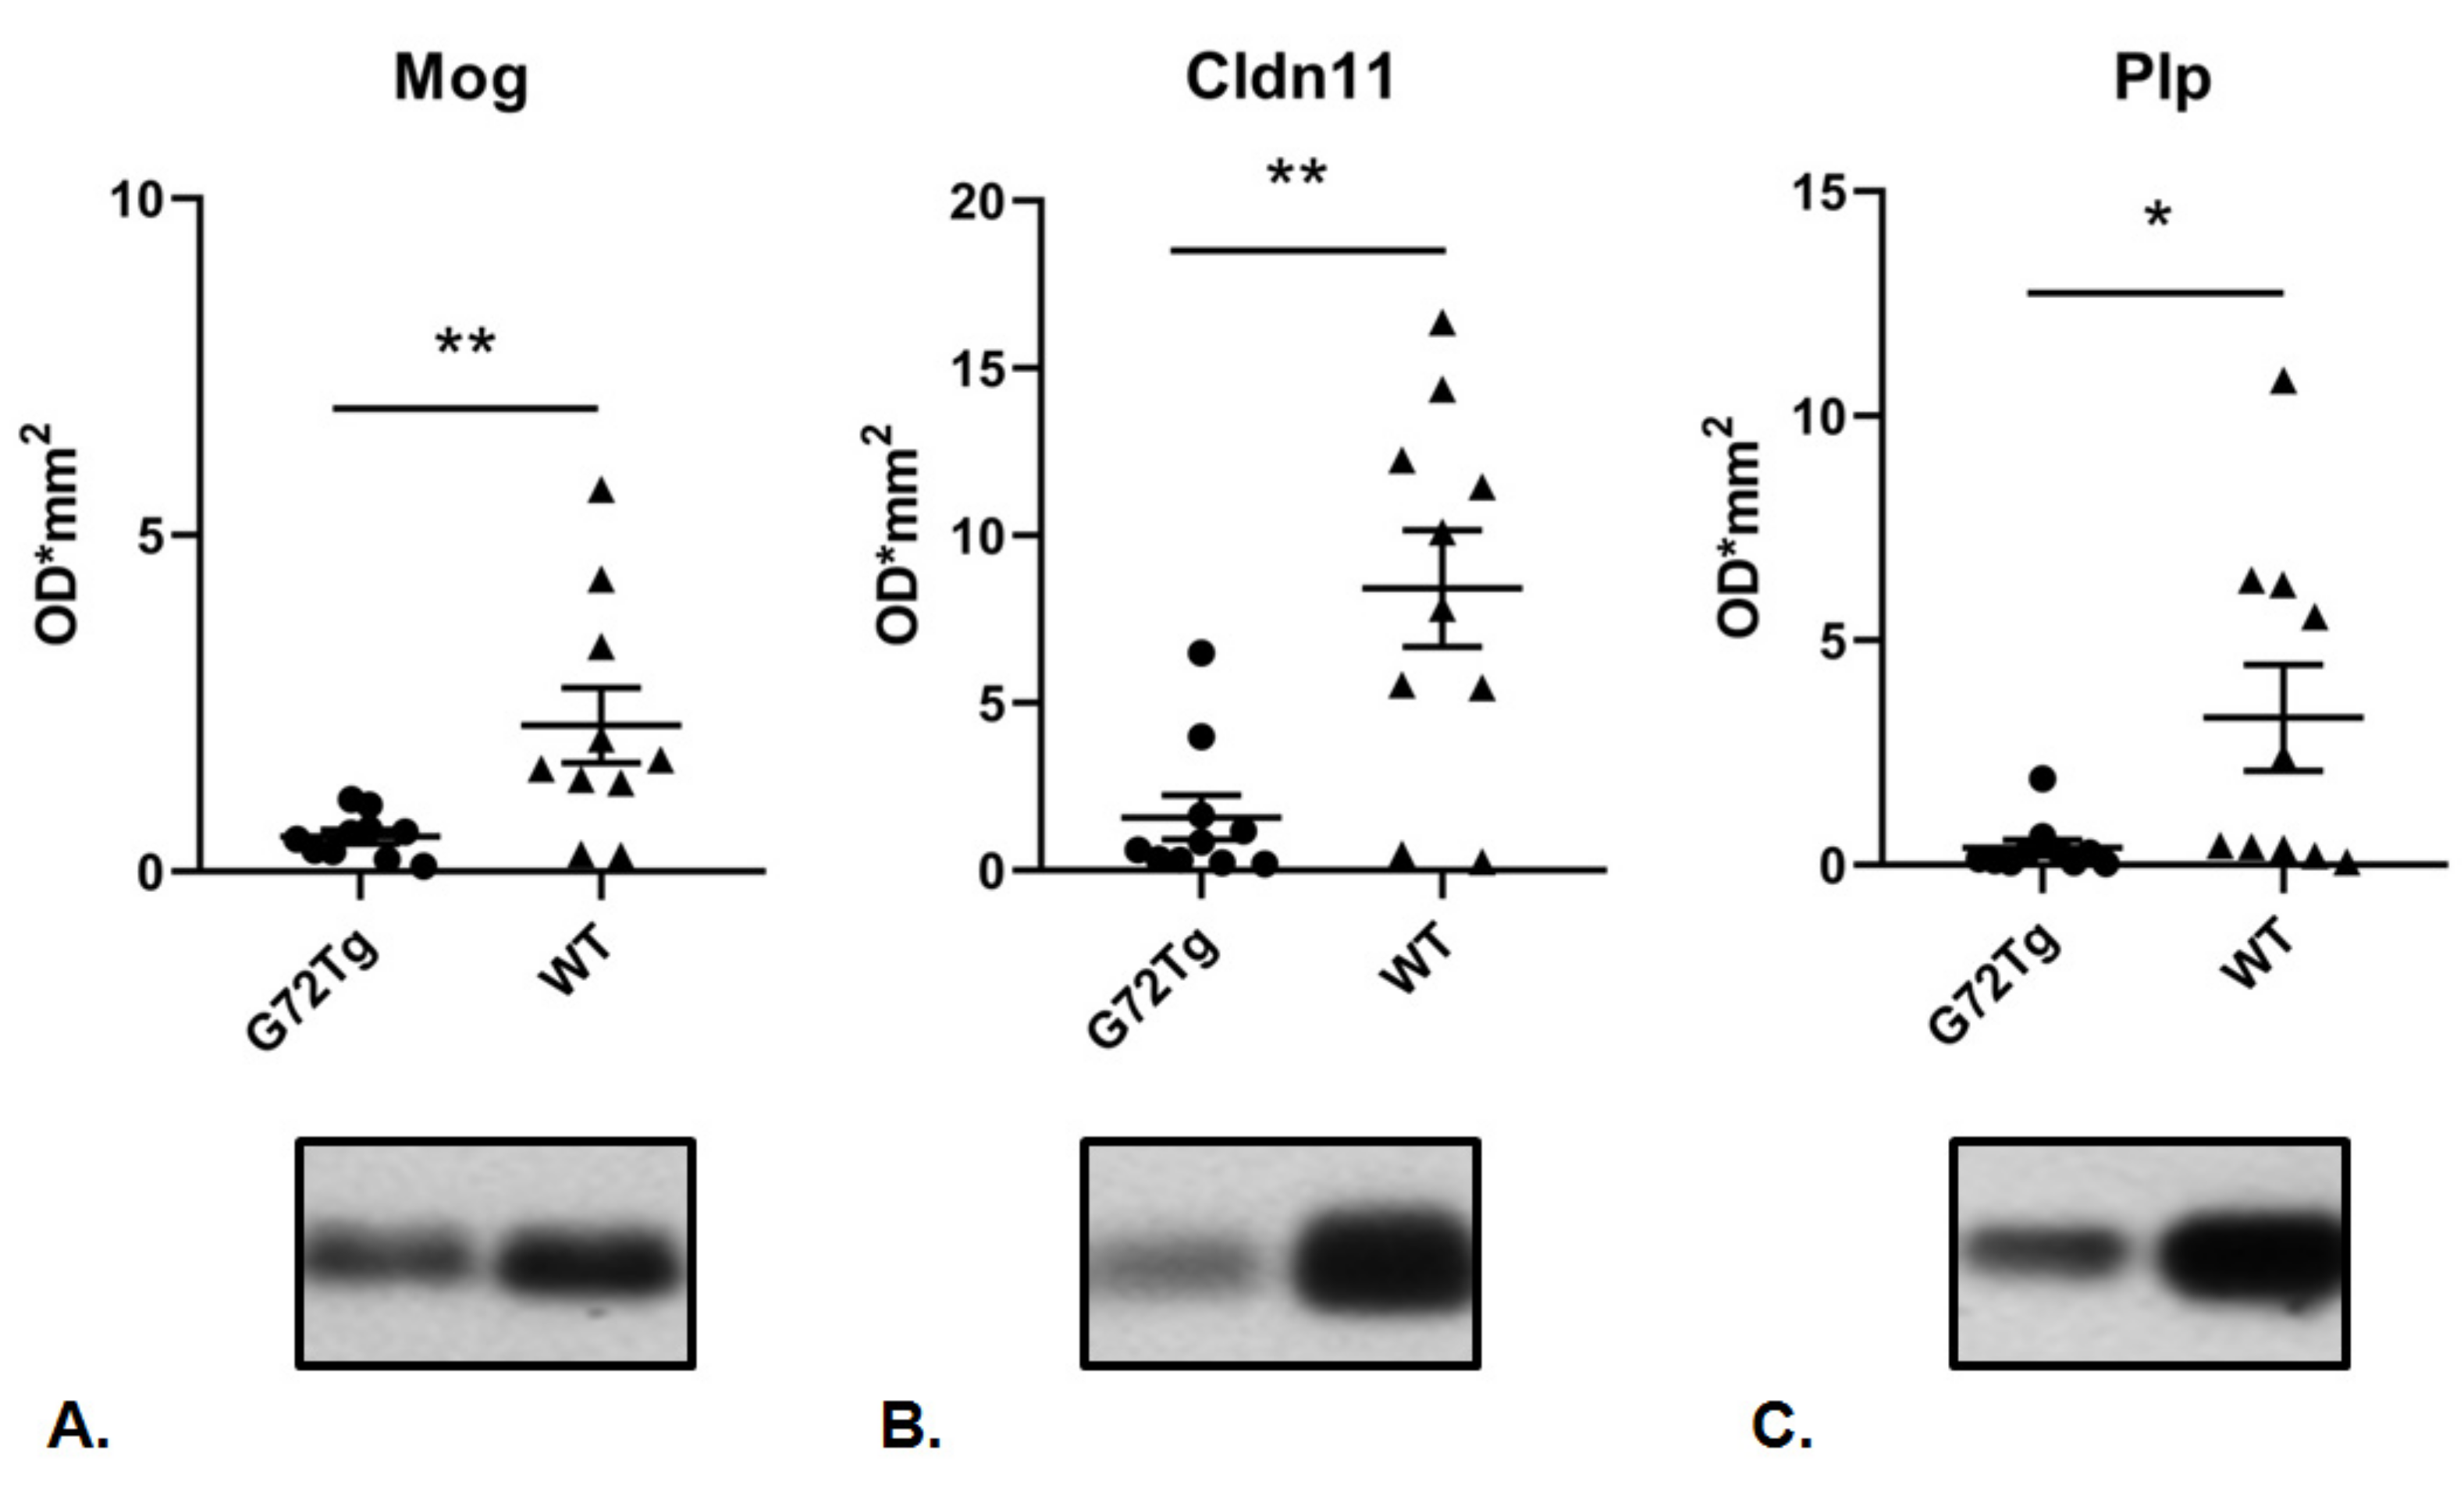
3.1. Decreased Expression of Myelin-Related Proteins and Increased Expression of Presynaptic Proteins in G72Tg Hippocampi

In this study, we explored molecular changes in the hippocampi of G72Tg compared to WT mice using quantitative proteomics and metabolomics. Our quantitative proteomics analysis revealed 14 proteins (protein groups) that were differentially expressed between G72Tg and WT mouse hippocampi, of which 10 were considered statistically and biologically significant (Table 1). Of these, the expression of seven proteins was lower and of three proteins was higher in G72Tg compared to WT mice. Except Sirt2, proteins with decreased expression were predominantly related to myelin (Plp1, Mbp, Cnp, Mog, Mobp, Cldn11). Proteins with increased expression in G72Tg hippocampi were presynaptic, namely the scaffold proteins Pclo and Bsn, as well as cytoskeletal (protein Plec1). In silico analyses revealed physical and functional associations among the proteins with decreased expression in G72Tg hippocampi as well as between the two presynaptic scaffold proteins (Figure 2).

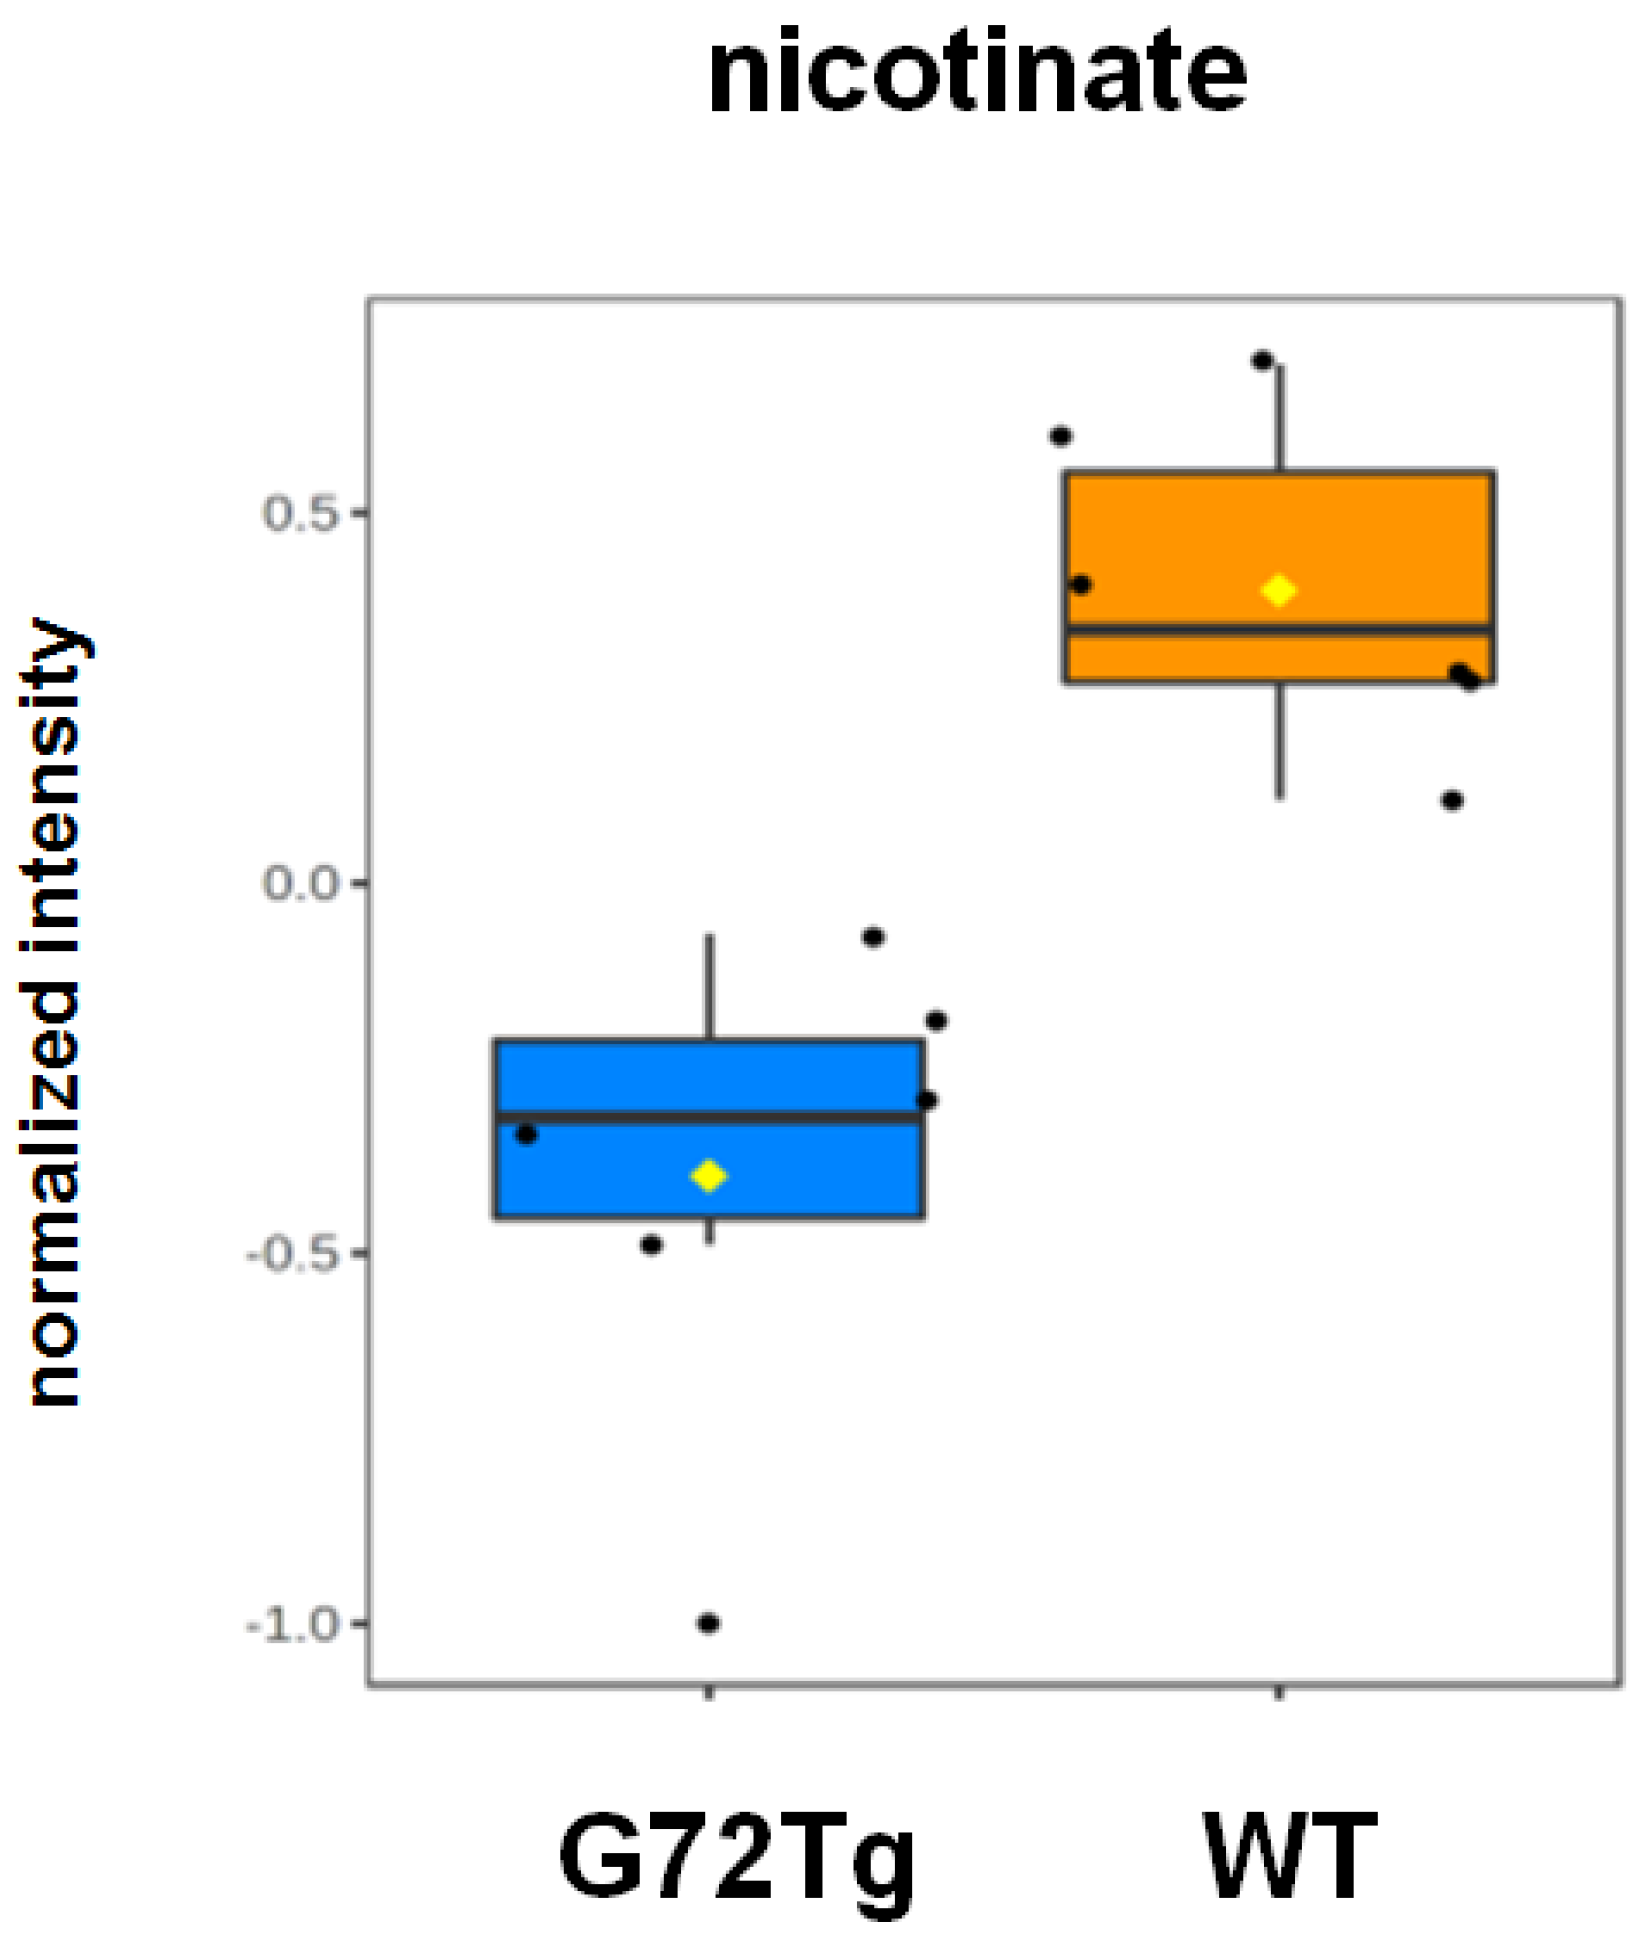
3.2. Decreased Nicotinate Levels in G72Tg Hippocampi

Using an SRM-based, targeted metabolomics platform, 289 metabolites were measured in G72Tg and WT hippocampi, of which 273 were kept for further analysis, after including only once metabolites that were measured in both negative and positive ion modes (Table S1). SAM analysis identified nicotinate (conjugate base of nicotinic acid, termed niacin or vitamin B3) as a significant feature. Nicotinate levels were lower in G72Tg compared to WT hippocampi (Figure 3).

3.3. Convergent Protein Expression Changes in Hippocampus and Cerebellum in G72Tg Mice

To investigate whether there are common G72Tg-induced molecular patterns in different mouse brain regions, we then compared the differentially expressed proteins identified in the hippocampus cytoplasm of G72Tg mice (Table 1) with the previously identified differentially expressed proteins in the cerebellum cytoplasm of G72Tg mice ([9], Table 1). Three proteins, Plp, Cldn11, and Mog, were found at lower levels both in the cerebellum and hippocampus in G72Tg compared to WT mice. Their decreased expression was verified in a larger number of male G72Tg and WT mouse hippocampi (n = 10 per group) by Western blot analysis (Figure 4). Full Western Blot data are provided in Supplementary Figure S1.

4. Discussion

In this study, we used MS-based quantitative proteomics and metabolomics to illuminate G72-induced molecular alterations in the hippocampi of G72Tg male mice. We selected the hippocampus as a brain region of interest because in previous studies, next to cerebellum and cortex, it was shown to have the highest G72 mRNA expression levels [6]. Furthermore, the hippocampus has been implicated in the pathophysiology of schizophrenia [20,21]. Overall, our multi-omics analysis revealed decreased expression of myelin-related proteins and increased expression of presynaptic scaffolding proteins, along with lower levels of nicotinate in G72Tg compared to WT hippocampi.
Hypomyelination has been reported in schizophrenia, both in rodent models [9,22] and human cohorts [23]. Convergent evidence indicates altered expression of myelin-related proteins in schizophrenia patients, in different brain regions, such as the thalamus [24], the corpus callosum [25] and the dorsolateral prefrontal cortex [26]. In the hippocampus, decreased Mog protein expression in CA3 was observed in patients with long-term schizophrenia [27], along with decreased oligodentrocyte numbers in the left CA4 in patients with schizophrenia [28] compared to controls. In our efforts to characterize lipid-based, myelin-related changes in the hippocampus, we undertook a lipidomics study to compare G72Tg and WT mice and found increased sulfatide levels in G72Tg hippocampi [29]. Interestingly, in frontal cortex samples of patients suffering from schizophrenia analyzed with the same lipidomics platform also elevated sulfatide levels were identified [29]. In our proteomics analysis here, we observed decreased Sirt2 and Cldn11 expression in G72Tg hippocampi. Although there is limited information on a potential role of these two proteins in schizophrenia, altered phosphorylated Sirt2 protein expression was reported in response to the antipsychotic clozapine in rat nucleus accumbens [30], whereas myelin mutant mice lacking Cldn11 expression showed changes in behavior and neurotransmitter level imbalance [31].
We also observed increased protein expression of the scaffold presynaptic proteins Pclo and Bsn in G72Tg hippocampi. Synaptic alterations have been extensively described in schizophrenia [32], including changes in presynaptic neurotransmitter release [33] and post-synaptic characteristics [34]. However, there is limited information on a potential implication of Bsn and Pclo in schizophrenia manifestation. Recently, mutations in both Pclo and Bsn genes have been identified in subjects with schizophrenia [35], whereas increased Pclo gene expression was reported in the amygdala of schizophrenia patients [36]. Furthermore, mice with suppressed Pclo expression in the medial prefrontal cortex exhibited schizophrenia-like behaviors [37]. Intriguingly, in an interactome study of D-amino acid oxidase (DAO) in the rat cerebellum, both Bsn and Pclo were identified as DAO interacting proteins, and Bsn was shown to co-localize with DAO and inhibit its enzymatic activity [38], suggesting that Bsn may have a regulatory role in downstream, G72 (DAOA)-related pathways.
Metabolomics is a powerful approach to detect altered biosignatures in psychopathologies [39], which we have implemented to disentangle molecular profiles of neuropsychiatric phenotypes [40,41,42,43] as well as responses to pertinent therapeutic interventions [44,45,46,47,48,49,50]. Here, we used a targeted metabolomics platform to compare G72Tg and WT mice and identified lower nicotinate levels in G72Tg hippocampi. Nicotinate (in the form of niacin/vitamin B3) is the precursor of NAD+-NADH and NADP+-NADPH electron carriers. Schizophrenia risk has been associated with an enzyme involved in nicotinate metabolism in a genome-wide association study of an Indian population [51], whereas a skin flush response to niacin has been discussed as a potential marker for a schizophrenia endophenotype [52].
We have previously found that LG72 localizes in mitochondria both in human and murine cell lines and that LG72 interacts in both cases with the mitochondrial protein methionine sulfoxide reductase B2 (MSRB2) [53]. Importantly, the LG72 protein has been shown to disrupt mitochondrial functions [7]. Mitochondria are highly conserved organelles across mammals and mitochondrial dysfunction has emerged as a core molecular pathology in psychiatric disorders, including schizophrenia and bipolar disorder [54,55]. Due to the fact that in vivo studies of this kind in humans and non-human primates are difficult, if not impossible, our G72Τg mouse model provides a valid system for the study of G72 function in vivo.

5. Conclusions

Taken together, our multi-omics approach revealed altered molecular networks in the hippocampi of G72Tg compared to WT mice which shed light on the underlying G72-dependent molecular mechanisms. The identified molecular changes may be used in drug development efforts for the treatment of schizophrenia.

Supplementary Materials

The following supporting information can be downloaded at: https://www.mdpi.com/article/10.3390/jpm12020244/s1, Table S1: Raw hippocampal metabolite data of G72Tg and WT mice considered for metabolomics analysis. Figure S1: Full Western blot data of Mog, Cldn11 and Plp using G72Tg and WT mice hippocampal extracts.

Author Contributions

Conceptualization: M.D.F., A.Z. and C.W.T.; Methodology: M.D.F., L.T., D.-M.O. and A.Z.; Validation: M.D.F. and L.T.; Formal analysis: M.D.F., L.T. and M.N.; Writing-Original Draft Preparation: M.D.F.; Writing—Review and Editing: M.D.F. and C.W.T.; Supervision: C.W.T.; Project administration: A.Z. and C.W.T.; Funding acquisition: A.Z. and C.W.T. All authors have read and agreed to the published version of the manuscript.

Funding

This work was supported by the Max Planck Society and the Bundesministerium für Bildung und Forschung (NGFN2 01G10474, NGFN Plus MOODS FKZ 01GS08145 and 01GW0511).

Institutional Review Board Statement

The animal study was approved by the Landesamt für Natur, Umwelt und Verbraucherschutz in Nordrhein-Westfalen (LANUV), Germany (8.87-50.10.31.08.077, 2006) and conducted according to current regulations for animal experimentation in Germany and the European Union (European Communities Council Directive 86/609/EEC).

Data Availability Statement

The raw data presented here are available on request from the corresponding authors.

Acknowledgments

We thank John Asara at the Division of Signal Transduction, Beth Israel Deaconess Medical Center (Harvard Medical School) for targeted metabolomics measurements.

Conflicts of Interest

The authors declare no conflict of interest. The funders had no role in the design of the study; in the collection, analyses, or interpretation of data; in the writing of the manuscript, or in the decision to publish the results.

References

  1. Chumakov, I.; Blumenfeld, M.; Guerassimenko, O.; Cavarec, L.; Palicio, M.; Abderrahim, H.; Bougueleret, L.; Barry, C.; Tanaka, H.; La Rosa, P.; et al. Genetic and physiological data implicating the new human gene G72 and the gene for D-amino acid oxidase in schizophrenia. Proc. Natl. Acad. Sci. USA 2002, 99, 13675–13680. [Google Scholar] [CrossRef] [PubMed] [Green Version]
  2. Detera-Wadleigh, S.D.; McMahon, F.J. G72/G30 in schizophrenia and bipolar disorder: Review and meta-analysis. Biol. Psychiatry 2006, 60, 106–114. [Google Scholar] [CrossRef] [PubMed]
  3. Sacchi, S.; Binelli, G.; Pollegioni, L. G72 primate-specific gene: A still enigmatic element in psychiatric disorders. Cell. Mol. Life Sci. 2016, 73, 2029–2039. [Google Scholar] [CrossRef] [PubMed]
  4. Akyol, E.S.; Albayrak, Y.; Aksoy, N.; Sahin, B.; Beyazyuz, M.; Kuloglu, M.; Hashimoto, K. Increased serum G72 protein levels in patients with schizophrenia: A potential candidate biomarker. Acta Neuropsychiatr. 2017, 29, 80–86. [Google Scholar] [CrossRef] [PubMed]
  5. Korostishevsky, M.; Kaganovich, M.; Cholostoy, A.; Ashkenazi, M.; Ratner, Y.; Dahary, D.; Bernstein, J.; Bening-Abu-Shach, U.; Ben Asher, E.; Lancet, D.; et al. Is the G72/G30 locus associated with schizophrenia? single nucleotide polymorphisms, haplotypes, and gene expression analysis. Biol. Psychiatry 2004, 56, 169–176. [Google Scholar] [CrossRef] [PubMed]
  6. Otte, D.M.; Bilkei-Gorzo, A.; Filiou, M.D.; Turck, C.W.; Yilmaz, O.; Holst, M.I.; Schilling, K.; Abou-Jamra, R.; Schumacher, J.; Benzel, I.; et al. Behavioral changes in G72/G30 transgenic mice. Eur. Neuropsychopharmacol. 2009, 19, 339–348. [Google Scholar] [CrossRef] [PubMed]
  7. Otte, D.M.; Sommersberg, B.; Kudin, A.; Guerrero, C.; Albayram, O.; Filiou, M.D.; Frisch, P.; Yilmaz, O.; Drews, E.; Turck, C.W.; et al. N-acetyl cysteine treatment rescues cognitive deficits induced by mitochondrial dysfunction in G72/G30 transgenic mice. Neuropsychopharmacology 2011, 36, 2233–2243. [Google Scholar] [CrossRef] [PubMed] [Green Version]
  8. Filiou, M.D.; Turck, C.W. Psychiatric disorder biomarker discovery using quantitative proteomics. Methods Mol. Biol. 2012, 829, 531–539. [Google Scholar] [PubMed]
  9. Filiou, M.D.; Teplytska, L.; Otte, D.M.; Zimmer, A.; Turck, C.W. Myelination and oxidative stress alterations in the cerebellum of the G72/G30 transgenic schizophrenia mouse model. J. Psychiatr. Res. 2012, 46, 1359–1365. [Google Scholar] [CrossRef] [PubMed]
  10. Frank, E.; Kessler, M.S.; Filiou, M.D.; Zhang, Y.; Maccarrone, G.; Reckow, S.; Bunck, M.; Heumann, H.; Turck, C.W.; Landgraf, R.; et al. Stable isotope metabolic labeling with a novel N-enriched bacteria diet for improved proteomic analyses of mouse models for psychopathologies. PLoS ONE 2009, 4, e7821. [Google Scholar] [CrossRef] [PubMed]
  11. Filiou, M.D.; Zhang, Y.; Teplytska, L.; Reckow, S.; Gormanns, P.; Maccarrone, G.; Frank, E.; Kessler, M.S.; Hambsch, B.; Nussbaumer, M.; et al. Proteomics and metabolomics analysis of a trait anxiety mouse model reveals divergent mitochondrial pathways. Biol. Psychiatry 2011, 70, 1074–1082. [Google Scholar] [CrossRef] [PubMed]
  12. Filiou, M.D.; Bisle, B.; Reckow, S.; Teplytska, L.; Maccarrone, G.; Turck, C.W. Profiling of mouse synaptosome proteome and phosphoproteome by IEF. Electrophoresis 2010, 31, 1294–1301. [Google Scholar] [CrossRef] [PubMed]
  13. Maccarrone, G.; Chen, A.; Filiou, M.D. Using 15N-Metabolic Labeling for Quantitative Proteomic Analyses. Methods Mol. Biol. 2017, 1546, 235–243. [Google Scholar]
  14. Deutsch, E.W.; Mendoza, L.; Shteynberg, D.; Farrah, T.; Lam, H.; Tasman, N.; Sun, Z.; Nilsson, E.; Pratt, B.; Prazen, B.; et al. A guided tour of the Trans-Proteomic Pipeline. Proteomics 2010, 10, 1150–1159. [Google Scholar] [CrossRef] [PubMed] [Green Version]
  15. Filiou, M.D.; Varadarajulu, J.; Teplytska, L.; Reckow, S.; Maccarrone, G.; Turck, C.W. The 15N isotope effect in Escherichia coli: A neutron can make the difference. Proteomics 2012, 12, 3121–3128. [Google Scholar] [CrossRef] [PubMed]
  16. Filiou, M.D.; Asara, J.M.; Nussbaumer, M.; Teplytska, L.; Landgraf, R.; Turck, C.W. Behavioral extremes of trait anxiety in mice are characterized by distinct metabolic profiles. J. Psychiatr. Res. 2014, 58, 115–122. [Google Scholar] [CrossRef] [PubMed]
  17. Webhofer, C.; Gormanns, P.; Reckow, S.; Lebar, M.; Maccarrone, G.; Ludwig, T.; Pütz, B.; Asara, J.M.; Holsboer, F.; Sillaber, I.; et al. Proteomic and metabolomic profiling reveals time-dependent changes in hippocampal metabolism upon paroxetine treatment and biomarker candidates. J. Psychiatr. Res. 2013, 47, 289–298. [Google Scholar] [CrossRef] [PubMed]
  18. Yuan, M.; Breitkopf, S.B.; Yang, X.M.; Asara, J.M. A positive/negative ion-switching, targeted mass spectrometry-based metabolomics platform for bodily fluids, cells, and fresh and fixed tissue. Nat. Protoc. 2012, 7, 872–881. [Google Scholar] [CrossRef] [PubMed] [Green Version]
  19. Pang, Z.; Chong, J.; Zhou, G.; de Lima Morais, D.A.; Chang, L.; Barrette, M.; Gauthier, C.; Jacques, P.E.; Li, S.; Xia, J. MetaboAnalyst 5.0: Narrowing the gap between raw spectra and functional insights. Nucleic Acids Res. 2021, 49, W388–W396. [Google Scholar] [CrossRef] [PubMed]
  20. Harrison, P.J. The hippocampus in schizophrenia: A review of the neuropathological evidence and its pathophysiological implications. Psychopharmacology 2004, 174, 151–162. [Google Scholar] [CrossRef]
  21. Haukvik, U.K.; Westlye, L.T.; Morch-Johnsen, L.; Jorgensen, K.N.; Lange, E.H.; Dale, A.M.; Melle, I.; Andreassen, O.A.; Agartz, I. In vivo hippocampal subfield volumes in schizophrenia and bipolar disorder. Biol. Psychiatry 2015, 77, 581–588. [Google Scholar] [CrossRef] [PubMed] [Green Version]
  22. Maas, D.A.; Eijsink, V.D.; Spoelder, M.; van Hulten, J.A.; De Weerd, P.; Homberg, J.R.; Valles, A.; Nait-Oumesmar, B.; Martens, G.J.M. Interneuron hypomyelination is associated with cognitive inflexibility in a rat model of schizophrenia. Nat. Commun. 2020, 11, 2329. [Google Scholar] [CrossRef] [PubMed]
  23. Smirnova, L.P.; Yarnykh, V.L.; Parshukova, D.A.; Kornetova, E.G.; Semke, A.V.; Usova, A.V.; Pishchelko, A.O.; Khodanovich, M.Y.; Ivanova, S.A. Global hypomyelination of the brain white and gray matter in schizophrenia: Quantitative imaging using macromolecular proton fraction. Transl. Psychiatry 2021, 11, 365. [Google Scholar] [CrossRef] [PubMed]
  24. Martins-de-Souza, D.; Maccarrone, G.; Wobrock, T.; Zerr, I.; Gormanns, P.; Reckow, S.; Falkai, P.; Schmitt, A.; Turck, C.W. Proteome analysis of the thalamus and cerebrospinal fluid reveals glycolysis dysfunction and potential biomarkers candidates for schizophrenia. J. Psychiatr. Res. 2010, 44, 1176–1189. [Google Scholar] [CrossRef]
  25. Saia-Cereda, V.M.; Cassoli, J.S.; Schmitt, A.; Falkai, P.; Nascimento, J.M.; Martins-de-Souza, D. Proteomics of the corpus callosum unravel pivotal players in the dysfunction of cell signaling, structure, and myelination in schizophrenia brains. Eur. Arch. Psychiatry Clin. Neurosci. 2015, 265, 601–612. [Google Scholar] [CrossRef]
  26. Martins-de-Souza, D.; Gattaz, W.F.; Schmitt, A.; Maccarrone, G.; Hunyadi-Gulyas, E.; Eberlin, M.N.; Souza, G.H.M.F.; Marangoni, S.; Novello, J.C.; Turck, C.W.; et al. Proteomic analysis of dorsolateral prefrontal cortex indicates the involvement of cytoskeleton, oligodendrocyte, energy metabolism and new potential markers in schizophrenia. J. Psychiatr. Res. 2009, 43, 978–986. [Google Scholar] [CrossRef]
  27. Marui, T.; Torii, Y.; Iritani, S.; Sekiguchi, H.; Habuchi, C.; Fujishiro, H.; Oshima, K.; Niizato, K.; Hayashida, S.; Masaki, K.; et al. The neuropathological study of myelin oligodendrocyte glycoprotein in the temporal lobe of schizophrenia patients. Acta Neuropsychiatr. 2018, 30, 232–240. [Google Scholar] [CrossRef]
  28. Falkai, P.; Malchow, B.; Wetzestein, K.; Nowastowski, V.; Bernstein, H.G.; Steiner, J.; Schneider-Axmann, T.; Kraus, T.; Hasan, A.; Bogerts, B.; et al. Decreased Oligodendrocyte and Neuron Number in Anterior Hippocampal Areas and the Entire Hippocampus in Schizophrenia: A Stereological Postmortem Study. Schizophr. Bull. 2016, 42 (Suppl. S1), S4–S12. [Google Scholar] [CrossRef]
  29. Wood, P.L.; Filiou, M.D.; Otte, D.M.; Zimmer, A.; Turck, C.W. Lipidomics reveals dysfunctional glycosynapses in schizophrenia and the G72/G30 transgenic mouse. Schizophr. Res. 2014, 159, 365–369. [Google Scholar] [CrossRef]
  30. Kedracka-Krok, S.; Swiderska, B.; Jankowska, U.; Skupien-Rabian, B.; Solich, J.; Dziedzicka-Wasylewska, M. Stathmin reduction and cytoskeleton rearrangement in rat nucleus accumbens in response to clozapine and risperidone treatment—Comparative proteomic study. Neuroscience 2016, 316, 63–81. [Google Scholar] [CrossRef]
  31. Maheras, K.J.; Peppi, M.; Ghoddoussi, F.; Galloway, M.P.; Perrine, S.A.; Gow, A. Absence of Claudin 11 in CNS Myelin Perturbs Behavior and Neurotransmitter Levels in Mice. Sci. Rep. 2018, 8, 3798. [Google Scholar] [CrossRef] [PubMed]
  32. Faludi, G.; Mirnics, K. Synaptic changes in the brain of subjects with schizophrenia. Int. J. Dev. Neurosci. 2011, 29, 305–309. [Google Scholar] [CrossRef] [PubMed] [Green Version]
  33. Egbujo, C.N.; Sinclair, D.; Hahn, C.G. Dysregulations of Synaptic Vesicle Trafficking in Schizophrenia. Curr. Psychiatry Rep. 2016, 18, 77. [Google Scholar] [CrossRef] [PubMed] [Green Version]
  34. Berdenis van Berlekom, A.; Muflihah, C.H.; Snijders, G.; MacGillavry, H.D.; Middeldorp, J.; Hol, E.M.; Kahn, R.S.; De Witte, L.D. Synapse Pathology in Schizophrenia: A Meta-analysis of Postsynaptic Elements in Postmortem Brain Studies. Schizophr. Bull. 2020, 46, 374–386. [Google Scholar] [CrossRef] [Green Version]
  35. Chen, C.H.; Huang, Y.S.; Liao, D.L.; Huang, C.Y.; Lin, C.H.; Fang, T.H. Identification of Rare Mutations of Two Presynaptic Cytomatrix Genes BSN and PCLO in Schizophrenia and Bipolar Disorder. J. Pers. Med. 2021, 11, 1057. [Google Scholar] [CrossRef]
  36. Weidenhofer, J.; Bowden, N.A.; Scott, R.J.; Tooney, P.A. Altered gene expression in the amygdala in schizophrenia: Up-regulation of genes located in the cytomatrix active zone. Mol. Cell. Neurosci. 2006, 31, 243–250. [Google Scholar] [CrossRef]
  37. Nitta, A.; Izuo, N.; Hamatani, K.; Inagaki, R.; Kusui, Y.; Fu, K.; Asano, T.; Torri, Y.; Habuchi, C.; Sekiguchi, H.; et al. Schizophrenia-Like Behavioral Impairments in Mice with Suppressed Expression of Piccolo in the Medial Prefrontal Cortex. J. Pers. Med. 2021, 11, 607. [Google Scholar] [CrossRef]
  38. Popiolek, M.; Ross, J.F.; Charych, E.; Chanda, P.; Gundelfinger, E.D.; Moss, S.J.; Brandon, N.J.; Pausch, M.H. D-amino acid oxidase activity is inhibited by an interaction with bassoon protein at the presynaptic active zone. J. Biol. Chem. 2011, 286, 28867–28875. [Google Scholar] [CrossRef] [Green Version]
  39. Turck, C.W.; Filiou, M.D. What Have Mass Spectrometry-Based Proteomics and Metabolomics (Not) Taught Us about Psychiatric Disorders? Mol. Neuropsychiatry 2015, 1, 69–75. [Google Scholar] [CrossRef] [Green Version]
  40. Iliou, A.; Vlaikou, A.M.; Nussbaumer, M.; Benaki, D.; Mikros, E.; Gikas, E.; Filiou, M.D. Exploring the metabolomic profile of cerebellum after exposure to acute stress. Stress 2021, 24, 952–964. [Google Scholar] [CrossRef]
  41. Filiou, M.D.; Nussbaumer, M.; Teplytska, L.; Turck, C.W. Behavioral and Metabolome Differences between C57BL/6 and DBA/2 Mouse Strains: Implications for Their Use as Models for Depression- and Anxiety-Like Phenotypes. Metabolites 2021, 11, 128. [Google Scholar] [CrossRef] [PubMed]
  42. Papadopoulou, Z.; Vlaikou, A.M.; Theodoridou, D.; Komini, C.; Chalkiadaki, G.; Vafeiadi, M.; Margetaki, K.; Trangas, K.; Turck, C.W.; Syrrou, M.; et al. Unraveling the Serum Metabolomic Profile of Post-partum Depression. Front. Neurosci. 2019, 13, 833. [Google Scholar] [CrossRef] [PubMed]
  43. Zhang, Y.; Filiou, M.D.; Reckow, S.; Gormanns, P.; Maccarrone, G.; Kessler, M.S.; Frank, E.; Hambsch, B.; Holsboer, F.; Landgraf, R.; et al. Proteomic and metabolomic profiling of a trait anxiety mouse model implicate affected pathways. Mol. Cell. Proteom. 2011, 10, M111.008110. [Google Scholar] [CrossRef] [PubMed] [Green Version]
  44. Chousidis, I.; Chatzimitakos, T.; Leonardos, D.; Filiou, M.D.; Stalikas, C.D.; Leonardos, I.D. Cannabinol in the spotlight: Toxicometabolomic study and behavioral analysis of zebrafish embryos exposed to the unknown cannabinoid. Chemosphere 2020, 252, 126417. [Google Scholar] [CrossRef]
  45. Weckmann, K.; Deery, M.J.; Howard, J.A.; Feret, R.; Asara, J.M.; Dethloff, F.; Filiou, M.D.; Labermaier, C.; Maccarrone, M.; Lilley, K.S. Ketamine’s Effects on the Glutamatergic and GABAergic Systems: A Proteomics and Metabolomics Study in Mice. Mol. Neuropsychiatry 2019, 5, 42–51. [Google Scholar] [CrossRef]
  46. Weckmann, K.; Deery, M.J.; Howard, J.A.; Feret, R.; Asara, J.M.; Dethloff, F.; Filiou, M.D.; Iannace, J.; Labermaier, C.; Maccarrone, G.; et al. Ketamine’s antidepressant effect is mediated by energy metabolism and antioxidant defense system. Sci. Rep. 2017, 7, 15788. [Google Scholar] [CrossRef] [Green Version]
  47. Park, D.I.; Dournes, C.; Sillaber, I.; Ising, M.; Asara, J.M.; Webhofer, C.; Filiou, M.D.; Müller, M.B.; Turck, C.W. Delineation of molecular pathway activities of the chronic antidepressant treatment response suggests important roles for glutamatergic and ubiquitin-proteasome systems. Transl. Psychiatry 2017, 7, e1078. [Google Scholar] [CrossRef] [Green Version]
  48. Park, D.I.; Dournes, C.; Sillaber, I.; Uhr, M.; Asara, J.M.; Gassen, N.C.; Rein, T.; Ising, M.; Webhofer, C.; Filiou, M.D.; et al. Purine and pyrimidine metabolism: Convergent evidence on chronic antidepressant treatment response in mice and humans. Sci. Rep. 2016, 6, 35317. [Google Scholar] [CrossRef] [Green Version]
  49. Nussbaumer, M.; Asara, J.M.; Teplytska, L.; Murphy, M.P.; Logan, A.; Turck, C.W.; Filiou, M.D. Selective Mitochondrial Targeting Exerts Anxiolytic Effects In Vivo. Neuropsychopharmacology 2016, 41, 1751–1758. [Google Scholar] [CrossRef] [Green Version]
  50. Kao, C.Y.; He, Z.; Henes, K.; Asara, J.M.; Webhofer, C.; Filiou, M.D.; Khaitovich, P.; Wotjak, C.T.; Turck, C.W. Fluoxetine Treatment Rescues Energy Metabolism Pathway Alterations in a Posttraumatic Stress Disorder Mouse Model. Mol. Neuropsychiatry 2016, 2, 46–59. [Google Scholar] [CrossRef]
  51. Periyasamy, S.; John, S.; Padmavati, R.; Rajendren, P.; Thirunavukkarasu, P.; Gratten, J.; Vinkhuizen, A.; McRae, A.; Holliday, E.G.; Nyholt, D.R. Association of Schizophrenia Risk With Disordered Niacin Metabolism in an Indian Genome-wide Association Study. JAMA Psychiatry 2019, 76, 1026–1034. [Google Scholar] [CrossRef] [PubMed]
  52. Messamore, E. The niacin response biomarker as a schizophrenia endophenotype: A status update. Prostaglandins Leukot. Essent. Fat. Acids 2018, 136, 95–97. [Google Scholar] [CrossRef] [PubMed]
  53. Otte, D.M.; Raskó, T.; Wang, M.; Dreiseidler, M.; Drews, E.; Schrage, H.; Wojtalla, A.; Hohfeld, J.; Wanker, E.; Zimmer, A. Identification of the mitochondrial MSRB2 as a binding partner of LG72. Cell. Mol. Neurobiol. 2014, 34, 1123–1130. [Google Scholar] [CrossRef] [PubMed] [Green Version]
  54. Filiou, M.D.; Sandi, C. Anxiety and Brain Mitochondria: A Bidirectional Crosstalk. Trends Neurosci. 2019, 42, 573–588. [Google Scholar] [CrossRef] [PubMed]
  55. Pei, L.; Wallace, D.C. Mitochondrial Etiology of Neuropsychiatric Disorders. Biol. Psychiatry 2018, 83, 722–730. [Google Scholar] [CrossRef] [PubMed]
Figure 1. Experimental design. Transgenic mice carrying the G72/G30 locus (G72Tg) vs. wild-type (WT) male mice hippocampi were compared by 15N metabolic labeling-based quantitative proteomics and targeted metabolomics. Selected protein expression alterations were verified in a larger cohort of G72Tg and WT mice.
Jpm 12 00244 g001
Figure 2. Altered protein networks in G72Tg compared to WT hippocampi. Each node represents a protein. Lines connecting the nodes indicate functional and physical associations between the respective proteins. Line color denotes the type of evidence for the reported association, as indexed in the figure. Full protein names are listed in Table 1. The figure was generated by STRING (https://string-db.org, v.11.5).
Jpm 12 00244 g002
Figure 3. Decreased nicotinate levels in G72Tg compared to WT hippocampi. FDR: 0.015, p = 0.000184 q = 0.0206. Data are presented as box and whisker plots (n = 6 per group).
Jpm 12 00244 g003
Figure 4. Decreased expression of myelin proteins in G72Tg compared to WT hippocampi. Decreased expression of (A) Mog (** p = 0.0089) (B) Cldn11 (** p = 0.0089) and (C) Plp (* p = 0.0147) in the cytoplasm of G72Tg (n = 10) compared to WT (n = 10) hippocampi. Data are presented as mean ± standard error of the mean (SEM).
Jpm 12 00244 g004
Table 1. Differentially expressed proteins in the hippocampi of G72Tg and WT mice (fold change > 1.3, adjusted p < 0.05).
ProteinProtein NameG72Tg/WT Fold ChangeAdjusted p-ValueProtein Groups
Decreased expression in G72Tg hippocampi
MobpMyelin-associated oligodendrocyte basic protein0.504.88409 × 10−5MOBP_MOUSE
Plp1Myelin proteolipid protein0.548.06522 × 10−81Q3UYM8_MOUSE, MYPR_MOUSE
Cldn11 (Osp)Claudin-11, oligodentrocyte-specific protein0.541.72045 × 10−9CLD11_MOUSE
MbpMyelin basic protein0.572.16222 × 10−24Q542T4_MOUSE
MogMyelin oligodentrocyte glycoprotein0.571.26402 × 10−9MOG_MOUSE, Q80YU5_MOUSE, Q3UY21_MOUSE
Cnp2′,3′-cyclic-nucleotide 3′-phosphodiesterase0.668.69626 × 10−23CN37_MOUSE, Q3TYV5_MOUSE
Sirt2NAD-dependent protein deacetylase sirtuin-20.710.001562104SIRT2_MOUSE, Q3UJK6_MOUSE
Increased expression in G72Tg hippocampi
BsnProtein bassoon1.411.34696 × 10−8BSN_MOUSE
Plec1Plectin1.410.015085062Q6S387_MOUSE, Q6S390_MOUSE, Q6S388_MOUSE, Q6S385_MOUSE, Q6S392_MOUSE, PLEC1_MOUSE, Q6S393_MOUSE
PcloProtein piccolo1.740.00012123PCLO_MOUSE
Publisher’s Note: MDPI stays neutral with regard to jurisdictional claims in published maps and institutional affiliations.

