
Retinal Microcirculation Changes in Crohn’s Disease Patients under Biologics, a Potential Biomarker of Severity: A Pilot Study

 , ,
, ,
Abstract
:1. Introduction
2. Materials and Methods
2.1. Design
2.2. Study Participants
2.3. Eye Examination
2.4. Clinical Assessment and Data Recording
2.5. Statistical Analysis
3. Results
4. Discussion
Limitations and Strengths
5. Conclusions
Supplementary Materials
Author Contributions
Funding
Institutional Review Board Statement
Informed Consent Statement
Data Availability Statement
Conflicts of Interest
References
- Cheifetz, A.S. Management of Active Crohn Disease. JAMA 2013, 309, 2150–2158. [Google Scholar] [CrossRef] [PubMed]
- Baumgart, D.C.; Sandborn, W.J. Crohn’s Disease. Lancet 2012, 380, 1590–1605. [Google Scholar] [CrossRef]
- Molodecky, N.A.; Soon, I.S.; Rabi, D.M.; Ghali, W.A.; Ferris, M.; Chernoff, G.; Benchimol, E.I.; Panaccione, R.; Ghosh, S.; Barkema, H.W.; et al. Increasing Incidence and Prevalence of the Inflammatory Bowel Diseases with Time, Based on Systematic Review. Gastroenterology 2012, 142, 46–54.e42. [Google Scholar] [CrossRef]
- Maaser, C.; Sturm, A.; Vavricka, S.R.; Kucharzik, T.; Fiorino, G.; Annese, V.; Calabrese, E.; Baumgart, D.C.; Bettenworth, D.; Borralho Nunes, P.; et al. ECCO-ESGAR Guideline for Diagnostic Assessment in IBD Part 1: Initial Diagnosis, Monitoring of Known IBD, Detection of Complications. J. Crohns Colitis 2019, 13, 144–164. [Google Scholar] [CrossRef] [PubMed]
- Gomollón, F.; Dignass, A.; Annese, V.; Tilg, H.; Van Assche, G.; Lindsay, J.O.; Peyrin-Biroulet, L.; Cullen, G.J.; Daperno, M.; Kucharzik, T.; et al. 3rd European Evidence-Based Consensus on the Diagnosis and Management of Crohn’s Disease 2016: Part 1: Diagnosis and Medical Management. J. Crohns Colitis 2017, 11, 3–25. [Google Scholar] [CrossRef]
- Vavricka, S.R.; Brun, L.; Ballabeni, P.; Pittet, V.; Prinz Vavricka, B.M.; Zeitz, J.; Rogler, G.; Schoepfer, A.M. Frequency and Risk Factors for Extraintestinal Manifestations in the Swiss Inflammatory Bowel Disease Cohort. Am. J. Gastroenterol. 2011, 106, 110–119. [Google Scholar] [CrossRef]
- Torres, J.; Bonovas, S.; Doherty, G.; Kucharzik, T.; Gisbert, J.P.; Raine, T.; Adamina, M.; Armuzzi, A.; Bachmann, O.; Bager, P.; et al. ECCO Guidelines on Therapeutics in Crohn’s Disease: Medical Treatment. J. Crohns Colitis 2020, 14, 4–22. [Google Scholar] [CrossRef]
- Schicho, R.; Marsche, G.; Storr, M. Cardiovascular Complications in Inflammatory Bowel Disease. Curr. Drug Targets 2015, 16, 181–188. [Google Scholar] [CrossRef]
- Kirchgesner, J.; Beaugerie, L.; Carrat, F.; Andersen, N.N.; Jess, T.; Schwarzinger, M.; BERENICE study group. Increased Risk of Acute Arterial Events in Young Patients and Severely Active IBD: A Nationwide French Cohort Study. Gut 2018, 67, 1261–1268. [Google Scholar] [CrossRef]
- Fumery, M.; Xiaocang, C.; Dauchet, L.; Gower-Rousseau, C.; Peyrin-Biroulet, L.; Colombel, J.-F. Thromboembolic Events and Cardiovascular Mortality in Inflammatory Bowel Diseases: A Meta-Analysis of Observational Studies. J. Crohns Colitis 2014, 8, 469–479. [Google Scholar] [CrossRef]
- Singh, S.; Singh, H.; Loftus, E.V.; Pardi, D.S. Risk of Cerebrovascular Accidents and Ischemic Heart Disease in Patients with Inflammatory Bowel Disease: A Systematic Review and Meta-Analysis. Clin. Gastroenterol. Hepatol. Off. Clin. Pract. J. Am. Gastroenterol. Assoc. 2014, 12, 382–393.e1. [Google Scholar] [CrossRef] [PubMed]
- Vadalà, M.; Castellucci, M.; Guarrasi, G.; Terrasi, M.; La Blasca, T.; Mulè, G. Retinal and Choroidal Vasculature Changes Associated with Chronic Kidney Disease. Graefes Arch. Clin. Exp. Ophthalmol. Albrecht Von Graefes Arch. Klin. Exp. Ophthalmol. 2019, 257, 1687–1698. [Google Scholar] [CrossRef] [PubMed]
- Cabrera DeBuc, D.; Somfai, G.M.; Koller, A. Retinal Microvascular Network Alterations: Potential Biomarkers of Cerebrovascular and Neural Diseases. Am. J. Physiol.-Heart Circ. Physiol. 2017, 312, H201–H212. [Google Scholar] [CrossRef] [PubMed]
- Arnould, L.; Guenancia, C.; Azemar, A.; Alan, G.; Pitois, S.; Bichat, F.; Zeller, M.; Gabrielle, P.-H.; Bron, A.M.; Creuzot-Garcher, C.; et al. The EYE-MI Pilot Study: A Prospective Acute Coronary Syndrome Cohort Evaluated With Retinal Optical Coherence Tomography Angiography. Investig. Ophthalmol. Vis. Sci. 2018, 59, 4299–4306. [Google Scholar] [CrossRef]
- Courtie, E.; Veenith, T.; Logan, A.; Denniston, A.K.; Blanch, R.J. Retinal Blood Flow in Critical Illness and Systemic Disease: A Review. Ann. Intensive Care 2020, 10, 152. [Google Scholar] [CrossRef]
- Nakayama, L.F.; Bergamo, V.C.; Conti, M.L.; Fares, N.T.; Costa, L.A.; Ambrogini, O.; de Moraes, N.S.B. The Retinal Foveal Avascular Zone as a Systemic Biomarker to Evaluate Inflammatory Bowel Disease Control. Int. J. Retin. Vitr. 2019, 5, 16. [Google Scholar] [CrossRef]
- Nakayama, L.F.; Bergamo, V.C.; de Conti, M.L.; Bueno, L.; de Moraes, N.S.B.; Ambrogini, O., Jr. Frequência de achados oftalmológicos de segmento posterior em pacientes com doença inflamatória intestinal. Arq. Gastroenterol. 2018, 55, 188–191. [Google Scholar] [CrossRef]
- Iacono, P.; Da Pozzo, S.; Bedendo, A.; Arrigo, A.; Parravano, M.; Varano, M.; Battaglia Parodi, M. OCT Retinal Angiography Features in Patients with Rheumatoid Arthritis: A Pilot Study. Eur. J. Ophthalmol. 2021, 11206721211035626. [Google Scholar] [CrossRef]
- Ayar, K.; Can, M.E.; Koca, N.; Çelik, D.Ş. Evaluation of Retinal Vascularization by Optical Coherence Tomography Angiography (OCTA) in Rheumatoid Arthritis, and Its Relationship with Disease Activity. Mod. Rheumatol. 2021, 31, 817–826. [Google Scholar] [CrossRef]
- Mihailovic, N.; Leclaire, M.D.; Eter, N.; Brücher, V.C. Altered Microvascular Density in Patients with Systemic Lupus Erythematosus Treated with Hydroxychloroquine—An Optical Coherence Tomography Angiography Study. Graefes Arch. Clin. Exp. Ophthalmol. 2020, 258, 2263–2269. [Google Scholar] [CrossRef]
- Kashani, A.H.; Chen, C.-L.; Gahm, J.K.; Zheng, F.; Richter, G.M.; Rosenfeld, P.J.; Shi, Y.; Wang, R.K. Optical Coherence Tomography Angiography: A Comprehensive Review of Current Methods and Clinical Applications. Prog. Retin. Eye Res. 2017, 60, 66–100. [Google Scholar] [CrossRef] [PubMed]
- Huang, D.; Jia, Y.; Gao, S.S.; Lumbroso, B.; Rispoli, M. Optical Coherence Tomography Angiography Using the Optovue Device. Dev. Ophthalmol. 2016, 56, 6–12. [Google Scholar] [CrossRef] [PubMed]
- Magrath, G.N.; Say, E.A.T.; Sioufi, K.; Ferenczy, S.; Samara, W.A.; Shields, C.L. Variability in Foveal Avascular Zone and Capillary Density Using Optical Coherence Tomography Angiography Machines In Healthy Eyes. Retina 2017, 37, 2102–2111. [Google Scholar] [CrossRef] [PubMed]
- Sturm, A.; Maaser, C.; Calabrese, E.; Annese, V.; Fiorino, G.; Kucharzik, T.; Vavricka, S.R.; Verstockt, B.; van Rheenen, P.; Tolan, D.; et al. ECCO-ESGAR Guideline for Diagnostic Assessment in IBD Part 2: IBD Scores and General Principles and Technical Aspects. J. Crohns Colitis 2019, 13, 273–284. [Google Scholar] [CrossRef] [PubMed]
- Satsangi, J.; Silverberg, M.S.; Vermeire, S.; Colombel, J. The Montreal Classification of Inflammatory Bowel Disease: Controversies, Consensus, and Implications. Gut 2006, 55, 749–753. [Google Scholar] [CrossRef]
- Benjamini, Y.; Hochberg, Y. Controlling the False Discovery Rate: A Practical and Powerful Approach to Multiple Testing. J. R. Stat. Soc. Ser. B Methodol. 1995, 57, 289–300. [Google Scholar] [CrossRef]
- Pearce, N. Analysis of Matched Case-Control Studies. BMJ 2016, 352, i969. [Google Scholar] [CrossRef]
- Yu, J.; Jiang, C.; Wang, X.; Zhu, L.; Gu, R.; Xu, H.; Jia, Y.; Huang, D.; Sun, X. Macular Perfusion in Healthy Chinese: An Optical Coherence Tomography Angiogram Study. Investig. Ophthalmol. Vis. Sci. 2015, 56, 3212–3217. [Google Scholar] [CrossRef]
- Tarassoly, K.; Miraftabi, A.; Soltan Sanjari, M.; Parvaresh, M.M. The Relationship between Foveal Avascular Zone Area, Vessel Density, and Cystoid Changes in Diabetic Retinopathy: An Optical Coherence Tomography Angiography Study. Retina 2018, 38, 1613–1619. [Google Scholar] [CrossRef]
- Grainge, M.J.; West, J.; Card, T.R. Venous Thromboembolism during Active Disease and Remission in Inflammatory Bowel Disease: A Cohort Study. Lancet 2010, 375, 657–663. [Google Scholar] [CrossRef]
- Yarur, A.J.; Deshpande, A.R.; Pechman, D.M.; Tamariz, L.; Abreu, M.T.; Sussman, D.A. Inflammatory Bowel Disease Is Associated with an Increased Incidence of Cardiovascular Events. Am. J. Gastroenterol. 2011, 106, 741–747. [Google Scholar] [CrossRef] [PubMed]
- Bernstein, C.N.; Wajda, A.; Blanchard, J.F. The Incidence of Arterial Thromboembolic Diseases in Inflammatory Bowel Disease: A Population-Based Study. Clin. Gastroenterol. Hepatol. Off. Clin. Pract. J. Am. Gastroenterol. Assoc. 2008, 6, 41–45. [Google Scholar] [CrossRef] [PubMed]
- Roberts-Thomson, I.C.; Fon, J.; Uylaki, W.; Cummins, A.G.; Barry, S. Cells, Cytokines and Inflammatory Bowel Disease: A Clinical Perspective. Expert Rev. Gastroenterol. Hepatol. 2011, 5, 703–716. [Google Scholar] [CrossRef]
- Sprague, A.H.; Khalil, R.A. Inflammatory Cytokines in Vascular Dysfunction and Vascular Disease. Biochem. Pharmacol. 2009, 78, 539–552. [Google Scholar] [CrossRef]
- Badimon, L.; Peña, E.; Arderiu, G.; Padró, T.; Slevin, M.; Vilahur, G.; Chiva-Blanch, G. C-Reactive Protein in Atherothrombosis and Angiogenesis. Front. Immunol. 2018, 9, 430. [Google Scholar] [CrossRef] [PubMed]
- Hingorani, A.D.; Cross, J.; Kharbanda, R.K.; Mullen, M.J.; Bhagat, K.; Taylor, M.; Donald, A.E.; Palacios, M.; Griffin, G.E.; Deanfield, J.E.; et al. Acute Systemic Inflammation Impairs Endothelium-Dependent Dilatation in Humans. Circulation 2000, 102, 994–999. [Google Scholar] [CrossRef]
- Ridker, P.M.; Danielson, E.; Fonseca, F.A.H.; Genest, J.; Gotto, A.M.; Kastelein, J.J.P.; Koenig, W.; Libby, P.; Lorenzatti, A.J.; MacFadyen, J.G.; et al. Rosuvastatin to Prevent Vascular Events in Men and Women with Elevated C-Reactive Protein. N. Engl. J. Med. 2008, 359, 2195–2207. [Google Scholar] [CrossRef]
- Le Gall, G.; Kirchgesner, J.; Bejaoui, M.; Landman, C.; Nion-Larmurier, I.; Bourrier, A.; Sokol, H.; Seksik, P.; Beaugerie, L. Clinical Activity Is an Independent Risk Factor of Ischemic Heart and Cerebrovascular Arterial Disease in Patients with Inflammatory Bowel Disease. PLoS ONE 2018, 13, e0201991. [Google Scholar] [CrossRef]
- Harbord, M.; Annese, V.; Vavricka, S.R.; Allez, M.; Barreiro-de Acosta, M.; Boberg, K.M.; Burisch, J.; De Vos, M.; De Vries, A.-M.; Dick, A.D.; et al. The First European Evidence-Based Consensus on Extra-Intestinal Manifestations in Inflammatory Bowel Disease. J. Crohns Colitis 2016, 10, 239–254. [Google Scholar] [CrossRef]
- Tam, L.-S.; Kitas, G.D.; González-Gay, M.A. Can Suppression of Inflammation by Anti-TNF Prevent Progression of Subclinical Atherosclerosis in Inflammatory Arthritis? Rheumatol. Oxf. Engl. 2014, 53, 1108–1119. [Google Scholar] [CrossRef]
- Kirchgesner, J.; Nyboe Andersen, N.; Carrat, F.; Jess, T.; Beaugerie, L.; BERENICE study group. Risk of Acute Arterial Events Associated with Treatment of Inflammatory Bowel Diseases: Nationwide French Cohort Study. Gut 2020, 69, 852–858. [Google Scholar] [CrossRef] [PubMed]
- Bonnin, P.; Coelho, J.; Pocard, M.; Levy, B.I.; Marteau, P. Anti-TNFα Therapy Early Improves Hemodynamics in Local Intestinal and Extraintestinal Circulations in Active Crohn’s Disease. J. Crohns Colitis 2013, 7, 451–459. [Google Scholar] [CrossRef] [PubMed]
- Anderson, T.J. Nitric Oxide, Atherosclerosis and the Clinical Relevance of Endothelial Dysfunction. Heart Fail. Rev. 2003, 8, 71–86. [Google Scholar] [CrossRef] [PubMed]
- Fouquet, S.; Vacca, O.; Sennlaub, F.; Paques, M. The 3D Retinal Capillary Circulation in Pigs Reveals a Predominant Serial Organization. Investig. Ophthalmol. Vis. Sci. 2017, 58, 5754–5763. [Google Scholar] [CrossRef] [PubMed]
- Kasumovic, A.; Matoc, I.; Rebic, D.; Avdagic, N.; Halimic, T. Assessment of Retinal Microangiopathy in Chronic Kidney Disease Patients. Med. Arch. 2020, 74, 191–194. [Google Scholar] [CrossRef]


| Moderate CD, N = 33 | Severe CD, N = 41 | p-Value a | |
|---|---|---|---|
| Age (years) | 43 (16) | 46 (12) | 0.39 |
| Sex (male), n (%) | 14 (42) | 19 (46) | 0.74 |
| Age at diagnosis (years) | 32 (15) | 29 (12) | 0.51 |
| Duration of disease (years) | 11 (9) | 17 (10) | 0.013 |
| CD behavior, n (%) b | |||
| Non-penetrating non-stricturing (B1) | 18 (55) | 8 (20) | 0.002 |
| Stricturing (B2) | 7 (21) | 14 (34) | 0.22 |
| Penetrating (B3) | 5 (15) | 16 (39) | 0.024 |
| CD location, n (%) c | 0.24 | ||
| Colonic (L2) | 6 (18) | 10 (25) | |
| Ileal (L1) | 18 (55) | 14 (35) | |
| Ileocolonic (L3) | 9 (27) | 16 (40) | |
| Isolated upper disease (L4) | 0 (0) | 0 (0) | |
| Peri-anal disease, n (%) | 0 (0) | 22 (54) | <0.001 |
| Past IBD-related surgery, n (%) | 0 (0) | 30 (73) | <0.001 |
| Clinical remission, n (%) | 25 (76) | 28 (68) | 0.61 |
| Deep remission, n (%) | 17 (55) | 17 (46) | 0.47 |
| Missing value | 2 | 4 | |
| Type of biologic, n (%) | 0.088 | ||
| Infliximab (anti TNF-α) | 24 (73) | 19 (46) | |
| Adalimumab (anti TNF-α) | 3 (9.1) | 3 (7.3) | |
| Guselkumab (anti IL-23) | 0 (0) | 1 (2.4) | |
| Ustekinumab (anti IL-12/IL-23) | 3 (9.1) | 7 (17) | |
| Vedolizumab (anti integrin α4-β7) | 1 (3.0) | 8 (20) | |
| Filgotinib (anti JAK) | 1 (3.0) | 0 (0) | |
| Rizankizumab (anti IL-23) | 1 (3.0) | 3 (7.3) | |
| Corticosteroid use, n (%) | 2 (6.1) | 1 (2.4) | 0.58 |
| Concomitant combination therapy, n (%) | 3 (9.1) | 6 (15) | 0.72 |
| Potential Confounders | Controls, N = 74 | Moderate CD, N = 33 | Severe CD, N = 41 | p-Value a |
|---|---|---|---|---|
| Age (years) | 44 (14) | 43 (16) | 46 (12) | 0.68 |
| Sex (male), n (%) | 33 (45) | 14 (42) | 19 (46) | 0.94 |
| Tobacco use, n (%) | 0.85 | |||
| Cessation | 10 (14) | 6 (18) | 6 (15) | |
| Current | 18 (24) | 9 (27) | 13 (32) | |
| No | 46 (62) | 18 (55) | 22 (54) | |
| Dyslipidemia history, n (%) | 2 (2.7) | 1 (3.0) | 2 (4.9) | 0.84 |
| Family cardiovascular history, n (%) | 8 (11) | 7 (21) | 9 (22) | 0.20 |
| BP: systolic/diastolic (mmHg) | 121 (19)/77 (9) | 123 (16)/77 (13) | 122 (17)/77 (10) | 0.81/0.88 |
| BMI (kg/m2) | 23.6 (3.3) | 23.4 (3.7) | 24.0 (4.2) | 0.82 |
| SE (Diopters) | −0.08 (1.60) | 0.56 (1.58) | −0.05 (1.23) | 0.20 |
| Missing value | 0 | 1 | 1 | |
| IOP (mmHg) | 14.18 (2.98) | 14.71 (2.31) | 14.31 (3.16) | 0.47 |
| Missing value | 0 | 2 | 2 | |
| Q-score | 8.3 (0.9) | 8.3 (0.9) | 8.2 (0.9) | ≥0.99 |
| Controls (1), N = 74 | Moderate CD (2), N = 33 | Severe CD (3), N = 41 | Global P a | BH P b | AUC c | |
|---|---|---|---|---|---|---|
| Microvasculature parameters | 0.75 | |||||
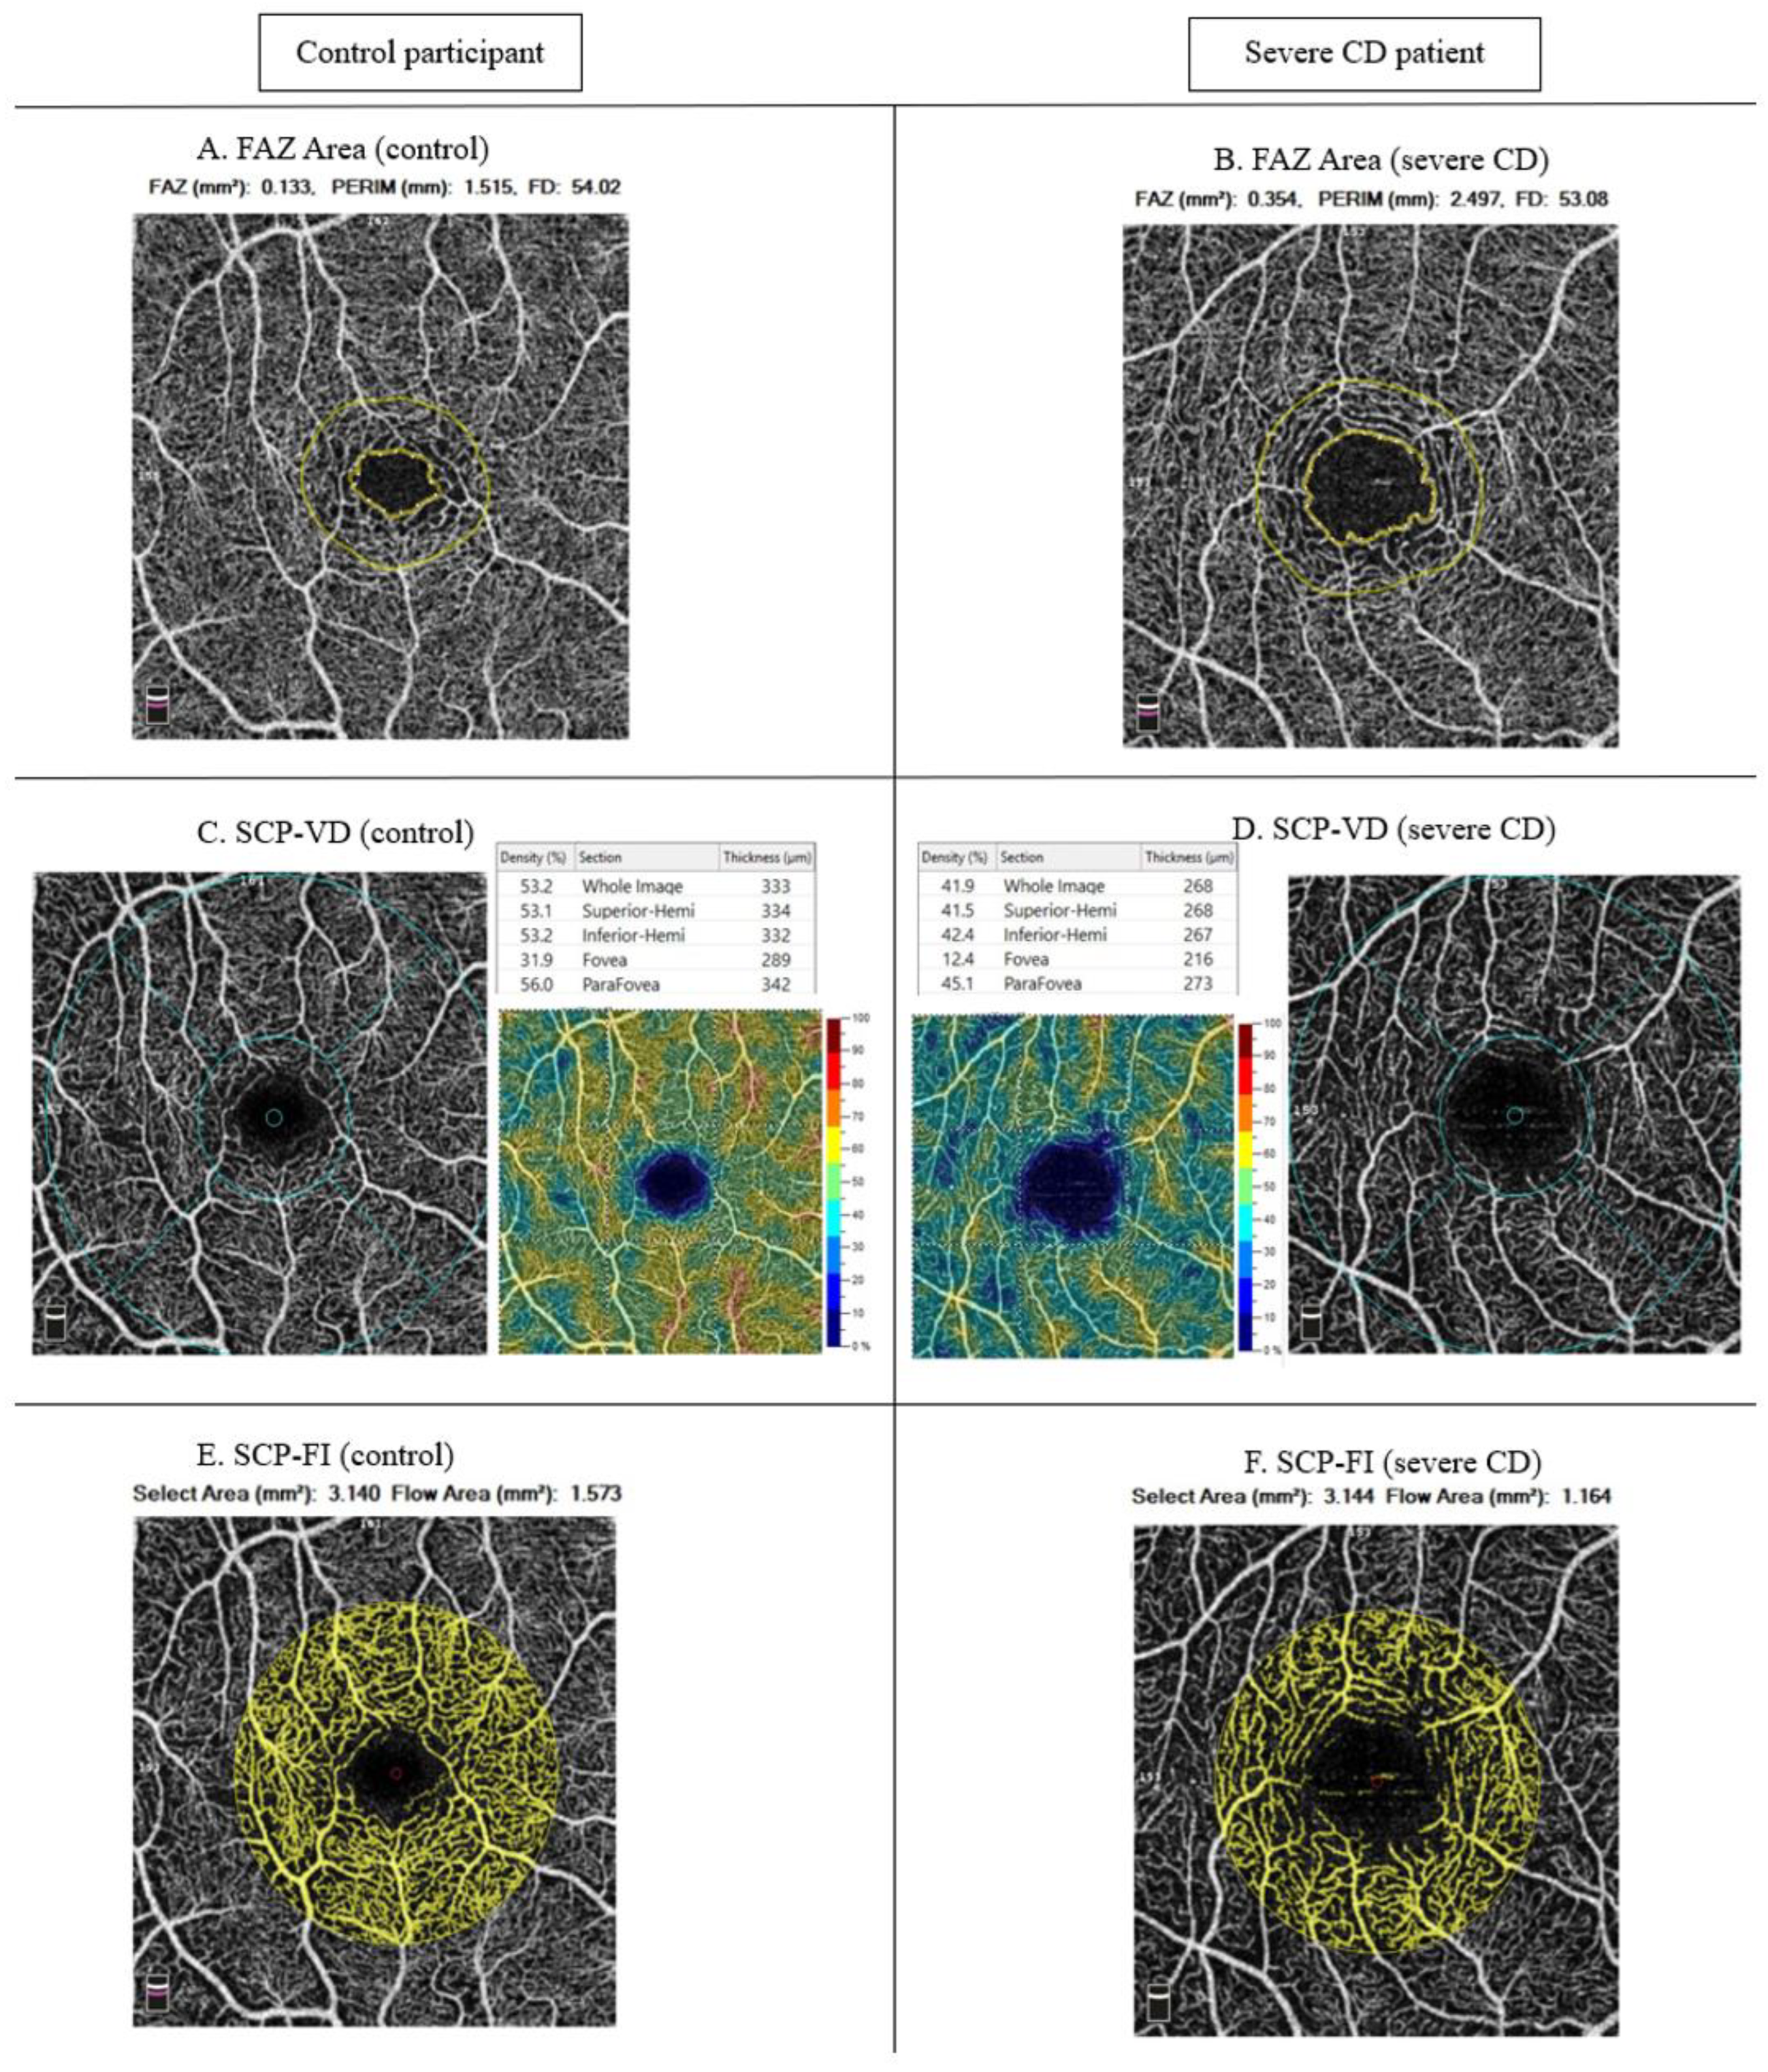
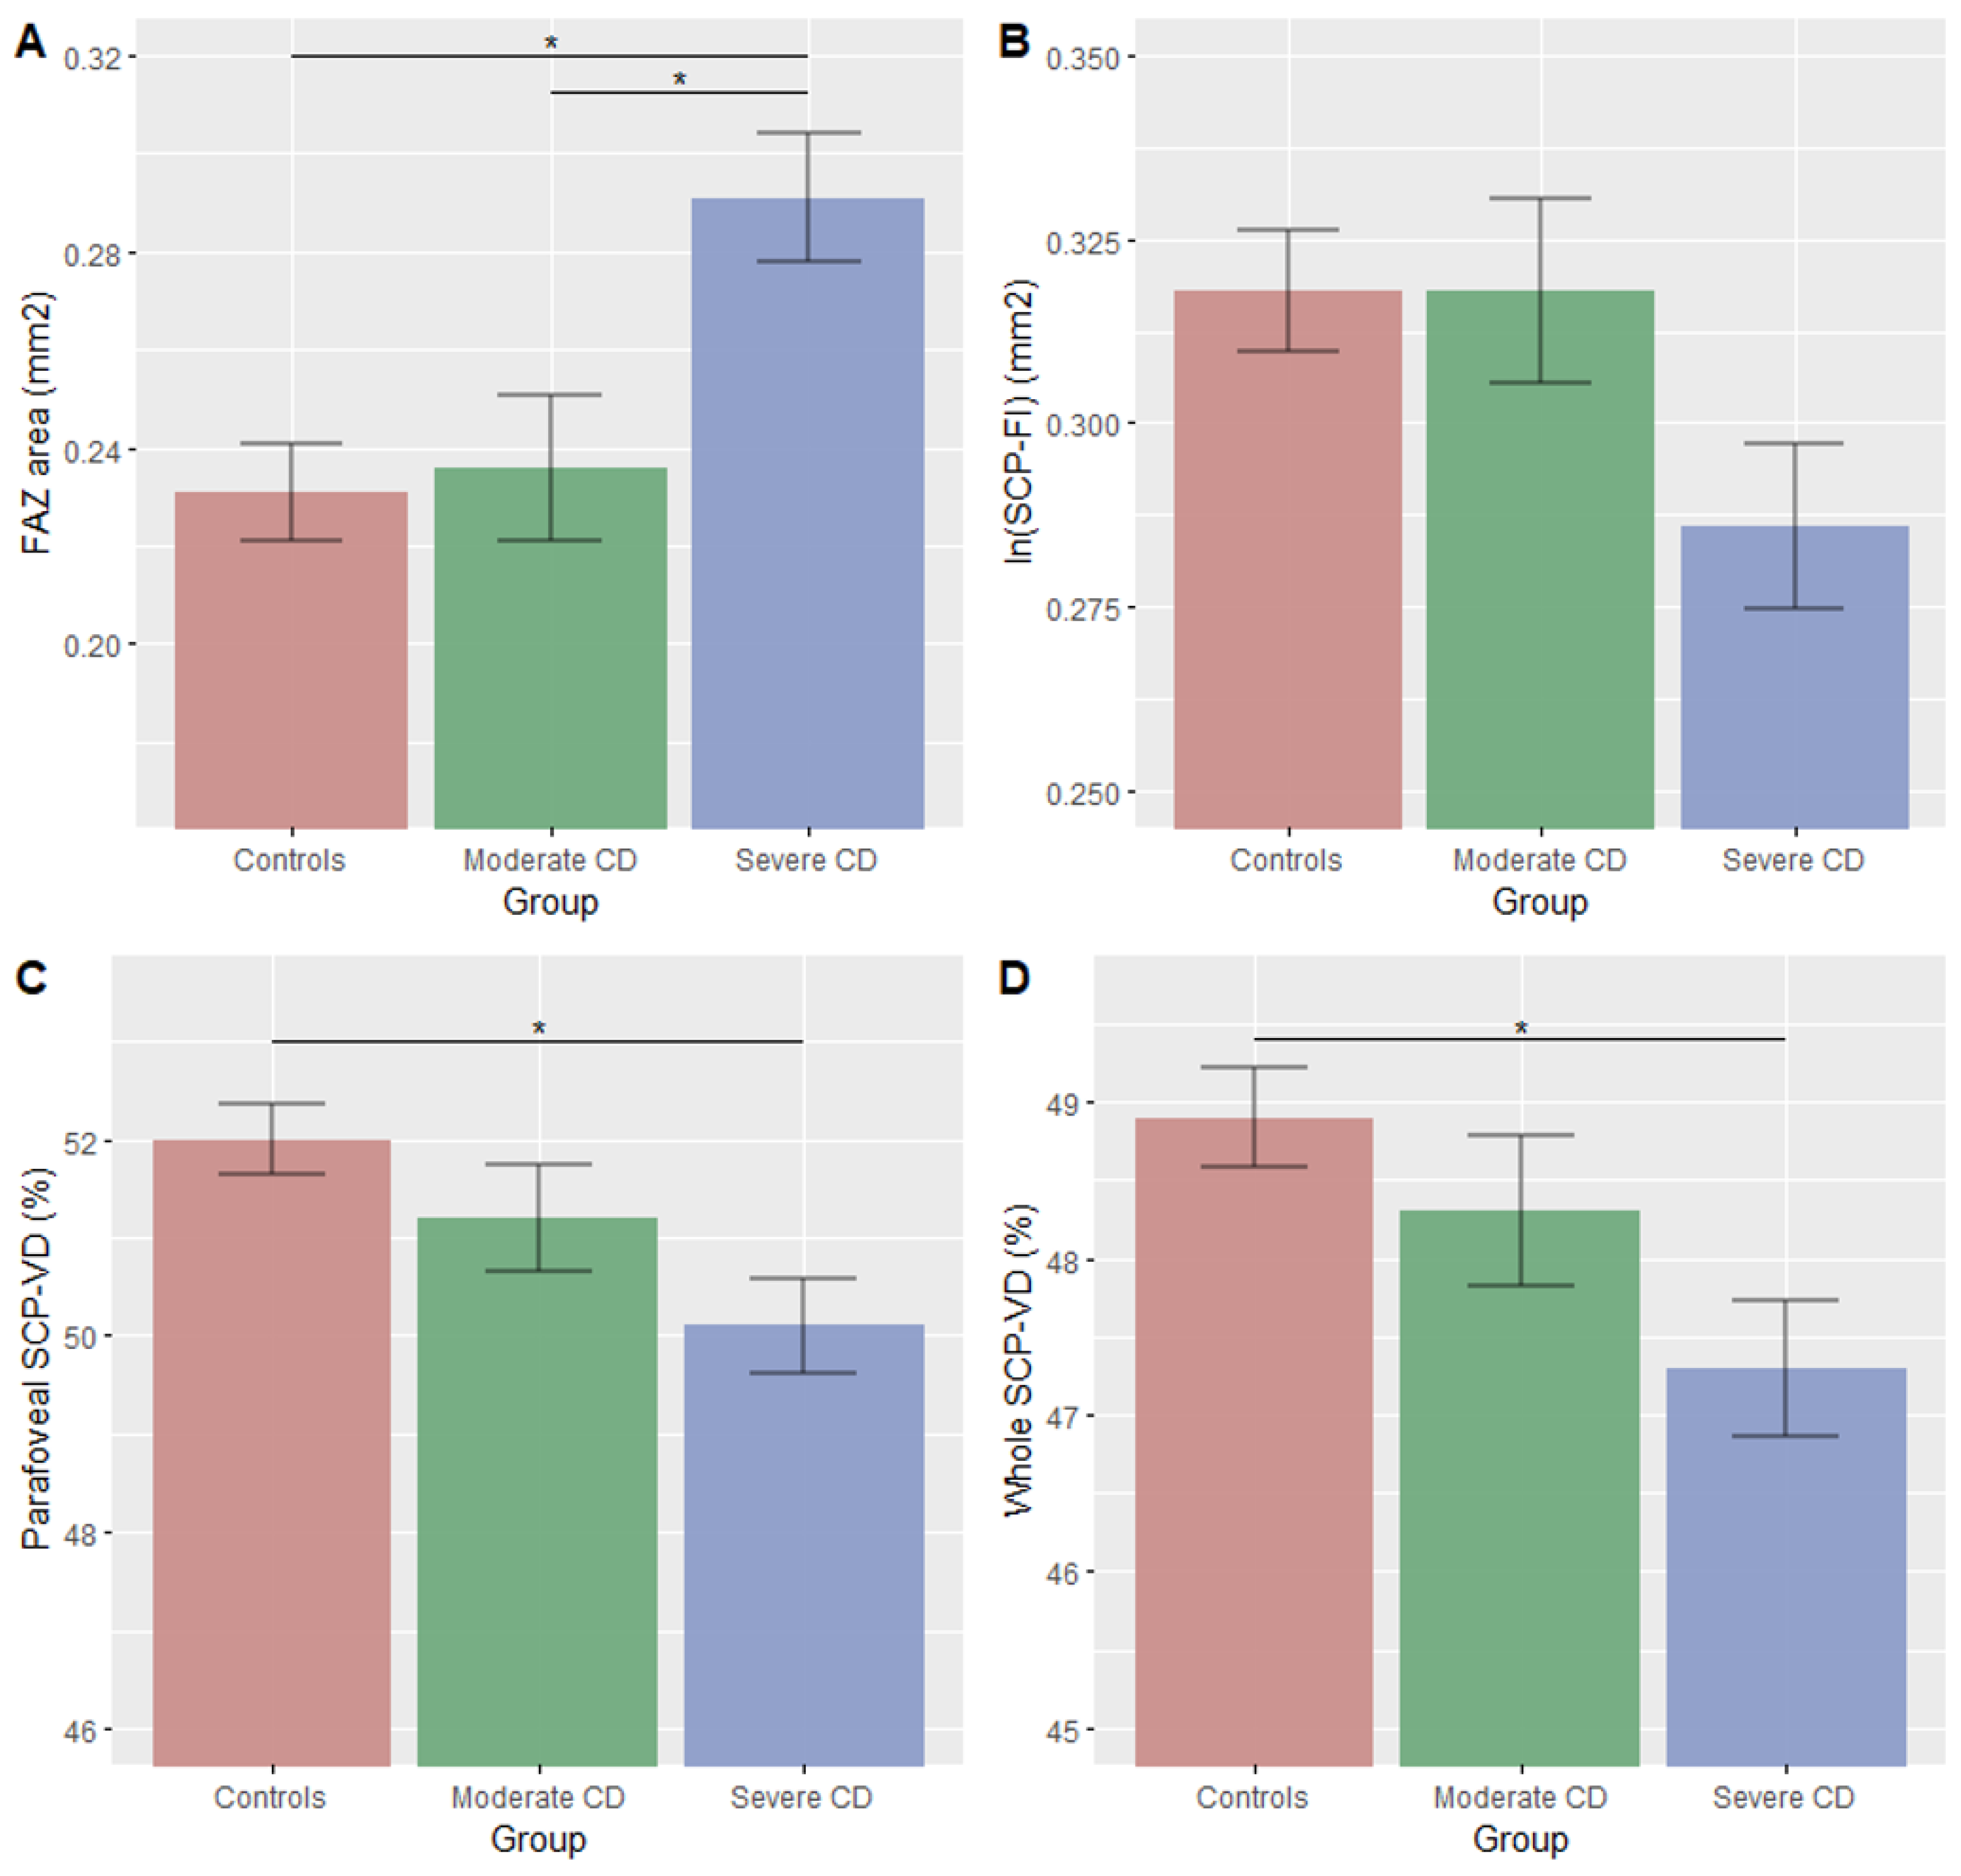
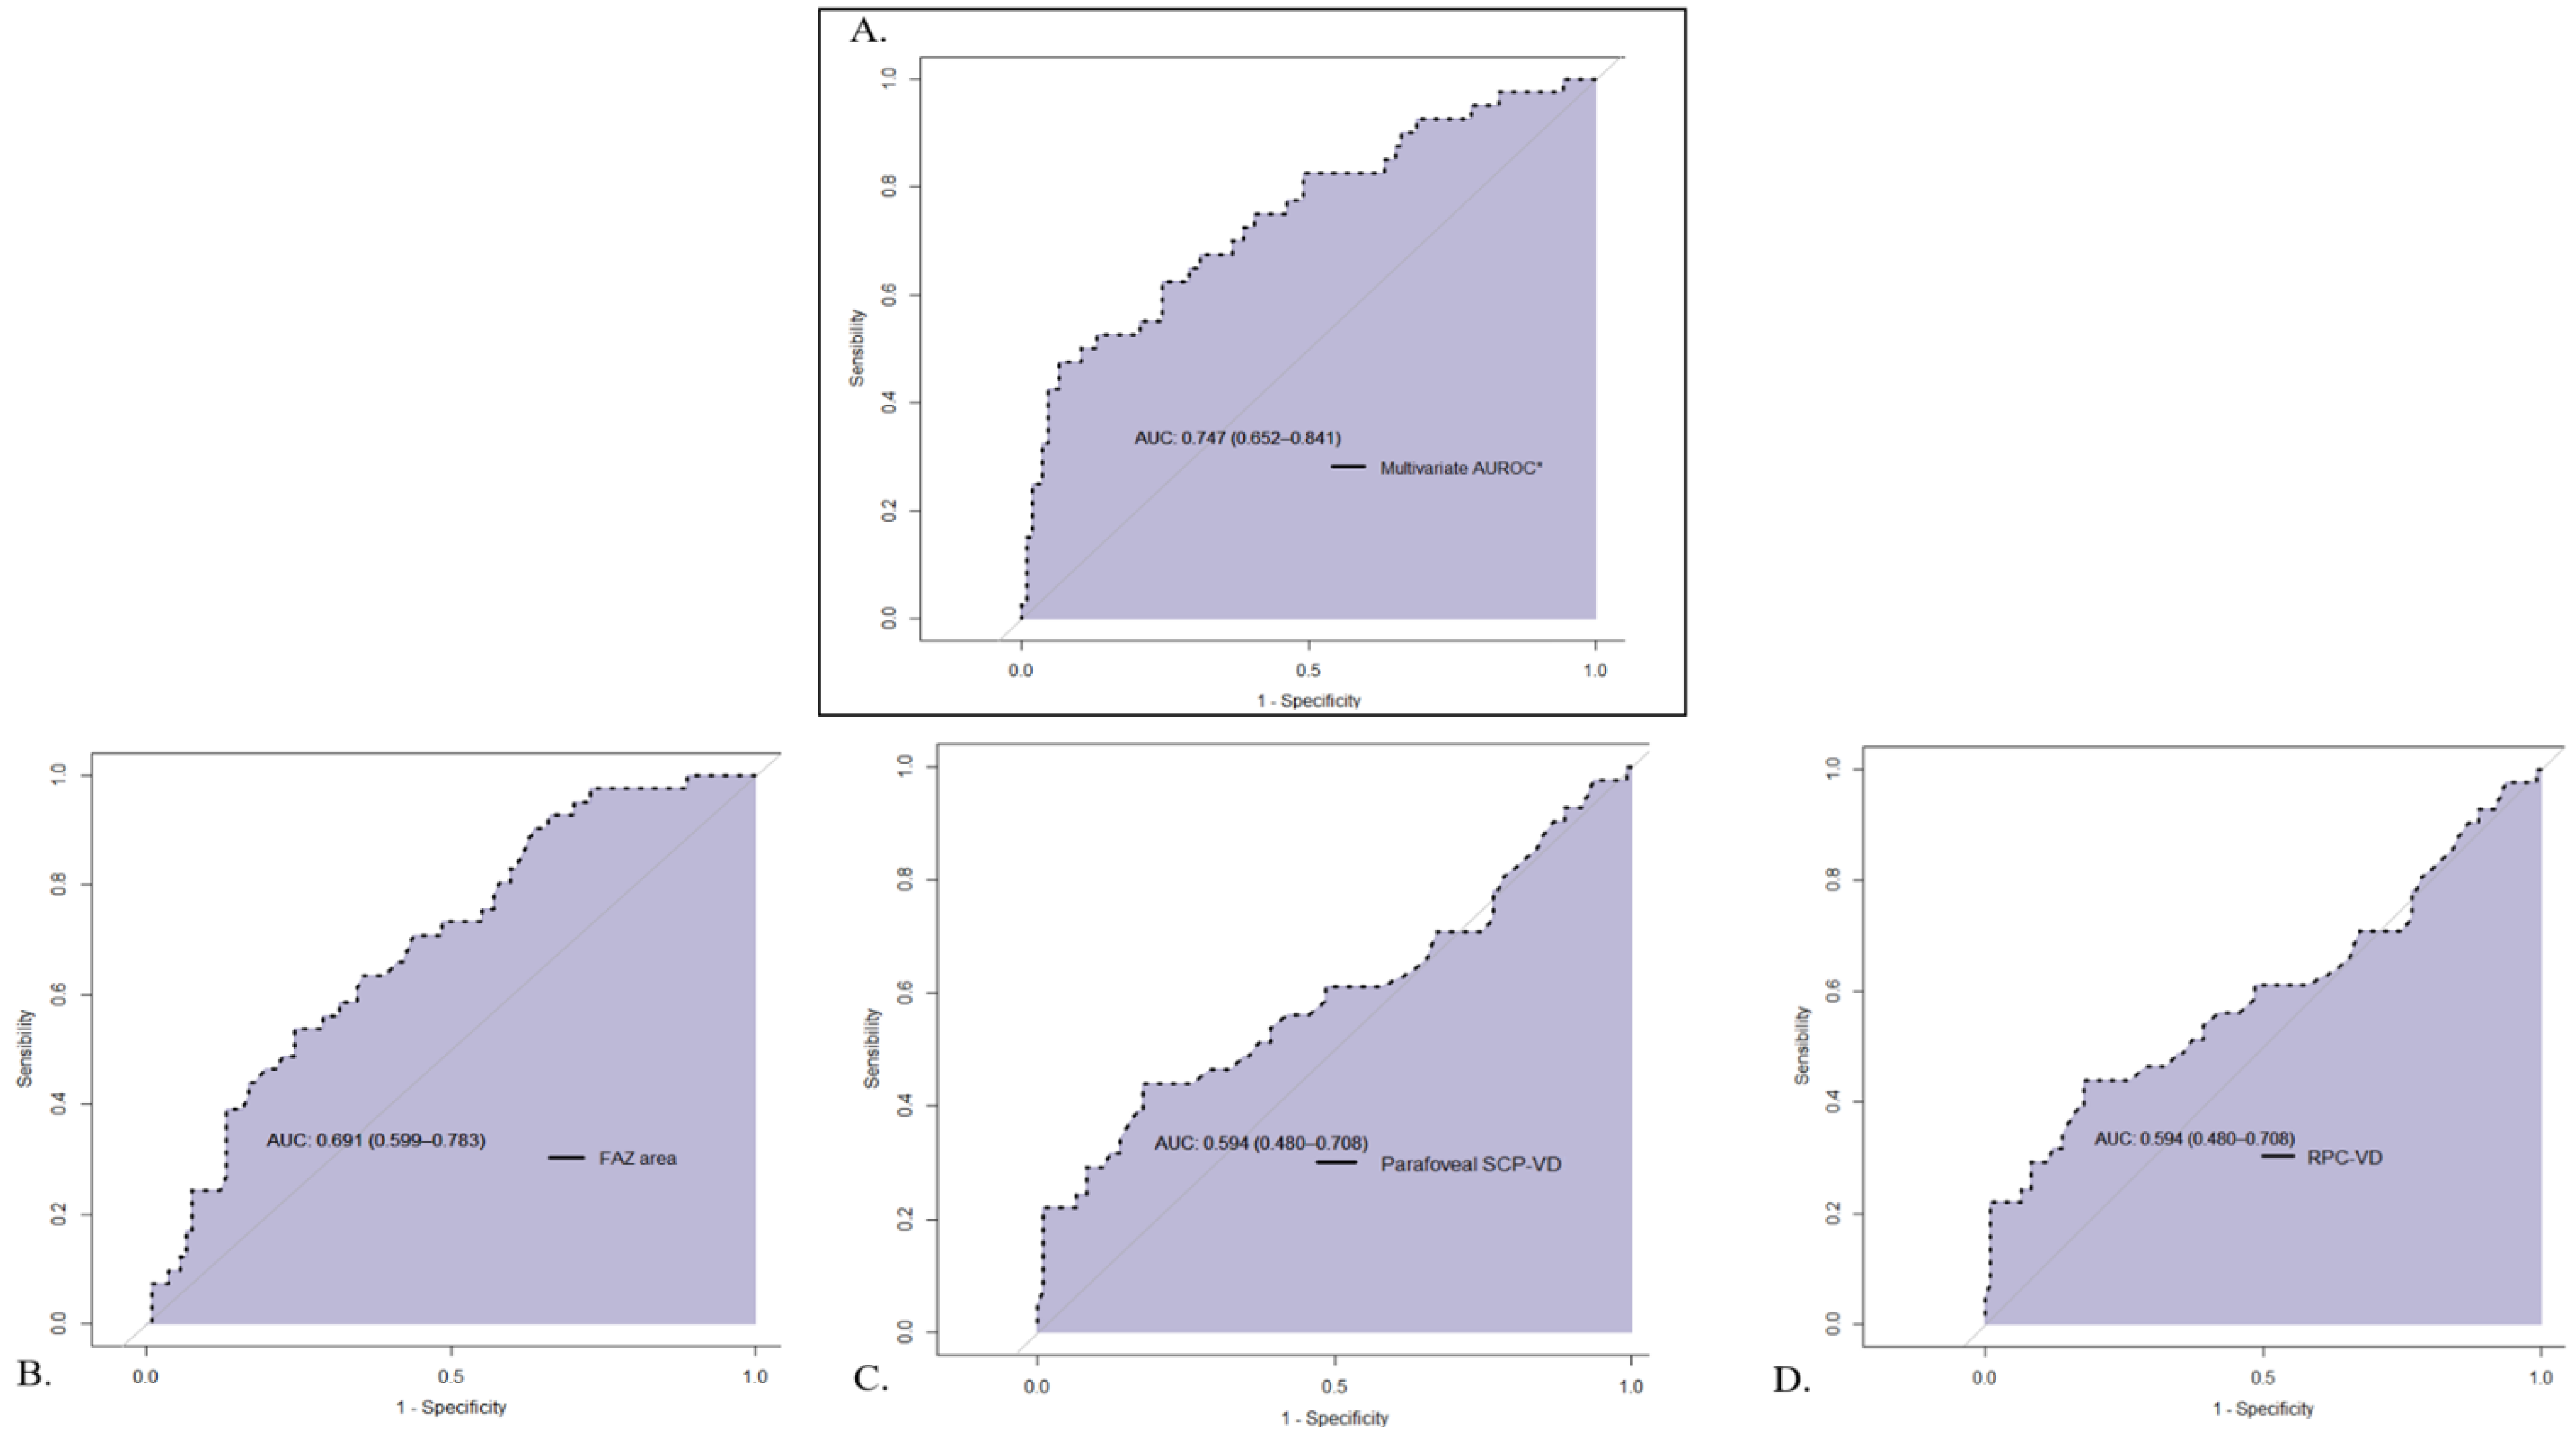
| FAZ area (mm2) | 0.231 (0.01) | 0.236 (0.01) | 0.291 (0.01) | 0.001 | 1–3: 0.001 2–3: 0.010 | 0.69 |
| Macular SCP-VD (%) | ||||||
| Whole | 48.9 (0.3) | 48.3 (0.5) | 47.3 (0.4) | 0.012 | 1–3: 0.009 | 0.60 |
| Parafoveal | 52.0 (0.4) | 51.2 (0.5) | 50.1 (0.5) | 0.008 | 1–3: 0.006 | 0.59 |
| Macular DCP-VD (%) | ||||||
| Whole | 54.0 (0.4) | 54.0 (0.6) | 53.5 (0.5) | 0.67 | - | |
| Parafoveal | 55.9 (0.4) | 55.6 (0.6) | 55.3 (0.5) | 0.71 | - | |
| ONH VD (%) | ||||||
| Whole image | 49.6 (0.3) | 49.1 (0.4) | 50.0 (0.4) | 0.22 | - | |
| Inside | 51.1 (0.5) | 51.4 (0.8) | 51.3 (0.7) | 0.84 | - | |
| RPC | 51.7 (0.3) | 50.5 (0.5) | 52.2 (0.4) | 0.035 | 1–2: 0.067 2–3: 0.034 | 0.59 |
| Macular FI (mm2) | ||||||
| ln (SCP-FI) | 0.318 (0.008) | 0.318 (0.01) | 0.286 (0.01) | 0.048 | 1–3: 0.06 2–3: 0.08 | 0.59 |
| ln (DCP-FI) | −0.97 (0.06) | −0.90 (0.09) | −0.99 (0.09) | 0.075 | - | |
| CCP-FI | 2.13 (0.014) | 2.11 (0.2) | 2.11 (0.02) | 0.74 | - | |
| OCT features (μm) | ||||||
| Parafoveal RT | 323 (1.9) | 314 (2.9) | 309 (2.6) | <0.001 | 1–3: <0.001 | 0.65 |
| Mean GCC | 99.2 (0.7) | 97.2 (1.1) | 97.5 (1.0) | 0.23 | - | |
| Mean RNFL thickness | 103 (1.1) | 101 (1.6) | 103 (1.4) | 0.79 | - |
Publisher’s Note: MDPI stays neutral with regard to jurisdictional claims in published maps and institutional affiliations. |
© 2022 by the authors. Licensee MDPI, Basel, Switzerland. This article is an open access article distributed under the terms and conditions of the Creative Commons Attribution (CC BY) license (https://creativecommons.org/licenses/by/4.0/).
Share and Cite
Debourdeau, E.; Chamard, C.; Carriere, I.; Plat, J.; Villain, M.; Boivineau, L.; Altwegg, R.; Daien, V. Retinal Microcirculation Changes in Crohn’s Disease Patients under Biologics, a Potential Biomarker of Severity: A Pilot Study. J. Pers. Med. 2022, 12, 230. https://doi.org/10.3390/jpm12020230
Debourdeau E, Chamard C, Carriere I, Plat J, Villain M, Boivineau L, Altwegg R, Daien V. Retinal Microcirculation Changes in Crohn’s Disease Patients under Biologics, a Potential Biomarker of Severity: A Pilot Study. Journal of Personalized Medicine. 2022; 12(2):230. https://doi.org/10.3390/jpm12020230
Chicago/Turabian StyleDebourdeau, Eloi, Chloé Chamard, Isabelle Carriere, Julien Plat, Max Villain, Lucile Boivineau, Romain Altwegg, and Vincent Daien. 2022. "Retinal Microcirculation Changes in Crohn’s Disease Patients under Biologics, a Potential Biomarker of Severity: A Pilot Study" Journal of Personalized Medicine 12, no. 2: 230. https://doi.org/10.3390/jpm12020230