
The Value of Early and Follow-Up Elevated Scores Based on Peripheral Complete Blood Cell Count for Predicting Adverse Outcomes in COVID-19 Patients
 , , , , , , , , ,
  and
and
Abstract
:1. Introduction
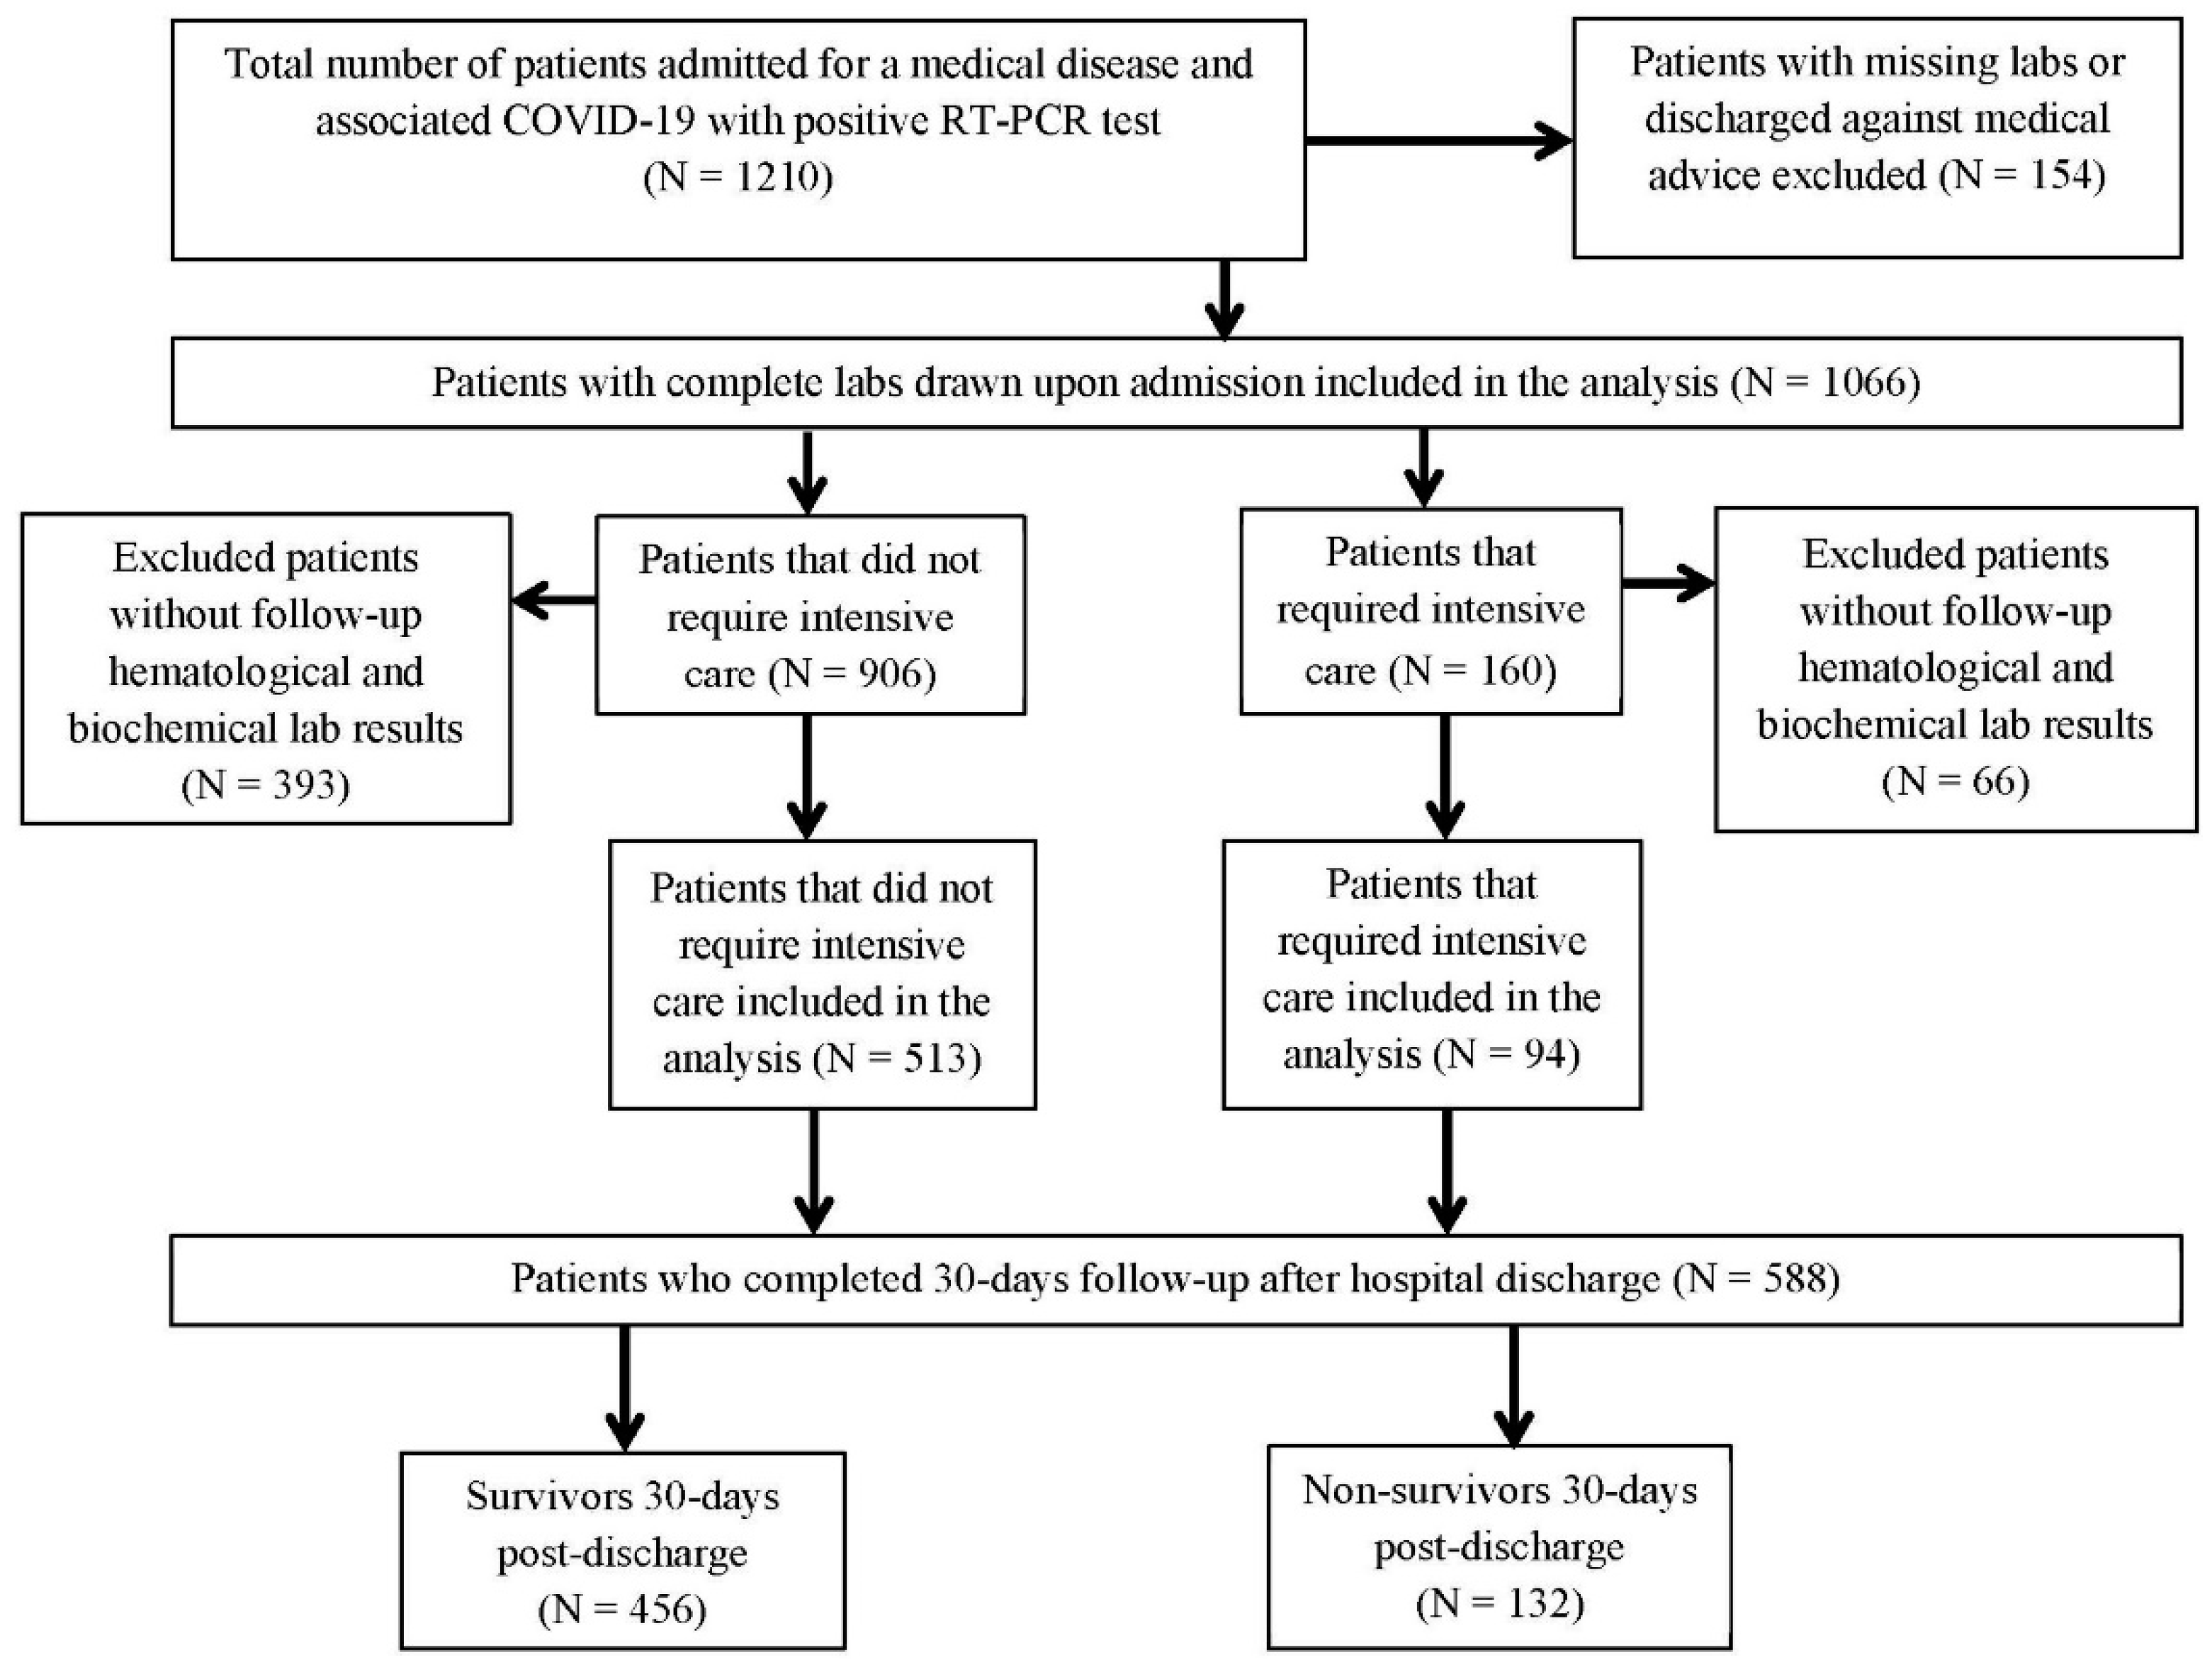
2. Materials and Methods
3. Results
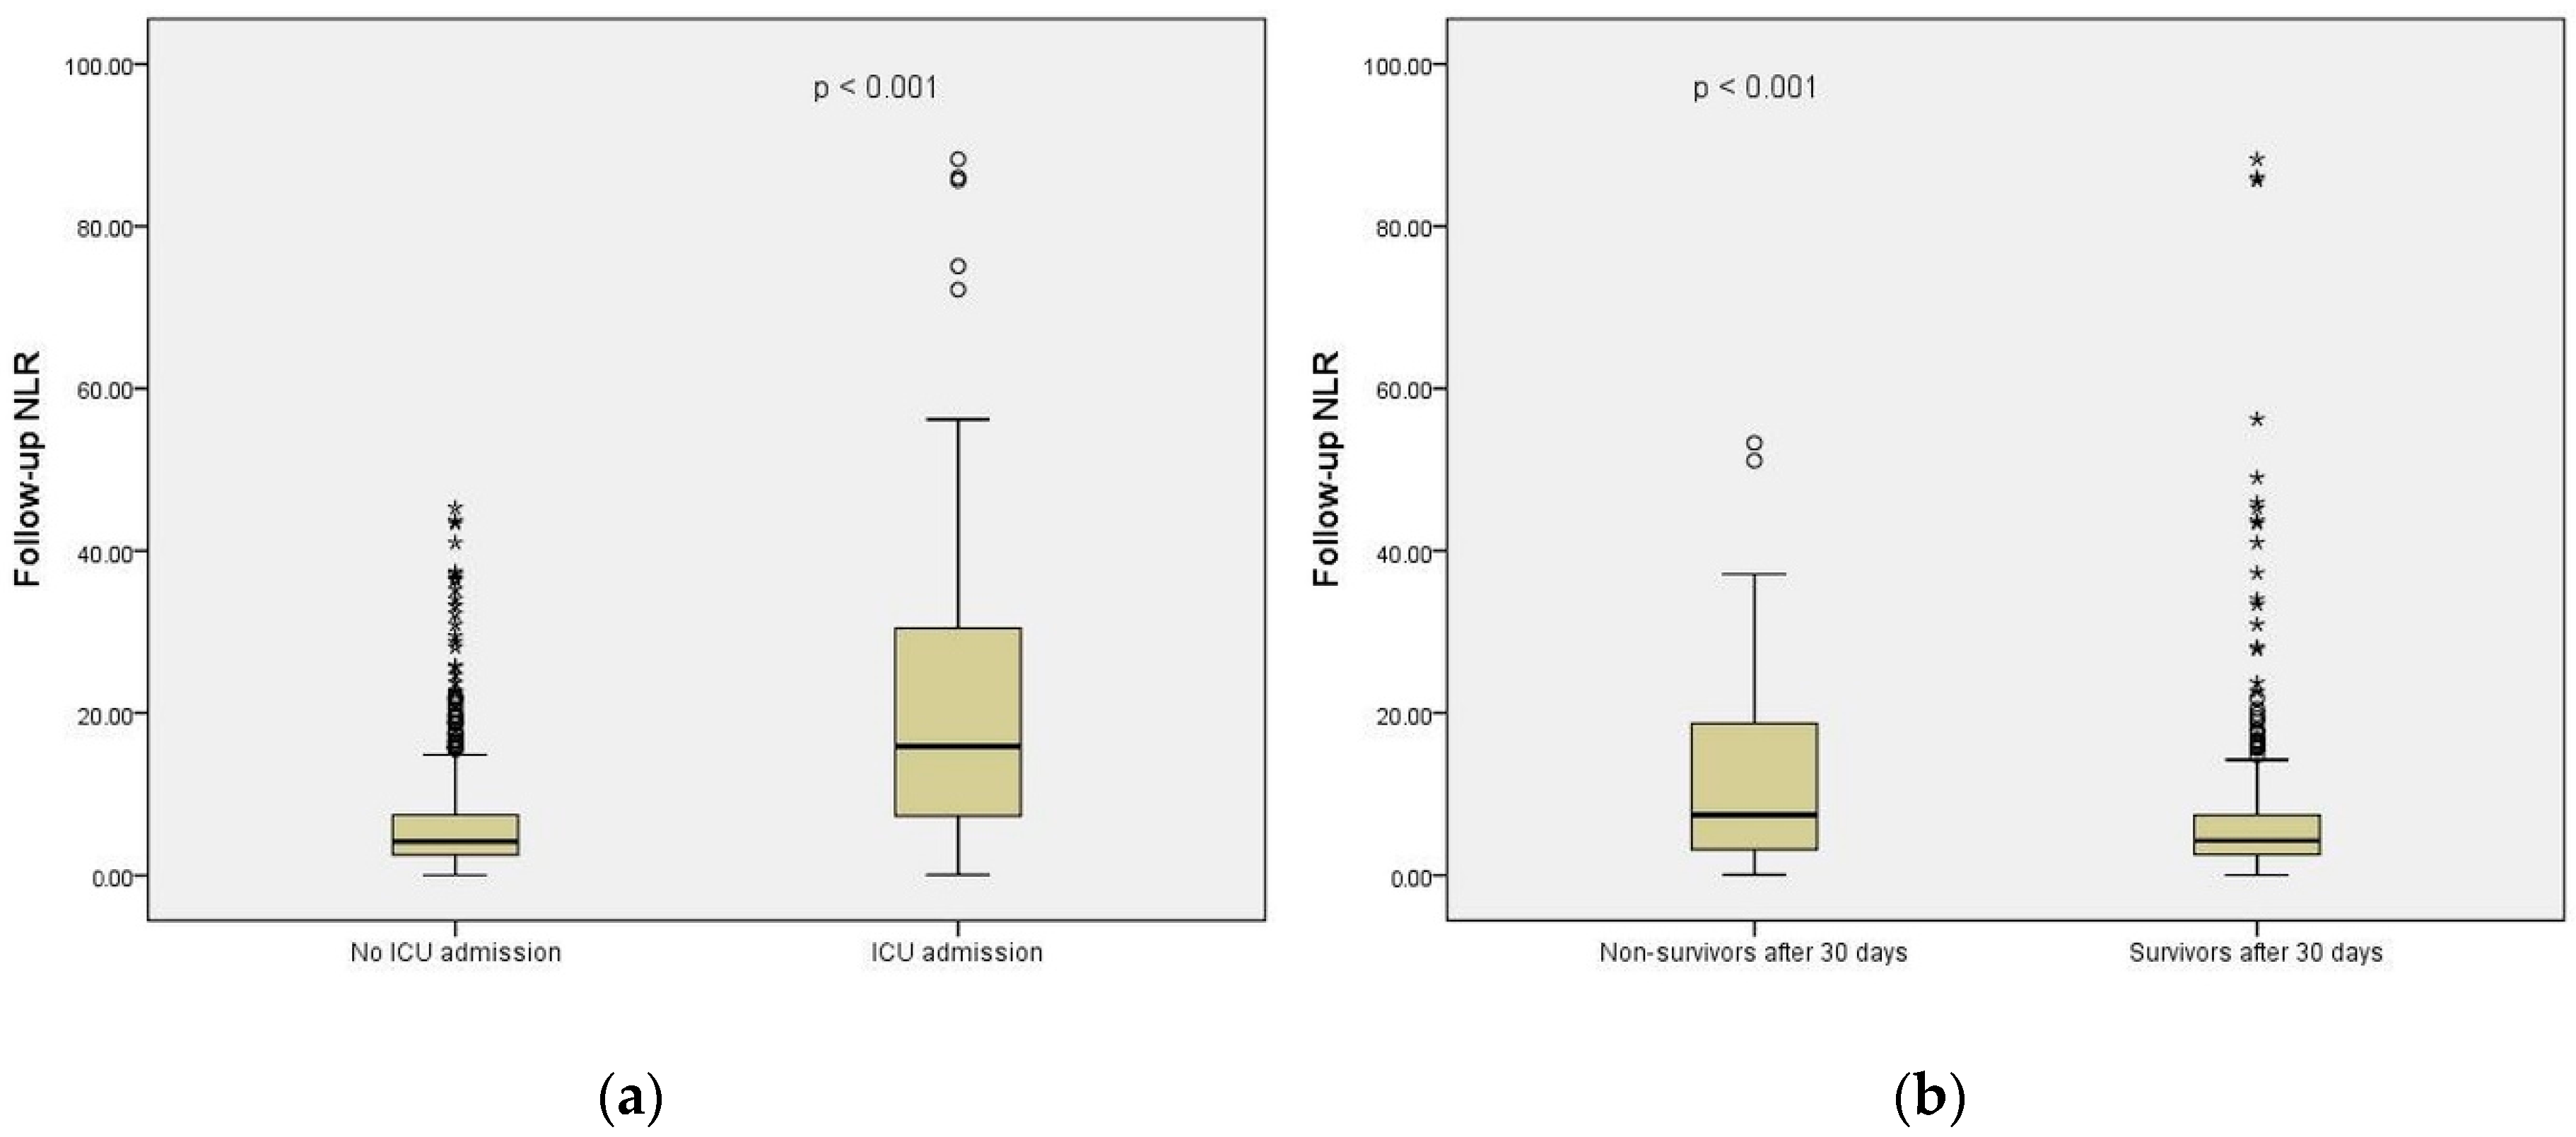
3.1. CBC-Derived Scores in Relation to ICU Admission
3.2. CBC-Derived Scores in Relation to Short-Term Mortality
4. Discussion
5. Conclusions
Supplementary Materials
Author Contributions
Funding
Institutional Review Board Statement
Informed Consent Statement
Data Availability Statement
Conflicts of Interest
References
- WHO Coronavirus (COVID-19) Dashboard. Available online: https://covid19.who.int/ (accessed on 18 October 2022).
- Diem, S.; Schmid, S.; Krapf, M.; Flatz, L.; Born, D.; Jochum, W.; Templeton, A.J.; Früh, M. Neutrophil-to-Lymphocyte ratio (NLR) and Platelet-to-Lymphocyte ratio (PLR) as prognostic markers in patients with non-small cell lung cancer (NSCLC) treated with nivolumab. Lung Cancer 2017, 111, 176–181. [Google Scholar] [CrossRef]
- Yodying, H.; Matsuda, A.; Miyashita, M.; Matsumoto, S.; Sakurazawa, N.; Yamada, M.; Uchida, E. Prognostic Significance of Neutrophil-to-Lymphocyte Ratio and Platelet-to-Lymphocyte Ratio in Oncologic Outcomes of Esophageal Cancer: A Systematic Review and Meta-analysis. Ann. Surg. Oncol. 2016, 23, 646–654. [Google Scholar] [CrossRef]
- Bowen, R.C.; Little, N.A.B.; Harmer, J.R.; Ma, J.; Mirabelli, L.G.; Roller, K.D.; Breivik, A.M.; Signor, E.; Miller, A.B.; Khong, H.T. Neutrophil-to-lymphocyte ratio as prognostic indicator in gastrointestinal cancers: A systematic review and meta-analysis. Oncotarget 2017, 8, 32171–32189. [Google Scholar] [CrossRef] [PubMed] [Green Version]
- Ethier, J.L.; Desautels, D.; Templeton, A.; Shah, P.S.; Amir, E. Prognostic role of neutrophil-to-lymphocyte ratio in breast cancer: A systematic review and meta-analysis. Breast Cancer Res. 2017, 19, 2. [Google Scholar] [CrossRef] [PubMed] [Green Version]
- Çaltekin, I.; Demirtaş, E. Is platelet to monocyte ratio a useful inflammatory determinant of ST-elevation myocardial infarction? Disaster Emerg. Med. J. 2020, 5, 205–211. [Google Scholar] [CrossRef]
- Bhat, T.; Teli, S.; Rijal, J.; Bhat, H.; Raza, M.; Khoueiry, G.; Meghani, M.; Akhtar, M.; Costantino, T. Neutrophil to lymphocyte ratio and cardiovascular diseases: A review. Expert Rev. Cardiovasc. Ther. 2013, 11, 55–59. [Google Scholar] [CrossRef] [PubMed]
- Jentzer, J.C.; Szekely, Y.; Burstein, B.; Ballal, Y.; Kim, E.Y.; van Diepen, S.; Tabi, M.; Wiley, B.; Kashani, K.B.; Lawler, P.R. Peripheral blood neutrophil-to-lymphocyte ratio is associated with mortality across the spectrum of cardiogenic shock severity. J. Crit. Care 2022, 68, 50–58. [Google Scholar] [CrossRef] [PubMed]
- Kaushik, R.; Gupta, M.; Sharma, M.; Jash, D.; Jain, N.; Sinha, N.; Chaudhry, A.; Chaudhry, D. Diagnostic and Prognostic Role of Neutrophil-to-Lymphocyte Ratio in Early and Late Phase of Sepsis. Indian J. Crit. Care Med. 2018, 22, 660–663. [Google Scholar]
- Djordjevic, D.; Rondovic, G.; Surbatovic, M.; Stanojevic, I.; Udovicic, I.; Andjelic, T.; Zeba, S.; Milosavljevic, S.; Stankovic, N.; Abazovic, D.; et al. Neutrophil-to-Lymphocyte Ratio, Monocyte-to-Lymphocyte Ratio, Platelet-to-Lymphocyte Ratio, and Mean Platelet Volume-to-Platelet Count Ratio as Biomarkers in Critically Ill and Injured Patients: Which Ratio to Choose to Predict Outcome and Nature of Bacteremia? Mediat. Inflamm. 2018, 2018, 3758068. [Google Scholar] [CrossRef] [Green Version]
- Lionte, C.; Bologa, C.; Sorodoc, V.; Petris, O.R.; Puha, G.; Stoica, A.; Ceasovschih, A.; Jaba, E.; Sorodoc, L. Biomarkers of Inflammation and Inflammation-Related Indexes upon Emergency Department Admission Are Predictive for the Risk of Intensive Care Unit Hospitalization and Mortality in Acute Poisoning: A 6-Year Prospective Observational Study. Dis. Markers. 2021, 2021, 4696156. [Google Scholar] [CrossRef]
- Seyit, M.; Avci, E.; Nar, R.; Senol, H.; Yilmaz, A.; Ozen, M.; Oskay, A.; Aybek, H. Neutrophil to lymphocyte ratio, lymphocyte to monocyte ratio and platelet to lymphocyte ratio to predict the severity of COVID-19. Am. J. Emerg. Med. 2021, 40, 110–114. [Google Scholar] [CrossRef]
- Rahi, M.S.; Jindal, V.; Reyes, S.P.; Gunasekaran, K.; Gupta, R.; Jaiyesimi, I. Hematologic disorders associated with COVID-19: A review. Ann. Hematol. 2021, 100, 309–320. [Google Scholar] [CrossRef] [PubMed]
- Mao, J.; Dai, R.; Du, R.C.; Zhu, Y.; Shui, L.P.; Luo, X.H. Hematologic changes predict clinical outcome in recovered patients with COVID-19. Ann. Hematol. 2021, 100, 675–689. [Google Scholar] [CrossRef] [PubMed]
- Pimentel, G.D.; Dela Vega, M.C.M.; Laviano, A. High neutrophil to lymphocyte ratio as a prognostic marker in COVID-19 patients. Clin. Nutr. ESPEN 2020, 40, 101–102. [Google Scholar] [CrossRef] [PubMed]
- Jemaa, A.B.; Salhi, N.; Othmen, M.B.; Ali, H.B.; Guissouma, J.; Ghadhoune, H.; Oueslati, R.; Dhaouadi, H. Evaluation of individual and combined NLR, LMR and CLR ratio for prognosis disease severity and outcomes in patients with COVID-19. Int. Immunopharmacol. 2022, 109, 108781. [Google Scholar] [CrossRef] [PubMed]
- Simadibrata, D.M.; Calvin, J.; Wijaya, A.D.; Ibrahim, N. Neutrophil-to-lymphocyte ratio on admission to predict the severity and mortality of COVID-19 patients: A meta-analysis. Am. J. Emerg. Med. 2021, 42, 60–69. [Google Scholar] [CrossRef]
- de Oliveira, D.C.; Spiri, B.S.; Schluga, Y.C.; Justus, J.; Neto, F.; de Azambuja, A.P. Evaluation of lymphocyte count, T-cell subsets and neutrophil-to-lymphocyte ratio as early predictors for severity and outcome of COVID-19 disease–a report from a highly complex hospital in Brazil. Hematol. Transfus. Cell Ther. 2022. online ahead of print. [Google Scholar] [CrossRef]
- McGinley, A.; Pearse, R.M. A national early warning score for acutely ill patients. BMJ 2012, 345, e5310. [Google Scholar] [CrossRef]
- Charlson, M.E.; Pompei, P.; Ales, K.L.; Mackenzie, R.C. A new method of classifying prognostic comorbidity in longitudinal studies: Development and validation. J. Chron. Dis. 1987, 40, 373–383. [Google Scholar] [CrossRef]
- Available online: https://www.cdc.gov/coronavirus/2019-ncov/hcp/clinical-care/clinical-considerations-course.html (accessed on 14 September 2022).
- Asghar, M.S.; Akram, M.; Yasmin, F.; Najeeb, H.; Naeem, U.; Gaddam, M.; Jafri, M.S.; Tahir, M.J.; Yasin, I.; Mahmood, H.; et al. Comparative analysis of neutrophil to lymphocyte ratio and derived neutrophil to lymphocyte ratio with respect to outcomes of in-hospital coronavirus disease 2019 patients: A retrospective study. Front. Med. 2022, 9, 951556. [Google Scholar] [CrossRef]
- Liu, X.; Zhang, R.; He, G. Hematological findings in coronavirus disease 2019: Indications of progression of disease. Ann. Hematol. 2020, 99, 1421–1428. [Google Scholar] [CrossRef]
- Yildirim, A.O.; Bilgir, O. Effects of Neutrophil/Monocyte, Neutrophil/Lymphocyte, Neutrophil/Platelet Ratios and C-Reactive Protein Levels on the Mortality and Intensive Care Need of the Patients Diagnosed with COVID-19. EJMI 2021, 5, 21–26. [Google Scholar] [CrossRef]
- Qu, R.; Ling, Y.; Zhang, Y.H.; Wei, L.Y.; Chen, X.; Li, X.M.; Liu, X.Y.; Liu, H.M.; Guo, Z.; Ren, H.; et al. Platelet-to-lymphocyte ratio is associated with prognosis in patients with coronavirus disease-19. J. Med. Virol. 2020, 92, 1533–1541. [Google Scholar] [CrossRef] [PubMed]
- Gupta, A.; Desai, N.; Sanjeev; Chauhan, P.; Nityanand, S.; Hashim, Z.; Gupta, M. Clinical profile and outcome of COVID-19 in haematological malignancies: Experience from tertiary care centre in India. Ann. Hematol. 2022, 101, 69–79. [Google Scholar] [CrossRef]
- Cavalcante-Silva, L.; Carvalho, D.; Lima, É.A.; Galvão, J.; da Silva, J.; Sales-Neto, J.M.; Rodrigues-Mascarenhas, S. Neutrophils and COVID-19: The road so far. Int. Immunopharmacol. 2021, 90, 107233. [Google Scholar] [CrossRef]
- Agarwal, R.; Priyonugroho, G.; Hertine, S.; Wicaksono, S.H.; Almazini, P.; Zamroni, D.; Muliawan, H.S. The association between neutrophil to lymphocyte ratio and echocardiographic parameters in hospitalised adults with COVID-19—A retrospective analysis. Eur. Heart J. 2022, 43 (Suppl. S1), ehab849.004. [Google Scholar] [CrossRef]
- Li, X.; Liu, C.; Mao, Z.; Xiao, M.; Wang, L.; Qi, S.; Zhou, F. Predictive values of neutrophil-to-lymphocyte ratio on disease severity and mortality in COVID-19 patients: A systematic review and meta-analysis. Crit Care 2020, 24, 647. [Google Scholar] [CrossRef] [PubMed]
- Erdogan, A.; Can, F.E.; Gönüllü, H. Evaluation of the prognostic role of NLR, LMR, PLR and LCR ratio in COVID-19 patients. J. Med. Virol. 2021, 93, 5555–5559. [Google Scholar] [CrossRef]
- Citu, C.; Gorun, F.; Motoc, A.; Sas, I.; Gorun, O.M.; Burlea, B.; Tuta-Sas, I.; Tomescu, L.; Neamtu, R.; Malita, D.; et al. The Predictive Role of NLR, d-NLR, MLR, and SIRI in COVID-19 Mortality. Diagnostics 2022, 12, 122. [Google Scholar] [CrossRef]
- Zhang, S.; Guo, M.; Duan, L.; Wu, F.; Hu, G.; Wang, Z.; Huang, Q.; Liao, T.; Xu, J.; Ma, Y.; et al. Development and validation of a risk factor-based system to predict short-term survival in adult hospitalized patients with COVID-19: A multicenter, retrospective, cohort study. Crit. Care 2020, 24, 438. [Google Scholar] [CrossRef]
- Sarkar, S.; Khanna, P.; Singh, A.K. The Impact of Neutrophil-Lymphocyte Count Ratio in COVID-19: A Systematic Review and Meta-Analysis. J. Intensive Care Med. 2022, 37, 857–869. [Google Scholar] [CrossRef] [PubMed]
- Ghobadi, H.; Mohammadshahi, J.; Javaheri, N.; Fouladi, N.; Mirzazadeh, Y.; Aslani, M.R. Role of leukocytes and systemic inflammation indexes (NLR, PLR, MLP, dNLR, NLPR, AISI, SIR-I, and SII) on admission predicts in-hospital mortality in non-elderly and elderly COVID-19 patients. Front. Med. 2022, 9, 916453. [Google Scholar] [CrossRef]
- Schuttevaer, R.; Boogers, W.; Brink, A.; van Dijk, W.; de Steenwinkel, J.; Schuit, S.; Verbon, A.; Lingsma, H.; Alsma, J. Predictive performance of comorbidity for 30-day and 1-year mortality in patients with bloodstream infection visiting the emergency department: A retrospective cohort study. BMJ Open 2022, 12, e057196. [Google Scholar] [CrossRef] [PubMed]
- Kuswardhani, R.A.T.; Henrina, J.; Pranata, R.; Lim, M.A.; Lawrensia, S.; Suastika, K. Charlson comorbidity index and a composite of poor outcomes in COVID-19 patients: A systematic review and meta-analysis. Diabetes Metab. Syndr. 2020, 14, 2103–2109. [Google Scholar] [CrossRef]
- Sonaglioni, A.; Lombardo, M.; Albini, A.; Noonan, D.M.; Re, M.; Cassandro, R.; Elia, D.; Caminati, A.; Nicolosi, G.L.; Harari, S. Charlson comorbidity index, neutrophil-to-lymphocyte ratio and undertreatment with renin-angiotensin-aldosterone system inhibitors predict in-hospital mortality of hospitalized COVID-19 patients during the omicron dominant period. Front. Immunol. 2022, 13, 958418. [Google Scholar] [CrossRef] [PubMed]


| Variable | Total Cases N = 607 | No ICU Admission N = 513 | ICU Admission N = 94 | p Value | 30 Day Survivors N = 456 | 30 Day Non-Survivors N = 132 | p Value |
|---|---|---|---|---|---|---|---|
| Age groups (N, %) | 0.949 a | 0.002 a | |||||
| 51–60 y | 51 (8.4) | 43 (8.4) | 8 (8.5) | 48 (10.5) | 5 (3.8) | ||
| 61–70 y | 141 (23.2) | 118 (23.0) | 23 (24.5) | 115 (25.2) | 21 (15.9) | ||
| >70 y | 415 (68.4) | 352 (68.6) | 63 (67.0) | 293 (64.3) | 106 (80.3) | ||
| Males (N, %) | 294 (48.4) | 247 (48.1) | 47 (50.0) | 0.822 a | 216 (47.4) | 74 (5.1) | 0.093 a |
| NEWS2 * | 6 [4–8] | 5 [4–8] | 7 [5–9] | <0.001 b | 5 [4–7] | 4.5 [4–6] | 0.870 b |
| CCI * | 4 [2–5] | 4 [2–5] | 4 [2–5] | 0.087 b | 3 [2–5] | 5 [4–7] | <0.001 b |
| SaO2 > 90% (N, %) | 459 (75.7) | 422 (82.2) | 38 (40.4) | <0.001 a | 364 (80.0) | 94 (71.2) | 0.042 |
| #SaO2 > 90% (N, %) | 599 (98.3) | 433 (84.4) | 28 (28.9) | 0.012 a | 411 (90.1) | 50 (37.9) | 0.070 |
| HR (bpm) * | 81 [74–94] | 85 [75–100] | 88 [80–100] | 0.016 b | 84 [75–97] | 84 [68–96] | 0.015 b |
| SBP (mmHg) * | 130 [120–144] | 131 [120–150] | 130 [116–148] | 0.503 b | 130 [120–146] | 122 [106–140] | 0.015 b |
| Hb (g/dL) * | 13.1 [11.9–14.3] | 13.0 [11.3- 14.1] | 13.1 [11.4–14.3] | 0.689 b | 13.2 [12.0–14.5] | 12.5 [11.9–14.3] | 0.773 b |
| WBCs (*103/mmc) * | 7.4 [6.0–10.3] | 7.7 [5.5–10.7] | 10.0 [7.0–14.3] | <0.001 b | 7.3 [5.8–10.1] | 11.1 [7.3–14.5] | <0.001 b |
| #WBCs (*103/mmc) * | 9.4 [6.6–13.1] | 9.0 [6.6–12.2] | 12.5 [8.7–17.7] | <0.001 b | 9.6 [6.5–12.0] | 11.1 [8.8–12.7] | 0.003 b |
| Ly (*103/mmc) * | 1.1 [0.7–1.6] | 1.1 [0.8–1.6] | 0.9 [0.5–1.4] | 0.001 b | 1.3 [1.0–1.7] | 1.0 [0.7–1.8] | 0.923 b |
| #Ly (*103/mmc) * | 1.3 [0.9–1.9] | 1.5 [1.0–2.0] | 1.0 [0.5–1.5] | <0.001 b | 1.6 [1.2–2.1] | 0.9 [0.7–2.1] | <0.001 b |
| RDW (%) * | 13.8 [13.1–15.4] | 13.8 [13.0–15.0] | 14.4 [13.4–15.9] | 0.242 b | 13.6 [12.9–15.1] | 15.3 [13.8–15.9] | <0.001 b |
| MPV * | 10.7 [9.9–11.3] | 10.6 [10.0–11.3] | 10.8 [10.3–11.7] | 0.176 b | 10.8 [9.8–11.4] | 10.7 [10.0–11.9] | 0.052 b |
| MPR * | 0.3 [0.2–0.4] | 0.3 [0.2–0.4] | 0.2 [0.1–0.4] | 0.191 b | 0.3 [0.2–0.4] | 0.4 [0.3–0.5] | 0.002 b |
| NLR * | 4.6 [2.8–7.2] | 5.2 [3.0–9.3] | 9.6 [4.8–18.6] | <0.001 b | 4.4 [2.8–6.7] | 7.1 [5.4–10.2] | 0.078 b |
| PLR * | 181.5 [126.6–304.8] | 208.8 [137.9–333.1] | 267.9 [155.9–452.8] | 0.004 b | 169.6 [125.9–306.5] | 174.7 [131.1–305.6] | 0.230 b |
| MLR * | 0.5 [0.4–0.8] | 0.5 [0.4–0.8] | 0.6 [0.4–1.1] | 0.012 b | 0.5 [0.4–0.8] | 0.9 [0.5–1.1] | 0.066 b |
| #NLR * | 3.8 [2.5–6.4] | 4.2 [2.5–7.4] | 15.9 [7.3–30.5] | <0.001 b | 3.9 [2.6–5.2] | 6.5 [2.8–13.1] | <0.001 b |
| #PLR * | 201.8 [129.2–294.2] | 199.0 [135.0–292.2] | 343.1 [160.4–530.3] | <0.001 b | 198.7 [128.5–283.8] | 219.8 [134.2–292.2] | 0.928 b |
| #MLR * | 0.4 [0.3–0.7] | 0.4 [0.3–0.7] | 0.7 [0.4–1.3] | <0.001 b | 0.4 [0.3–0.6] | 0.9 [0.3–1.4] | <0.001 b |
| SII * | 1075.7 [501.5–1912.0] | 1164.4 [585.1–2297.0] | 2031.8 [930.0–4579.0] | <0.001 b | 1110.5 [465.4–1973.0] | 1628.8 [862.0–2812.8] | 0.642 b |
| #SII * | 1202.8 [712.1–2044.2] | 1170.2 [654.7–2211.1] | 3915.5 [1202.5–7348.2] | <0.001 b | 1347.0 [699.5–1826.2] | 1689.9 [548.2–2689.6] | 0.022 b |
| NMR * | 9.2 [6.5–13.6] | 9.0 [6.5–13.1] | 10.9 [7.6–16.4] | <0.001 b | 8.3 [6.4–11.8] | 11.9 [8.5–13.4] | 0.527 b |
| NPR * | 2.2 [1.7–3.3] | 2.4 [1.7–3.7] | 3.5 [2.5–5.1] | <0.001 b | 2.2 [1.7–3.2] | 3.5 [1.9–5.6] | <0.001 b |
| ESR (mm/h) * | 44 [10–66] | 36 [11–60] | 51 [7–72] | 0.416 b | 31 [11–65] | 52 [17–74] | 0.474 b |
| PT (seconds) * | 12.9 [12.0–14.6] | 13.1 [12.0–15.0] | 13.2 [12.1–15.0] | 0.381 b | 12.7 [12.0–14.6] | 12.9 [11.7–15.5] | 0.288 b |
| Fibrinogen (mg/dL) * | 430 [358–488] | 444 [363–533] | 468 [381–573] | 0.032 b | 417 [354–473] | 425 [363–538] | 0.202 b |
| #Fibrinogen (mg/dL) * | 381 [315–464] | 381 [319–450] | 366 [283–483] | 0.212 | 381 [319–454] | 373 [267–463] | 0.045 |
| Lactate (mg/dL) * | 22.6 [14.1–29.4] | 22.8 [14.4–28.5] | 28.9 [18.7–35.4] | 0.032 b | 26.0 [21.3–30.2] | 27.8 [23.8–31.2] | 0.212 b |
| CRP (mg/dL) * | 5.0 [1.5–9.9] | 5.8 [1.9–13.4] | 12.3 [4.4–20.4] | <0.001 b | 3.8 [1.7–8.0] | 8.6 [1.5–10.5] | 0.464 b |
| #CRP (mg/dL) * | 1.4 [0.4–5.4] | 1.6 [0.4–5.3] | 4.2 [1.4–8.4] | <0.001 b | 0.9 [0.3–3.7] | 6.4 [1.1–9.4] | <0.001 b |
| CLR | 6.0 [1.6–17.3] | 3.9 [1.1–11.6] | 8.1 [2.4–23.2] | <0.001 b | 3.5 [1.2–7.0] | 5.4 [2.0–11.1] | 0.565 b |
| #CLR | 1.4 [0.3–5.2] | 1.2 [0.3–4.1] | 6.2 [1.2–14.6] | <0.001 b | 0.4 [0.1–3.2] | 6.0 [0.5–15.1] | <0.001 b |
| Creatinine (mg/dL) * | 0.89 [0.73–1.19] | 0.89 [0.76–1.20] | 1.04 [0.81–1.49] | <0.001 b | 0.8 [0.7–1.2] | 1.3 [0.9–2.3] | <0.001 b |
| TGP (U/L) * | 31 [18–52] | 32 [20–52] | 38 [23–58] | 0.079 b | 28 [19–47] | 38 [31–63] | 0.415 b |
| LDH (U/L) * | 240 [200–314] | 266 [204–396] | 489 [317–685] | <0.001 b | 242 [200–295] | 219 [193–323] | 0.124 b |
| #LDH (U/L) * | 197 [168–254] | 202 [163–272] | 463 [255–628] | <0.001 b | 200 [160–246] | 330 [186–442] | <0.001 b |
| Presepsin (ng/mL) * | 331 [192–597] | 336 [186–577] | 727 [387–1844] | <0.001 b | 306 [156–433] | 667 [407–1117] | <0.001 b |
| Ferritin (ng/dL) * | 449 [192–881] | 495 [195–1059] | 757 [376–1519] | <0.001 b | 295 [174–783] | 448 [212–799] | 0.980 b |
| Hospitalization (days) | 15 [12–18] | 15 [12–19] | 14 [10–18] | 0.133 b | 15 [13–18] | 16 [14–19] | 0.001 |
| Duration of illness (days) | 19 [16–22] | 15 [8–19] | 14 [9–20] | 0.566 b | 19 [17–23] | 18 [15–20] | <0.001 b |
| Variable | ICU Admission | Short-Term Mortality | ||||||
|---|---|---|---|---|---|---|---|---|
| Univariate | Multivariate | Univariate | Multivariate | |||||
| OR (95%CI) | p Value | OR (95%CI) | p Value | OR (95%CI) | p Value | OR (95%CI) | p Value | |
| NLR # | 1.08 (1.05–1.11) | <0.001 | 1.14 (1.06–1.22) | <0.001 | 1.15 (1.11–1.19) | <0.001 | 1.30 (1.09–1.57) | 0.005 |
| Deltastrain | 1.50 (1.23–1.83) | <0.001 | 2.34 (1.12–4.90) | 0.024 | - | - | - | - |
| SaO2 (<90%) | 1.15 (1.09–1.24) | <0.001 | 2.74 (0.70–10.73) | 0.149 | 2.55 (1.89–3.42) | <0.001 | 1.80 (0.30–10.90) | 0.520 |
| NEWS2 | 1.20 (1.11–1.28) | <0.001 | 1.06 (0.84–1.36) | 0.616 | - | - | - | - |
| CCI | - | - | - | - | 1.35 (1.24–1.46) | <0.001 | 1.49 (1.04–2.13) | 0.030 |
| SII | 1.00 (1.00–1.00) | <0.001 | 1.00 (1.00–1.00) | 0.005 | - | - | - | - |
| SII # | - | - | - | - | 1.00 (1.00–1.00) | <0.001 | 1.00 (1.00–1.00) | 0.056 |
| Fibrinogen | 1.00 (1.00–1.00) | 0.012 | 1.00 (1.00–1.01) | 0.151 | - | - | - | - |
| Fibrinogen # | - | - | - | - | 1.00 (1.00–1.00) | 0.056 | 1.00 (0.99–1.01) | 0.962 |
| CRP # | 1.07 (1.03–1.10) | <0.001 | 0.91 (0.79–1.04) | 0.165 | 1.14 (1.09–1.19) | <0.001 | 1.04 (0.92–1.19) | 0.517 |
| LDH # | 1.00 (1.00–1.00) | <0.001 | 1.00 (1.00–1.01) | 0.127 | 1.01 (1.01–1.01) | <0.001 | 1.01 (1.00–1.01) | 0.013 |
| Presepsin | 0.02 (1.00–1.00) | <0.001 | 1.00 (1.00–1.00) | <0.001 | 1.00 (1.00–1.00) | <0.001 | 1.00 (1.00–1.00) | 0.004 |
| OD | 1.31 (0.70–2.45) | 0.040 | 0.82 (0.11–6.45) | 0.851 | 1.45 (0.93–2.24) | 0.098 | 2.50 (0.47–13.20) | 0.281 |
| Duration of illness | - | - | - | - | 0.94 (0.92–0.96) | <0.001 | 1.14 (1.02–1.26) | 0.017 |
| Variable | ICU Admission | Short-Term Mortality | ||||||
|---|---|---|---|---|---|---|---|---|
| Univariate | Multivariate | Univariate | Multivariate | |||||
| OR (95%CI) | p Value | OR (95%CI) | p Value | OR (95%CI) | p Value | OR (95%CI) | p Value | |
| MLR # | 1.08 (1.05–1.11) | <0.001 | 2.46 (1.27–4.79) | 0.008 | 2.05 (1.43–2.93) | <0.001 | 2.23 (1.07–4.65) | 0.032 |
| Delta strain | 1.50 (1.23–1.83) | <0.001 | 2.48 (1.25–4.92) | 0.010 | - | - | - | - |
| SaO2 (<90%) | 1.15 (1.09–1.24) | <0.001 | 5.62 (1.51–20.91) | 0.010 | 2.55 (1.89–3.42) | <0.001 | 1.58 (0.31–8.07) | 0.586 |
| NEWS2 | 1.20 (1.11–1.28) | <0.001 | 1.07 (0.85–1.35) | 0.549 | - | - | - | - |
| CCI | - | - | - | - | 1.35 (1.24–1.46) | <0.001 | 1.47 (1.05–2.05) | 0.024 |
| SII | 1.00 (1.00–1.00) | <0.001 | 1.00 (1.00–1.00) | 0.004 | - | - | - | - |
| SII # | 1.00 (1.00–1.00) | <0.001 | 1.00 (1.00–1.00) | 0.183 | ||||
| Fibrinogen | 1.00 (1.00–1.00) | 0.012 | 1.00 (1.00–1.01) | 0.173 | - | - | - | - |
| Fibrinogen # | - | - | - | - | 1.00 (1.00–1.00) | 0.056 | 1.00 (0.99–1.01) | 0.940 |
| CRP # | 1.07 (1.03–1.10) | <0.001 | 0.92 (0.80–1.06) | 0.229 | 1.14 (1.09–1.19) | <0.001 | 1.05 (0.93–1.19) | 0.404 |
| LDH # | 1.00 (1.00–1.00) | <0.001 | 1.00 (1.00–1.00) | 0.057 | 1.01 (1.01–1.01) | <0.001 | 1.01 (1.00–1.01) | 0.002 |
| Presepsin | 0.02 (1.00–1.00) | <0.001 | 1.00 (1.00–1.00) | <0.001 | 1.00 (1.00–1.00) | <0.001 | 1.00 (1.00–1.00) | 0.002 |
| OD | 1.31 (0.70–2.45) | 0.040 | 1.41 (0.19–10.28) | 0.735 | 1.45 (0.93–2.24) | 0.098 | 2.21 (0.45–11.00) | 0.331 |
| Duration of illness | - | - | - | - | 0.94 (0.92–0.96) | <0.001 | 1.11 (1.01–1.22) | 0.036 |
| Variable | ICU Admission | Short-Term Mortality | ||||
|---|---|---|---|---|---|---|
| OR (95%CI) Model 1 | OR (95%CI) Model 2 | OR (95%CI) Model 3 | OR (95%CI) Model 1 | OR (95%CI) Model 2 | OR (95%CI) Model 3 | |
| NLR # | 1.14 (1.06–1.22) | 1.12 (1.04–1.20) | 1.30 (1.09–1.57) | 1.28 (1.06–1.54) | ||
| MLR # | - | 2.46 (1.27–4.79) | 1.92 (0.79–4.71) * | 2.23 (1.07–4.65) | 1.84 (0.68–4.95) * | |
| Delta strain | 2.34 (1.12–4.90) | 2.48 (1.25–4.92) | 2.37 (1.13–4.97) | |||
| SaO2 (<90%) | - | 5.62 (1.51–20.91) | 1.29 (1.21–1.70) * | - | - | - |
| CCI | 1.49 (1.04–2.13) | 1.47 (1.05–2.05) | 1.50 (1.04–2.16) | |||
| SII | 1.00 (1.00–1.00) | 1.00 (1.00–1.00) | 1.00 (1.00–1.00) | |||
| SII # | 1.00 (1.00–1.00) * | - | 1.00 (1.00–1.00) * | |||
| Fibrinogen | - | - | 1.01 (1.00–1.01) * | |||
| Fibrinogen # | - | - | - | |||
| CRP # | - | - | - | - | - | - |
| LDH # | - | 1.00 (1.00–1.00) * | - | 1.01 (1.00–1.01) | 1.01 (1.00–1.01) | 1.01 (1.00–1.01) |
| Presepsin | 1.00 (1.00–1.00) | 1.00 (1.00–1.00) | 1.00 (1.00–1.00) | 1.00 (1.00–1.00) | 1.00 (1.00–1.00) | 1.00 (1.00–1.00) |
| OD | - | - | - | - | - | - |
| Duration of illness | 1.30 (1.09–1.57) | 1.11 (1.01–1.22) | 1.14 (1.02–1.26) | |||
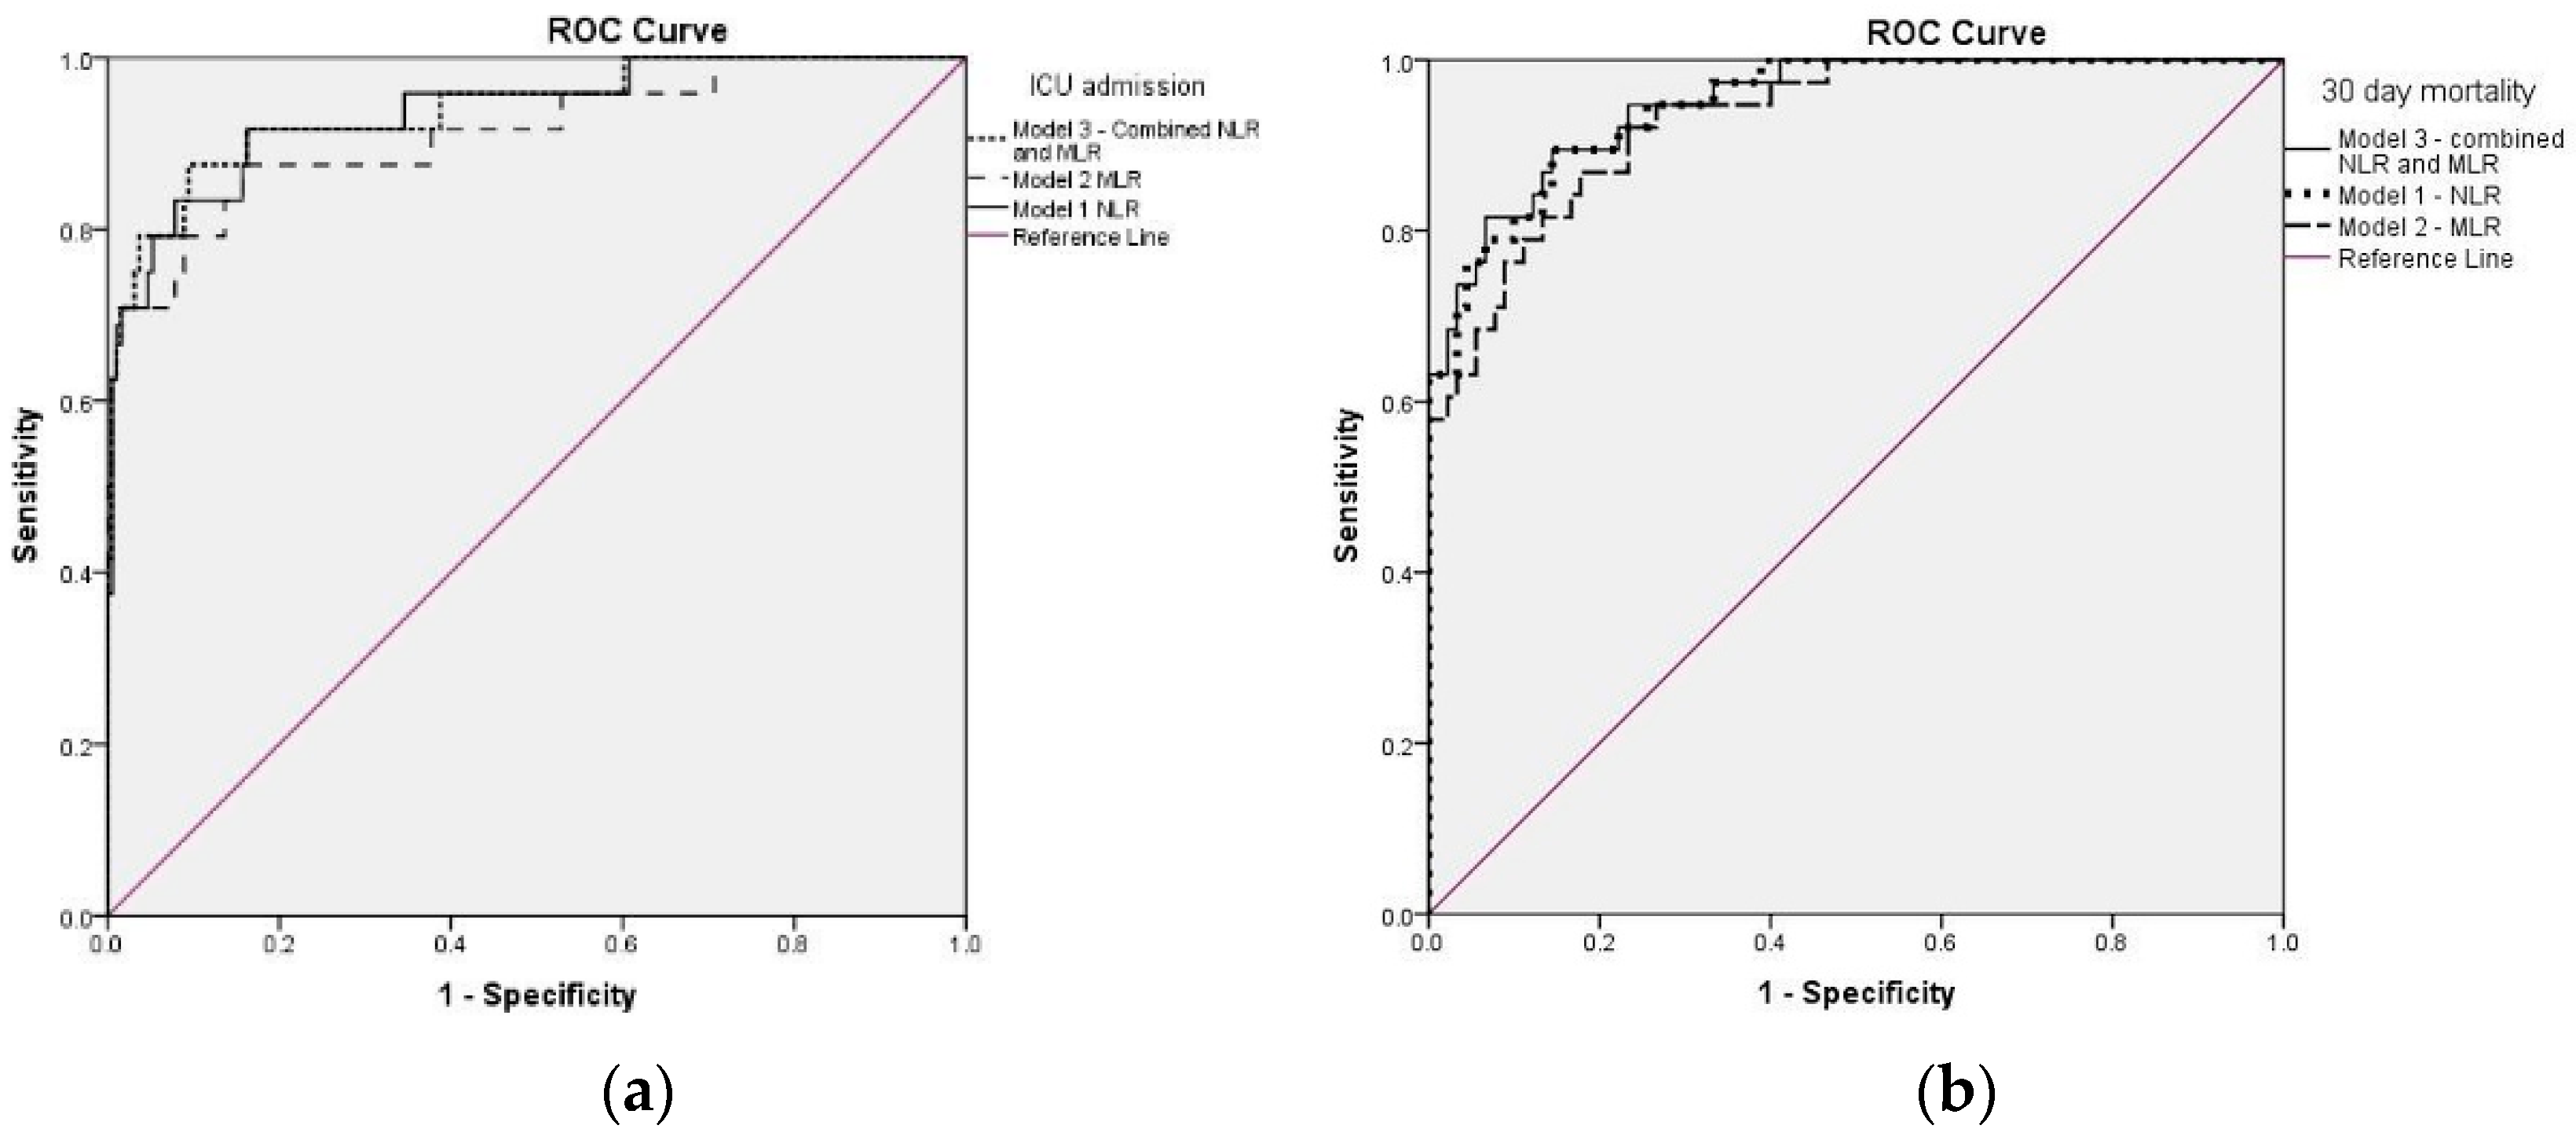
| ROC analysis | AUC (95%CI) | AUC (95%CI) | AUC (95%CI) | AUC (95%CI) | AUC (95%CI) | AUC (95%CI) |
| 0.937 (0.880–0.994) | 0.912 (0.838–0.986) | 0.939 (0.882–0.997) | 0.948 (0.911–0.984) | 0.931 (0.888–0.975) | 0.950 (0.914–0.986) | |
Publisher’s Note: MDPI stays neutral with regard to jurisdictional claims in published maps and institutional affiliations. |
© 2022 by the authors. Licensee MDPI, Basel, Switzerland. This article is an open access article distributed under the terms and conditions of the Creative Commons Attribution (CC BY) license (https://creativecommons.org/licenses/by/4.0/).
Share and Cite
Chelariu, A.-C.; Coman, A.E.; Lionte, C.; Gorciac, V.; Sorodoc, V.; Haliga, R.E.; Petris, O.R.; Bologa, C.; Puha, G.; Stoica, A.; et al. The Value of Early and Follow-Up Elevated Scores Based on Peripheral Complete Blood Cell Count for Predicting Adverse Outcomes in COVID-19 Patients. J. Pers. Med. 2022, 12, 2037. https://doi.org/10.3390/jpm12122037
Chelariu A-C, Coman AE, Lionte C, Gorciac V, Sorodoc V, Haliga RE, Petris OR, Bologa C, Puha G, Stoica A, et al. The Value of Early and Follow-Up Elevated Scores Based on Peripheral Complete Blood Cell Count for Predicting Adverse Outcomes in COVID-19 Patients. Journal of Personalized Medicine. 2022; 12(12):2037. https://doi.org/10.3390/jpm12122037
Chicago/Turabian StyleChelariu, Andrei-Costin, Adorata Elena Coman, Catalina Lionte, Victoria Gorciac, Victorita Sorodoc, Raluca Ecaterina Haliga, Ovidiu Rusalim Petris, Cristina Bologa, Gabriela Puha, Alexandra Stoica, and et al. 2022. "The Value of Early and Follow-Up Elevated Scores Based on Peripheral Complete Blood Cell Count for Predicting Adverse Outcomes in COVID-19 Patients" Journal of Personalized Medicine 12, no. 12: 2037. https://doi.org/10.3390/jpm12122037