
Myristic Acid Serum Levels and Their Significance for Diagnosis of Systemic Inflammatory Response, Sepsis, and Bacteraemia

 , , and
Abstract
:1. Introduction
2. Materials and Methods
2.1. Study Population
2.1.1. Sepsis Group
2.1.2. SIRS Group
2.1.3. Healthy Control Group
2.2. Myristic Acid Concentration Analysis
2.2.1. Chemicals
2.2.2. Procedure
2.3. Inflammatory Biomarkers and Other Standard Laboratory Tests
2.4. Blood Cultures
2.5. Statistical Analyses
3. Results
4. Discussion
Author Contributions
Funding
Institutional Review Board Statement
Informed Consent Statement
Data Availability Statement
Acknowledgments
Conflicts of Interest
References
- Rello, J.; van Engelen, T.S.R.; Alp, E.; Calandra, T.; Cattoir, V.; Kern, W.V.; Netea, M.G.; Nseir, S.; Opal, S.M.; van de Veerdonk, F.L.; et al. Towards Precision Medicine in Sepsis: A Position Paper from the European Society of Clinical Microbiology and Infectious Diseases. Clin. Microbiol. Infect. Off. Publ. Eur. Soc. Clin. Microbiol. Infect. Dis. 2018, 24, 1264–1272. [Google Scholar] [CrossRef] [Green Version]
- Atreya, M.R.; Wong, H.R. Precision Medicine in Pediatric Sepsis. Curr. Opin. Pediatr. 2019, 31, 322–327. [Google Scholar] [CrossRef]
- Seymour, C.W.; Gomez, H.; Chang, C.-C.H.; Clermont, G.; Kellum, J.A.; Kennedy, J.; Yende, S.; Angus, D.C. Precision Medicine for All? Challenges and Opportunities for a Precision Medicine Approach to Critical Illness. Crit. Care (Lond. Engl.) 2017, 21, 1–11. [Google Scholar] [CrossRef] [Green Version]
- Kosmides, A.K.; Kamisoglu, K.; Calvano, S.E.; Corbett, S.A.; Androulakis, I.P. Metabolomic Fingerprinting: Challenges and Opportunities. Crit. Rev. Biomed. Eng. 2013, 41, 205–221. [Google Scholar] [CrossRef] [PubMed]
- Eckerle, M.; Ambroggio, L.; Puskarich, M.A.; Winston, B.; Jones, A.E.; Standiford, T.J.; Stringer, K.A. Metabolomics as a Driver in Advancing Precision Medicine in Sepsis. Pharmacotherapy 2017, 37, 1023–1032. [Google Scholar] [CrossRef]
- Evangelatos, N.; Bauer, P.; Reumann, M.; Satyamoorthy, K.; Lehrach, H.; Brand, A. Metabolomics in Sepsis and Its Impact on Public Health. Public Health Genom. 2017, 20, 274–285. [Google Scholar] [CrossRef]
- Kamisoglu, K.; Sleight, K.E.; Calvano, S.E.; Coyle, S.M.; Corbett, S.A.; Androulakis, I.P. Temporal Metabolic Profiling of Plasma during Endotoxemia in Humans. Shock 2013, 40, 519–526. [Google Scholar] [CrossRef] [PubMed] [Green Version]
- Seymour, C.W.; Yende, S.; Scott, M.J.; Pribis, J.; Mohney, R.P.; Bell, L.N.; Chen, Y.-F.; Zuckerbraun, B.S.; Bigbee, W.L.; Yealy, D.M.; et al. Metabolomics in Pneumonia and Sepsis: An Analysis of the GenIMS Cohort Study. Intensive Care Med. 2013, 39, 1423–1434. [Google Scholar] [CrossRef]
- Langley, R.J.; Tsalik, E.L.; van Velkinburgh, J.C.; Glickman, S.W.; Rice, B.J.; Wang, C.; Chen, B.; Carin, L.; Suarez, A.; Mohney, R.P.; et al. An Integrated Clinico-Metabolomic Model Improves Prediction of Death in Sepsis. Sci. Transl. Med. 2013, 5, 195ra95. [Google Scholar] [CrossRef] [Green Version]
- Su, L.; Huang, Y.; Zhu, Y.; Xia, L.; Wang, R.; Xiao, K.; Wang, H.; Yan, P.; Wen, B.; Cao, L.; et al. Discrimination of Sepsis Stage Metabolic Profiles with an LC/MS-MS-Based Metabolomics Approach. BMJ Open Respir. Res. 2014, 1, e000056. [Google Scholar] [CrossRef] [Green Version]
- Kauppi, A.M.; Edin, A.; Ziegler, I.; Mölling, P.; Sjöstedt, A.; Gylfe, Å.; Strålin, K.; Johansson, A. Metabolites in Blood for Prediction of Bacteremic Sepsis in the Emergency Room. PLoS ONE 2016, 11, e0147670. [Google Scholar] [CrossRef]
- Cambiaghi, A.; Pinto, B.B.; Brunelli, L.; Falcetta, F.; Aletti, F.; Bendjelid, K.; Pastorelli, R.; Ferrario, M. Characterization of a Metabolomic Profile Associated with Responsiveness to Therapy in the Acute Phase of Septic Shock. Sci. Rep. 2017, 7, 1–16. [Google Scholar] [CrossRef] [Green Version]
- Servià, L.; Jové, M.; Sol, J.; Pamplona, R.; Badia, M.; Montserrat, N.; Portero-Otin, M.; Trujillano, J. A Prospective Pilot Study Using Metabolomics Discloses Specific Fatty Acid, Catecholamine and Tryptophan Metabolic Pathways as Possible Predictors for a Negative Outcome after Severe Trauma. Scand. J. Trauma Resusc. Emerg. Med. 2019, 27, 1–10. [Google Scholar] [CrossRef]
- Zazula, R.; Průcha, M.; Pehal, F.; Dryahina, K.; Moravec, M.; Müller, M.; Nejtek, T. Kinetics of Myristic Acid Following Accidentally Induced Septic Response. Prague Med. Rep. 2019, 120, 103–106. [Google Scholar] [CrossRef]
- Singer, M.; Deutschman, C.S.; Seymour, C.W.; Shankar-Hari, M.; Annane, D.; Bauer, M.; Bellomo, R.; Bernard, G.R.; Chiche, J.-D.; Coopersmith, C.M.; et al. The Third International Consensus Definitions for Sepsis and Septic Shock (Sepsis-3). JAMA 2016, 315, 801–810. [Google Scholar] [CrossRef]
- Vincent, J.L.; Moreno, R.; Takala, J.; Willatts, S.; De Mendonça, A.; Bruining, H.; Reinhart, C.K.; Suter, P.M.; Thijs, L.G. The SOFA (Sepsis-Related Organ Failure Assessment) Score to Describe Organ Dysfunction/Failure. On Behalf of the Working Group on Sepsis-Related Problems of the European Society of Intensive Care Medicine. Intensive Care Med. 1996, 22, 707–710. [Google Scholar] [CrossRef]
- American College of Chest Physicians/Society of Critical Care Medicine Consensus Conference: Definitions for Sepsis and Organ Failure and Guidelines for the Use of Innovative Therapies in Sepsis. Crit. Care Med. 1992, 20, 864–874. [CrossRef]
- Harbarth, S.; Holeckova, K.; Froidevaux, C.; Pittet, D.; Ricou, B.; Grau, G.E.; Vadas, L.; Pugin, J. Diagnostic Value of Procalcitonin, Interleukin-6, and Interleukin-8 in Critically Ill Patients Admitted with Suspected Sepsis. Am. J. Respir. Crit. Care Med. 2001, 164, 396–402. [Google Scholar] [CrossRef] [Green Version]
- Wyllie, D.H.; Bowler, I.C.J.W.; Peto, T.E.A. Bacteraemia Prediction in Emergency Medical Admissions: Role of C Reactive Protein. J. Clin. Pathol. 2005, 58, 352–356. [Google Scholar] [CrossRef] [Green Version]
- Hoeboer, S.H.; van der Geest, P.J.; Nieboer, D.; Groeneveld, A.B.J. The Diagnostic Accuracy of Procalcitonin for Bacteraemia: A Systematic Review and Meta-Analysis. Clin. Microbiol. Infect. Off. Publ. Eur. Soc. Clin. Microbiol. Infect. Dis. 2015, 21, 474–481. [Google Scholar] [CrossRef] [Green Version]
- Prucha, M.; Bellingan, G.; Zazula, R. Sepsis Biomarkers. Clin. Chim. Acta Int. J. Clin. Chem. 2015, 440, 97–103. [Google Scholar] [CrossRef]
- Bréchot, N.; Hékimian, G.; Chastre, J.; Luyt, C.-E. Procalcitonin to Guide Antibiotic Therapy in the ICU. Int. J. Antimicrob. Agents 2015, 46, S19–S24. [Google Scholar] [CrossRef] [PubMed] [Green Version]
- Samsudin, I.; Vasikaran, S.D. Clinical Utility and Measurement of Procalcitonin. Clin. Biochem. Rev. 2017, 38, 59–68. [Google Scholar] [PubMed]
- Albrich, W.C.; Harbarth, S. Pros and Cons of Using Biomarkers versus Clinical Decisions in Start and Stop Decisions for Antibiotics in the Critical Care Setting. Intensive Care Med. 2015, 41, 1739–1751. [Google Scholar] [CrossRef] [PubMed]
- Søgaard, M.; Nørgaard, M.; Pedersen, L.; Sørensen, H.T.; Schønheyder, H.C. Blood Culture Status and Mortality among Patients with Suspected Community-Acquired Bacteremia: A Population-Based Cohort Study. BMC Infect. Dis. 2011, 11, 139. [Google Scholar] [CrossRef] [Green Version]
- Laupland, K.B. Incidence of Bloodstream Infection: A Review of Population-Based Studies. Clin. Microbiol. Infect. Off. Publ. Eur. Soc. Clin. Microbiol. Infect. Dis. 2013, 19, 492–500. [Google Scholar] [CrossRef] [Green Version]
- Husek, P.; Liebich, H.M. Organic Acid Profiling by Direct Treatment of Deproteinized Plasma with Ethyl Chloroformate. J. Chromatogr. B Biomed. Appl. 1994, 656, 37–43. [Google Scholar] [CrossRef]
- Zong, G.; Li, Y.; Wanders, A.J.; Alssema, M.; Zock, P.L.; Willett, W.C.; Hu, F.B.; Sun, Q. Intake of Individual Saturated Fatty Acids and Risk of Coronary Heart Disease in US Men and Women: Two Prospective Longitudinal Cohort Studies. BMJ 2016, 355, i5796. [Google Scholar] [CrossRef] [Green Version]
- Ebbesson, S.O.E.; Voruganti, V.S.; Higgins, P.B.; Fabsitz, R.R.; Ebbesson, L.O.; Laston, S.; Harris, W.S.; Kennish, J.; Umans, B.D.; Wang, H.; et al. Fatty Acids Linked to Cardiovascular Mortality Are Associated with Risk Factors. Int. J. Circumpolar Health 2015, 74, 28055. [Google Scholar] [CrossRef] [Green Version]
- Rietschel, E.T.; Brade, L.; Brandenburg, K.; Flad, H.D.; de Jong-Leuveninck, J.; Kawahara, K.; Lindner, B.; Loppnow, H.; Lüderitz, T.; Schade, U. Chemical Structure and Biologic Activity of Bacterial and Synthetic Lipid A. Rev. Infect. Dis. 1987, 9, S527–S536. [Google Scholar] [CrossRef]
- Steimle, A.; Autenrieth, I.B.; Frick, J.-S. Structure and Function: Lipid A Modifications in Commensals and Pathogens. Int. J. Med. Microbiol. IJMM 2016, 306, 290–301. [Google Scholar] [CrossRef] [Green Version]
- Jennings, B.C.; Linder, M.E. Chapter 200-Regulation of G Proteins by Covalent Modification. In Handbook of Cell Signaling, 2nd ed.; Bradshaw, R.A., Dennis, E.A., Eds.; Academic Press: Cambridge, MA, USA, 2010; ISBN 978-0-12-374145-5. [Google Scholar]
- Stillwell, W. Chapter 6-Membrane Proteins. In An Introduction to Biological Membranes, 2nd ed.; Stillwell, W., Ed.; Elsevier: Amsterdam, The Netherlands, 2016; ISBN 978-0-444-63772-7. [Google Scholar]
- Nelson, A.R.; Borland, L.; Allbritton, N.L.; Sims, C.E. Myristoyl-Based Transport of Peptides into Living Cells. Biochemistry 2007, 46, 14771–14781. [Google Scholar] [CrossRef] [PubMed] [Green Version]
- Udenwobele, D.I.; Su, R.-C.; Good, S.V.; Ball, T.B.; Varma Shrivastav, S.; Shrivastav, A. Myristoylation: An Important Protein Modification in the Immune Response. Front. Immunol. 2017, 8, 751. [Google Scholar] [CrossRef] [PubMed] [Green Version]
- Korbecki, J.; Bajdak-Rusinek, K. The Effect of Palmitic Acid on Inflammatory Response in Macrophages: An Overview of Molecular Mechanisms. Inflamm. Res. Off. J. Eur. Histamine Res. Soc. 2019, 68, 915–932. [Google Scholar] [CrossRef] [PubMed] [Green Version]
- Kosciuk, T.; Lin, H. N-Myristoyltransferase as a Glycine and Lysine Myristoyltransferase in Cancer, Immunity, and Infections. ACS Chem. Biol. 2020, 15, 1747–1758. [Google Scholar] [CrossRef] [PubMed]
- Maurer-Stroh, S.; Eisenhaber, F. Myristoylation of Viral and Bacterial Proteins. Trends Microbiol. 2004, 12, 178–185. [Google Scholar] [CrossRef]
- Sobocińska, J.; Roszczenko-Jasińska, P.; Ciesielska, A.; Kwiatkowska, K. Protein Palmitoylation and Its Role in Bacterial and Viral Infections. Front. Immunol. 2017, 8, 2003. [Google Scholar] [CrossRef] [Green Version]
- Fong, Y.M.; Marano, M.A.; Moldawer, L.L.; Wei, H.; Calvano, S.E.; Kenney, J.S.; Allison, A.C.; Cerami, A.; Shires, G.T.; Lowry, S.F. The Acute Splanchnic and Peripheral Tissue Metabolic Response to Endotoxin in Humans. J. Clin. Investig. 1990, 85, 1896–1904. [Google Scholar] [CrossRef] [Green Version]
- Lowry, S.F. Human Endotoxemia: A Model for Mechanistic Insight and Therapeutic Targeting. Shock 2005, 24, 94–100. [Google Scholar] [CrossRef]
- Calvano, S.E.; Coyle, S.M. Experimental Human Endotoxemia: A Model of the Systemic Inflammatory Response Syndrome? Surg. Infect. 2012, 13, 293–299. [Google Scholar] [CrossRef]
- Dandona, P.; Nix, D.; Wilson, M.F.; Aljada, A.; Love, J.; Assicot, M.; Bohuon, C. Procalcitonin Increase after Endotoxin Injection in Normal Subjects. J. Clin. Endocrinol. Metab. 1994, 79, 1605–1608. [Google Scholar] [CrossRef]
- Wright, M.H.; Paape, D.; Storck, E.M.; Serwa, R.A.; Smith, D.F.; Tate, E.W. Global Analysis of Protein N-Myristoylation and Exploration of N-Myristoyltransferase as a Drug Target in the Neglected Human Pathogen Leishmania Donovani. Chem. Biol. 2015, 22, 342–354. [Google Scholar] [CrossRef] [Green Version]
- Wright, M.H.; Heal, W.P.; Mann, D.J.; Tate, E.W. Protein Myristoylation in Health and Disease. J. Chem. Biol. 2010, 3, 19–35. [Google Scholar] [CrossRef] [Green Version]
- Zazula, R.; Prucha, M.; Tyll, T.; Kieslichova, E. Induction of Procalcitonin in Liver Transplant Patients Treated with Anti-Thymocyte Globulin. Crit. Care Lond. Engl. 2007, 11, 1–5. [Google Scholar] [CrossRef] [PubMed] [Green Version]
- de Oliveira, V.M.; Moraes, R.B.; Stein, A.T.; Wendland, E.M. Accuracy of C-Reactive Protein as a Bacterial Infection Marker in Critically Immunosuppressed Patients: A Systematic Review and Meta-Analysis. J. Crit. Care 2017, 42, 129–137. [Google Scholar] [CrossRef] [PubMed]


| Group | Inclusion Criteria | Exclusion Criteria |
|---|---|---|
| Sepsis | At least two qSOFA criteria present [15]:
Infection clinically suspected | Moribund patient expected to die within 24 h After cardiopulmonary resuscitation or prolonged severe hypoperfusion Immunodeficiency (hematologic malignancies, HIV, congenital) Age < 18 years |
| SIRS | Patients undergoing elective surgery At least two criteria present [17]:
| Immunosuppression Infection proved within 10 days following surgery Death within 30 days following surgery Age < 18 years |
| Age (years) | 65 (48–69) * |
| Male gender (n, %) | 23 (67.6) |
| Female gender (n, %) | 11 (32.4) |
| Bacteraemia (n, %) | 12 (35.3) |
| Without bacteraemia (n, %) | 22 (64.7) |
| Comorbid conditions (n) | |
| arterial hypertension | 28 |
| asthma bronchiale | 6 |
| chronic kidney disease | 7 |
| chronic obstructive pulmonary disease | 2 |
| hyperlipidaemia | 12 |
| hypothyroidism | 6 |
| ischemic heart disease | 7 |
| type 1 diabetes | 1 |
| type 2 diabetes | 16 |
| Infectious focus (n, %) | |
| gastrointestinal | 9 (26.5) |
| soft tissue/bone | 2 (5.9) |
| respiratory | 14 (41.2) |
| urinary tract | 5 (14.7) |
| mixed | 4 (11.8) |
| Blood culture results (n, %) | |
| Clostridium sp. | 1 (6.3) |
| Enterobacter cloacae | 1 (6.3) |
| Escherichia coli | 4 (25) |
| Klebsiella pneumoniae | 3 (18.8) |
| Proteus mirabilis | 1 (6.3) |
| Staphylococcus aureus | 1 (6.3) |
| Staphylococcus epidermidis | 1 (6.3) |
| Streptococcus pneumoniae | 2 (12.5) |
| Streptococcus pyogenes | 2 (12.5) |
| Mechanical ventilation (n, %) | 30 (88.2) |
| Septic shock (n, %) | 24 (70.6) |
| SOFA at T0 (points) | 9 (8–12) |
| Age (years) | 66 (61–72) * |
| Male gender (n, %) | 19 (61.3) |
| Female gender (n, %) | 12 (38.7) |
| SIRS without malignancy (n, %) | 16 (51.6) |
| SIRS with malignancy (n, %) | 15 (48.4) |
| Type of surgery (n, %) | |
| A. illiaca communis aneurysm | 1 (3.2) |
| Abdominal aorta aneurysm | 6 (19.4) |
| Lower limb ischemia | 2 (6.5) |
| Polycystic kidney disease | 1 (3.2) |
| Ileus | 1 (3.2) |
| Vena portae trombosis | 1 (3.2) |
| Chronic pancreatits | 1 (3.2) |
| Ileostomy | 1 (3.2) |
| Short bowel syndrome | 1 (3.2) |
| A. illiaca communis thrombosis | 1 (3.2) |
| Colorectal carcinoma | 5 (16.1) |
| Liver tumour | 5 (16.1) |
| Kidney tumour | 1 (3.2) |
| Pancreatic tumour | 3 (9.7) |
| Small bowl Gastrointestinal stromal tumor | 1 (3.2) |
| (Sub-)Group | Serum Concentration of Myristic Acid (µmol/L) | |||||
|---|---|---|---|---|---|---|
| T0 | T12 | D1 | D3 | D5 | Peak | |
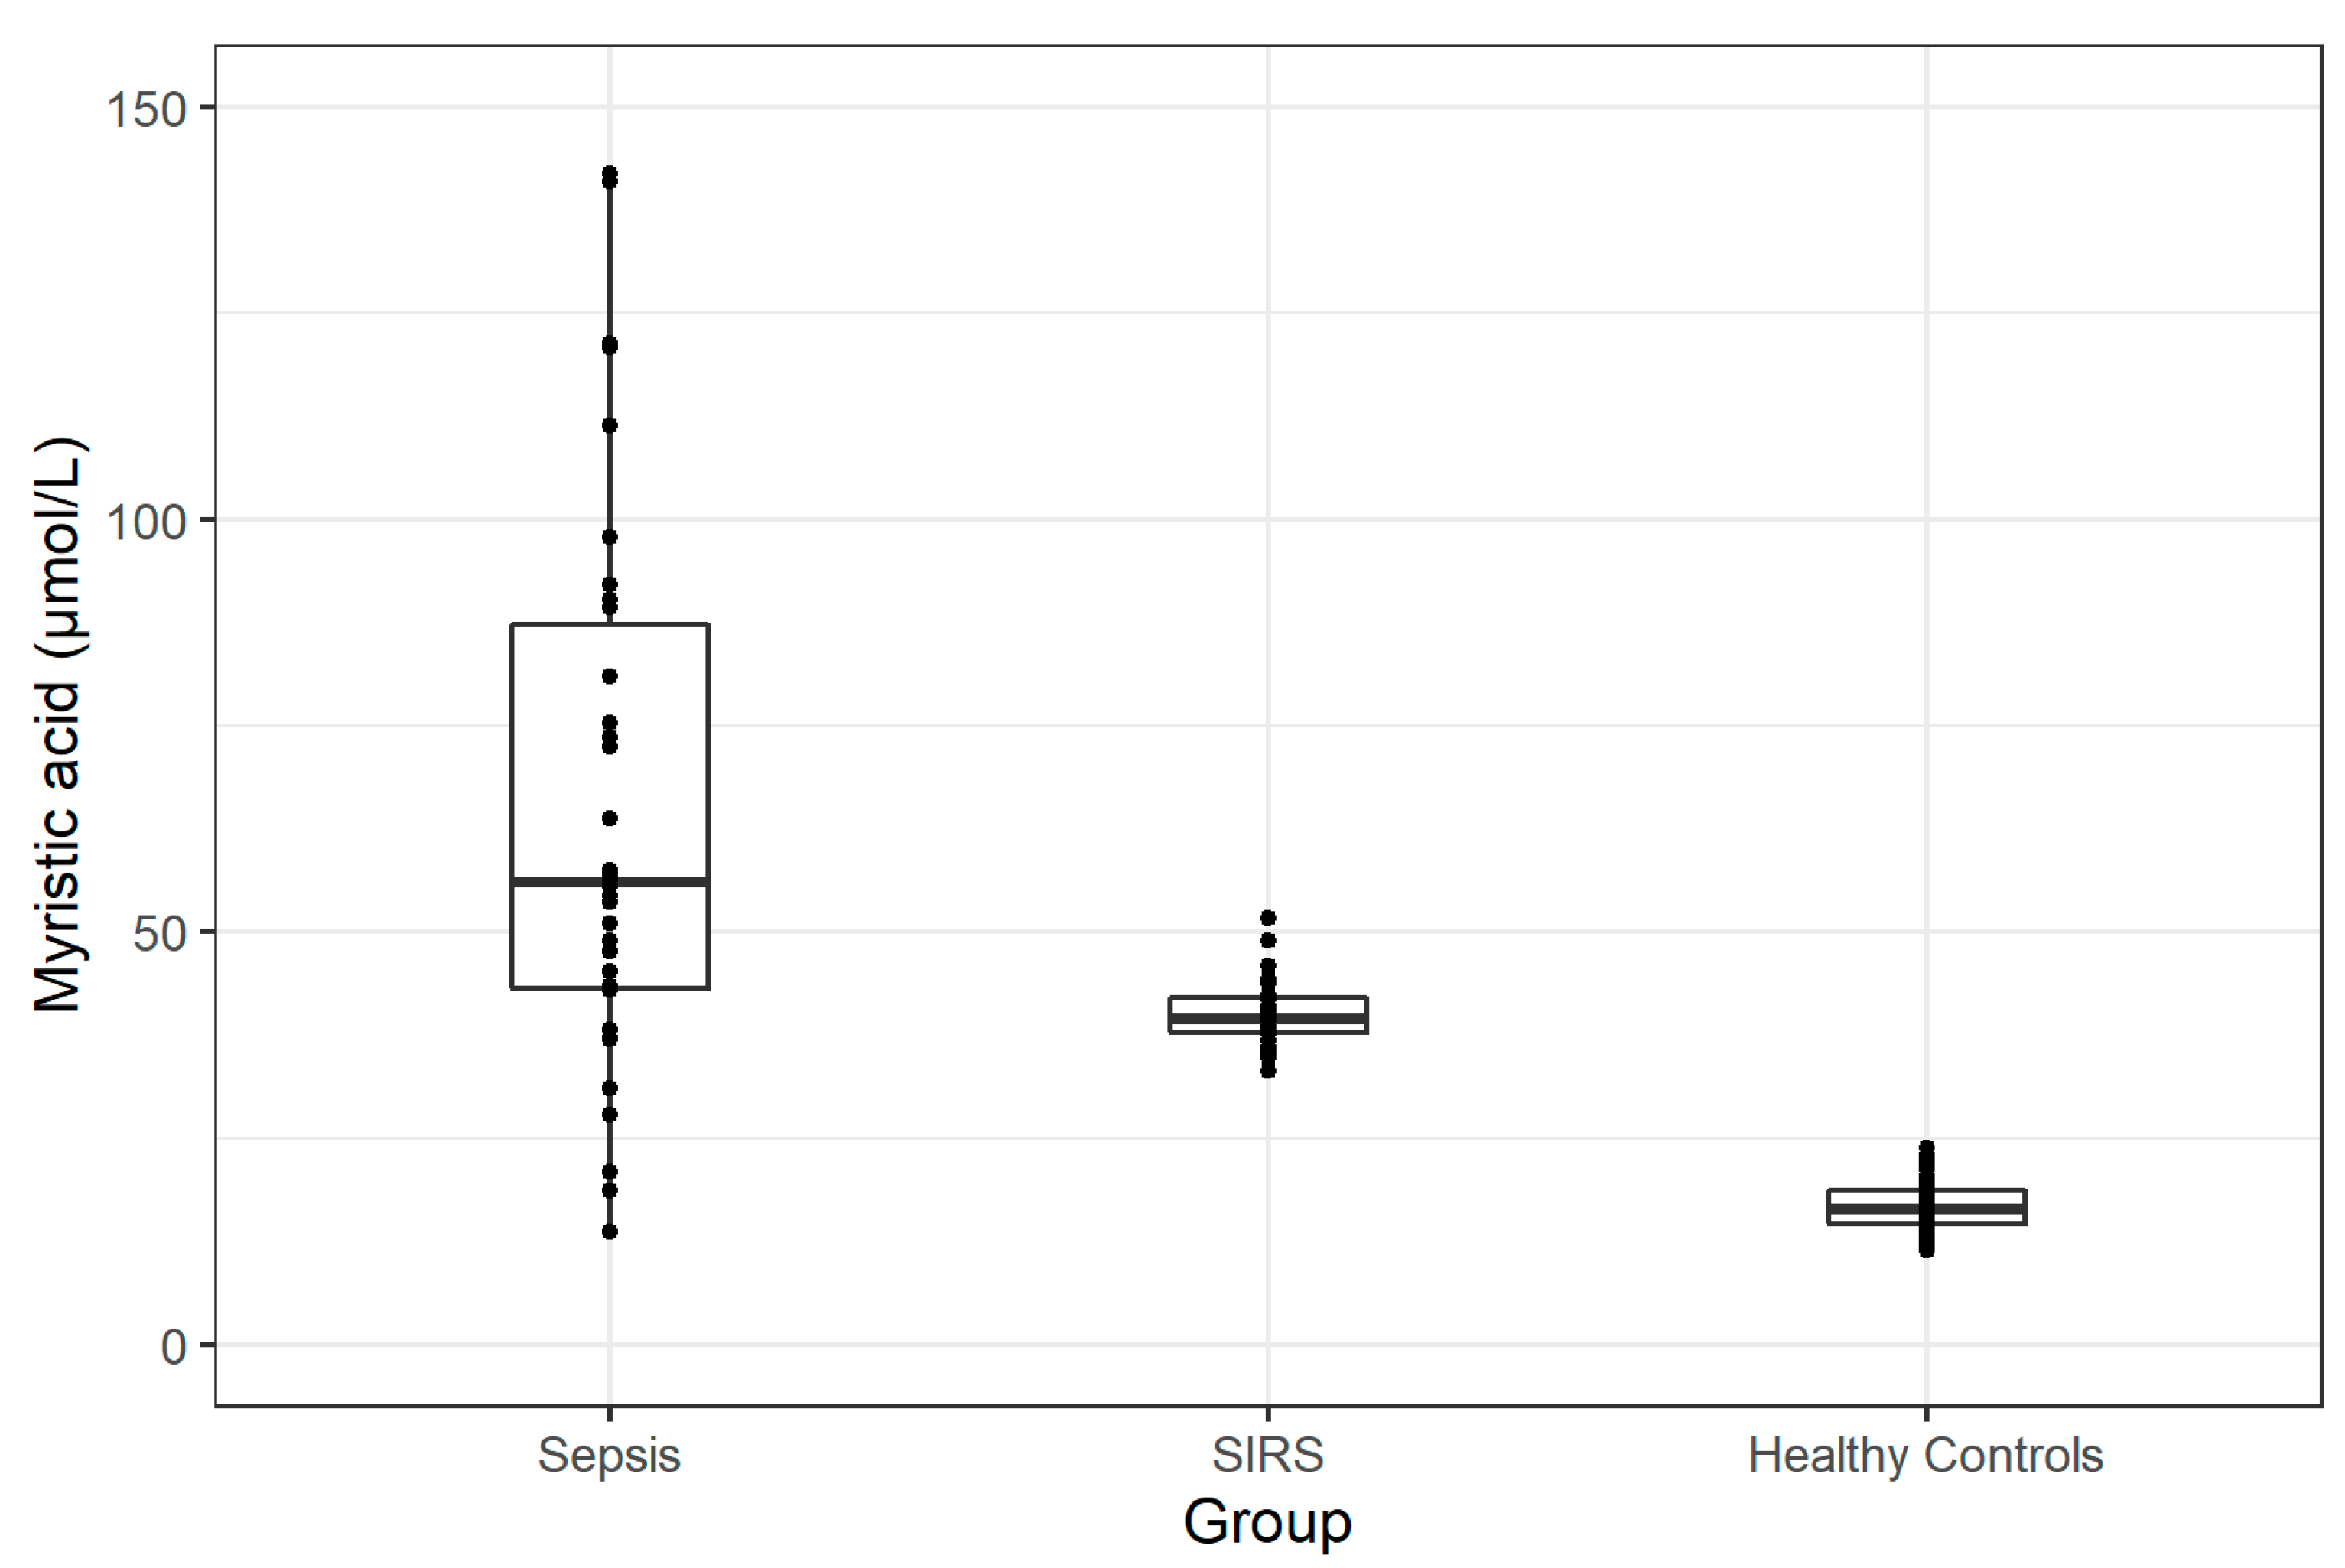
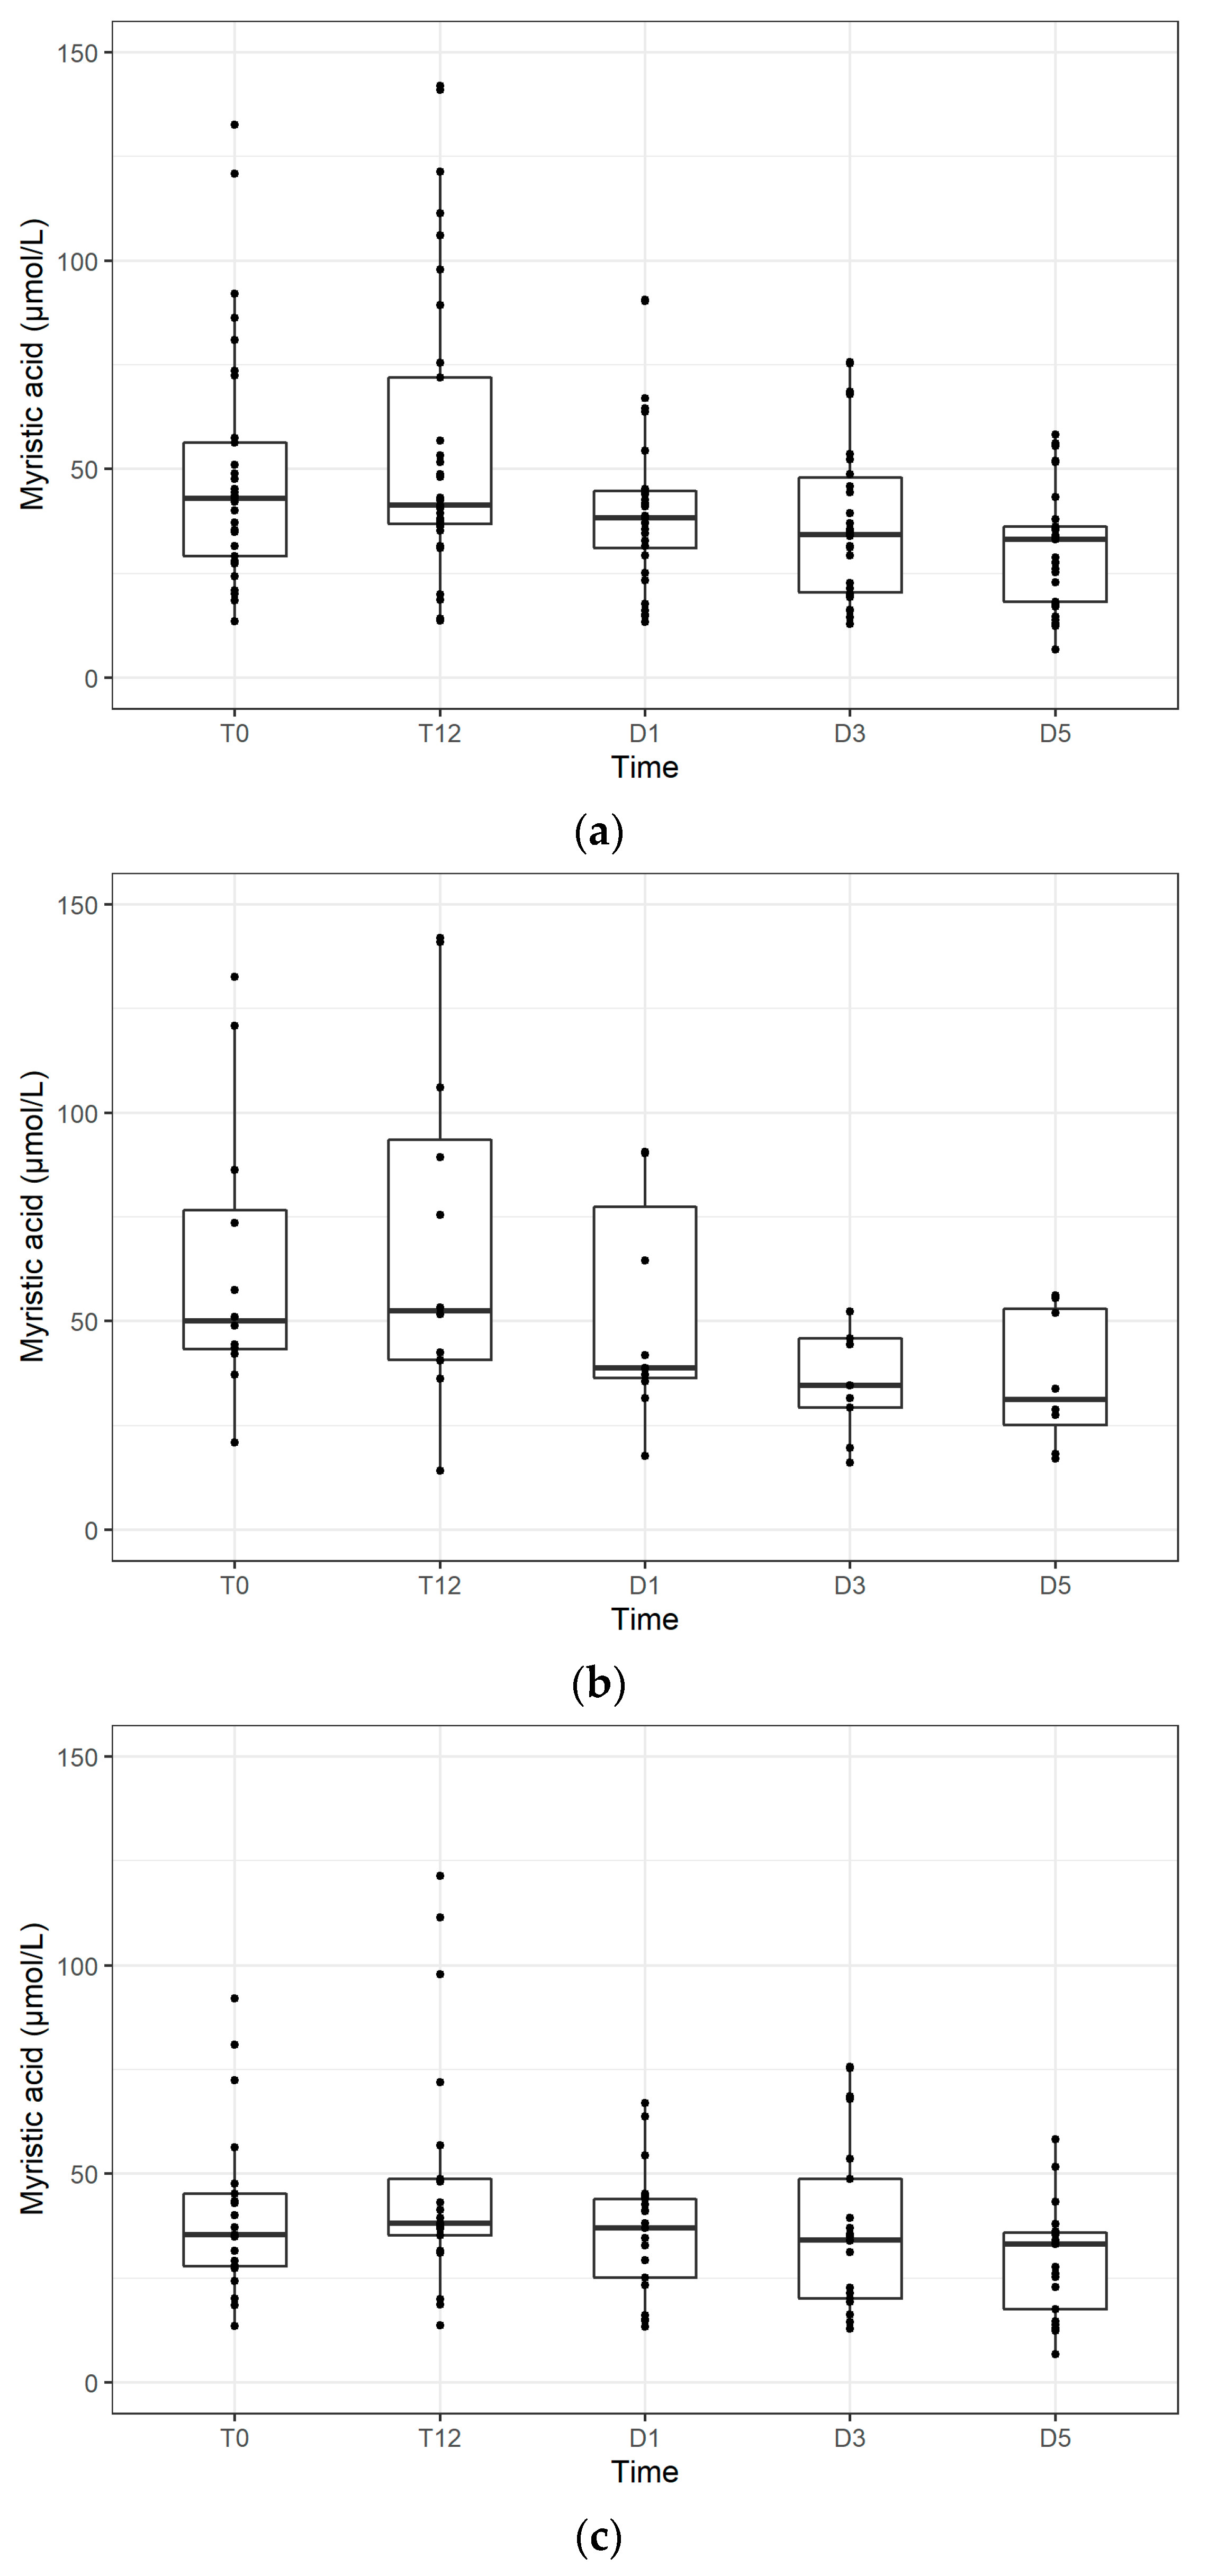
| Sepsis Group in Total | 43.0 (28.6–57.0) | 41.3 (36.9–72.0) | 38.4 (31.0–44.8) | 34.4 (20.5–48.0) | 33.1 (18.2–36.3) | 56.0 (41.8–89.5) |
| Sepsis with Bacteraemia | 50.0 (42.5–83.0) | 52.5 (40.7–93.5) | 38.8 (36.4–77.4) | 34.6 (29.3–45.8) | 31.3 (25.2–52.9) | 65.5 (49.5–113.2) |
| Sepsis without Bacteraemia | 35.4 (27.6–46.5) | 38.2 (35.2–48.8) | 37.1 (25.1–43.9) | 34.1 (20.2–48.8) | 33.1 (17.5–35.9) | 54.0 (37.9–76.7) |
| SIRS | 37.7 (35.6–40.3) | 37.3 (34.7–38.7) | 36.2 (34.1–37.3) | 36.4 (34.6–37.7) | 39.5 (37.7–42.3) | |
| Healthy Subjects | 16.5 (14.6–18.7) | |||||
| Groups | T0 | Peak |
|---|---|---|
| Sepsis—Healthy Subjects | p < 0.0001 | p < 0.0001 |
| Sepsis—SIRS | p = 0.5 | p = 0.0006 |
| SIRS—Healthy Subjects | p < 0.0001 | p < 0.0001 |
Publisher’s Note: MDPI stays neutral with regard to jurisdictional claims in published maps and institutional affiliations. |
© 2021 by the authors. Licensee MDPI, Basel, Switzerland. This article is an open access article distributed under the terms and conditions of the Creative Commons Attribution (CC BY) license (https://creativecommons.org/licenses/by/4.0/).
Share and Cite
Zazula, R.; Moravec, M.; Pehal, F.; Nejtek, T.; Protuš, M.; Müller, M. Myristic Acid Serum Levels and Their Significance for Diagnosis of Systemic Inflammatory Response, Sepsis, and Bacteraemia. J. Pers. Med. 2021, 11, 306. https://doi.org/10.3390/jpm11040306
Zazula R, Moravec M, Pehal F, Nejtek T, Protuš M, Müller M. Myristic Acid Serum Levels and Their Significance for Diagnosis of Systemic Inflammatory Response, Sepsis, and Bacteraemia. Journal of Personalized Medicine. 2021; 11(4):306. https://doi.org/10.3390/jpm11040306
Chicago/Turabian StyleZazula, Roman, Michal Moravec, František Pehal, Tomáš Nejtek, Marek Protuš, and Martin Müller. 2021. "Myristic Acid Serum Levels and Their Significance for Diagnosis of Systemic Inflammatory Response, Sepsis, and Bacteraemia" Journal of Personalized Medicine 11, no. 4: 306. https://doi.org/10.3390/jpm11040306