
Optimal Combinations of Chemotherapy and Radiotherapy in Low-Grade Gliomas: A Mathematical Approach

 , , , , , and
Abstract
:1. Introduction
2. Materials and Methods
2.1. Patient Population
2.2. Image Acquisition and Radiological Measurements of Tumor Size
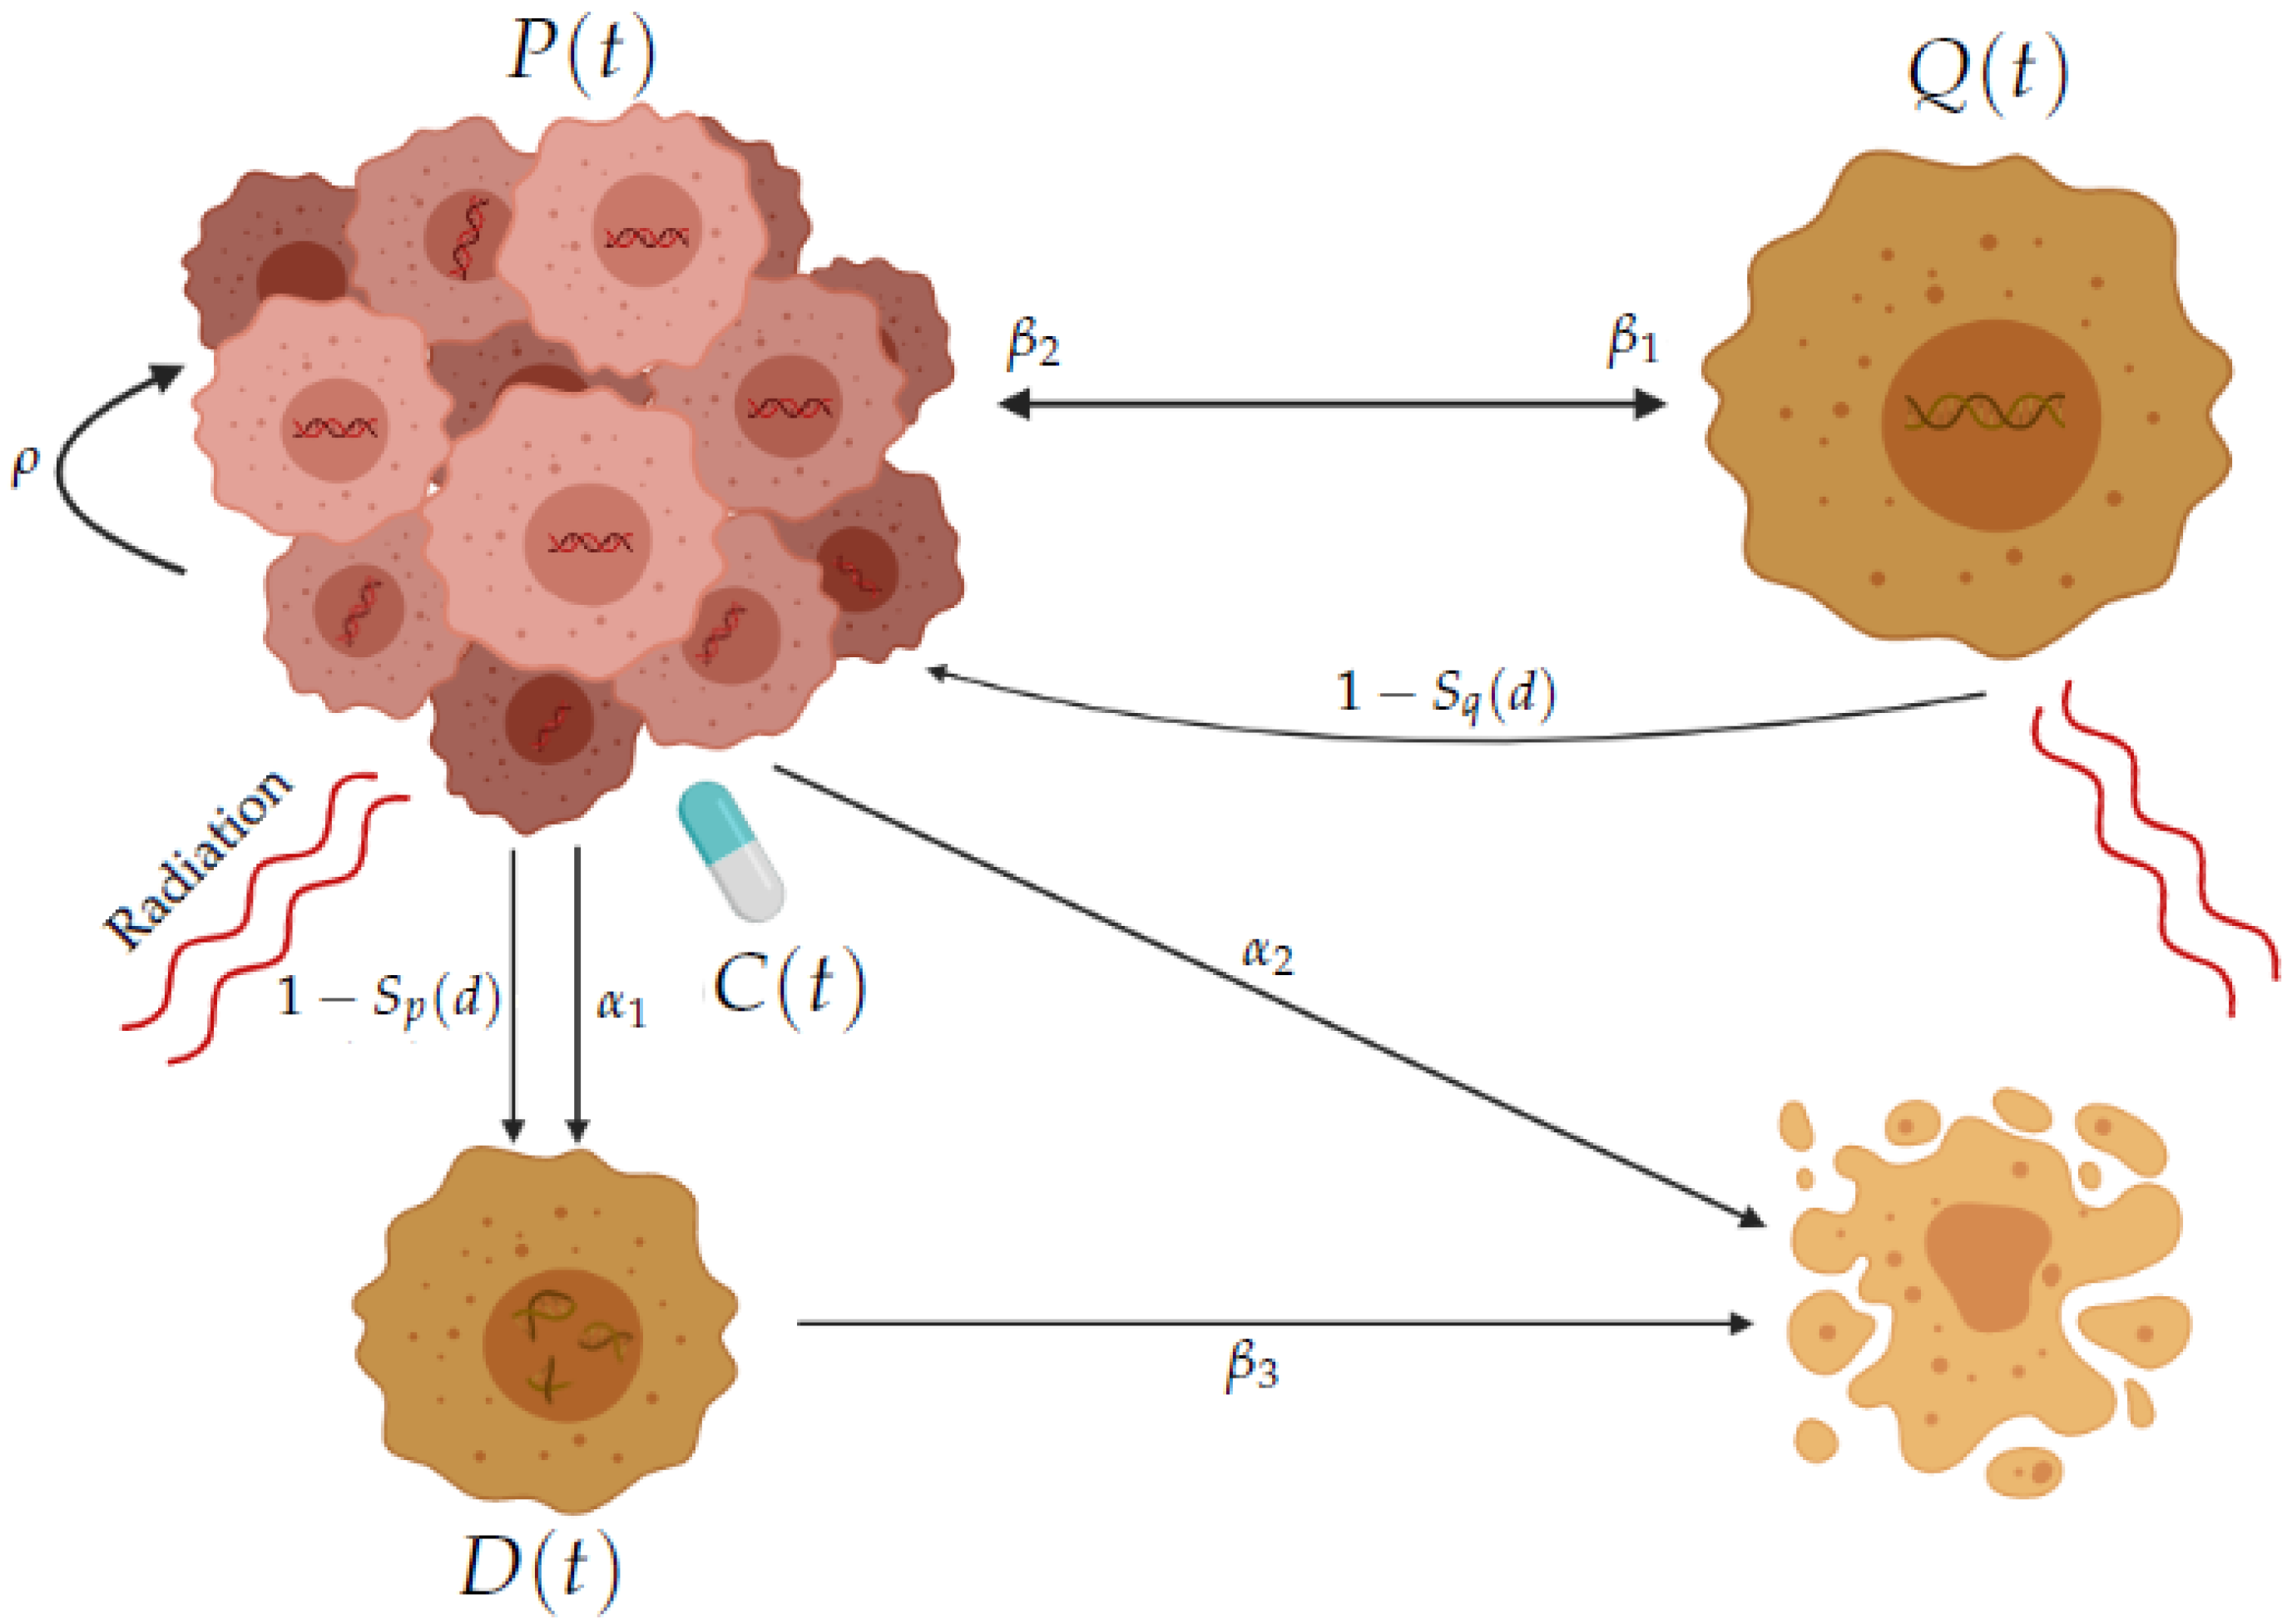
2.3. Mathematical Model
2.4. Parameter Estimation
2.4.1. TMZ Concentration in the Brain
2.4.2. Parameter Fitting
2.5. RT-Only Virtual Experiments
2.6. In-Silico Patients
2.7. In-Silico Trial Comparing Different Treatment Modalities/Schedules
- I.
- Control group without treatment;
- II.
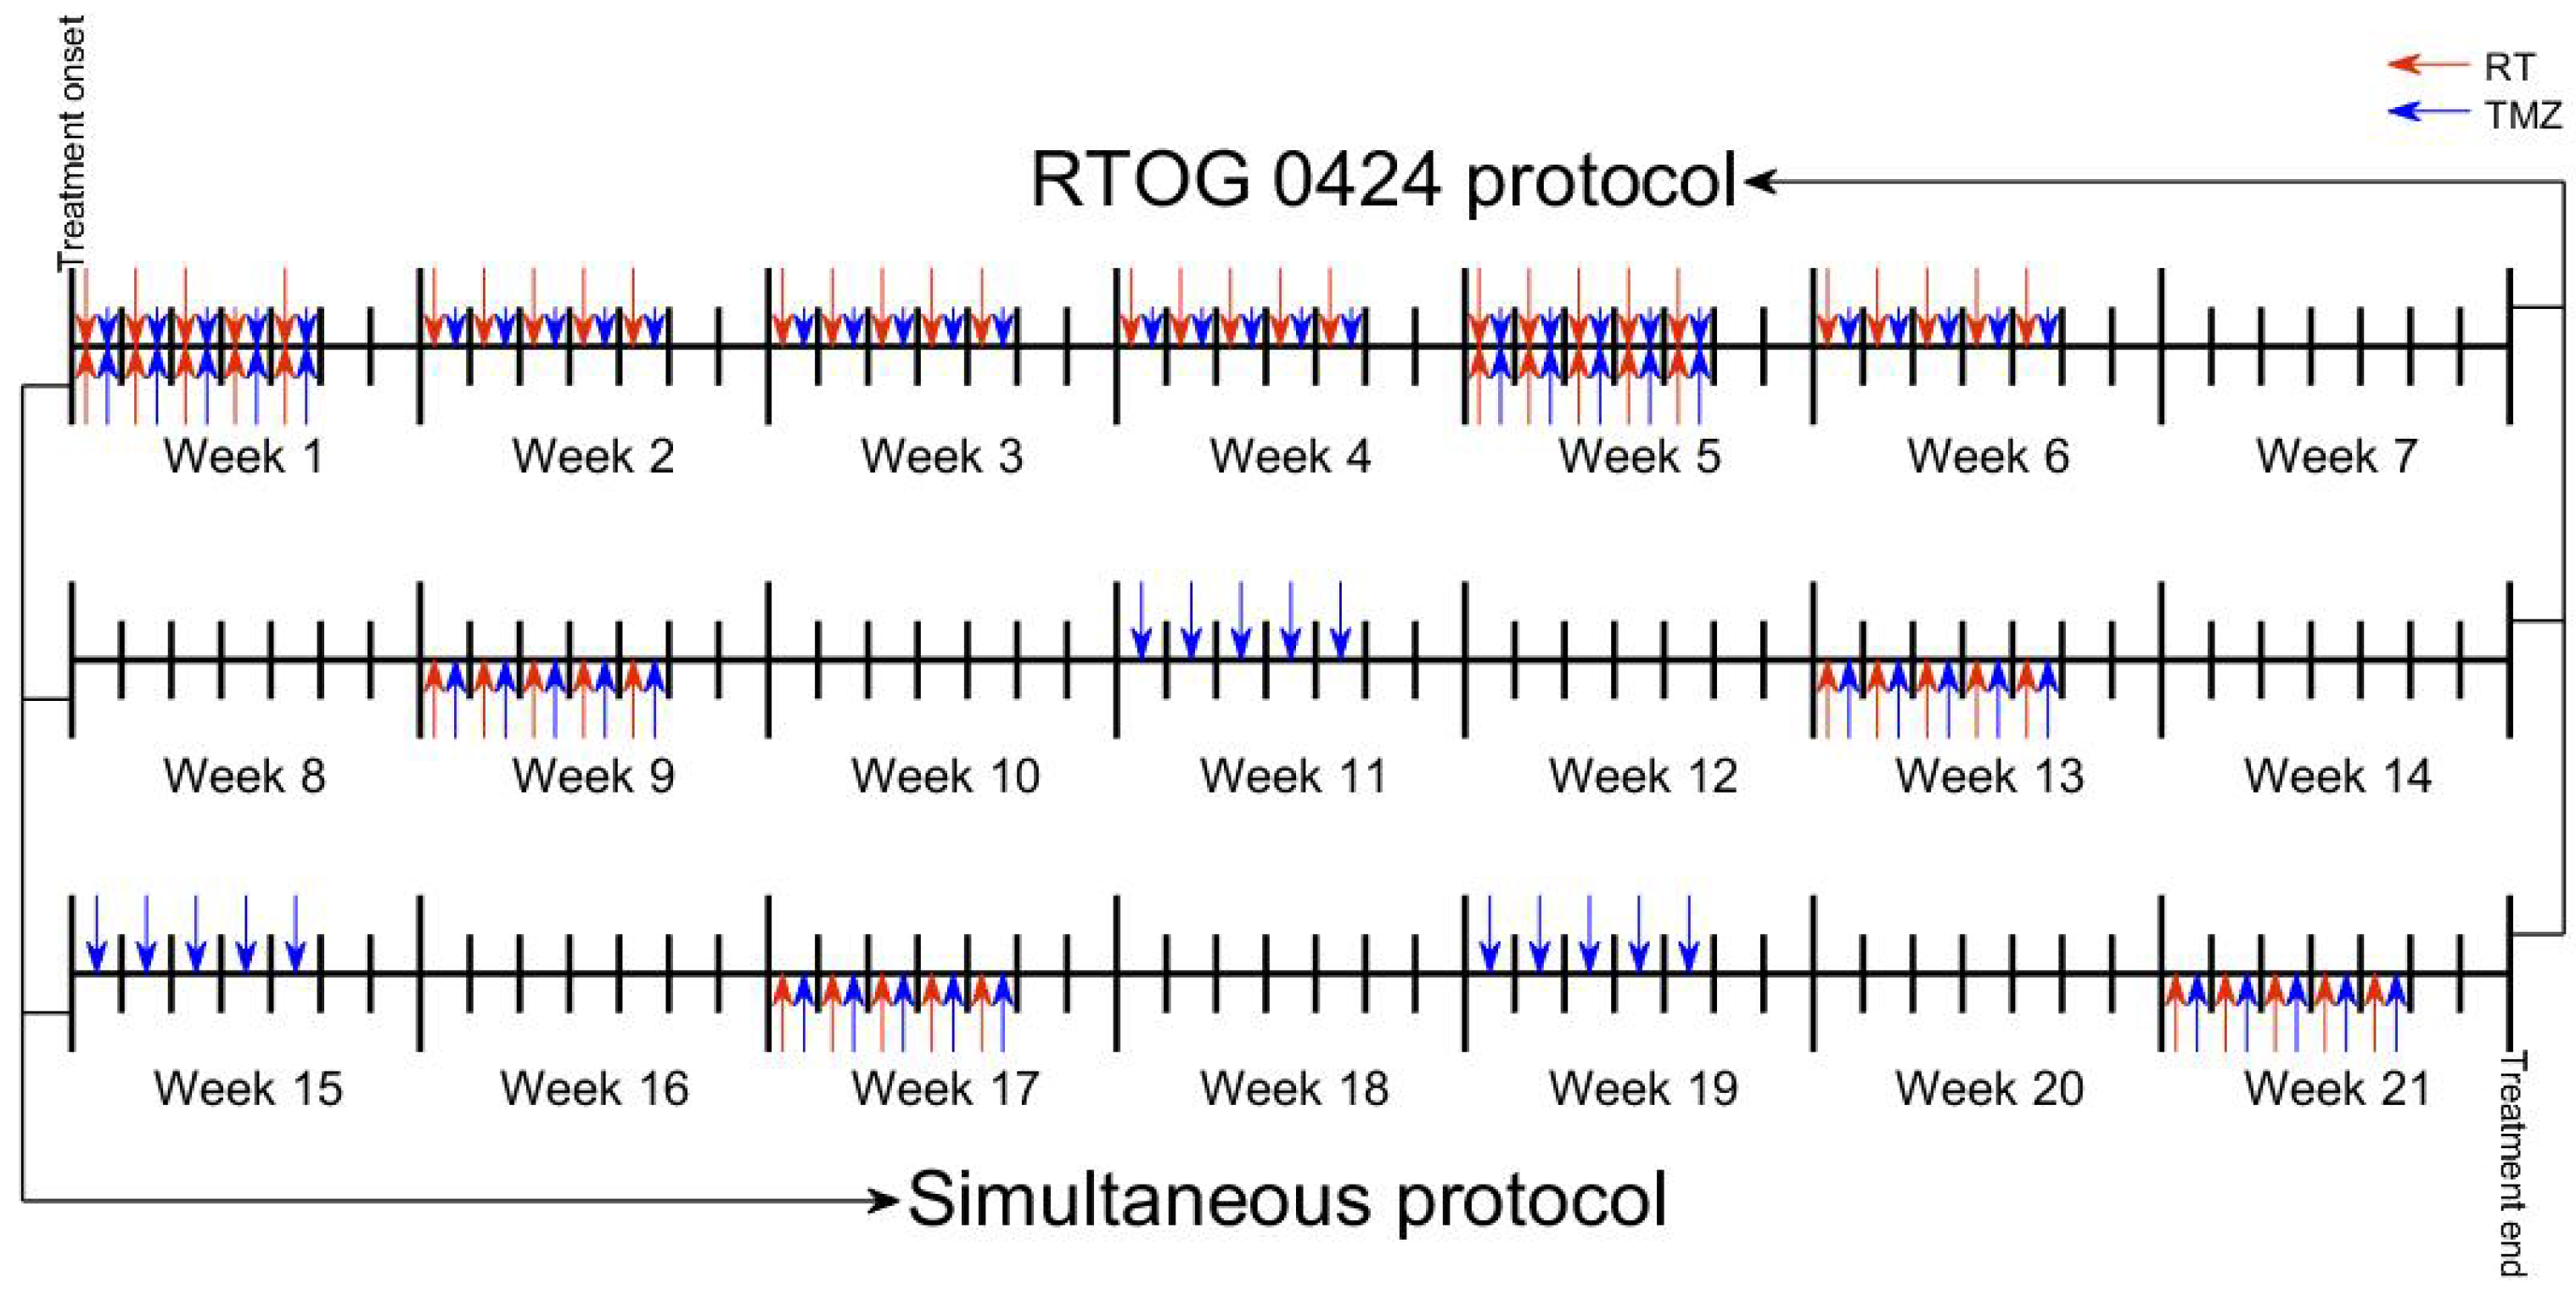
- RT (1.8 Gy)+TMZ (concurrently 75 mg/m/day and post-radiation 150–200 mg/m/ day) according to RTOG 0424. For simplicity, we assumed a fixed-dose equal to 150 mg/m/day in all TMZ cycles;
- III.
- RT+TMZ matching the doses of RT (1.8 Gy) to those of TMZ (150 mg/m/day) in the first five days of each cycle (of length 28 days).
3. Results
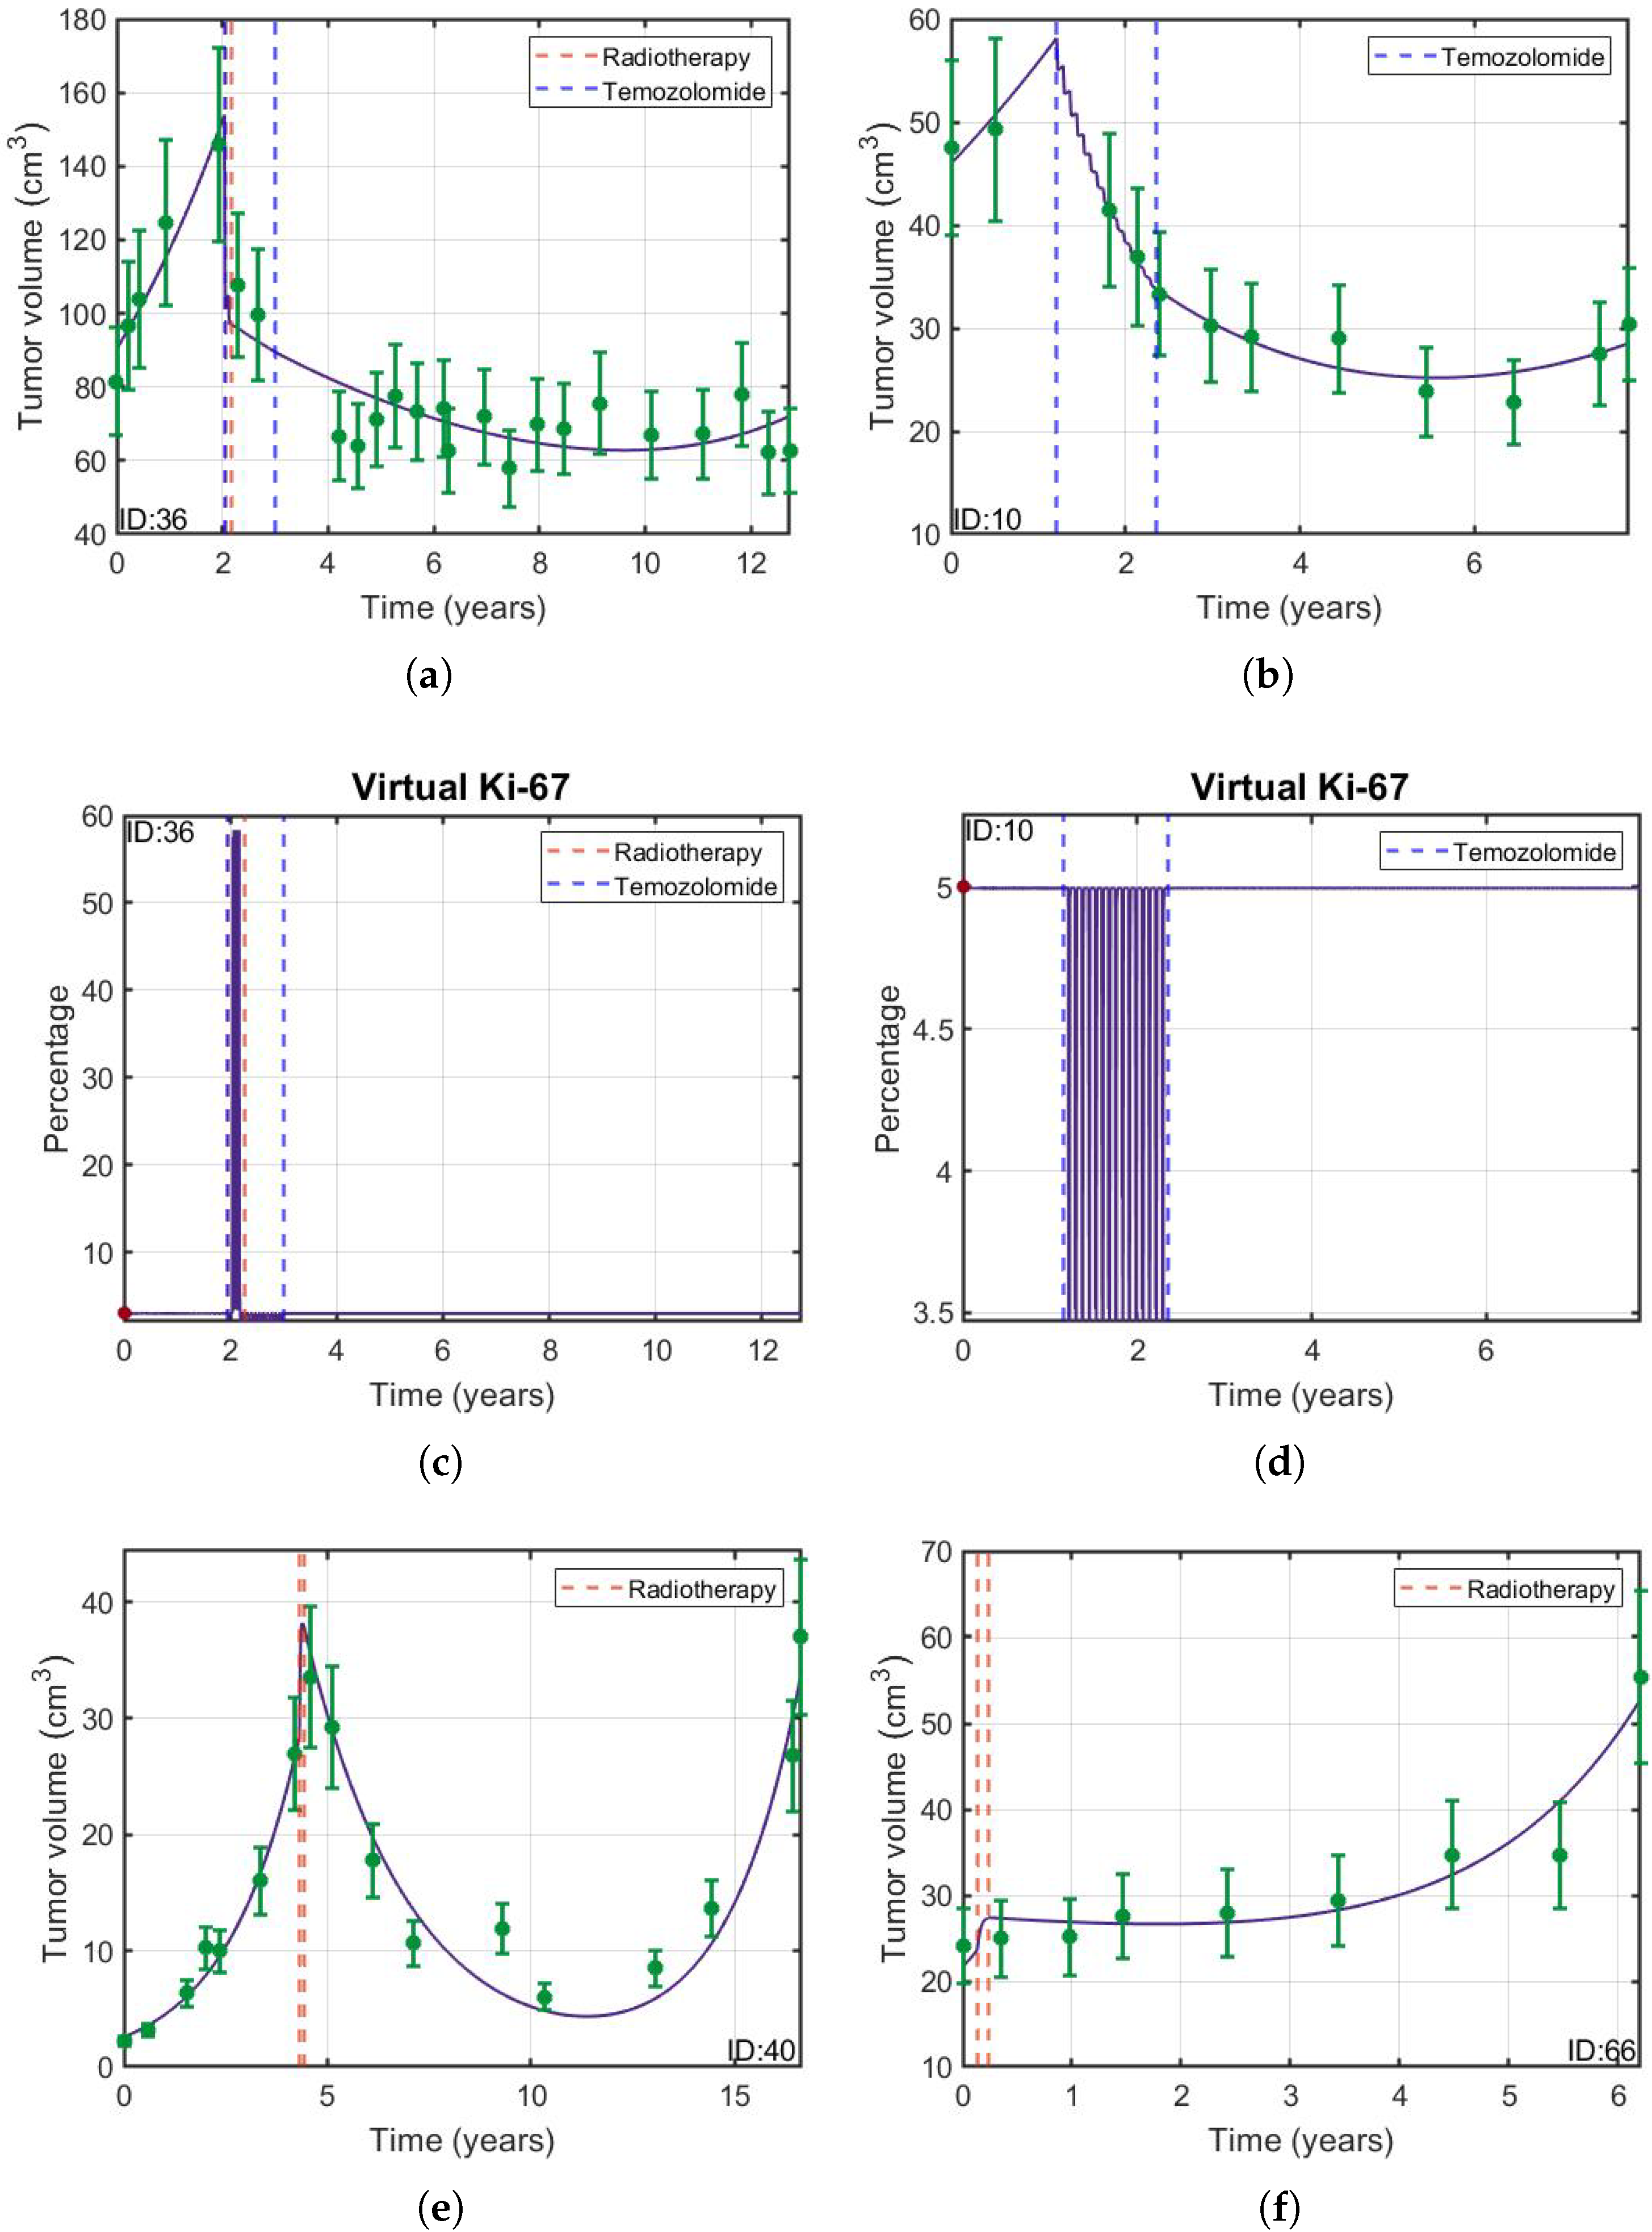
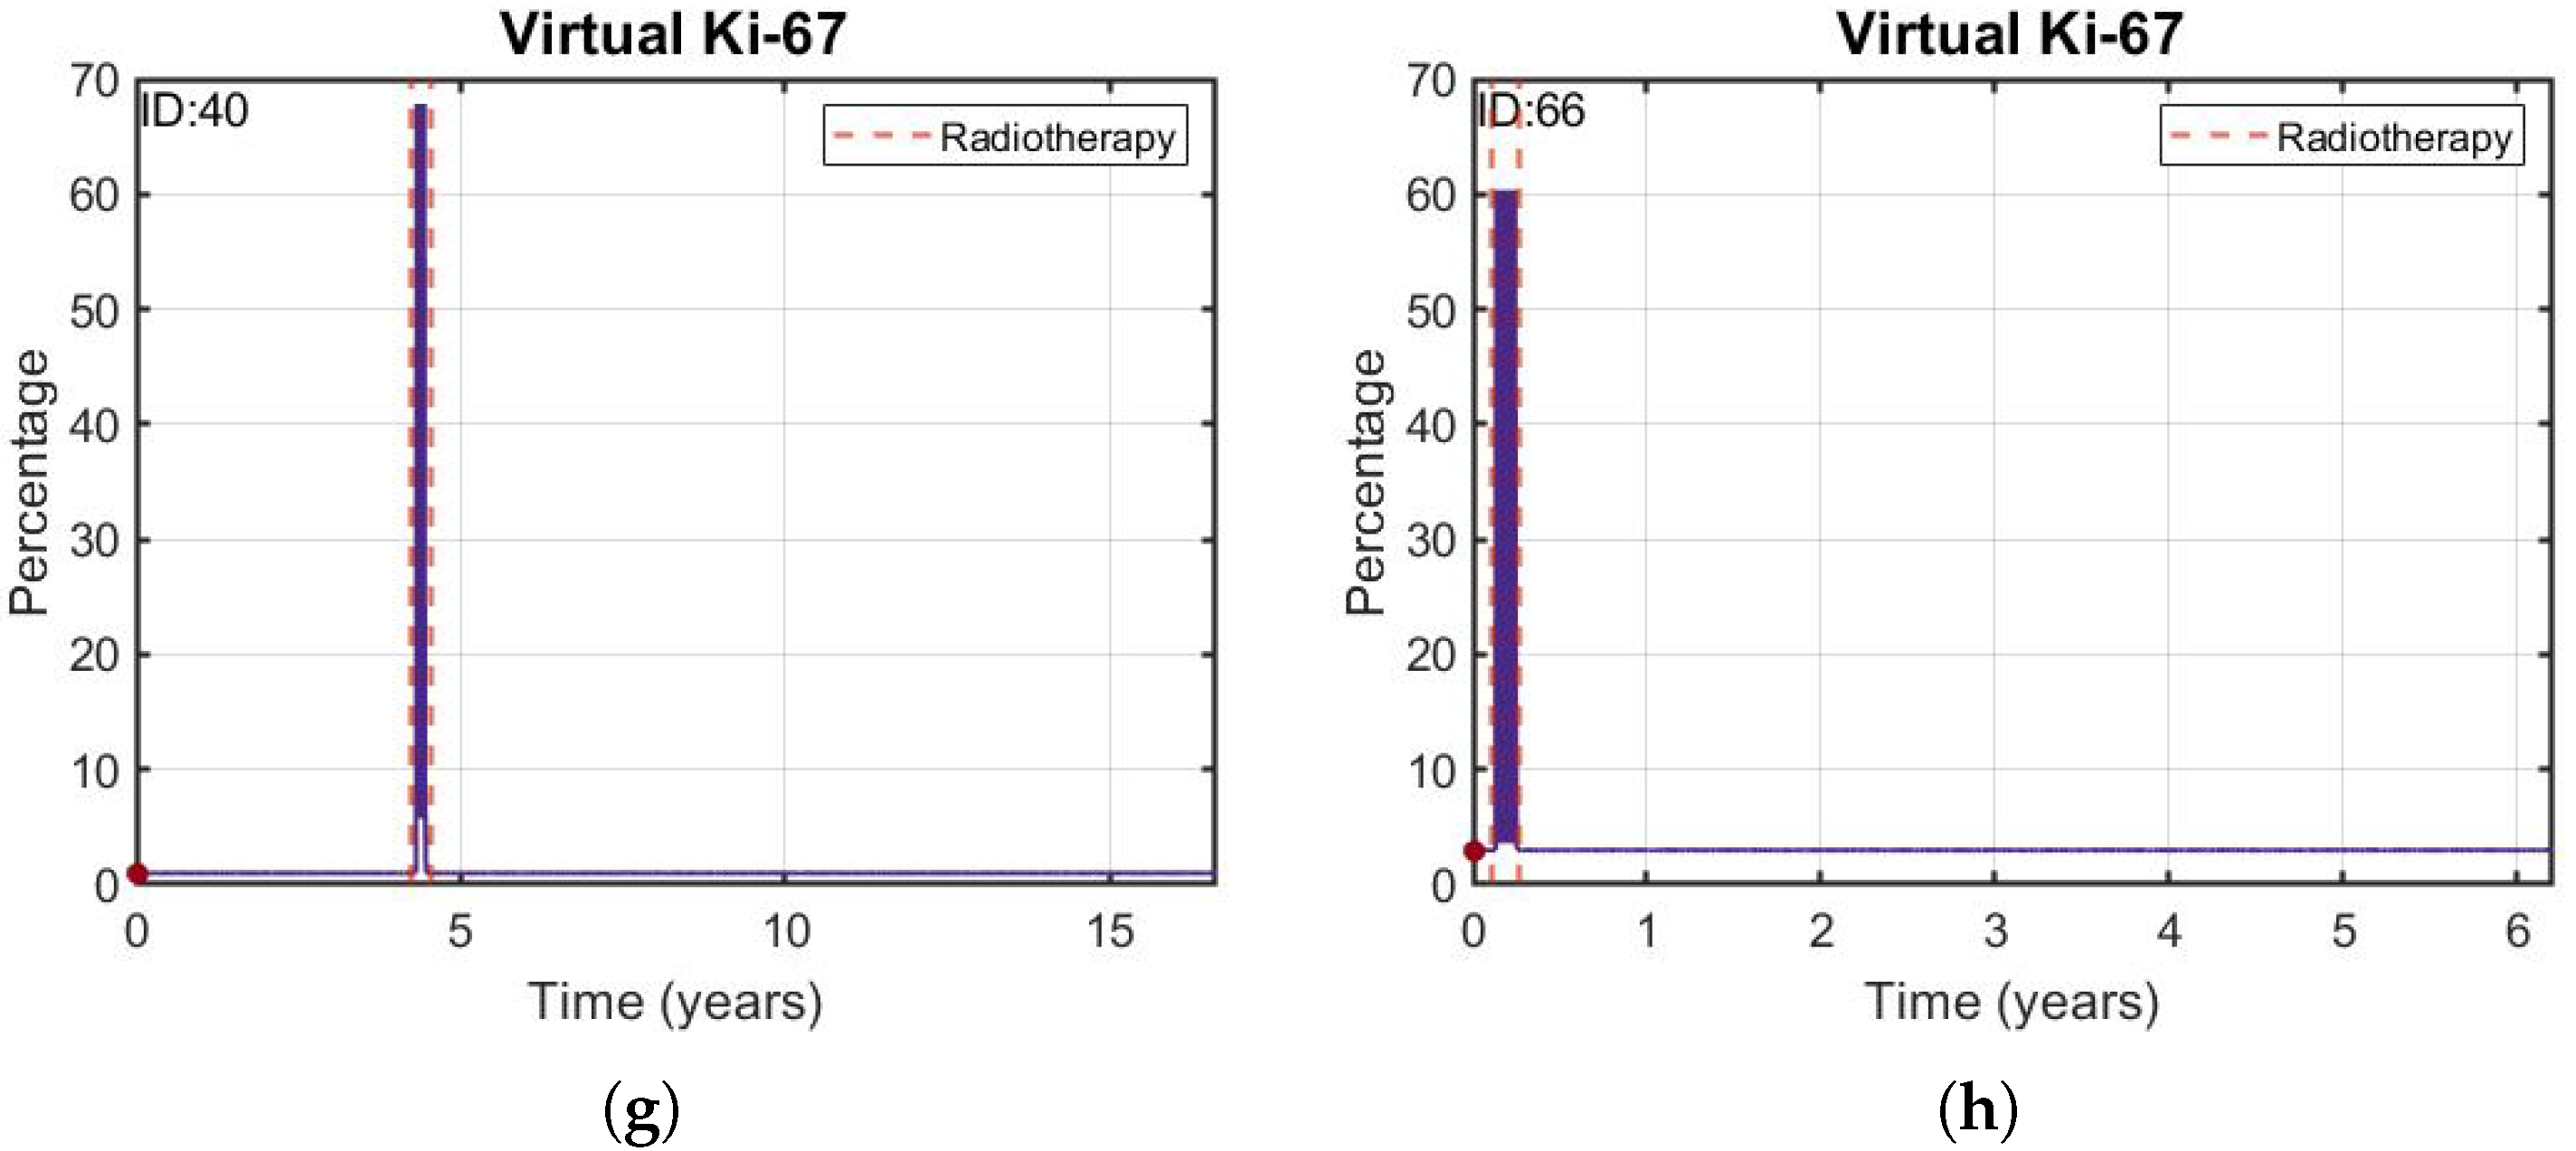
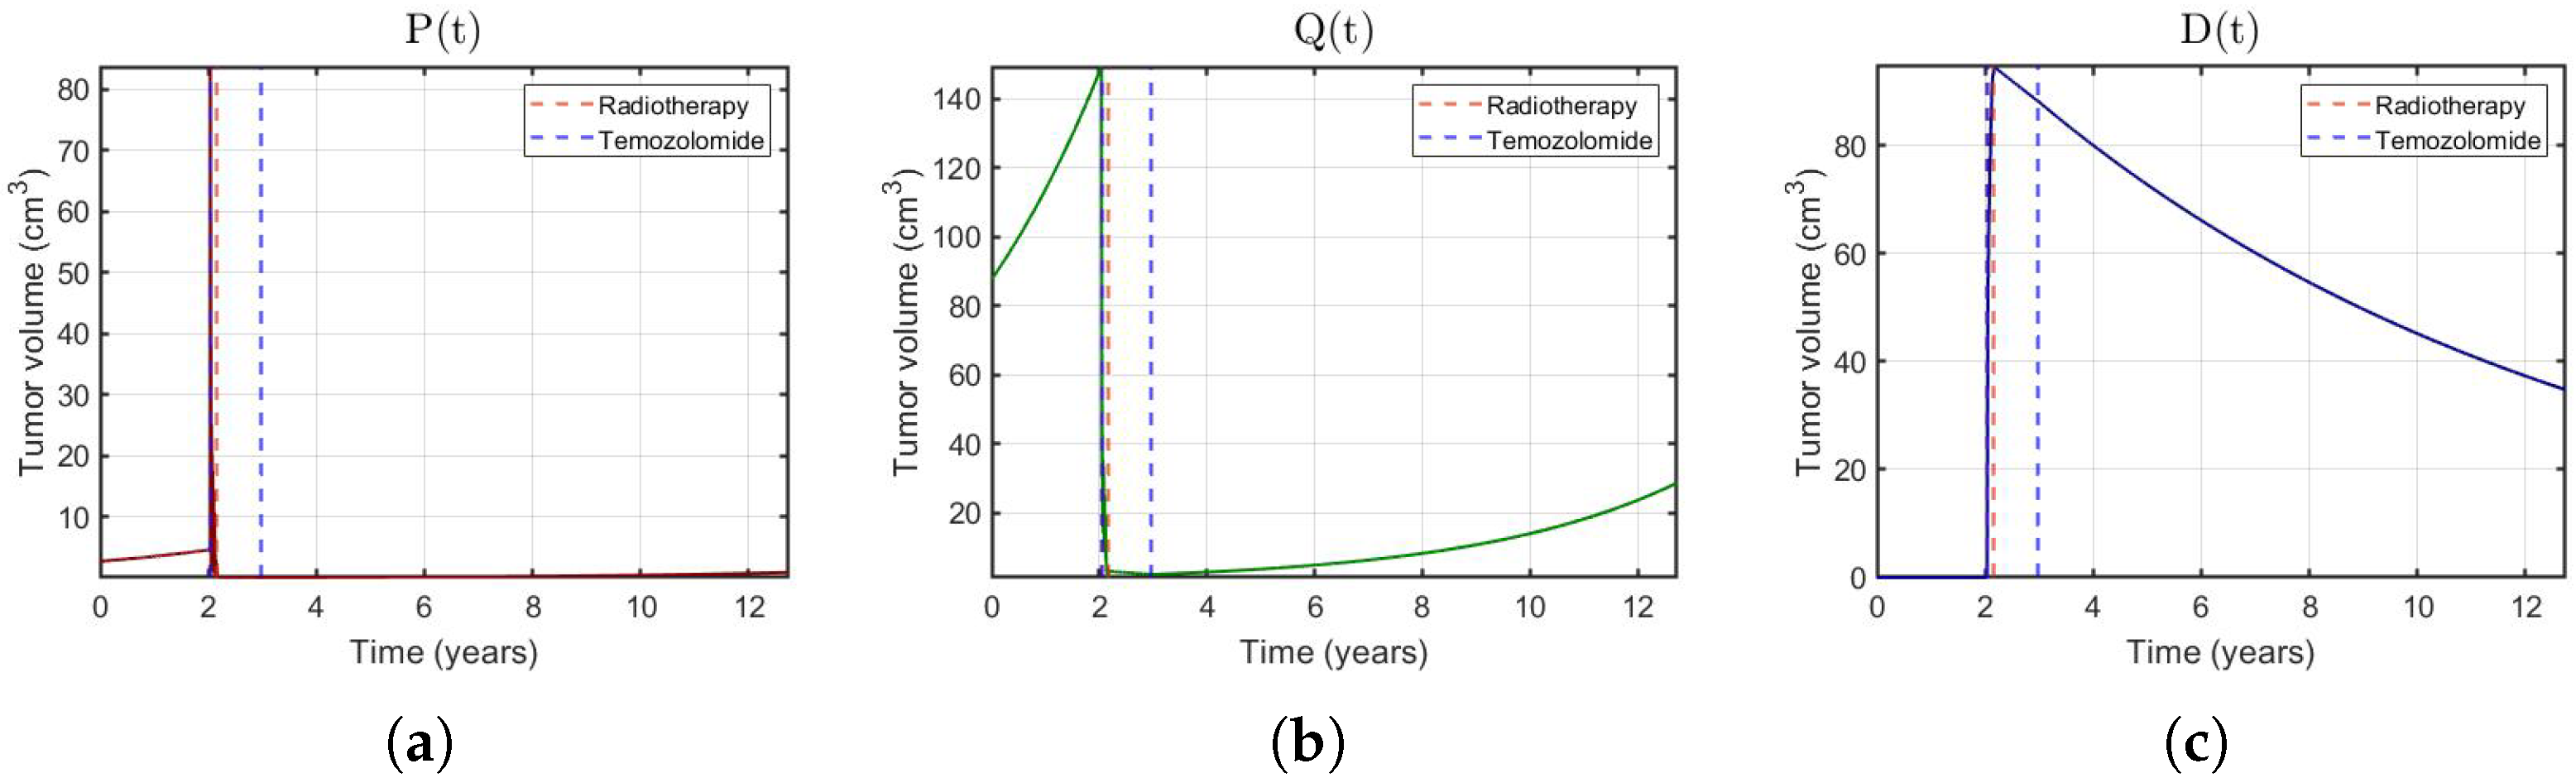
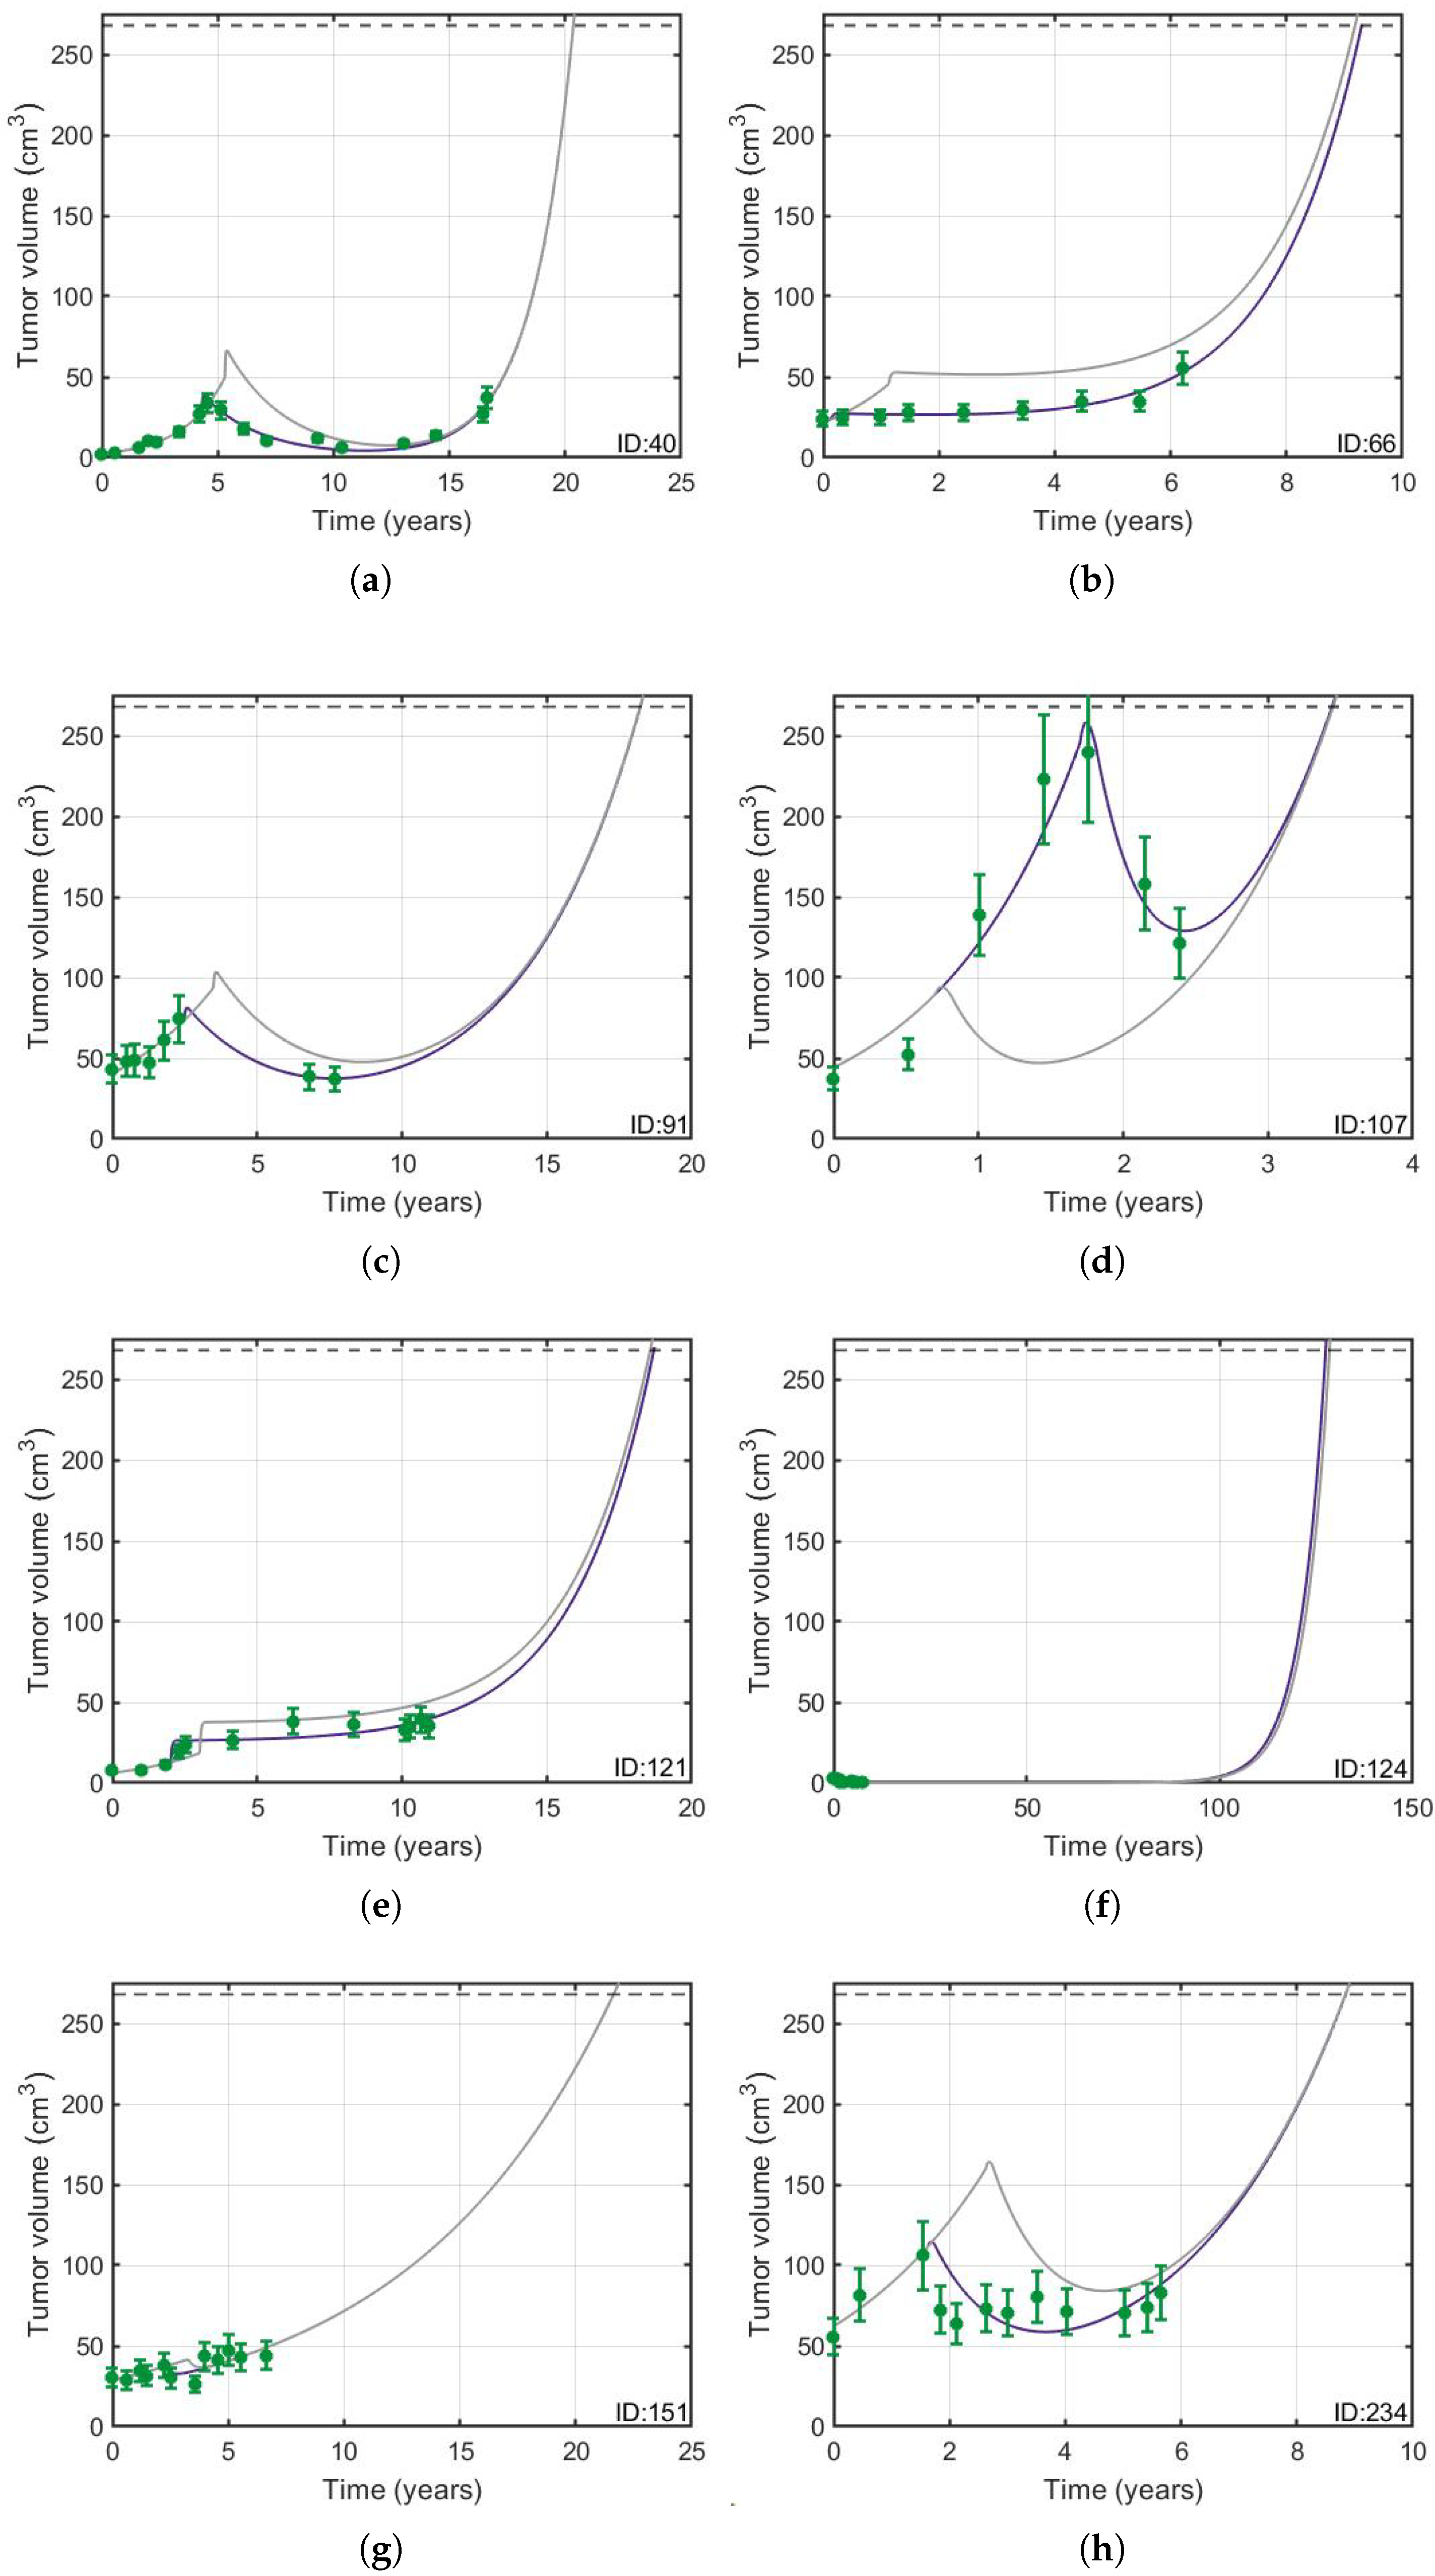
3.1. Validation of the Mathematical Model
3.1.1. The Mathematical Model Given by Equation (1) Described the Tumor Longitudinal Dynamics in Patients
3.1.2. Delaying Radiation Therapy Did Not Have an Effect on Overall Survival
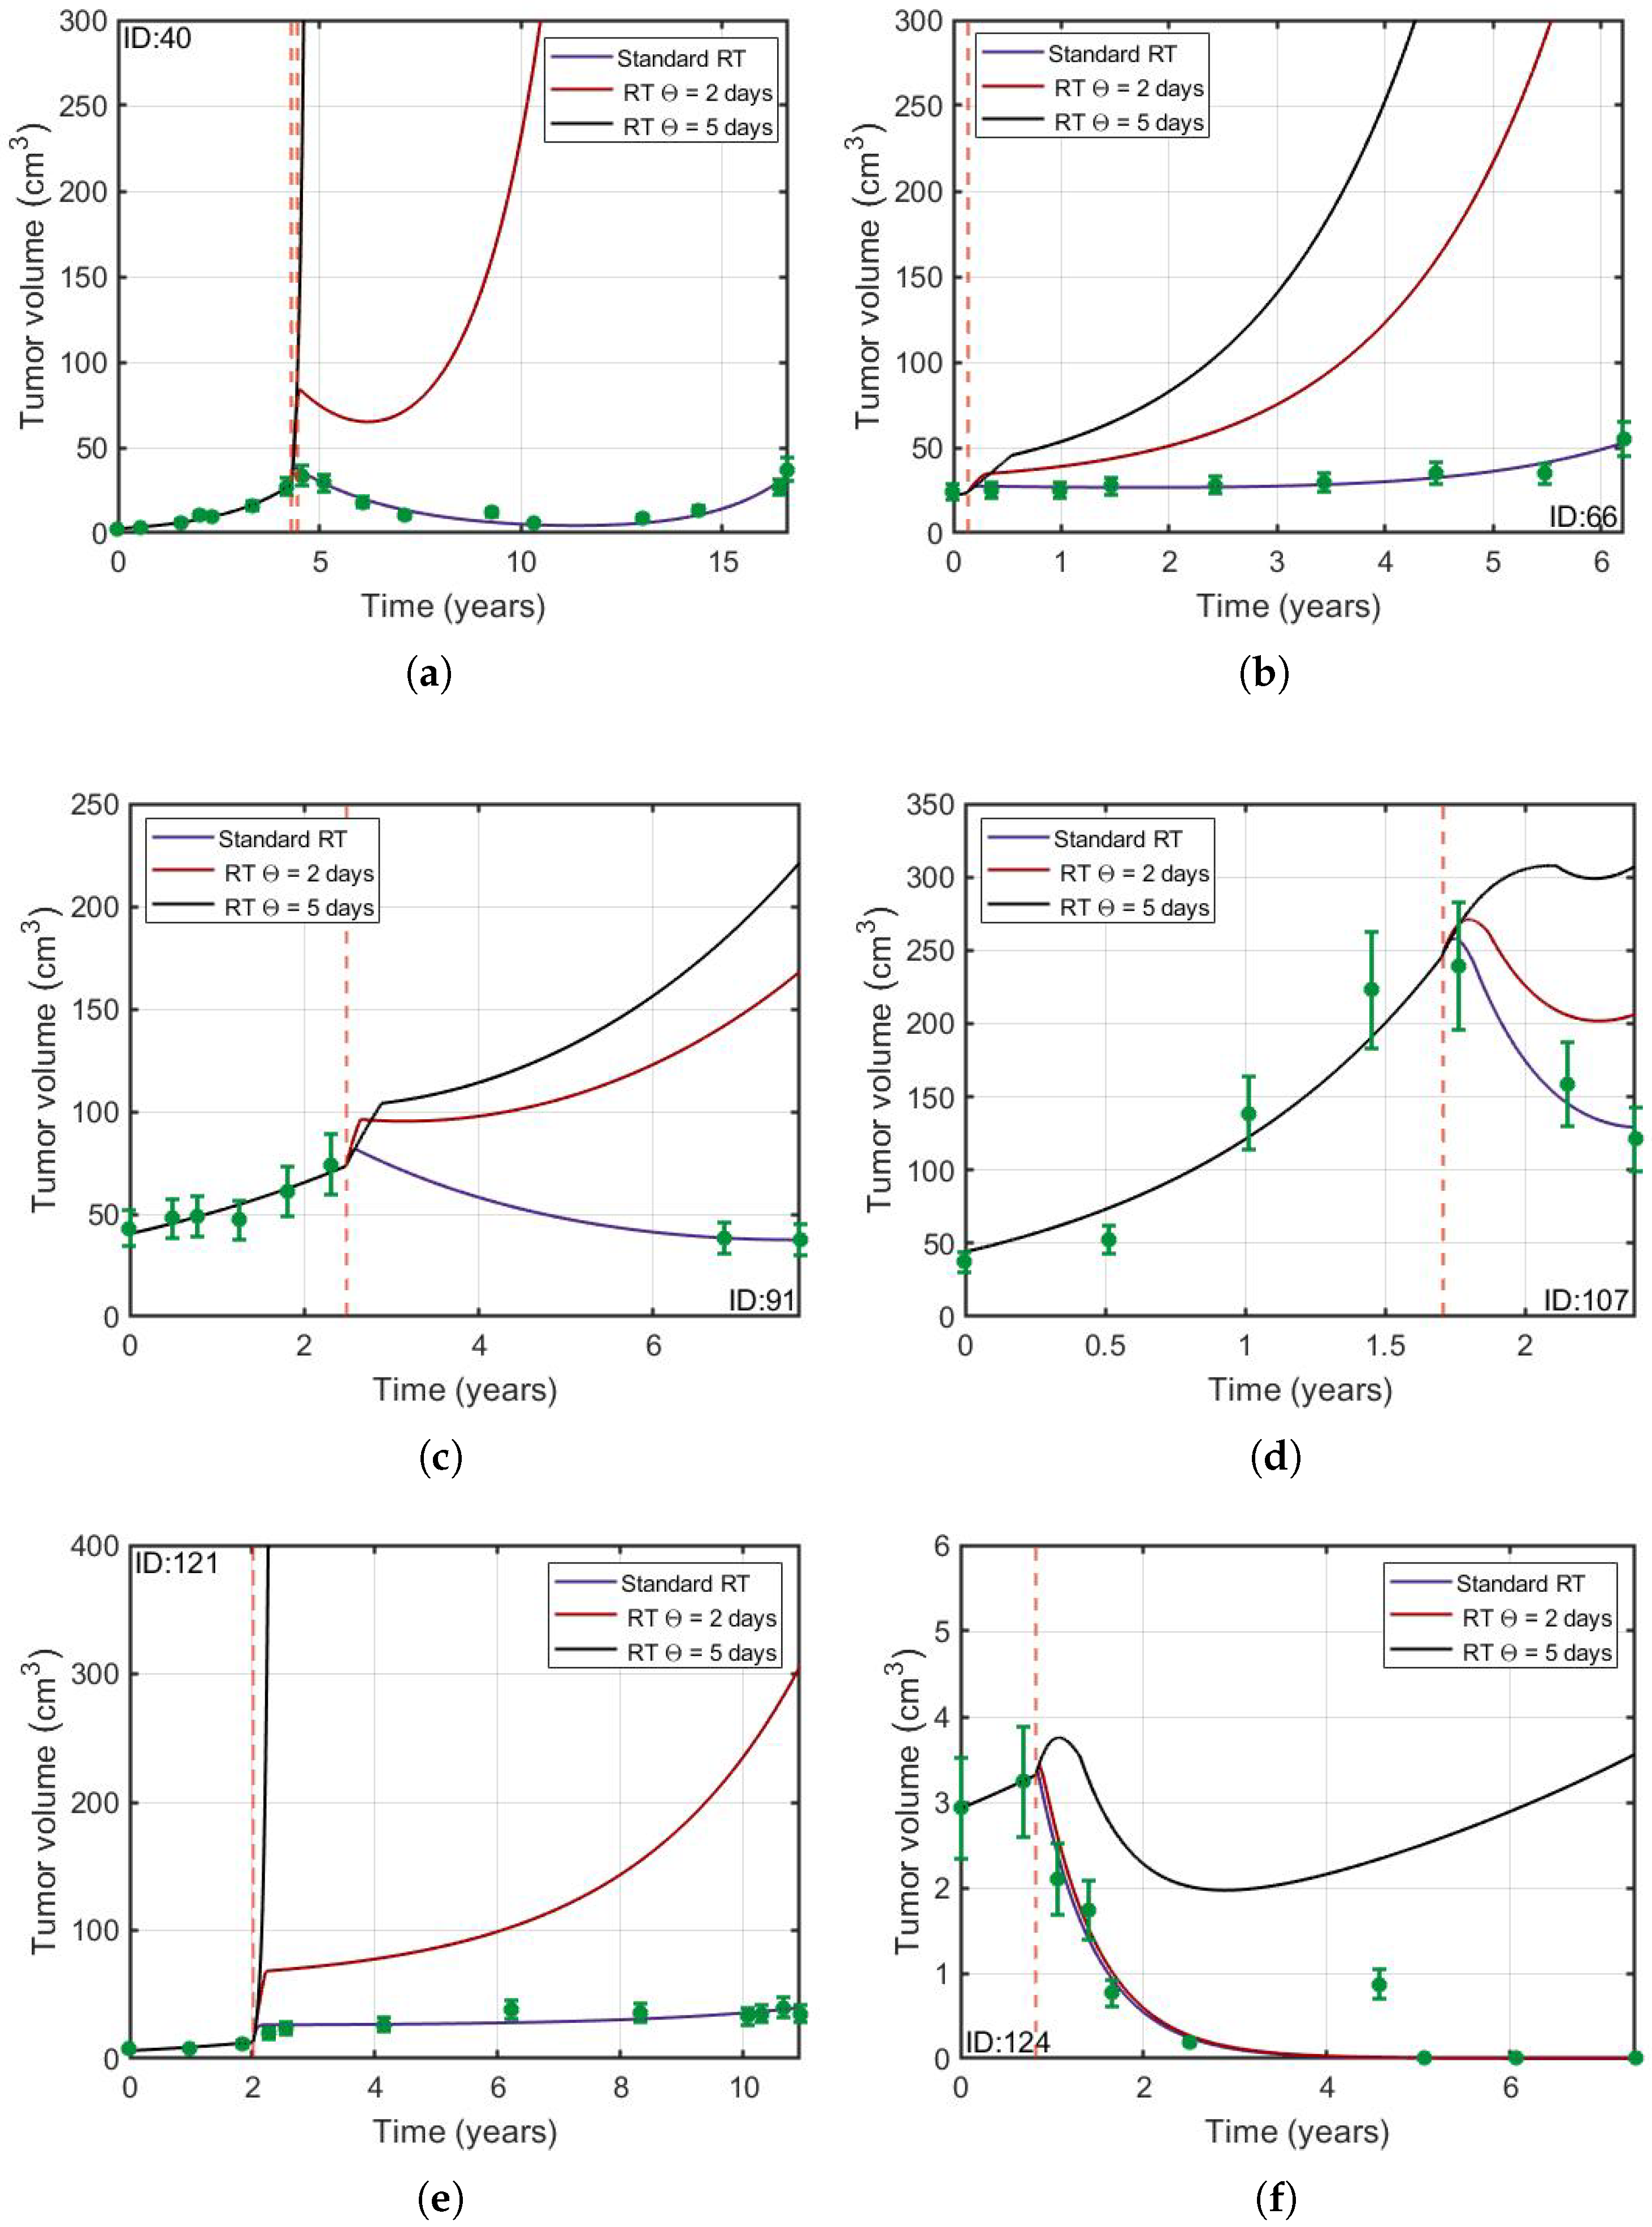
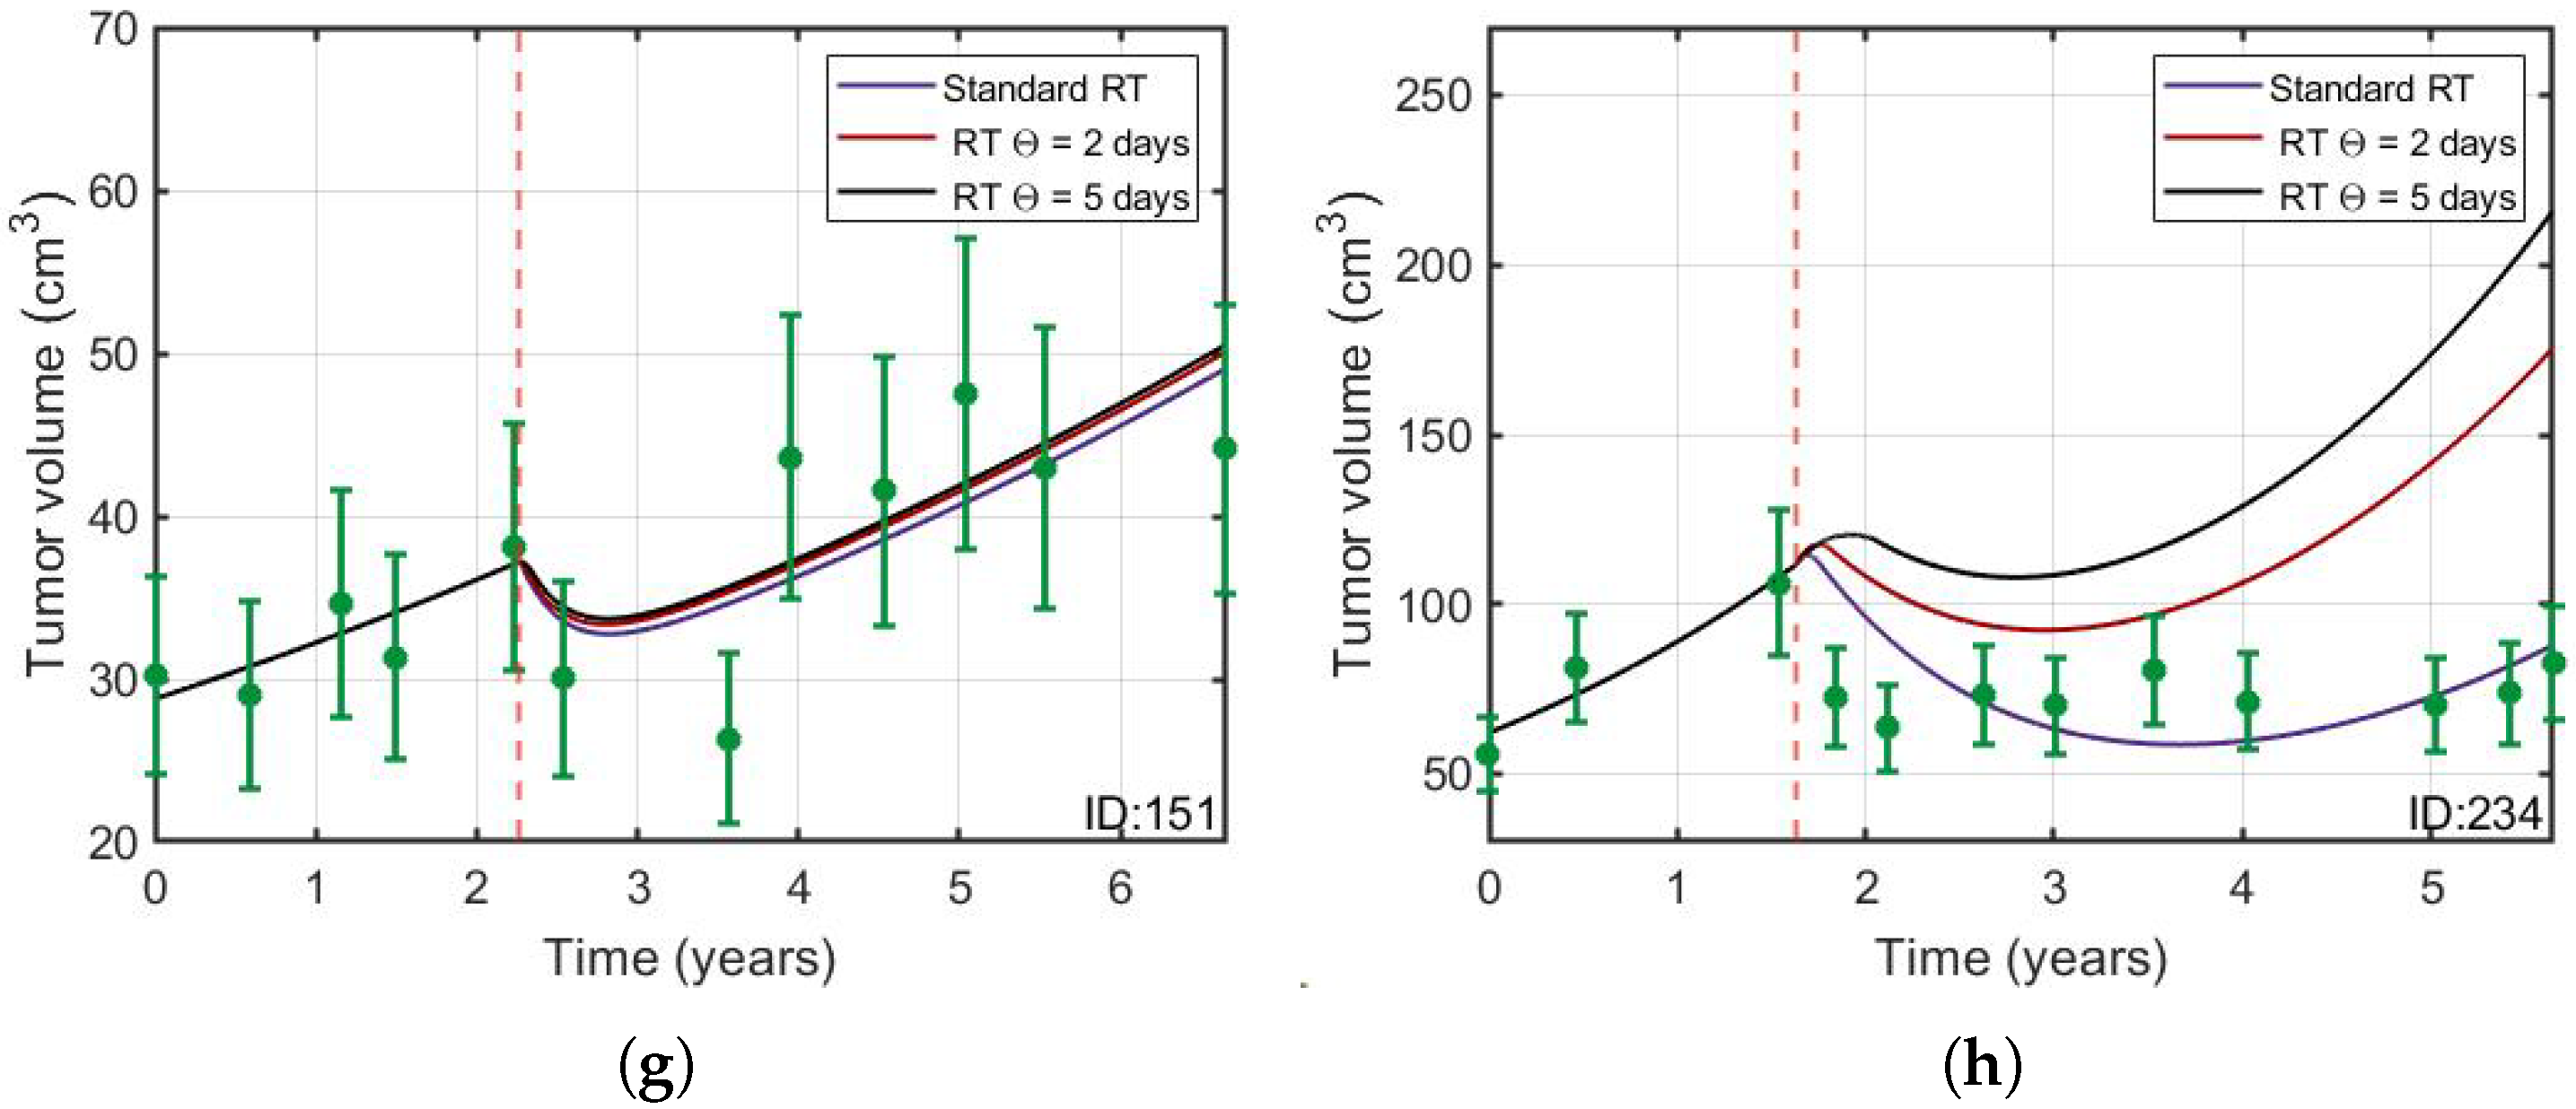
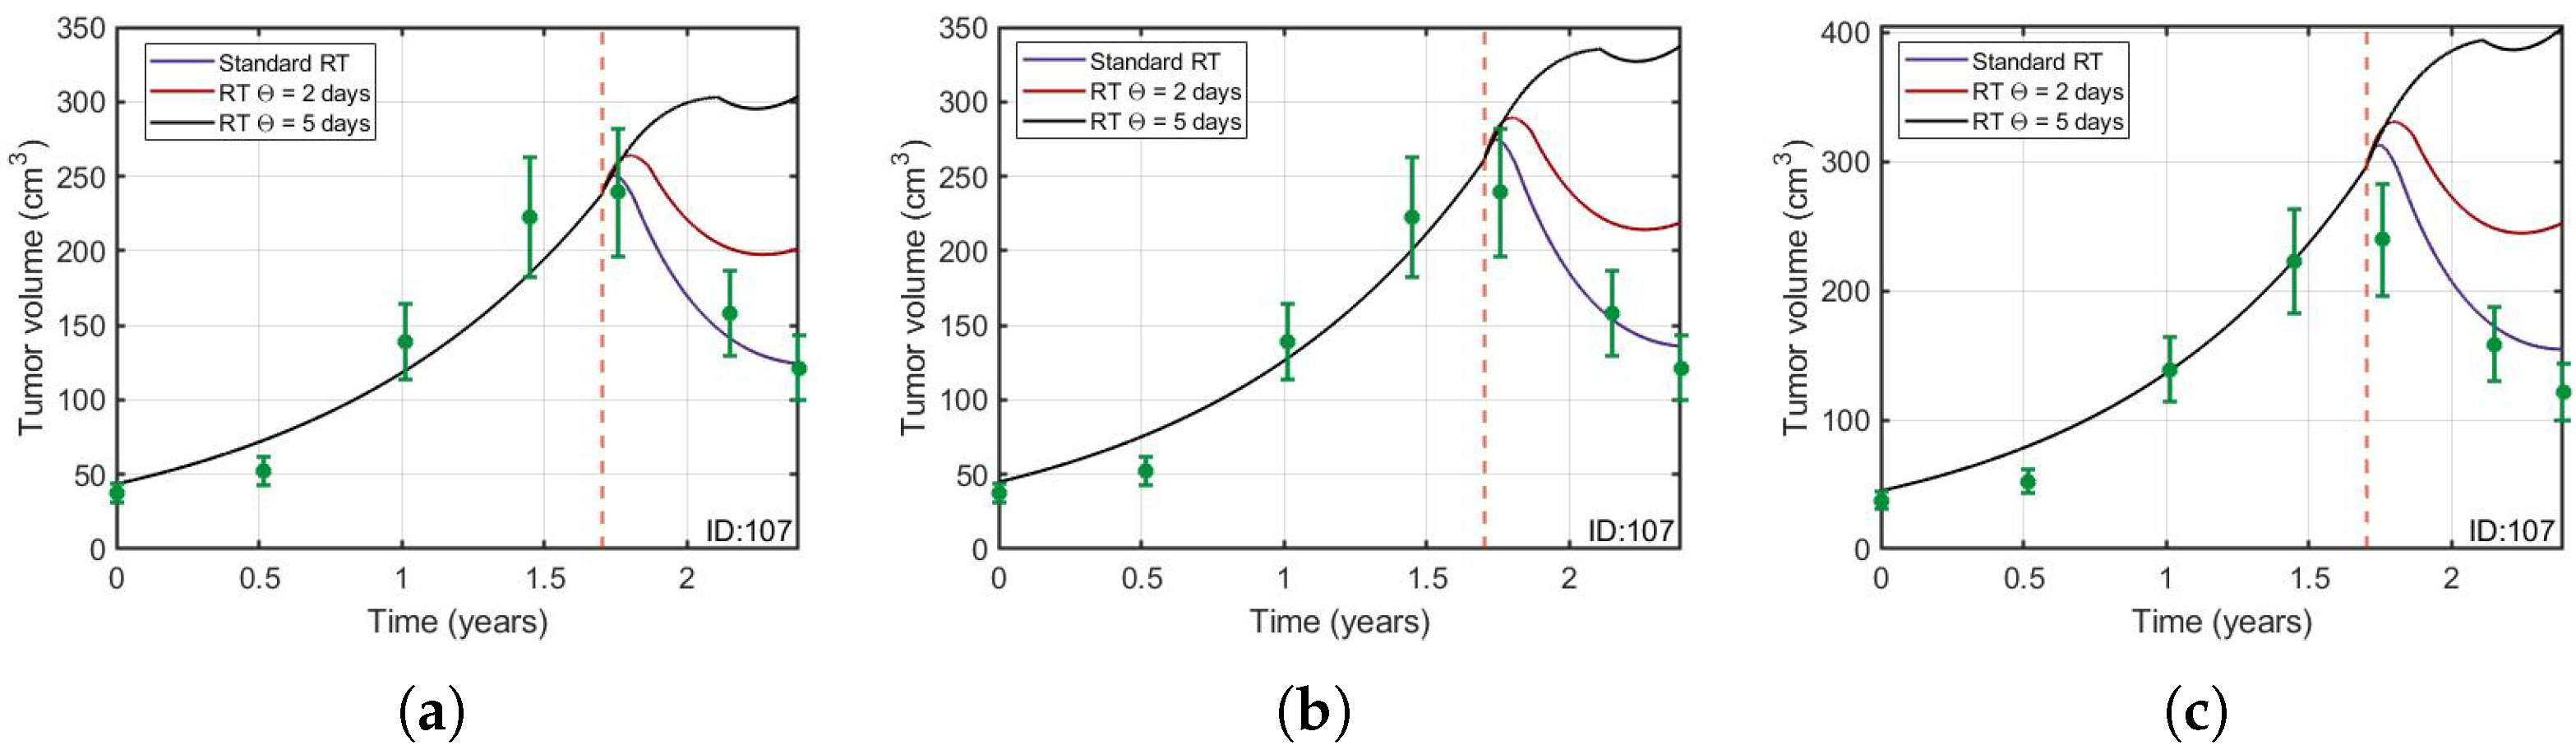
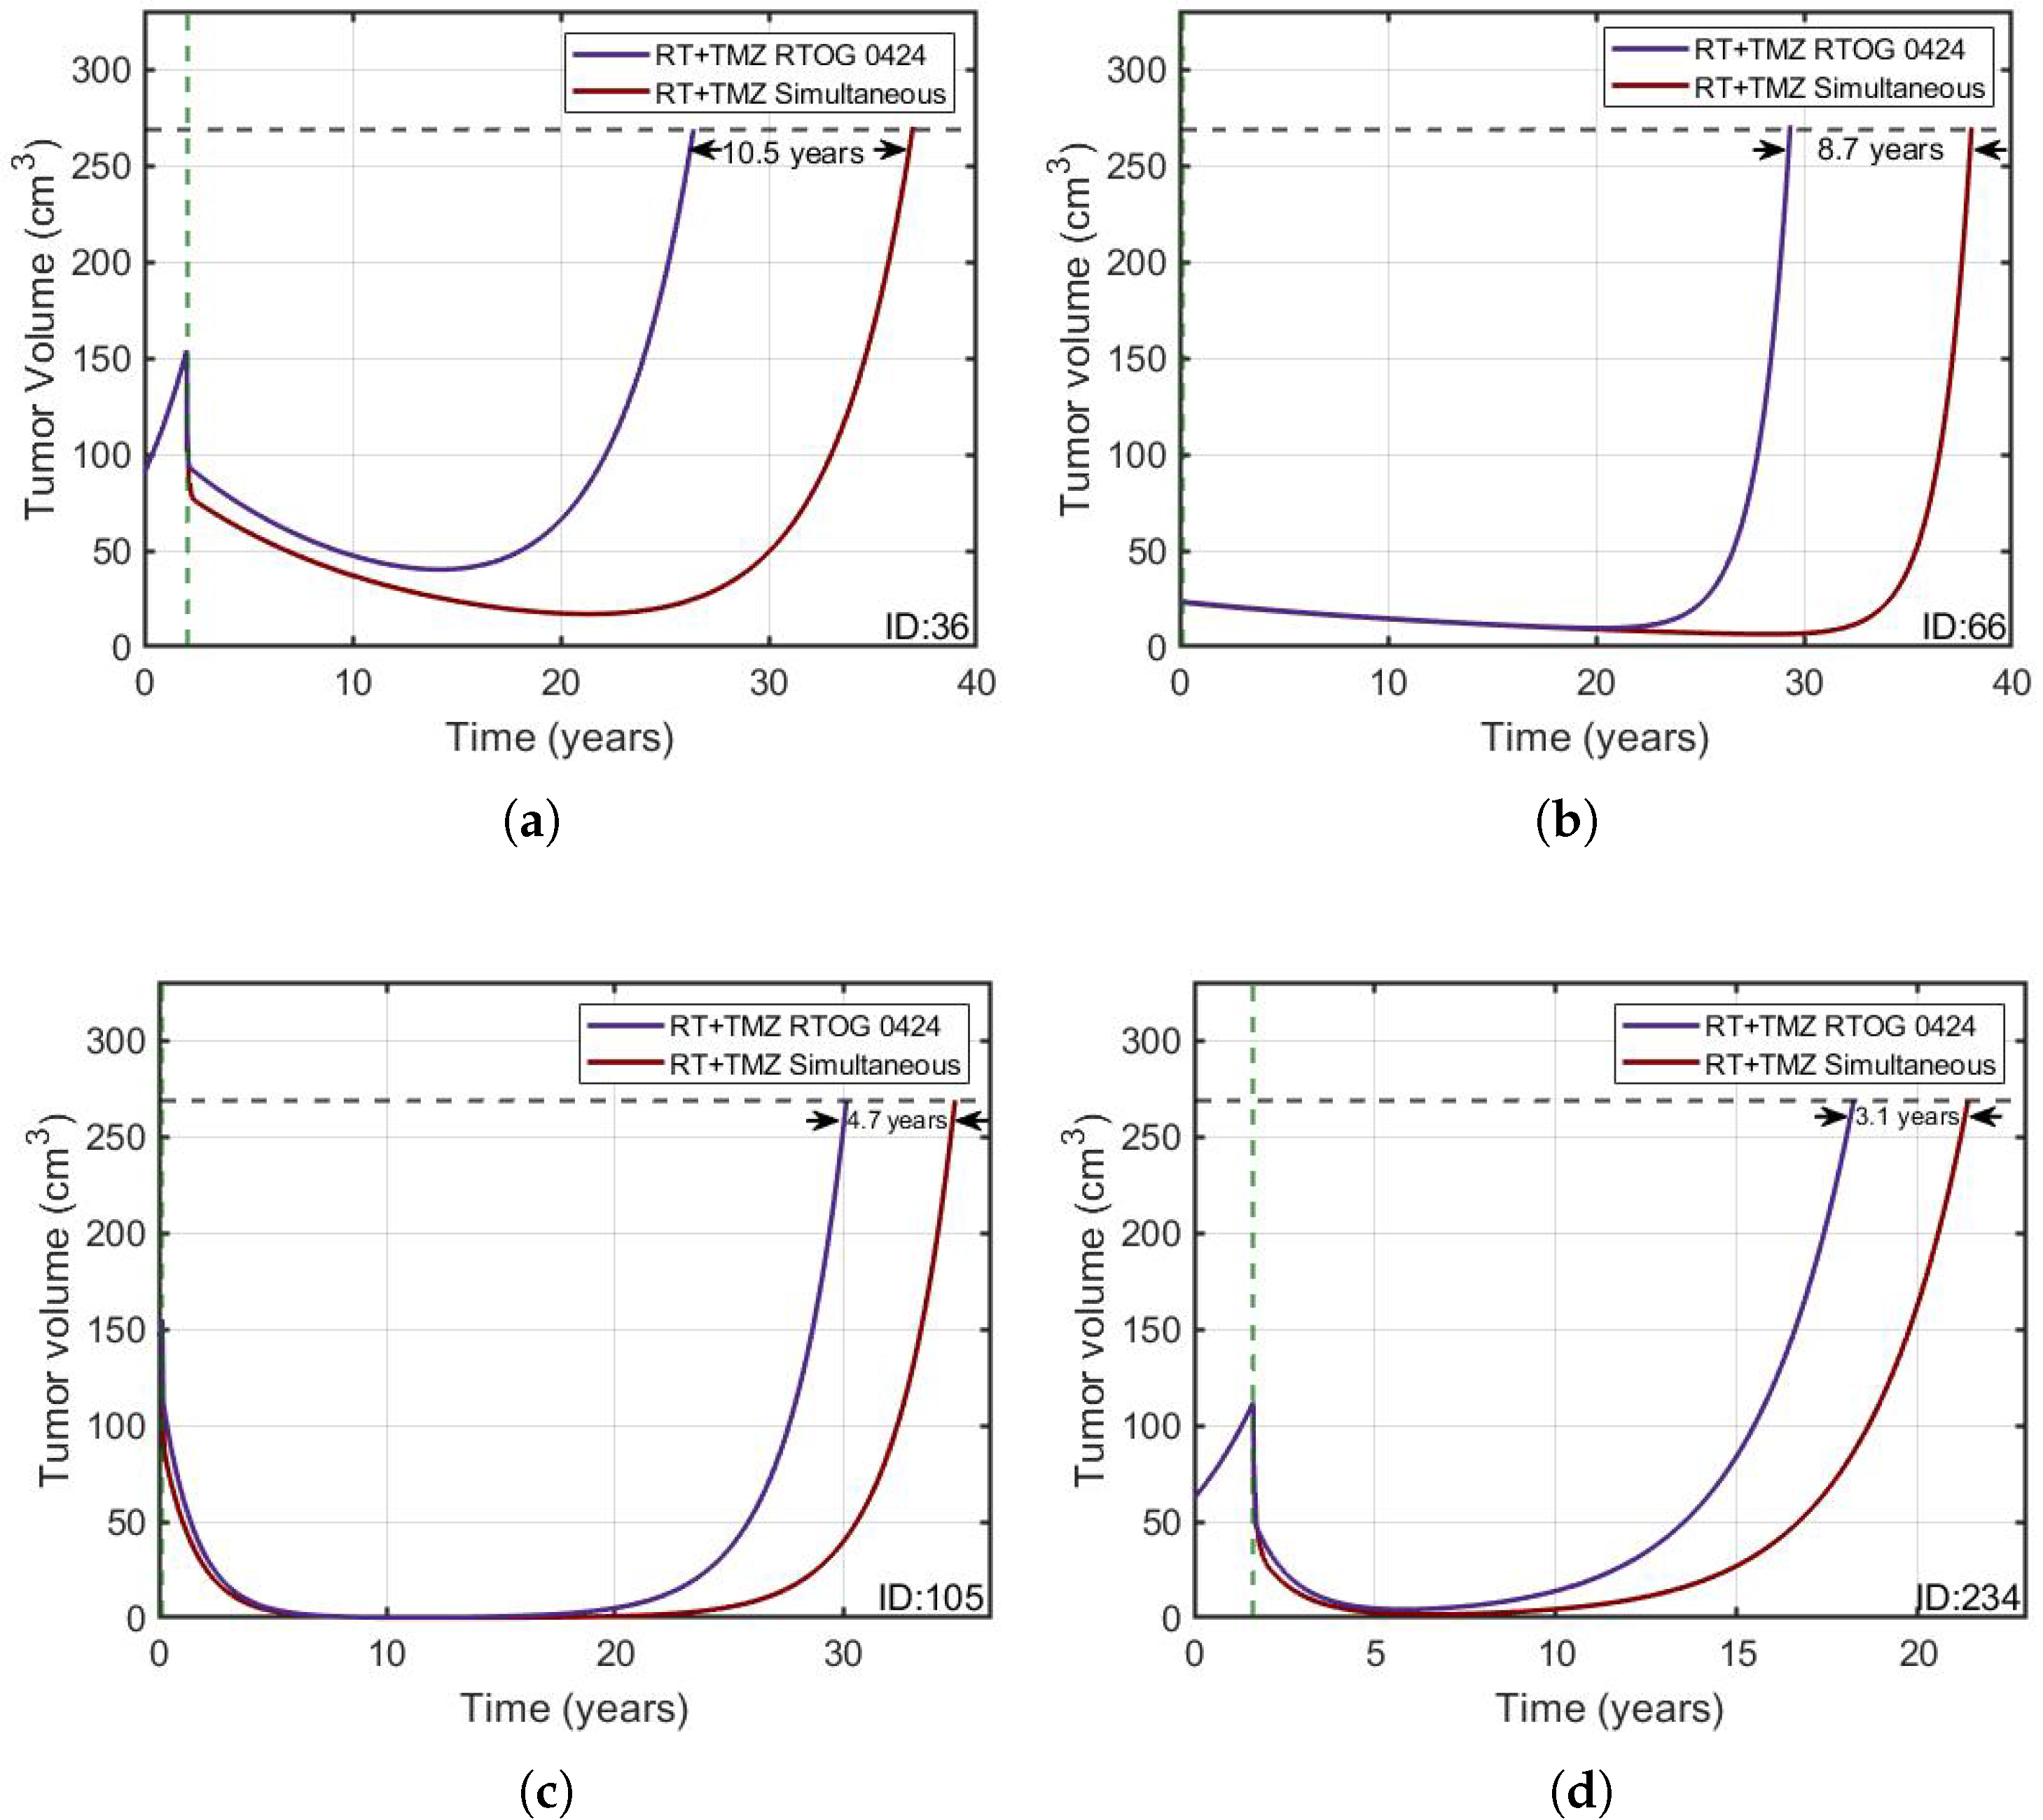
3.2. Protracted Radiotherapy Schemes Lead to Increased Tumor Growth
3.3. Concurrent Cycles of RT and TMZ Produce the Longest-Lasting Therapeutic Effect
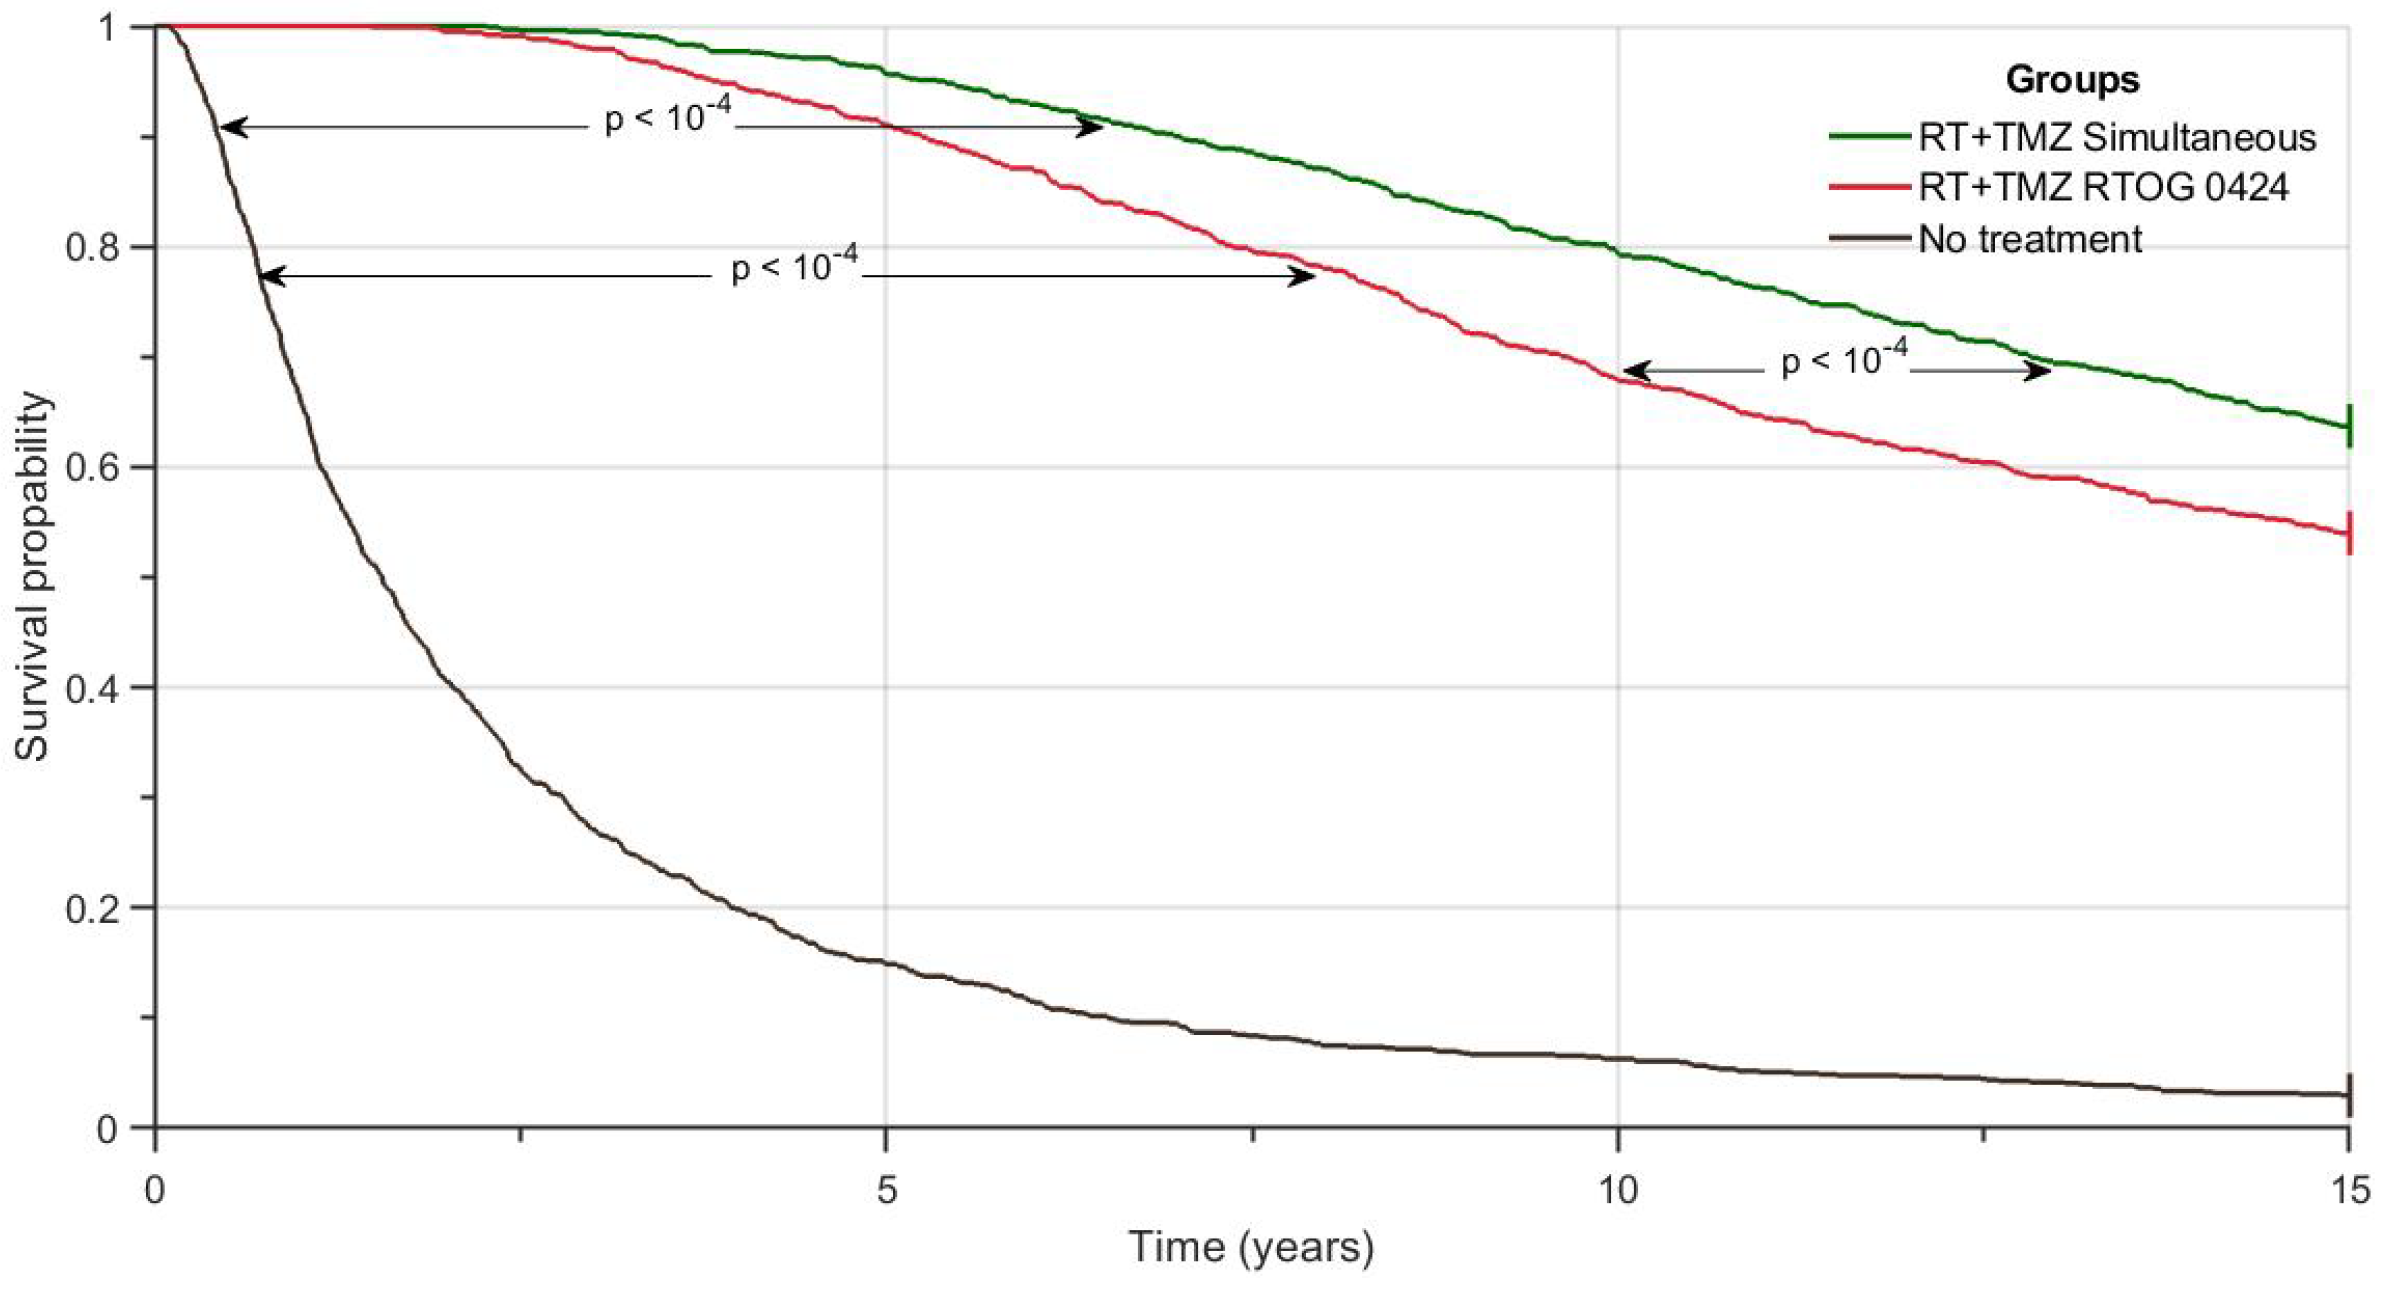
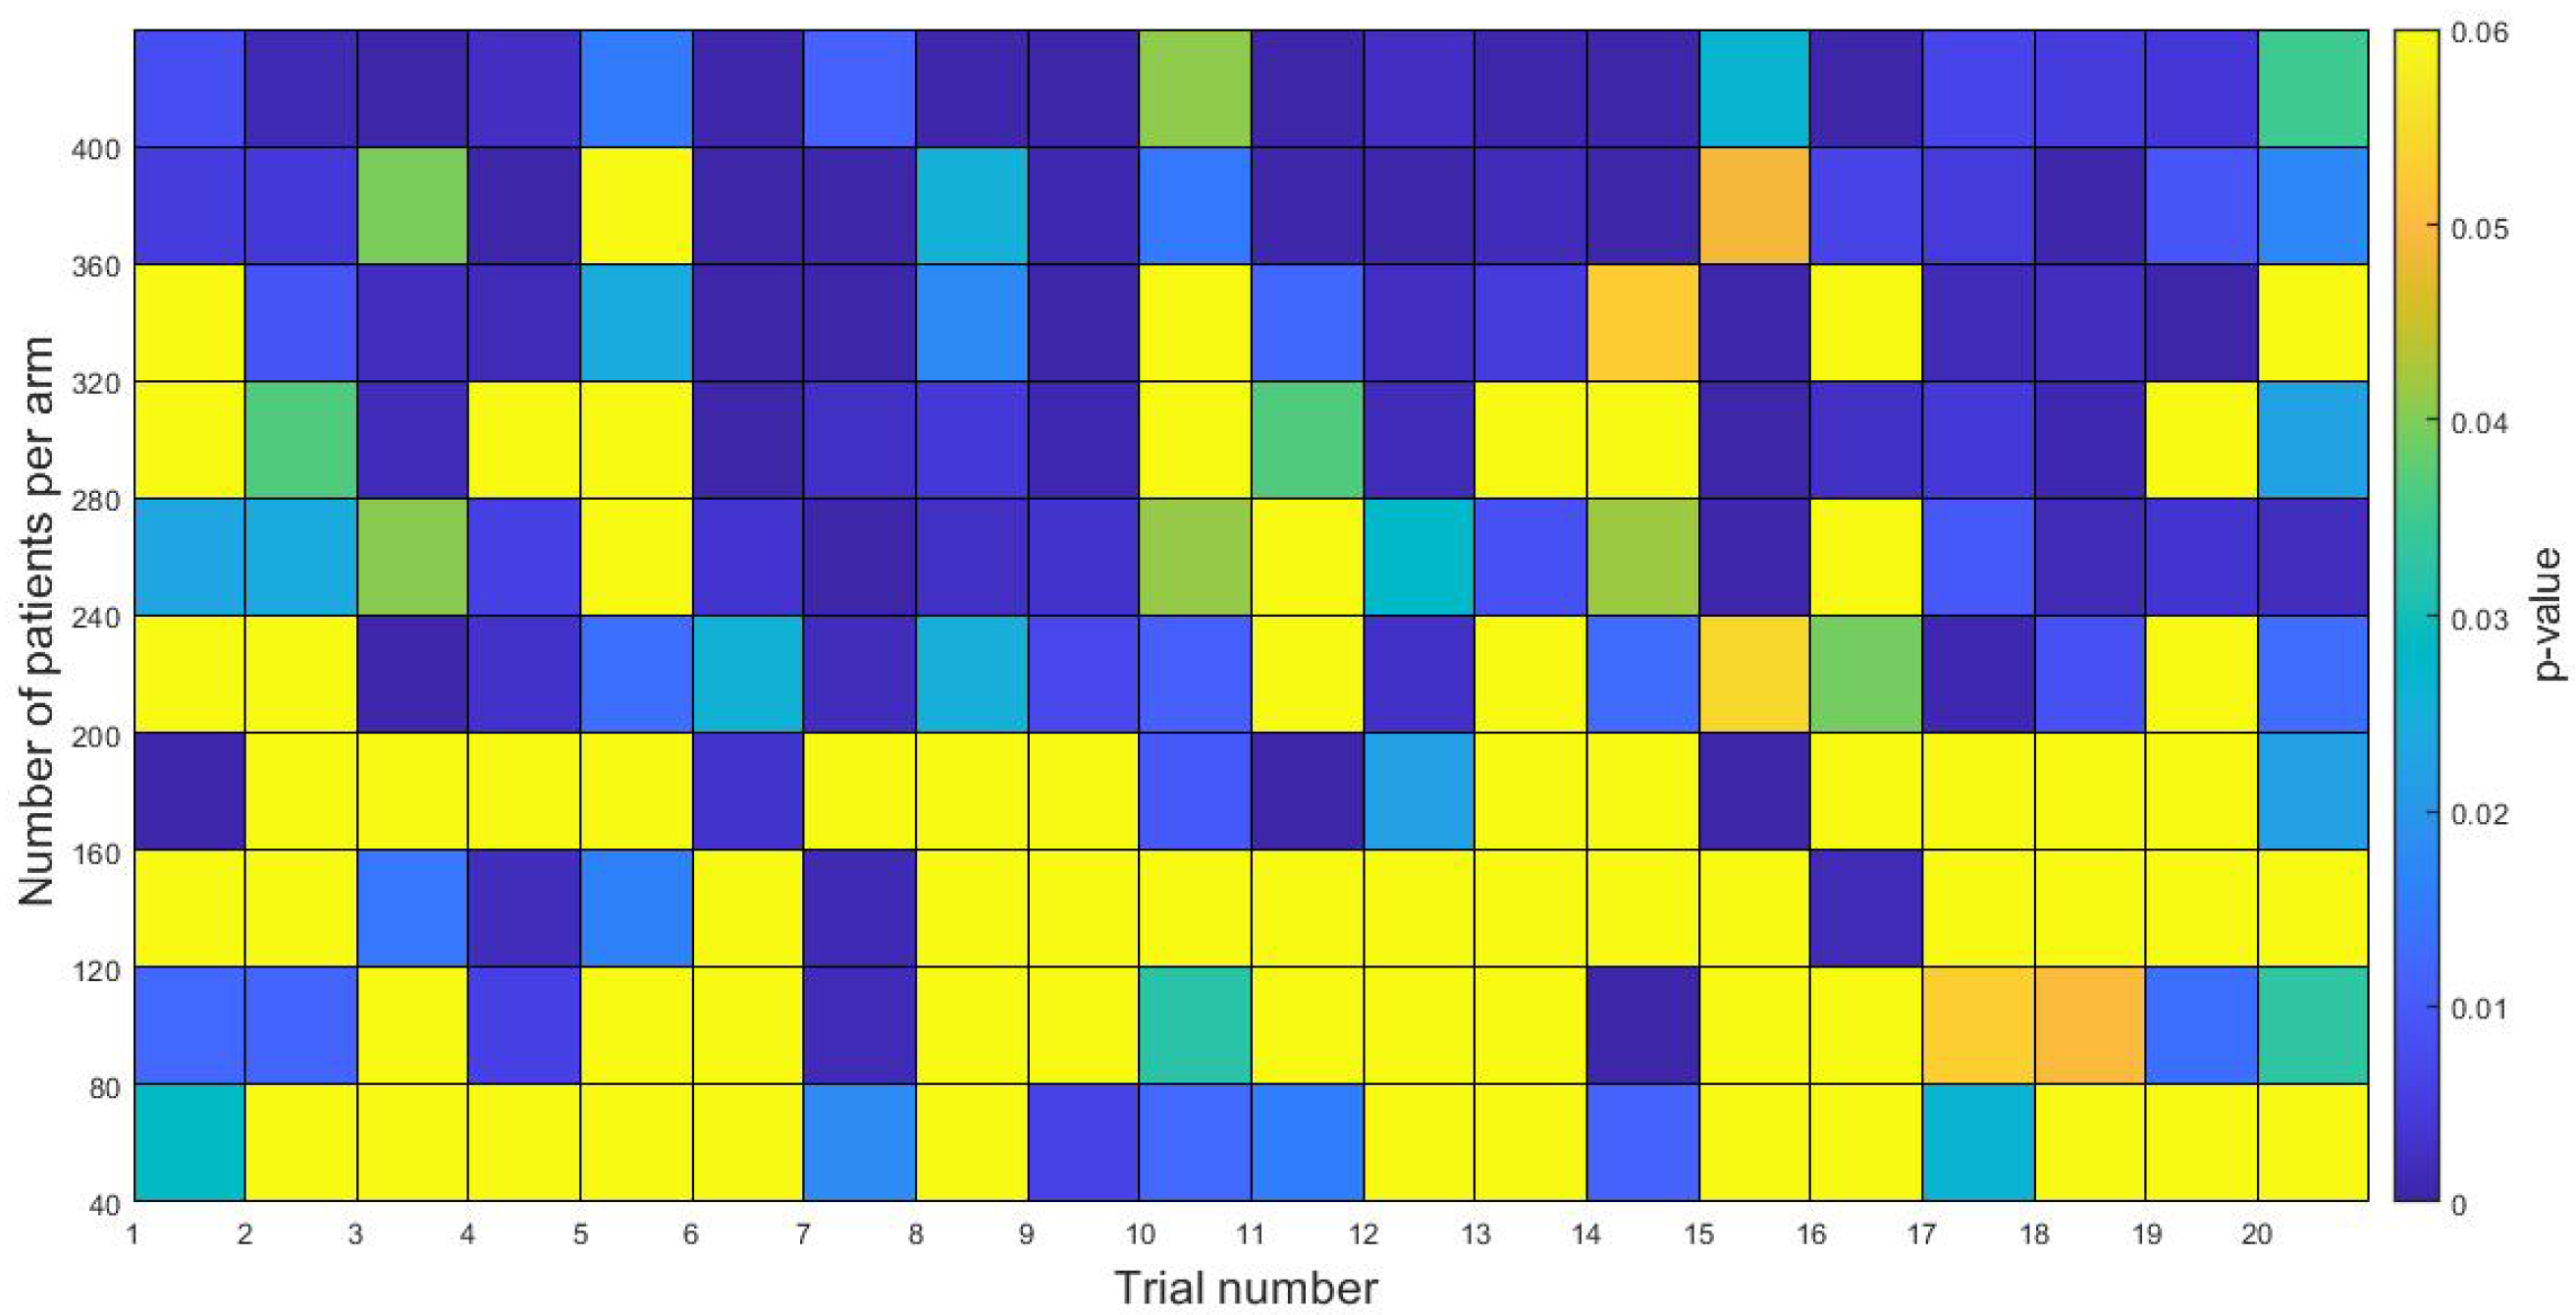
3.4. In-Silico Simulation of Clinical Trials
4. Discussion and Conclusions
Supplementary Materials
Author Contributions
Funding
Institutional Review Board Statement
Informed Consent Statement
Data Availability Statement
Acknowledgments
Conflicts of Interest
Abbreviations
| LGG | Low-Grade Glioma |
| O | Oligodendroglioma |
| A | Astrocytoma |
| OA | Oligoastrocytoma |
| RT | Radiation Therapy |
| TMZ | Temozolomide |
| CS | Cycle Size |
| PCV | Procarbazine, Lomustine and Vincristine |
| MRI | Magnetic Resonance Imaging |
| OSG | Overall Survival Gain |
| NA | Not Available |
References
- Lombardi, G.; Barresi, V.; Castellano, A.; Tabouret, E.; Pasqualetti, F.; Salvalaggio, A.; Cerretti, G.; Caccese, M.; Padovan, M.; Zagonel, V.; et al. Clinical management of diffuse low-grade gliomas. Cancers 2020, 12, 3008. [Google Scholar] [CrossRef]
- Soffietti, R.; Baumert, B.; Bello, L.; Von Deimling, A.; Duffau, H.; Frénay, M.; Grisold, W.; Grant, R.; Graus, F.; Hoang-Xuan, K.; et al. Guidelines on management of low-grade gliomas: Report of an EFNS–EANO* Task Force. Eur. J. Neurol. 2010, 17, 1124–1133. [Google Scholar] [CrossRef]
- Smits, A.; Jakola, A.S. Clinical presentation, natural history, and prognosis of diffuse low-grade gliomas. Neurosurg. Clin. 2019, 30, 35–42. [Google Scholar] [CrossRef]
- Buckner, J.C.; Gesme, D., Jr.; O’Fallon, J.R.; Hammack, J.E.; Stafford, S.; Brown, P.D.; Hawkins, R.; Scheithauer, B.W.; Erickson, B.J.; Levitt, R.; et al. Phase II trial of procarbazine, lomustine, and vincristine as initial therapy for patients with low-grade oligodendroglioma or oligoastrocytoma: Efficacy and associations with chromosomal abnormalities. J. Clin. Oncol. 2003, 21, 251–255. [Google Scholar] [CrossRef] [PubMed]
- Fisher, B.J.; Pugh, S.L.; Macdonald, D.R.; Chakravatri, A.; Lesser, G.J.; Fox, S.; Rogers, C.L.; Werner-Wasik, M.; Doyle, T.; Bahary, J.P.; et al. Phase 2 Study of a Temozolomide-Based Chemoradiation Therapy Regimen for High-Risk, Low-Grade Gliomas: Long-Term Results of Radiation Therapy Oncology Group 0424. Int. J. Radiat. Oncol. Biol. Phys. 2020, 107, 720–725. [Google Scholar] [CrossRef] [PubMed]
- Baumert, B.G.; Hegi, M.E.; van den Bent, M.J.; von Deimling, A.; Gorlia, T.; Hoang-Xuan, K.; Brandes, A.A.; Kantor, G.; Taphoorn, M.J.; Hassel, M.B.; et al. Temozolomide chemotherapy versus radiotherapy in high-risk low-grade glioma (EORTC 22033-26033): A randomised, open-label, phase 3 intergroup study. Lancet Oncol. 2016, 17, 1521–1532. [Google Scholar] [CrossRef]
- Weller, M.; van den Bent, M.; Preusser, M.; Le Rhun, E.; Tonn, J.C.; Minniti, G.; Bendszus, M.; Balana, C.; Chinot, O.; Dirven, L.; et al. EANO guidelines on the diagnosis and treatment of diffuse gliomas of adulthood. Nat. Rev. Clin. Oncol. 2021, 18, 170–186. [Google Scholar] [CrossRef] [PubMed]
- Jiang, T.; Nam, D.H.; Ram, Z.; Poon, W.S.; Wang, J.; Boldbaatar, D.; Mao, Y.; Ma, W.; Mao, Q.; You, Y.; et al. Clinical practice guidelines for the management of adult diffuse gliomas. Cancer Lett. 2021, 499, 60–72. [Google Scholar] [CrossRef] [PubMed]
- Liu, R.; Solheim, K.; Polley, M.Y.; Lamborn, K.R.; Page, M.; Fedoroff, A.; Rabbitt, J.; Butowski, N.; Prados, M.; Chang, S.M. Quality of life in low-grade glioma patients receiving temozolomide. Neuro-Oncol. 2009, 11, 59–68. [Google Scholar] [CrossRef]
- Buckner, J.C.; Shaw, E.G.; Pugh, S.L.; Chakravarti, A.; Gilbert, M.R.; Barger, G.R.; Coons, S.; Ricci, P.; Bullard, D.; Brown, P.D.; et al. Radiation plus procarbazine, CCNU, and vincristine in low-grade glioma. N. Engl. J. Med. 2016, 374, 1344–1355. [Google Scholar] [CrossRef]
- Stupp, R.; Mason, W.P.; Van Den Bent, M.J.; Weller, M.; Fisher, B.; Taphoorn, M.J.; Belanger, K.; Brandes, A.A.; Marosi, C.; Bogdahn, U.; et al. Radiotherapy plus concomitant and adjuvant temozolomide for glioblastoma. N. Engl. J. Med. 2005, 352, 987–996. [Google Scholar] [CrossRef] [PubMed]
- Fisher, B.J.; Hu, C.; Macdonald, D.R.; Lesser, G.J.; Coons, S.W.; Brachman, D.G.; Ryu, S.; Werner-Wasik, M.; Bahary, J.P.; Liu, J.; et al. Phase 2 study of temozolomide-based chemoradiation therapy for high-risk low-grade gliomas: Preliminary results of Radiation Therapy Oncology Group 0424. Int. J. Radiat. Oncol. Biol. Phys. 2015, 91, 497–504. [Google Scholar] [CrossRef]
- Wang, J.; Wang, Y.; He, Y.; Guan, H.; He, L.; Mu, X.; Peng, X. Radiotherapy versus radiotherapy combined with temozolomide in high-risk low-grade gliomas after surgery: Study protocol for a randomized controlled clinical trial. Trials 2019, 20, 1–7. [Google Scholar] [CrossRef]
- Barbolosi, D.; Ciccolini, J.; Lacarelle, B.; Barlési, F.; André, N. Computational oncology—Mathematical modelling of drug regimens for precision medicine. Nat. Rev. Clin. Oncol. 2016, 13, 242–254. [Google Scholar] [CrossRef]
- Malinzi, J.; Basita, K.B.; Padidar, S.; Adeola, H.A. Prospect for application of mathematical models in combination cancer treatments. Inform. Med. Unlocked 2021, 23, 100534. [Google Scholar] [CrossRef]
- Ribba, B.; Kaloshi, G.; Peyre, M.; Ricard, D.; Calvez, V.; Tod, M.; Čajavec-Bernard, B.; Idbaih, A.; Psimaras, D.; Dainese, L.; et al. A tumor growth inhibition model for low-grade glioma treated with chemotherapy or radiotherapy. Clin. Cancer Res. 2012, 18, 5071–5080. [Google Scholar] [CrossRef] [PubMed]
- Pérez-García, V.M.; Bogdanska, M.; Martínez-González, A.; Belmonte-Beitia, J.; Schucht, P.; Pérez-Romasanta, L.A. Delay effects in the response of low-grade gliomas to radiotherapy: A mathematical model and its therapeutical implications. Math. Med. Biol. J. IMA 2015, 32, 307–329. [Google Scholar] [CrossRef] [PubMed]
- Pérez-García, V.M.; Pérez-Romasanta, L.A. Extreme protraction for low-grade gliomas: Theoretical proof of concept of a novel therapeutical strategy. Math. Med. Biol. J. IMA 2016, 33, 253–271. [Google Scholar] [CrossRef]
- Henares-Molina, A.; Benzekry, S.; Lara, P.C.; García-Rojo, M.; Pérez-García, V.M.; Martínez-González, A. Non-standard radiotherapy fractionations delay the time to malignant transformation of low-grade gliomas. PLoS ONE 2017, 12, e0178552. [Google Scholar] [CrossRef] [PubMed]
- Rodríguez, C.R.; Calvo, G.F.; Ramis-Conde, I.; Belmonte-Beitia, J. Stochastic modelling of slow-progressing tumors: Analysis and applications to the cell interplay and control of low grade gliomas. Commun. Nonlinear Sci. Numer. Simul. 2017, 49, 63–80. [Google Scholar] [CrossRef]
- Budia, I.; Alvarez-Arenas, A.; Woolley, T.; Calvo, G.; Belmonte-Beitia, J. Radiation protraction schedules for low-grade gliomas: A comparison between different mathematical models. J. R. Soc. Interface 2019, 16, 20190665. [Google Scholar] [CrossRef] [PubMed]
- Mazzocco, P.; Barthélémy, C.; Kaloshi, G.; Lavielle, M.; Ricard, D.; Idbaih, A.; Psimaras, D.; Renard, M.A.; Alentorn, A.; Honnorat, J.; et al. Prediction of response to temozolomide in low-grade glioma patients based on tumor size dynamics and genetic characteristics. CPT Pharmacomet. Syst. Pharmacol. 2015, 4, 728–737. [Google Scholar] [CrossRef] [PubMed]
- Mazzocco, P.; Honnorat, J.; Ducray, F.; Ribba, B. Increasing the time interval between PCV chemotherapy cycles as a strategy to improve duration of response in low-grade gliomas: Results from a model-based clinical trial simulation. Comput. Math. Methods Med. 2015, 2015, 297903. [Google Scholar] [CrossRef] [PubMed]
- Rojas, C.; Belmonte-Beitia, J.; Pérez-García, V.M.; Maurer, H. Dynamics and optimal control of chemotherapy for low grade gliomas: Insights from a mathematical model. Discret. Contin. Dyn. Syst.-B 2016, 21, 1895–1915. [Google Scholar] [CrossRef]
- Bogdańska, M.U.; Bodnar, M.; Belmonte-Beitia, J.; Murek, M.; Schucht, P.; Beck, J.; Pérez-García, V.M. A mathematical model of low grade gliomas treated with temozolomide and its therapeutical implications. Math. Biosci. 2017, 288, 1–13. [Google Scholar] [CrossRef]
- Pérez-García, V.M.; Ayala-Hernández, L.E.; Belmonte-Beitia, J.; Schucht, P.; Murek, M.; Raabe, A.; Sepúlveda, J. Computational design of improved standardized chemotherapy protocols for grade II oligodendrogliomas. PLoS Comput. Biol. 2019, 15, e1006778. [Google Scholar] [CrossRef] [PubMed]
- Bodnar, M.; Pérez, M.V. Mathematical and numerical analysis of low-grade gliomas model and the effects of chemotherapy. Commun. Nonlinear Sci. Numer. Simul. 2019, 72, 552–564. [Google Scholar] [CrossRef]
- Bashkirtseva, I.; Ryashko, L.; López, Á.G.; Seoane, J.M.; Sanjuán, M.A. The effect of time ordering and concurrency in a mathematical model of chemoradiotherapy. Commun. Nonlinear Sci. Numer. Simul. 2021, 96, 105693. [Google Scholar] [CrossRef]
- Pallud, J.; Mandonnet, E.; Duffau, H.; Kujas, M.; Guillevin, R.; Galanaud, D.; Taillandier, L.; Capelle, L. Prognostic value of initial magnetic resonance imaging growth rates for World Health Organization grade II gliomas. Ann. Neurol. 2006, 60, 380–383. [Google Scholar] [CrossRef]
- Mandonnet, E.; Delattre, J.Y.; Tanguy, M.L.; Swanson, K.R.; Carpentier, A.F.; Duffau, H.; Cornu, P.; Van Effenterre, R.; Alvord, E.C., Jr.; Capelle, L. Continuous growth of mean tumor diameter in a subset of grade II gliomas. Ann. Neurol. 2003, 53, 524–528. [Google Scholar] [CrossRef]
- Pérez-Beteta, J.; Molina-García, D.; Ortiz-Alhambra, J.A.; Fernández-Romero, A.; Luque, B.; Arregui, E.; Calvo, M.; Borrás, J.M.; Meléndez, B.; Rodríguez de Lope, Á.; et al. Tumor surface regularity at MR imaging predicts survival and response to surgery in patients with glioblastoma. Radiology 2018, 288, 218–225. [Google Scholar] [CrossRef]
- Yeh, A.C.; Ramaswamy, S. Mechanisms of cancer cell dormancy—Another hallmark of cancer? Cancer Res. 2015, 75, 5014–5022. [Google Scholar] [CrossRef]
- Mills, C.C.; Kolb, E.; Sampson, V.B. Development of chemotherapy with cell-cycle inhibitors for adult and pediatric cancer therapy. Cancer Res. 2018, 78, 320–325. [Google Scholar] [CrossRef]
- Pawlik, T.M.; Keyomarsi, K. Role of cell cycle in mediating sensitivity to radiotherapy. Int. J. Radiat. Oncol. Biol. Phys. 2004, 59, 928–942. [Google Scholar] [CrossRef]
- Adenis, L.; Plaszczynski, S.; Grammaticos, B.; Pallud, J.; Badoual, M. Radiotherapy Effects on Diffuse Low-Grade Gliomas: Confronting Theory With Clinical Data. arXiv 2021, arXiv:2107.02534. [Google Scholar]
- Fogarty, C.E.; Bergmann, A. Killers creating new life: Caspases drive apoptosis-induced proliferation in tissue repair and disease. Cell Death Differ. 2017, 24, 1390–1400. [Google Scholar] [CrossRef] [PubMed]
- Zimmerman, M.A.; Huang, Q.; Li, F.; Liu, X.; Li, C.Y. Cell death–stimulated cell proliferation: A tissue regeneration mechanism usurped by tumors during radiotherapy. Semin. Radiat. Oncol. 2013, 23, 288–295. [Google Scholar] [CrossRef] [PubMed]
- He, S.; Cheng, J.; Sun, L.; Wang, Y.; Wang, C.; Liu, X.; Zhang, Z.; Zhao, M.; Luo, Y.; Tian, L.; et al. HMGB1 released by irradiated tumor cells promotes living tumor cell proliferation via paracrine effect. Cell Death Dis. 2018, 9, 648. [Google Scholar] [CrossRef]
- Davis, A.J.; Tannock, I.F. Repopulation of tumour cells between cycles of chemotherapy: A neglected factor. Lancet Oncol. 2000, 1, 86–93. [Google Scholar] [CrossRef]
- Marcu, L. Tumour repopulation and the role of abortive division in squamous cell carcinomas during chemotherapy. Cell Prolif. 2014, 47, 318–325. [Google Scholar] [CrossRef] [PubMed]
- Mosteller, R. Simplified calculation of body-surface area. N. Engl. J. Med. 1987, 317, 1098. [Google Scholar]
- Portnow, J.; Badie, B.; Chen, M.; Liu, A.; Blanchard, S.; Synold, T.W. The neuropharmacokinetics of temozolomide in patients with resectable brain tumors: Potential implications for the current approach to chemoradiation. Clin. Cancer Res. 2009, 15, 7092–7098. [Google Scholar] [CrossRef]
- Hammond, L.A.; Eckardt, J.R.; Baker, S.D.; Eckhardt, S.G.; Dugan, M.; Forral, K.; Reidenberg, P.; Statkevich, P.; Weiss, G.R.; Rinaldi, D.A.; et al. Phase I and pharmacokinetic study of temozolomide on a daily-for-5-days schedule in patients with advanced solid malignancies. J. Clin. Oncol. 1999, 17, 2604–2613. [Google Scholar] [CrossRef]
- Van den Bent, M.; Afra, D.; De Witte, O.; Hassel, M.B.; Schraub, S.; Hoang-Xuan, K.; Malmström, P.; Collette, L.; Piérart, M.; Mirimanoff, R.; et al. Long-term efficacy of early versus delayed radiotherapy for low-grade astrocytoma and oligodendroglioma in adults: The EORTC 22845 randomised trial. Lancet 2005, 366, 985–990. [Google Scholar] [CrossRef]
- Creed, J.H.; Gerke, T.A.; Berglund, A.E. MatSurv: Survival analysis and visualization in MATLAB. J. Open Source Softw. 2020, 5, 1830. [Google Scholar] [CrossRef]
- Badoual, M.; Gerin, C.; Deroulers, C.; Grammaticos, B.; Llitjos, J.F.; Oppenheim, C.; Varlet, P.; Pallud, J. Oedema-based model for diffuse low-grade gliomas: Application to clinical cases under radiotherapy. Cell Prolif. 2014, 47, 369–380. [Google Scholar] [CrossRef] [PubMed]
- Ricard, D.; Kaloshi, G.; Amiel-Benouaich, A.; Lejeune, J.; Marie, Y.; Mandonnet, E.; Kujas, M.; Mokhtari, K.; Taillibert, S.; Laigle-Donadey, F.; et al. Dynamic history of low-grade gliomas before and after temozolomide treatment. Ann. Neurol. Off. J. Am. Neurol. Assoc. Child Neurol. Soc. 2007, 61, 484–490. [Google Scholar] [CrossRef] [PubMed]


| ID | Age at Diagnosis | Sex | Histology | Treatment | Ki-67 Labeling Index (%) | RT Sessions | TMZ Cycles |
|---|---|---|---|---|---|---|---|
| 10 | 48 | F | O | TMZ | 5 | - | 15 |
| 25 | 47 | M | O | TMZ | 5 | - | 4 |
| 36 | 40 | M | O | TMZ & RT | 3 | 35 | 13 |
| 40 | 30 | F | A | RT | 1 | 34 | - |
| 57 | 54 | M | O | TMZ | 4 | - | 10 |
| 66 | 28 | M | A | RT | NA | 30 | - |
| 91 | 34 | M | A | RT | NA | 30 | - |
| 105 | 33 | M | O | TMZ | 3 | - | 20 |
| 107 | 34 | M | A | RT | 3 | 30 | - |
| 108 | 46 | M | O | TMZ | 3 | - | 5 |
| 121 | 48 | M | A | RT | 3 | 35 | - |
| 124 | 27 | M | OA | RT | 3 | 35 | - |
| 151 | 58 | M | O | RT | 3 | 7 | - |
| TMZ | 5 | - | 13 | ||||
| 159 | 46 | M | NA | TMZ | NA | - | 12 |
| 203 | 51 | M | O | TMZ | 6 | - | 10 |
| 213 | 58 | F | O | TMZ | 3 | - | 20 |
| 234 | 44 | M | A | RT | 2 | 30 | - |
| Parameter | Description | Value | Sources |
|---|---|---|---|
| c | Standard dose per day | 150 mg/m | [26] |
| b | Patient body surface | 1.9 m (men) | [41] |
| 1.6 m (women) | [41] | ||
| Fraction of TMZ reaching | 2.1mL (men) | [25] | |
| the brain interstitium | mL (women) | [42] | |
| TMZ half-life clearance time | ≃2 h | [43] | |
| Rate of TMZ decay | 0.3466/h | [25] |
| ID | #RT Sessions | #TMZ Cycles | Ki-67 | ||||||||||
|---|---|---|---|---|---|---|---|---|---|---|---|---|---|
| Radiotherapy + Temozolomide | |||||||||||||
| 36 | 35 | 13 | 2.7 | 87.6 | 3 | 0.023 | 1.5 | 0.046 | 0.0002 | 0.45 | 0.55 | 2.3 | 3.9 |
| Radiotherapy | |||||||||||||
| 40 | 34 | - | 0.02 | 2.5 | 1 | 0.15 | 1 | 0.008 | 0.0011 | 0.32 | 0 | - | - |
| 66 | 30 | - | 0.64 | 20.9 | 3 * | 0.06 | 1.5 | 0.04 | 0.0001 | 0.39 | 0 | - | - |
| 91 | 30 | - | 0.8 | 39.5 | 2 * | 0.033 | 2.1 | 0.04 | 0.0008 | 0.16 | 0.04 | - | - |
| 107 | 30 | - | 1.3 | 42.8 | 3 | 0.092 | 1.08 | 0.03 | 0.0078 | 0.86 | 0 | - | - |
| 121 | 35 | - | 0.18 | 6 | 3 | 0.1 | 0.33 | 0.002 | 0.1 | 0.7 | - | - | |
| 124 | 35 | - | 0.08 | 2.8 | 3 | 0.013 | 0.87 | 0.02 | 0.004 | 0.01 | 0 | - | - |
| 151 | 7 | - | 0.86 | 27.9 | 3 | 0.01 | 1.3 | 0.04 | 0.01 | 0.94 | 0.09 | - | - |
| 234 | 30 | - | 1.2 | 6.9 | 2 | 0.032 | 1.6 | 0.04 | 0.0024 | 0.78 | 0 | - | - |
| Temozolomide | |||||||||||||
| 10 | - | 15 | 2.2 | 43.6 | 5 | 0.01 | 3.5 | 0.184 | 0.0008 | - | - | 6.01 | 4.31 |
| 25 | - | 4 | 1.7 | 32.6 | 5 | 0.028 | 6.42 | 0.33 | 0.004 | - | - | 20 | 20 |
| 57 | - | 10 | 1.8 | 45.1 | 4 | 0.01 | 0.23 | 0.009 | 0.006 | - | - | 15 | 9.8 |
| 105 | - | 20 | 4.3 | 141.7 | 3 | 0.035 | 0.7 | 0.02 | 0.0018 | - | - | 2.8 | 6.5 |
| 108 | - | 5 | 0.4 | 15.2 | 3 | 0.04 | 10.6 | 0.32 | 0.003 | - | - | 45 | 3 |
| 151 | - | 13 | 1.7 | 33.5 | 5 | 0.012 | 0.53 | 0.02 | 0.0013 | - | - | 14.8 | 1 |
| 159 | - | 12 | 2 | 66.1 | 3 * | 0.012 | 3.5 | 0.1 | 0.004 | - | - | 11 | 6 |
| 203 | - | 10 | 1.7 | 27.2 | 6 | 0.059 | 1.6 | 0.098 | 0.021 | - | - | 8.2 | 0.37 |
| 213 | - | 20 | 0.7 | 23.1 | 3 | 0.011 | 4.7 | 0.14 | 0.0005 | - | - | 15.2 | 15.1 |
| ID | #RT Sessions | #TMZ Cycles | OSG (Years) | ||||
|---|---|---|---|---|---|---|---|
| 10 | 30 | 15 | 0.28 | 0.47 | 6.01 | 4.31 | >10 |
| 25 | 30 | 4 | 0.1 | 0.65 | 20 | 20 | −1.2 |
| 36 | 35 | 13 | 0.45 | 0.55 | 2.3 | 3.9 | >10 |
| 40 | 34 | 12 | 0.32 | 0 | 34.6 | 14.9 | >10 |
| 57 | 30 | 10 | 0.68 | 0.69 | 15 | 9.8 | 8 |
| 66 | 30 | 12 | 0.39 | 0 | 30.3 | 1 | 8.7 |
| 91 | 30 | 12 | 0.16 | 0.04 | 7.7 | 18.3 | >10 |
| 105 | 30 | 20 | 0.51 | 0 | 2.8 | 6.5 | 4.7 |
| 107 | 30 | 12 | 0.86 | 0 | 30.3 | 3.7 | 0.4 |
| 108 | 30 | 5 | 0.2 | 0.48 | 45 | 3 | 2.9 |
| 121 | 35 | 12 | 0.1 | 0.7 | 10.3 | 10 | >10 |
| 124 | 35 | 12 | 0.01 | 0 | 14.1 | 13.7 | >10 |
| 151 | 7 | 12 | 0.94 | 0.09 | 5.5 | 1.4 | 0.26 |
| 151 | 30 | 13 | 0.83 | 0.24 | 14.8 | 1 | 1.9 |
| 159 | 30 | 12 | 0.18 | 0.17 | 11 | 6 | >10 |
| 203 | 30 | 10 | 0.6 | 0.27 | 8.2 | 0.37 | 1.4 |
| 213 | 30 | 20 | 0.36 | 0.41 | 15.2 | 15.1 | >10 |
| 234 | 30 | 12 | 0.78 | 0 | 2.5 | 15.6 | 3.1 |
Publisher’s Note: MDPI stays neutral with regard to jurisdictional claims in published maps and institutional affiliations. |
© 2021 by the authors. Licensee MDPI, Basel, Switzerland. This article is an open access article distributed under the terms and conditions of the Creative Commons Attribution (CC BY) license (https://creativecommons.org/licenses/by/4.0/).
Share and Cite
Ayala-Hernández, L.E.; Gallegos, A.; Schucht, P.; Murek, M.; Pérez-Romasanta, L.; Belmonte-Beitia, J.; Pérez-García, V.M. Optimal Combinations of Chemotherapy and Radiotherapy in Low-Grade Gliomas: A Mathematical Approach. J. Pers. Med. 2021, 11, 1036. https://doi.org/10.3390/jpm11101036
Ayala-Hernández LE, Gallegos A, Schucht P, Murek M, Pérez-Romasanta L, Belmonte-Beitia J, Pérez-García VM. Optimal Combinations of Chemotherapy and Radiotherapy in Low-Grade Gliomas: A Mathematical Approach. Journal of Personalized Medicine. 2021; 11(10):1036. https://doi.org/10.3390/jpm11101036
Chicago/Turabian StyleAyala-Hernández, Luis E., Armando Gallegos, Philippe Schucht, Michael Murek, Luis Pérez-Romasanta, Juan Belmonte-Beitia, and Víctor M. Pérez-García. 2021. "Optimal Combinations of Chemotherapy and Radiotherapy in Low-Grade Gliomas: A Mathematical Approach" Journal of Personalized Medicine 11, no. 10: 1036. https://doi.org/10.3390/jpm11101036