Scoring Osteoarthritis Reliably in Large Joints and the Spine Using Whole-Body CT: OsteoArthritis Computed Tomography-Score (OACT-Score)

 ,
, 
Abstract
:
1. Introduction
2. Materials and Methods
2.1. Study Sample and Image Acquisition
2.2. Image Assessment
2.2.1. Upper Extremity
Acromioclavicular Joint
Glenohumeral Joint
2.2.2. Spine
Degenerative Disc Disease
Facet Joint OA
2.2.3. Lower Extremity
Hip
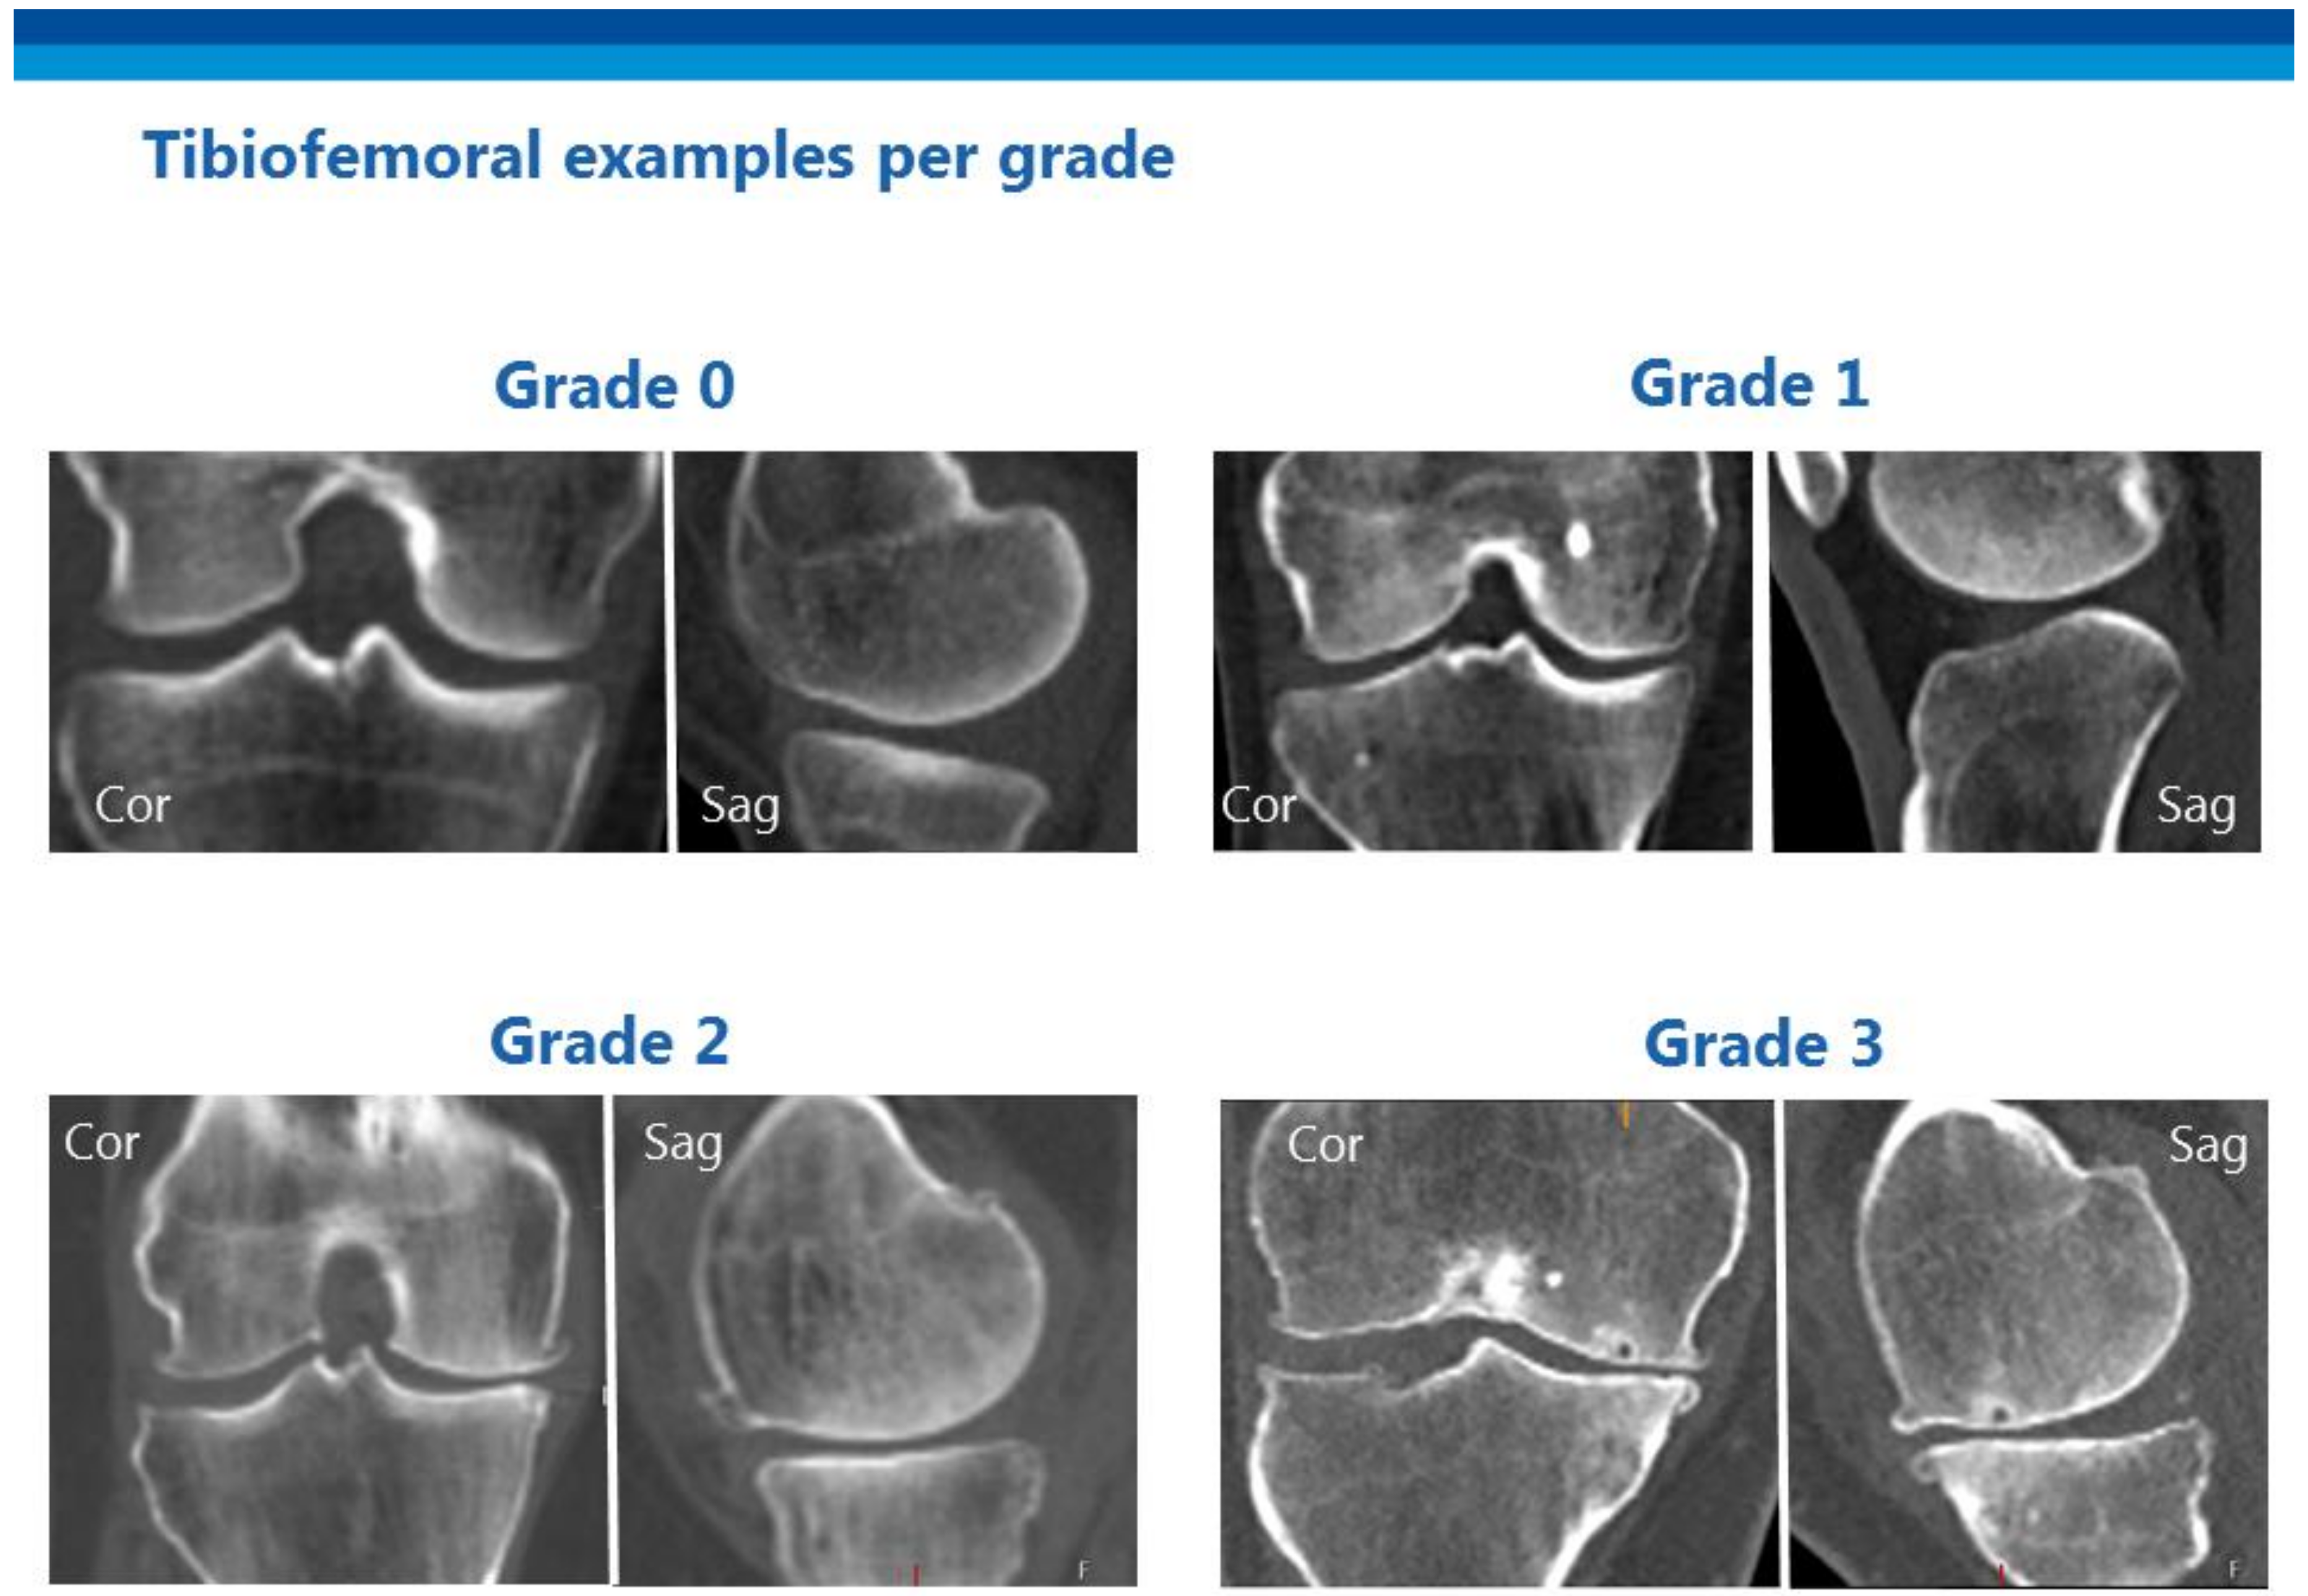
Knee—Tibiofemoral
Knee—Patellofemoral
Ankle
2.2.4. Total OA Grade
2.3. Testing Reproducibility
3. Results
3.1. Intra- and Interobserver Reliability for Total OA Grade
3.2. Intra- and Interobserver Reliability for OACT Scores for Individual Joints
4. Discussion
5. Conclusions
Supplementary Materials
Funding
Author Contributions
Data Availability Statement
Acknowledgments
Conflicts of Interest
Appendix A

| Intervertebral Disc Weighted Kappa (% agreement) | Reader 1 (intra) | Reader 1 vs. Reader 2 | Reader 1 vs. Reader 3 | Reader 2 vs. Reader 3 | ||||
| Disc space narrowing (0–3) | 0.83 | (65) | 0.76 | (57) | 0.80 | (63) | 0.72 | (50) |
| Osteophytes (0–3) | 0.85 | (73) | 0.76 | (65) | 0.76 | (51) | 0.81 | (65) |
| Sclerosis and/or end plate irregularity (0–1) | 0.68 | (84) | 0.56 | (79) | 0.58 | (79) | 0.45 | (72) |
| Hip Weighted kappa (% agreement) | ||||||||
| Joint space narrowing (0–3) | 0.86 | (82) | 0.65 | (64) | 0.37 | (64) | 0.51 | (54) |
| Osteophytes (0–3) | 0.75 | (80) | 0.57 | (72) | 0.69 | (74) | 0.59 | (70) |
| Cyst (0–1) | 1.00 | (100) | 1.00 | (100) | 0.49 | (96) | 0.49 | (96) |
| Tibiofemoral joint Weighted kappa (% agreement) | ||||||||
| Joint space narrowing (0–3) | 0.77 | (64) | 0.63 | (52) | 0.74 | (58) | 0.45 | (38) |
| Osteophytes (0–3) | 0.90 | (78) | 0.90 | (78) | 0.85 | (60) | 0.86 | (68) |
| Cyst (0–1) | 0.81 | (94) | 0.38 | (80) | 0.31 | (72) | 0.44 | (76) |
References
- Hunter, D.J.; Schofield, D.; Callander, E. The individual and socioeconomic impact of osteoarthritis. Nat. Rev. Rheumatol. 2014, 10, 437–441. [Google Scholar] [CrossRef]
- Van Spil, W.E.; Kubassova, O.; Boesen, M.; Bay-Jensen, A.C.; Mobasheri, A. Osteoarthritis phenotypes and novel therapeutic targets. Biochem. Pharmacol. 2019, 165, 41–48. [Google Scholar] [CrossRef]
- APPROACH Project. Available online: https://www.approachproject.eu (accessed on 8 March 2019).
- Kraus, V.B.; Kepler, T.B.; Stabler, T.; Renner, J.; Jordan, J. First qualification study of serum biomarkers as indicators of total body burden of osteoarthritis. PLoS ONE 2010, 5, e9739. [Google Scholar] [CrossRef]
- Meulenbelt, I.; Kloppenburg, M.; Kroon, H.M.; Houwing-Duistermaat, J.J.; Garnero, P.; Hellio-Le Graverand, M.-P.; DeGroot, J.; Slagboom, P.E. Clusters of biochemical markers are associated with radiographic subtypes of osteoarthritis (OA) in subject with familial OA at multiple sites. The GARP study. Osteoarthr. Cartil. 2007, 15, 379–385. [Google Scholar] [CrossRef] [Green Version]
- Kinds, M.B.; Vincken, K.L.; Hoppinga, T.N.; Bleys, R.L.A.W.; Viergever, M.A.; Marijnissen, A.C.A.; Welsing, P.M.J.; Lafeber, F.P.J.G. Influence of variation in semiflexed knee positioning during image acquisition on separate quantitative radiographic parameters of osteoarthritis, measured by Knee Images Digital Analysis. Osteoarthr. Cartil. 2012. [Google Scholar] [CrossRef] [Green Version]
- Willemink, M.J.; Leiner, T.; de Jong, P.A.; de Heer, L.M.; Nievelstein, R.A.J.; Schilham, A.M.R.; Budde, R.P.J. Iterative reconstruction techniques for computed tomography part 2: Initial results in dose reduction and image quality. Eur. Radiol. 2013, 23, 1632–1642. [Google Scholar] [CrossRef] [PubMed]
- Willemink, M.J.; de Jong, P.A.; Leiner, T.; de Heer, L.M.; Nievelstein, R.A.J.; Budde, R.P.J.; Schilham, A.M.R. Iterative reconstruction techniques for computed tomography Part 1: Technical principles. Eur. Radiol. 2013, 23, 1623–1631. [Google Scholar] [CrossRef] [PubMed]
- Weiler, C.; Schietzsch, M.; Kirchner, T.; Nerlich, A.G.; Boos, N.; Wuertz, K. Age-related changes in human cervical, thoracal and lumbar intervertebral disc exhibit a strong intra-individual correlation. Eur. Spine J. 2012, 21 (Suppl. 6), S810–S818. [Google Scholar] [CrossRef]
- O’Neill, T.W.; McCloskey, E.V.; Kanis, J.a.; Bhalla, A.K.; Reeve, J.; Reid, D.M.; Todd, C.; Woolf, A.D.; Silman, A.J. The distribution, determinants, and clinical correlates of vertebral osteophytosis: A population based survey. J. Rheumatol. 1999, 26, 842–848. [Google Scholar] [PubMed]
- Stenlund, B.; Marions, O.; Engström, K.F.; Goldie, I. Correlation of macroscopic osteoarthrotic changes and radiographic findings in the acromioclavicular joint. Acta Radiol. 1988, 29, 571–576. [Google Scholar] [CrossRef] [PubMed]
- Elsharkawi, M.; Cakir, B.; Reichel, H.; Kappe, T. Reliability of radiologic glenohumeral osteoarthritis classifications. J. Shoulder Elbow Surg. 2013, 22, 1063–1067. [Google Scholar] [CrossRef] [PubMed]
- Samilson, R.L.; Prieto, V. Dislocation arthropathy of the shoulder. J. Bone Joint Surg. Am. 1983, 65, 456–460. [Google Scholar] [CrossRef] [PubMed]
- Lane, N.E.; Nevitt, M.C.; Genant, H.K.; Hochberg, M.C. Reliability of new indices of radiographic osteoarthritis of the hand and hip and lumbar disc degeneration. J. Rheumatol. 1993, 20, 1911–1918. [Google Scholar] [PubMed]
- Kettler, A.; Wilke, H.-J. Review of existing grading systems for cervical or lumbar disc and facet joint degeneration. Eur. Spine J. 2006, 15, 705–718. [Google Scholar] [CrossRef] [PubMed]
- Weishaupt, D.; Zanetti, M.; Boos, N.; Hodler, J. MR imaging and CT in osteoarthritis of the lumbar facet joints. Skelet. Radiol. 1999, 28, 215–219. [Google Scholar] [CrossRef]
- Pathria, M.; Sartoris, D.J.; Resnick, D. Osteoarthritis of the facet joints: Accuracy of oblique radiographic assessment. Radiology 1987, 164, 227–230. [Google Scholar] [CrossRef]
- Turmezei, T.D.; Fotiadou, A.; Lomas, D.J.; Hopper, M.a.; Poole, K.E.S. A new CT grading system for hip osteoarthritis. Osteoarthr. Cartil. 2014, 22, 1360–1366. [Google Scholar] [CrossRef] [Green Version]
- Altman, R.D.; Gold, G.E. Atlas of individual radiographic features in osteoarthritis, revised. Osteoarthr. Cartil. 2007, 15 (Suppl. A), A1–A56. [Google Scholar] [CrossRef] [Green Version]
- Kellgren, J.H.; Lawrence, J.S. Radiological assessment of osteo-arthrosis. Ann. Rheum. Dis. 1957, 16, 494–502. [Google Scholar] [CrossRef] [Green Version]
- Jones, A.C.; Ledingham, J.; Mcalindon, T.; Regan, M.; Hart, D.; Macmillan, P.J.; Doherty, M. Radiographic assessment of patellofemoral osteoarthritis. Ann. Rheum. Dis. 1993, 52, 655–658. [Google Scholar] [CrossRef] [Green Version]
- Cohen, M.M.; Vela, N.D.; Levine, J.E.; Barnoy, E.A. Validating a New Computed Tomography Atlas for Grading Ankle Osteoarthritis. J. Foot Ankle Surg. 2014, 54, 207–213. [Google Scholar] [CrossRef] [PubMed]
- Fleiss, J.L.; Cohen, J. The equivalence of weighted kappa and the intraclass correlation coefficient as measures of reliability. Educ. Psychol. Meas. 1973, 33, 613–619. [Google Scholar] [CrossRef]
- Kottner, J.; Audigé, L.; Brorson, S.; Donner, A.; Gajewski, B.J.; Hróbjartsson, A.; Roberts, C.; Shoukri, M.; Streiner, D.L. Guidelines for Reporting Reliability and Agreement Studies (GRRAS) were proposed. J. Clin. Epidemiol. 2011, 64, 96–106. [Google Scholar] [CrossRef] [PubMed]
- Landis, J.R.; Koch, G.G. The Measurement of Observer Agreement for Categorical Data. Biometrics 1977, 33, 159. [Google Scholar] [CrossRef] [Green Version]
- Martin Bland, J.; Altman, D. Statistical methods for assessing agreement between two methods of clinical measurement. Lancet 1986, 327, 307–310. [Google Scholar] [CrossRef]
- Jones, M.; Dobson, A.; O’Brian, S. A graphical method for assessing agreement with the mean between multiple observers using continuous measures. Int. J. Epidemiol. 2011, 40, 1308–1313. [Google Scholar] [CrossRef] [Green Version]
- Mahir, L.; Belhaj, K.; Zahi, S.; Azanmasso, H.; Lmidmani, F.; El Fatimi, A. Impact of knee osteoarthritis on the quality of life. Ann. Phys. Rehabil. Med. 2016, 59, e159. [Google Scholar] [CrossRef]
- Glazebrook, M.; Daniels, T.; Younger, A.; Foote, C.J.; Penner, M.; Wing, K.; Lau, J.; Leighton, R.; Dunbar, M. Comparison of Health-Related Quality of Life Between Patients with End-Stage Ankle and Hip Arthrosis. J. Bone Jt. Surg.-Am. Vol. 2008, 90, 499–505. [Google Scholar] [CrossRef]
- Gautschi, O.P.; Smoll, N.R.; Corniola, M.V.; Joswig, H.; Chau, I.; Hildebrandt, G.; Schaller, K.; Stienen, M.N. Validity and reliability of a measurement of objective functional impairment in lumbar degenerative disc disease: The Timed Up and Go (TUG) test. Neurosurgery 2016, 79, 270–278. [Google Scholar] [CrossRef]
- Dobson, F.; Hinman, R.S.; Hall, M.; Terwee, C.B.; Roos, E.M.; Bennell, K.L. Measurement properties of performance-based measures to assess physical function in hip and knee osteoarthritis: A systematic review. Osteoarthr. Cartil. 2012, 20, 1548–1562. [Google Scholar] [CrossRef] [Green Version]
- Peterfy, C.G.; Guermazi, A.; Zaim, S.; Tirman, P.F.J.; Miaux, Y.; White, D.; Kothari, M.; Lu, Y.; Fye, K.; Zhao, S.; et al. Whole-organ magnetic resonance imaging score (WORMS) of the knee in osteoarthritis. Osteoarthr. Cartil. 2004, 12, 177–190. [Google Scholar] [CrossRef] [PubMed] [Green Version]
- Hunter, D.J.; Guermazi, A.; Lo, G.H.; Grainger, A.J.; Conaghan, P.G.; Boudreau, R.M.; Roemer, F.W. Evolution of semi-quantitative whole joint assessment of knee OA: MOAKS (MRI Osteoarthritis Knee Score). Osteoarthr. Cartil. 2011, 19, 990–1002. [Google Scholar] [CrossRef] [PubMed] [Green Version]
- Visser, A.W.; Bøyesen, P.; Haugen, I.K.; Schoones, J.W.; van der Heijde, D.M.; Rosendaal, F.R.; Kloppenburg, M. Radiographic scoring methods in hand osteoarthritis—A systematic literature search and descriptive review. Osteoarthr. Cartil. 2014, 22, 1710–1723. [Google Scholar] [CrossRef] [PubMed] [Green Version]
- Rustenburg, C.M.E.; Emanuel, K.S.; Peeters, M.; Lems, W.F.; Vergroesen, P.-P.A.; Smit, T.H. Osteoarthritis and intervertebral disc degeneration: Quite different, quite similar. JOR Spine 2018, 1, e1033. [Google Scholar] [CrossRef] [PubMed]
- Gramstad, G.D.; Galatz, L.M. Management of Elbow Osteoarthritis. J. Bone Jt. Surg. 2006, 88, 421–430. [Google Scholar] [CrossRef]
- Kuperus, J.S.; Oudkerk, S.F.; Foppen, W.; Mohamed Hoesein, F.A.; Gielis, W.P.; Waalwijk, J.; Regan, E.A.; Lynch, D.A.; Oner, F.C.; de Jong, P.A.; et al. Criteria for Early-Phase Diffuse Idiopathic Skeletal Hyperostosis: Development and Validation. Radiology 2019, 291, 420–426. [Google Scholar] [CrossRef]
- Meinberg, E.; Agel, J.; Roberts, C.; Karam, M.; Kellam, J. Fracture and Dislocation Classification Compendium—2018. J. Orthop. Trauma 2018, 32, S1–S10. [Google Scholar] [CrossRef]
- Chanchairujira, K.; Chung, C.B.; Kim, J.Y.; Papakonstantinou, O.; Lee, M.H.; Clopton, P.; Resnick, D. Intervertebral Disk Calcification of the Spine in an Elderly Population: Radiographic Prevalence, Location, and Distribution and Correlation with Spinal Degeneration. Radiology 2004, 230, 499–503. [Google Scholar] [CrossRef]
- Mettler, F.A.; Huda, W.; Yoshizumi, T.T.; Mahesh, M. Effective doses in radiology and diagnostic nuclear medicine: A catalog. Radiology 2008, 248, 254–263. [Google Scholar] [CrossRef]
- Lin, E.C. Radiation risk from medical imaging. Mayo Clin. Proc. 2010, 85, 1142–1146. [Google Scholar] [CrossRef] [Green Version]


| Acromioclavicular joint | |
| 0 | No osteophytes or joint space narrowing (JSN) |
| 1 | Lipping and/or possible JSN |
| 2 | Definite osteophytes and/or JSN |
| 3 | Definite osteophytes and/or JSN and sclerosis and/or cysts and/or bony deformities |
| Glenohumeral joint | |
| 0 | No osteophytes or definite JSN |
| 1 | Osteophyte measured less than 3 mm |
| 2 | Osteophyte measured between 3 and 7 mm, slight joint irregularity |
| 3 | Osteophyte measured more than 7 mm, definite JSN and/or irregularity. |
| Degenerative disc disease | |
| 0 | Score 0–2 (Based on disc space narrowing, osteophytes, end plate regularity and sclerosis) |
| 1 | Score 3–5 |
| 2 | Score 6–8 |
| 3 | Score 9–10 |
| Facet joint | |
| 0 | Normal facet joint space width (JSW) (2–4 mm) |
| 1 | Narrowing of facet JSW (<2 mm) and small osteophytes and/or mild hypertrophy of the articular process |
| 2 | Narrowing of facet JSW (<2 mm) and moderate osteophytes and/or moderate hypertrophy of the articular process and/or mild subarticulare bone erosions |
| 3 | Narrowing of facet JSW (<2 mm) and large osteophytes and/or severe hypertrophy of the articular process and/or severe subarticulare bone erosions and/or subchondral cysts |
| Hip joint | |
| 0 | Score 0–1(Based on joint space narrowing, osteophytes, and cysts) |
| 1 | Score 2–3 |
| 2 | Score 4–5 |
| 3 | Score 6–7 |
| Tibiofemoral joint | |
| 0 | Score 0–1(Based on joint space narrowing, osteophytes, and cysts) |
| 1 | Score 2–3 |
| 2 | Score 4–5 |
| 3 | Score 6–7 |
| Patellofemoral joint | |
| 0 | No osteophytes, joint space narrowing (JSN)/sclerosis |
| 1 | Small osteophyte/lipping and mild JSN, but no defined sclerosis |
| 2 | Moderate osteophytes, moderate JSN and possible sclerosis |
| 3 | Large osteophytes, (near) boney contact and defined sclerosis |
| Ankle joint | |
| 0 | No clinical evidence of OA; joint space integrity fully intact |
| 1 | Mild; osteophyte formation/lipping, possible joint space narrowing |
| 2 | Moderate; joint space narrowing evident, obvious osteophyte formation and some sclerosis/cystic changes |
| 3 | Severe; near absence of joint space, severe osteophyte/cyst formation, deformity of bone |
| Joint | 0 (No) | 1 (Mild) | 2 (Moderate) | 3 (Severe) | ||||
|---|---|---|---|---|---|---|---|---|
| Acromioclavicular, N(%) | 24 | (48) | 10 | (20) | 5 | (10) | 11 | (22) |
| Glenohumeral, N(%) | 37 | (74) | 7 | (14) | 3 | (6) | 3 | (6) |
| Intervertebral Disc, N(%) | 48 | (32) | 47 | (31) | 33 | (22) | 22 | (15) |
| Facet, N(%) | 91 | (61) | 37 | (25) | 7 | (5) | 15 | (10) |
| Hip, N(%) | 33 | (66) | 13 | (26) | 4 | (8) | 0 | (0) |
| Knee, N(%) | 25 | (50) | 13 | (26) | 8 | (16) | 4 | (8) |
| Patellofemoral, N(%) | 25 | (50) | 15 | (30) | 5 | (10) | 5 | (10) |
| Ankle1, N(%) | 26 | (54) | 19 | (38) | 4 | (8) | 0 | (0) |
| Joints | Reader 1 (intra) | Reader 1 vs. Reader 2 | Reader 1 vs. Reader 3 | Reader 2 vs. Reader 3 | ||||
|---|---|---|---|---|---|---|---|---|
| Acromioclavicular | 0.84 | (80) | 0.87 | (74) | 0.75 | (62) | 0.82 | (68) |
| Glenohumeral | 0.95 | (92) | 0.69 | (72) | 0.58 | (38) | 0.50 | (48) |
| Intervertebral Disc | 0.85 | (67) | 0.80 | (61) | 0.80 | (68) | 0.77 | (53) |
| Facet | 0.90 | (85) | 0.68 | (64) | 0.66 | (57) | 0.66 | (57) |
| Hip | 0.85 | (88) | 0.53 | (68) | 0.65 | (64) | 0.48 | (64) |
| Knee | 0.84 | (72) | 0.85 | (68) | 0.73 | (50) | 0.64 | (36) |
| Patellofemoral | 0.94 | (88) | 0.95 | (90) | 0.79 | (60) | 0.78 | (64) |
| Ankle | 0.79 | (84) | 0.74 | (80) | 0.56 | (65) | 0.49 | (63) |
Publisher’s Note: MDPI stays neutral with regard to jurisdictional claims in published maps and institutional affiliations. |
© 2020 by the authors. Licensee MDPI, Basel, Switzerland. This article is an open access article distributed under the terms and conditions of the Creative Commons Attribution (CC BY) license (http://creativecommons.org/licenses/by/4.0/).
Share and Cite
Gielis, W.P.; Weinans, H.; Nap, F.J.; Roemer, F.W.; Foppen, W. Scoring Osteoarthritis Reliably in Large Joints and the Spine Using Whole-Body CT: OsteoArthritis Computed Tomography-Score (OACT-Score). J. Pers. Med. 2021, 11, 5. https://doi.org/10.3390/jpm11010005
Gielis WP, Weinans H, Nap FJ, Roemer FW, Foppen W. Scoring Osteoarthritis Reliably in Large Joints and the Spine Using Whole-Body CT: OsteoArthritis Computed Tomography-Score (OACT-Score). Journal of Personalized Medicine. 2021; 11(1):5. https://doi.org/10.3390/jpm11010005
Chicago/Turabian StyleGielis, Willem Paul, Harrie Weinans, Frank J. Nap, Frank W. Roemer, and Wouter Foppen. 2021. "Scoring Osteoarthritis Reliably in Large Joints and the Spine Using Whole-Body CT: OsteoArthritis Computed Tomography-Score (OACT-Score)" Journal of Personalized Medicine 11, no. 1: 5. https://doi.org/10.3390/jpm11010005