
Using Computational Simulations Based on Fuzzy Cognitive Maps to Detect Dengue Complications


Abstract
:1. Introduction
2. Related Works
3. Materials and Methods
3.1. Instruments
FCMs
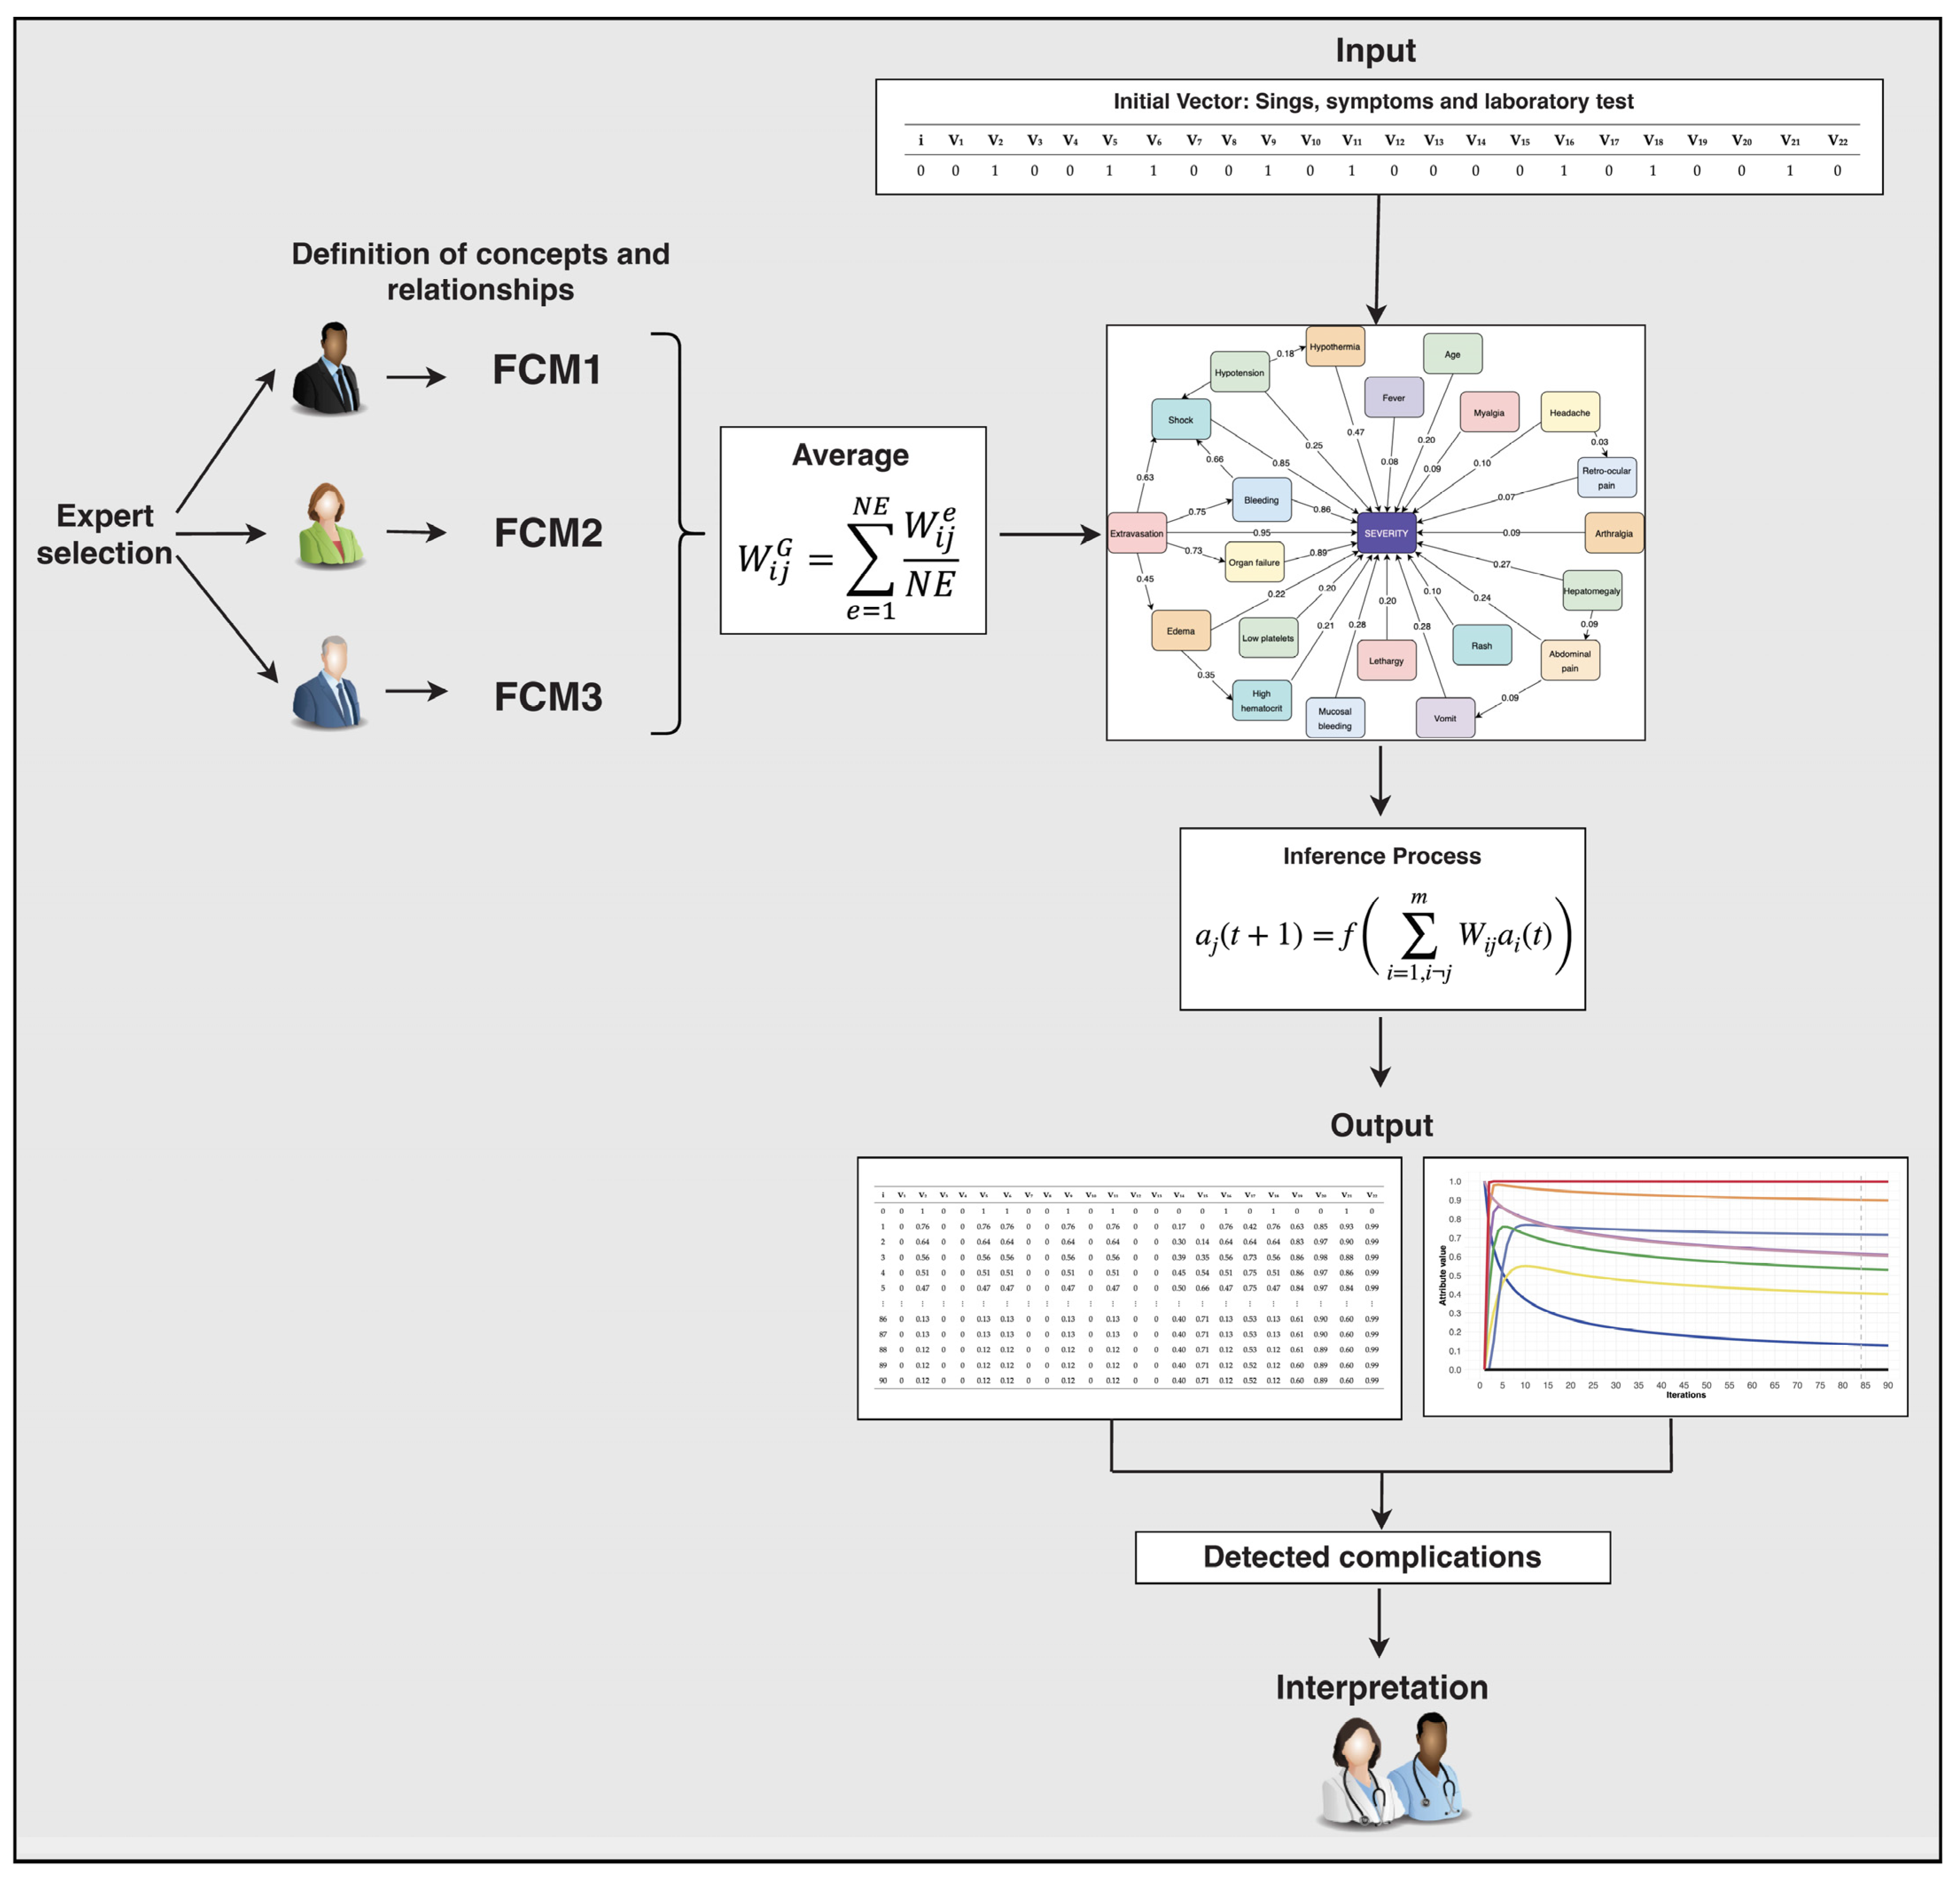
3.2. Procedure
FCM Model Design
- Step 1. Expert selection
- Step 2. Definition of attributes and relationships
- Step 3. Global FCM
- Step 4. Inference of the Model
- Step 5. Interpretation
3.3. Participants
3.4. Ethical Considerations
4. Results
4.1. Scenario 1

| i | V1 | V2 | V3 | V4 | V5 | V6 | V7 | V8 | V9 | V10 | V11 | V12 | V13 | V14 | V15 | V16 | V17 | V18 | V19 | V20 | V21 | V22 |
|---|---|---|---|---|---|---|---|---|---|---|---|---|---|---|---|---|---|---|---|---|---|---|
| 0 | 1 | 1 | 1 | 0 | 1 | 1 | 1 | 0 | 0 | 0 | 0 | 0 | 0 | 0 | 0 | 0 | 0 | 0 | 0 | 0 | 0 | 0 |
| 1 | 0.76 | 0.76 | 0.76 | 0.02 | 0.76 | 0.76 | 0.76 | 0 | 0 | 0 | 0 | 0 | 0 | 0 | 0 | 0 | 0 | 0 | 0 | 0 | 0 | 0.57 |
| 2 | 0.64 | 0.64 | 0.64 | 0.05 | 0.64 | 0.64 | 0.64 | 0 | 0 | 0 | 0 | 0 | 0 | 0 | 0 | 0 | 0 | 0 | 0 | 0 | 0 | 0.79 |
| 3 | 0.56 | 0.56 | 0.56 | 0.07 | 0.56 | 0.56 | 0.56 | 0 | 0 | 0 | 0 | 0 | 0 | 0 | 0 | 0 | 0 | 0 | 0 | 0 | 0 | 0.84 |
| 4 | 0.51 | 0.51 | 0.51 | 0.08 | 0.51 | 0.51 | 0.51 | 0 | 0 | 0 | 0 | 0 | 0 | 0 | 0 | 0 | 0 | 0 | 0 | 0 | 0 | 0.83 |
| 5 | 0.47 | 0.47 | 0.47 | 0.10 | 0.47 | 0.47 | 0.47 | 0 | 0 | 0 | 0 | 0 | 0 | 0 | 0 | 0 | 0 | 0 | 0 | 0 | 0 | 0.82 |
| 86 | 0.13 | 0.13 | 0.13 | 0.23 | 0.13 | 0.13 | 0.13 | 0 | 0 | 0 | 0 | 0 | 0 | 0 | 0 | 0 | 0 | 0 | 0 | 0 | 0 | 0.61 |
| 87 | 0.13 | 0.13 | 0.13 | 0.23 | 0.13 | 0.13 | 0.13 | 0 | 0 | 0 | 0 | 0 | 0 | 0 | 0 | 0 | 0 | 0 | 0 | 0 | 0 | 0.61 |
| 88 | 0.12 | 0.12 | 0.12 | 0.23 | 0.12 | 0.12 | 0.12 | 0 | 0 | 0 | 0 | 0 | 0 | 0 | 0 | 0 | 0 | 0 | 0 | 0 | 0 | 0.61 |
| 89 | 0.12 | 0.12 | 0.12 | 0.23 | 0.12 | 0.12 | 0.12 | 0 | 0 | 0 | 0 | 0 | 0 | 0 | 0 | 0 | 0 | 0 | 0 | 0 | 0 | 0.61 |
| 90 | 0.12 | 0.12 | 0.12 | 0.23 | 0.12 | 0.12 | 0.12 | 0 | 0 | 0 | 0 | 0 | 0 | 0 | 0 | 0 | 0 | 0 | 0 | 0 | 0 | 0.61 |
4.2. Scenario 2
| i | V1 | V2 | V3 | V4 | V5 | V6 | V7 | V8 | V9 | V10 | V11 | V12 | V13 | V14 | V15 | V16 | V17 | V18 | V19 | V20 | V21 | V22 |
|---|---|---|---|---|---|---|---|---|---|---|---|---|---|---|---|---|---|---|---|---|---|---|
| 0 | 0 | 1 | 1 | 0 | 1 | 1 | 0 | 1 | 0 | 0 | 0 | 0 | 0 | 0 | 0 | 1 | 0 | 0 | 0 | 0 | 0 | 0 |
| 1 | 0 | 0.76 | 0.76 | 0.02 | 0.76 | 0.76 | 0 | 0.76 | 0.08 | 0 | 0 | 0 | 0 | 0 | 0 | 0.76 | 0 | 0 | 0 | 0 | 0 | 0.66 |
| 2 | 0 | 0.64 | 0.64 | 0.05 | 0.64 | 0.64 | 0 | 0.64 | 0.15 | 0 | 0 | 0 | 0 | 0 | 0 | 0.64 | 0 | 0 | 0 | 0 | 0 | 0.86 |
| 3 | 0 | 0.56 | 0.56 | 0.07 | 0.56 | 0.56 | 0 | 0.56 | 0.20 | 0 | 0 | 0 | 0 | 0 | 0 | 0.56 | 0 | 0 | 0 | 0 | 0 | 0.88 |
| 4 | 0 | 0.51 | 0.51 | 0.08 | 0.51 | 0.51 | 0 | 0.51 | 0.24 | 0 | 0 | 0 | 0 | 0 | 0 | 0.51 | 0 | 0 | 0 | 0 | 0 | 0.88 |
| 5 | 0 | 0.47 | 0.47 | 0.10 | 0.47 | 0.47 | 0 | 0.47 | 0.28 | 0 | 0 | 0 | 0 | 0 | 0 | 0.47 | 0 | 0 | 0 | 0 | 0 | 0.87 |
| 86 | 0 | 0.13 | 0.13 | 0.23 | 0.13 | 0.13 | 0 | 0.13 | 0.32 | 0 | 0 | 0 | 0 | 0 | 0 | 0.13 | 0 | 0 | 0 | 0 | 0 | 0.74 |
| 87 | 0 | 0.13 | 0.13 | 0.23 | 0.13 | 0.13 | 0 | 0.13 | 0.32 | 0 | 0 | 0 | 0 | 0 | 0 | 0.13 | 0 | 0 | 0 | 0 | 0 | 0.74 |
| 88 | 0 | 0.12 | 0.12 | 0.23 | 0.12 | 0.12 | 0 | 0.12 | 0.32 | 0 | 0 | 0 | 0 | 0 | 0 | 0.12 | 0 | 0 | 0 | 0 | 0 | 0.74 |
| 89 | 0 | 0.12 | 0.12 | 0.23 | 0.12 | 0.12 | 0 | 0.12 | 0.32 | 0 | 0 | 0 | 0 | 0 | 0 | 0.12 | 0 | 0 | 0 | 0 | 0 | 0.74 |
| 90 | 0 | 0.12 | 0.12 | 0.23 | 0.12 | 0.12 | 0 | 0.12 | 0.32 | 0 | 0 | 0 | 0 | 0 | 0 | 0.12 | 0 | 0 | 0 | 0 | 0 | 0.73 |
4.3. Scenario 3
| i | V1 | V2 | V3 | V4 | V5 | V6 | V7 | V8 | V9 | V10 | V11 | V12 | V13 | V14 | V15 | V16 | V17 | V18 | V19 | V20 | V21 | V22 |
|---|---|---|---|---|---|---|---|---|---|---|---|---|---|---|---|---|---|---|---|---|---|---|
| 0 | 0 | 1 | 0 | 0 | 1 | 1 | 0 | 0 | 1 | 0 | 1 | 0 | 0 | 0 | 0 | 1 | 0 | 1 | 0 | 0 | 1 | 0 |
| 1 | 0 | 0.76 | 0 | 0 | 0.76 | 0.76 | 0 | 0 | 0.76 | 0 | 0.76 | 0 | 0 | 0.17 | 0 | 0.76 | 0.42 | 0.76 | 0.63 | 0.85 | 0.93 | 0.99 |
| 2 | 0 | 0.64 | 0 | 0 | 0.64 | 0.64 | 0 | 0 | 0.64 | 0 | 0.64 | 0 | 0 | 0.30 | 0.14 | 0.64 | 0.64 | 0.64 | 0.83 | 0.97 | 0.90 | 0.99 |
| 3 | 0 | 0.56 | 0 | 0 | 0.56 | 0.56 | 0 | 0 | 0.56 | 0 | 0.56 | 0 | 0 | 0.39 | 0.35 | 0.56 | 0.73 | 0.56 | 0.86 | 0.98 | 0.88 | 0.99 |
| 4 | 0 | 0.51 | 0 | 0 | 0.51 | 0.51 | 0 | 0 | 0.51 | 0 | 0.51 | 0 | 0 | 0.45 | 0.54 | 0.51 | 0.75 | 0.51 | 0.86 | 0.97 | 0.86 | 0.99 |
| 5 | 0 | 0.47 | 0 | 0 | 0.47 | 0.47 | 0 | 0 | 0.47 | 0 | 0.47 | 0 | 0 | 0.50 | 0.66 | 0.47 | 0.75 | 0.47 | 0.84 | 0.97 | 0.84 | 0.99 |
| 86 | 0 | 0.13 | 0 | 0 | 0.13 | 0.13 | 0 | 0 | 0.13 | 0 | 0.13 | 0 | 0 | 0.40 | 0.71 | 0.13 | 0.53 | 0.13 | 0.61 | 0.90 | 0.60 | 0.99 |
| 87 | 0 | 0.13 | 0 | 0 | 0.13 | 0.13 | 0 | 0 | 0.13 | 0 | 0.13 | 0 | 0 | 0.40 | 0.71 | 0.13 | 0.53 | 0.13 | 0.61 | 0.90 | 0.60 | 0.99 |
| 88 | 0 | 0.12 | 0 | 0 | 0.12 | 0.12 | 0 | 0 | 0.12 | 0 | 0.12 | 0 | 0 | 0.40 | 0.71 | 0.12 | 0.53 | 0.12 | 0.61 | 0.89 | 0.60 | 0.99 |
| 89 | 0 | 0.12 | 0 | 0 | 0.12 | 0.12 | 0 | 0 | 0.12 | 0 | 0.12 | 0 | 0 | 0.40 | 0.71 | 0.12 | 0.52 | 0.12 | 0.60 | 0.89 | 0.60 | 0.99 |
| 90 | 0 | 0.12 | 0 | 0 | 0.12 | 0.12 | 0 | 0 | 0.12 | 0 | 0.12 | 0 | 0 | 0.40 | 0.71 | 0.12 | 0.52 | 0.12 | 0.60 | 0.89 | 0.60 | 0.99 |
5. Discussion
6. Limitations and Future Directions
7. Conclusions
Supplementary Materials
Author Contributions
Funding
Institutional Review Board Statement
Informed Consent Statement
Data Availability Statement
Acknowledgments
Conflicts of Interest
References
- World Health Organization. Dengue: Guidelines for Diagnosis, Treatment, Prevention and Control; WHO Press: Paris, France, 2009. [Google Scholar]
- Asish, P.R.; Dasgupta, S.; Rachel, G.; Bagepally, B.S.; Girish Kumar, C.P. Global prevalence of asymptomatic dengue infections—A systematic review and meta-analysis. Int. J. Infect. Dis. 2023, 134, 292–298. [Google Scholar] [CrossRef]
- Centers for Disease Control and Prevention. Dengue. Available online: https://cdc.gov/dengue/index.html (accessed on 23 November 2023).
- Caicedo-Borrero, D.M.; Tovar, J.R.; Méndez, A.; Parra, B.; Bonelo, A.; Celis, J.; Villegas, L.; Collazos, C.; Osorio, L. Development and Performance of Dengue Diagnostic Clinical Algorithms in Colombia. Am. J. Trop. Med. Hyg. 2020, 102, 1226–1236. [Google Scholar] [CrossRef] [PubMed]
- World Health Organization. Dengue and Severe Dengue. Available online: https://www.who.int/news-room/fact-sheets/detail/dengue-and-severe-dengue (accessed on 13 October 2023).
- World Health Organization. Geographical Expansion of Cases of Dengue and Chikungunya beyond the Historical Areas of Transmission in the Region of the Americas. Available online: https://www.who.int/emergencies/disease-outbreak-news/item/2023-DON448 (accessed on 13 October 2023).
- Procopio, A.C.; Coletta, S.; Laratta, E.; Mellace, M.; Tilocca, B.; Ceniti, C.; Urbani, A.; Roncada, P. Integrated one health strategies in Dengue. One Health 2024, 18, 100684. [Google Scholar] [CrossRef]
- Kok, B.H.; Lim, H.T.; Lim, C.P.; Lai, N.S.; Leow, C.Y.; Leow, C.H. Dengue virus infection—A review of pathogenesis, vaccines, diagnosis and therapy. Virus Res. 2023, 324, 199018. [Google Scholar] [CrossRef] [PubMed]
- Khan, M.B.; Yang, Z.S.; Lin, C.Y.; Hsu, M.C.; Urbina, A.N.; Assavalapsakul, W.; Wang, W.H.; Chen, Y.H.; Wang, S.F. Dengue overview: An updated systemic review. J. Infect. Public Health 2023, 16, 1625–1642. [Google Scholar] [CrossRef]
- Hegde, S.S.; Bhat, B.R. Dengue detection: Advances and challenges in diagnostic technology. Biosens. Bioelectron. X 2022, 10, 100100. [Google Scholar] [CrossRef]
- Ajlan, B.A.; Alafif, M.M.; Alawi, M.M.; Akbar, N.A.; Aldigs, E.K.; Madani, T.A. Assessment of the new World Health Organization’s dengue classification for predicting severity of illness and level of healthcare required. PLoS Negl. Trop. Dis. 2019, 13, e0007144. [Google Scholar] [CrossRef]
- Wong, P.F.; Wong, L.P.; AbuBakar, S. Diagnosis of severe dengue: Challenges, needs and opportunities. J. Infect. Public Health 2020, 13, 193–198. [Google Scholar] [CrossRef]
- Moallemi, S.; Lloyd, A.R.; Rodrigo, C. Early biomarkers for prediction of severe manifestations of dengue fever: A systematic review and a meta-analysis. Sci. Rep. 2023, 13, 17485. [Google Scholar] [CrossRef]
- Thach, T.Q.; Eisa, H.G.; Hmeda, A.B.; Faraj, H.; Thuan, T.M.; Abdelrahman, M.M.; Awadallah, M.G.; Ha, N.X.; Noeske, M.; Abdul, J.M.; et al. Predictive markers for the early prognosis of dengue severity: A systematic review and meta-analysis. PLoS Negl. Trop. Dis. 2021, 15, e0009808. [Google Scholar] [CrossRef]
- Zhang, S.-T.; Wang, S.-Y.; Zhang, J.; Dong, D.; Mu, W.; Xia, X.-E.; Fu, F.-F.; Lu, Y.-N.; Wang, S.; Tang, Z.-C.; et al. Artificial intelligence-based computer-aided diagnosis system supports diagnosis of lymph node metastasis in esophageal squamous cell carcinoma: A multicenter study. Heliyon 2023, 9, e14030. [Google Scholar] [CrossRef]
- Silva, B.; Hak, F.; Guimarães, T.; Manuel, M.; Santos, M.F. Rule-based System for Effective Clinical Decision Support. Procedia Comput. Sci. 2023, 220, 880–885. [Google Scholar] [CrossRef]
- Gupta, G.; Khan, S.; Guleria, V.; Almjally, A.; Alabduallah, B.I.; Siddiqui, T.; Albahlal, B.M.; Alajlan, S.A.; AL-subaie, M. DDPM: A Dengue Disease Prediction and Diagnosis Model Using Sentiment Analysis and Machine Learning Algorithms. Diagnostics 2023, 13, 1093. [Google Scholar] [CrossRef] [PubMed]
- Ming, D.K.; Tuan, N.M.; Hernandez, B.; Sangkaew, S.; Vuong, N.L.; Chanh, H.Q.; Chau, N.V.; Simmons, C.P.; Wills, B.; Georgiou, P.; et al. The Diagnosis of Dengue in Patients Presenting With Acute Febrile Illness Using Supervised Machine Learning and Impact of Seasonality. Front. Digit. Health 2022, 4, 849641. [Google Scholar] [CrossRef] [PubMed]
- Ong, S.Q.; Isawasan, P.; Ngesom, A.M.; Shahar, H.; Lasim, A.M.; Nair, G. Predicting dengue transmission rates by comparing different machine learning models with vector indices and meteorological data. Sci. Rep. 2023, 13, 19129. [Google Scholar] [CrossRef] [PubMed]
- Yang, J.; Mosabbir, A.A.; Raheem, E.; Hu, W.; Hossain, M.S. Demographic characteristics, clinical symptoms, biochemical markers and probability of occurrence of severe dengue: A multicenter hospital-based study in Bangladesh. PLoS Negl. Trop. Dis. 2023, 17, e0011161. [Google Scholar] [CrossRef] [PubMed]
- Liu, Y.E.; Saul, S.; Rao, A.M.; Robinson, M.L.; Agudelo, O.L.; Sanz, A.M.; Verghese, M.; Solis, D.; Sibai, M.; Huang, C.H.; et al. An 8-gene machine learning model improves clinical prediction of severe dengue progression. Genome Med. 2022, 14, 33. [Google Scholar] [CrossRef]
- Hung, S.-J.; Tsai, H.-P.; Wang, Y.-F.; Ko, W.-C.; Wang, J.-R.; Huang, S.-W. Assessment of the Risk of Severe Dengue Using Intrahost Viral Population in Dengue Virus Serotype 2 Patients via Machine Learning. Front. Cell. Infect. Microbiol. 2022, 12, 831281. [Google Scholar] [CrossRef] [PubMed]
- Mariappan, V.; Adikari, S.; Shanmugam, L.; Easow, J.M.; Balakrishna, A. Expression dynamics of vascular endothelial markers: Endoglin and syndecan-1 in predicting dengue disease outcome. Transl. Res. 2021, 232, 121–141. [Google Scholar] [CrossRef]
- Hoyos, W.; Aguilar, J.; Raciny, M.; Toro, M. Case studies of clinical decision-making through prescriptive models based on machine learning. Comput. Methods Programs Biomed. 2023, 242, 107829. [Google Scholar] [CrossRef]
- Chowdhury, S.U.; Sayeed, S.; Rashid, I.; Alam, M.G.R.; Masum, A.K.M.; Dewan, M.A.A. Shapley-Additive-Explanations-Based Factor Analysis for Dengue Severity Prediction using Machine Learning. J. Imaging 2022, 8, 229. [Google Scholar] [CrossRef] [PubMed]
- Corzo-Gómez, J.; Guzmán-Aquino, S.; Vargas-De-León, C.; Megchún-Hernández, M.; Briones-Aranda, A. Bayesian Analysis Used to Identify Clinical and Laboratory Variables Capable of Predicting Progression to Severe Dengue among Infected Pediatric Patients. Children 2023, 10, 1508. [Google Scholar] [CrossRef] [PubMed]
- Zargari Marandi, R.; Leung, P.; Sigera, C.; Dawson Murray, D.; Weeratunga, P.; Fernando, D.; Rodrigo, C.; Rajapakse, S.; MacPherson, C.R. Development of a machine learning model for early prediction of plasma leakage in suspected dengue patients. PLoS Negl. Trop. Dis. 2023, 17, e0010758. [Google Scholar] [CrossRef] [PubMed]
- Chaw, J.K.; Chaw, S.H.; Quah, C.H.; Sahrani, S.; Ang, M.C.; Zhao, Y.; Ting, T.T. A predictive analytics model using machine learning algorithms to estimate the risk of shock development among dengue patients. Healthc. Anal. 2024, 5, 100290. [Google Scholar] [CrossRef]
- Huang, S.-W.; Tsai, H.-P.; Hung, S.-J.; Ko, W.-C.; Wang, J.-R. Assessing the risk of dengue severity using demographic information and laboratory test results with machine learning. PLoS Negl. Trop. Dis. 2020, 14, e0008960. [Google Scholar] [CrossRef] [PubMed]
- Wysocki, O.; Davies, J.K.; Vigo, M.; Armstrong, A.C.; Landers, D.; Lee, R.; Freitas, A. Assessing the communication gap between AI models and healthcare professionals: Explainability, utility and trust in AI-driven clinical decision-making. Artif. Intell. 2023, 316, 103839. [Google Scholar] [CrossRef]
- Kosko, B. Fuzzy cognitive maps. Int. J. Man-Mach. Stud. 1986, 24, 65–75. [Google Scholar] [CrossRef]
- Amirkhani, A.; Papageorgiou, E.I.; Mohseni, A.; Mosavi, M.R. A review of fuzzy cognitive maps in medicine: Taxonomy, methods, and applications. Comput. Methods Programs Biomed. 2017, 142, 129–145. [Google Scholar] [CrossRef]
- Hoyos, W.; Aguilar, J.; Toro, M. A clinical decision-support system for dengue based on fuzzy cognitive maps. Health Care Manag. Sci. 2022, 25, 666–681. [Google Scholar] [CrossRef]
- Saúl, L.A.; Sanfeliciano, A.; Botella, L.; Perea, R.; Gonzalez-Puerto, J.A. Fuzzy Cognitive Maps as a Tool for Identifying Cognitive Conflicts That Hinder the Adoption of Healthy Habits. Int. J. Environ. Res. Public Health 2022, 19, 1411. [Google Scholar] [CrossRef]
- Aguilar, J. A Fuzzy Cognitive Map Based on the Random Neural Model. In Proceedings of the Engineering of Intelligent Systems, Budapest, Hungary, 4–7 June 2001; pp. 333–338. [Google Scholar] [CrossRef]
- Nápoles, G.; Espinosa, M.L.; Grau, I.; Vanhoof, K. FCM Expert: Software Tool for Scenario Analysis and Pattern Classification Based on Fuzzy Cognitive Maps. Int. J. Artif. Intell. Tools 2018, 27, 1860010. [Google Scholar] [CrossRef]
- Hoyos, W.; Aguilar, J.; Toro, M. PRV-FCM: An extension of fuzzy cognitive maps for prescriptive modeling. Expert Syst. Appl. 2023, 231, 120729. [Google Scholar] [CrossRef]
- World Medical Association. World Medical Association Declaration of Helsinki: Ethical Principles for Medical Research Involving Human Subjects. JAMA 2013, 310, 2191–2194. [CrossRef]
- Ministerio de Salud de Colombia. Resolución 008430 de 1993. Por la cual se Establecen las Normas Científicas, Técnicas y Administrativas Para la investigación en Salud. Available online: https://www.minsalud.gov.co/sites/rid/Lists/BibliotecaDigital/RIDE/DE/DIJ/RESOLUCION-8430-DE-1993.PDF (accessed on 13 November 2023).
- Muller, D.A.; Depelsenaire, A.C.; Young, P.R. Clinical and Laboratory Diagnosis of Dengue Virus Infection. J. Infect. Dis. 2017, 215, S89–S95. [Google Scholar] [CrossRef]
- Wagle, A.M.; Hegde, S.R.; Sanjay, S.; Au Eong, K.-G. Ophthalmic manifestations in seropositive dengue fever patients during epidemics caused by predominantly different dengue serotypes. Adv. Ophthalmol. Pract. Res. 2022, 2, 100049. [Google Scholar] [CrossRef]
- Venkatesh, A.; Patel, R.; Goyal, S.; Rajaratnam, T.; Sharma, A.; Hossain, P. Ocular manifestations of emerging viral diseases. Eye 2021, 35, 1117–1139. [Google Scholar] [CrossRef] [PubMed]
- Sangkaew, S.; Ming, D.; Boonyasiri, A.; Honeyford, K.; Kalayanarooj, S.; Yacoub, S.; Dorigatti, I.; Holmes, A. Risk predictors of progression to severe disease during the febrile phase of dengue: A systematic review and meta-analysis. Lancet Infect. Dis. 2021, 21, 1014–1026. [Google Scholar] [CrossRef] [PubMed]
- Yuan, K.; Chen, Y.; Zhong, M.; Lin, Y.; Liu, L. Risk and predictive factors for severe dengue infection: A systematic review and meta-analysis. PLoS ONE 2022, 17, e0267186. [Google Scholar] [CrossRef] [PubMed]
- Aguilar-Briseño, J.A.; Moser, J.; Rodenhuis-Zybert, I.A. Understanding immunopathology of severe dengue: Lessons learnt from sepsis. Curr. Opin. Virol. 2020, 43, 41–49. [Google Scholar] [CrossRef] [PubMed]
- Htun, T.P.; Xiong, Z.; Pang, J. Clinical signs and symptoms associated with WHO severe dengue classification: A systematic review and meta-analysis. Emerg. Microbes Infect. 2021, 10, 1116–1128. [Google Scholar] [CrossRef] [PubMed]
- Gambhir, S.; Malik, S.K.; Kumar, Y. PSO-ANN based diagnostic model for the early detection of dengue disease. New Horiz. Transl. Med. 2017, 4, 1–8. [Google Scholar] [CrossRef]
- Ciao, D.; Pastor, A.; Oliveira, T.; de Lima, F.B.; Braga-Neto, U.; Bigham, A.W.; Bamshad, M.; Marques, E.T.; Acioli-Santos, B. Severe Dengue Prognosis Using Human Genome Data and Machine Learning. IEEE Trans. Biomed. Eng. 2019, 66, 2861–2868. [Google Scholar] [CrossRef]


| Variable Code | Variable Name | Brief Description |
|---|---|---|
| V1 | Age | Measured time elapsed since birth of a person. |
| V2 | Fever | Abnormal increase in body temperature, product of mechanisms derived from pathophysiological stress. |
| V3 | Headache | Painful sensation in any part of the head, ranging from sharp to mild pain and may occur with other symptoms. |
| V4 | Retroocular pain | Throbbing, painful, or burning sensation in or around the eye. |
| V5 | Myalgia | Muscle pain caused by illness or injury. |
| V6 | Arthralgia | Pain in one or more joints. |
| V7 | Rash | Discomfort consisting in the appearance of basic lesions arising on the skin. |
| V8 | Abdominal pain | Pain from inside the abdomen or the external muscle wall, ranging from mild and temporary to severe, in which case it requires medical attention. |
| V9 | Vomiting | Regurgitation of gastric contents due to different causes. |
| V10 | Lethargy | State of deep and prolonged tiredness and drowsiness, especially when it is pathological and is caused by an illness. |
| V11 | Hypotension | Occurs when blood pressure is much lower than normal. This means that the heart, brain, and other parts of the body may not get enough blood. |
| V12 | Hepatomegaly | Enlargement of the liver beyond its normal size. |
| V13 | Mucosal bleeding | Bleeding in superficial areas, including the skin and mucous membranes, suggesting a platelet or blood vessel problem. |
| V14 | Hypothermia | A dangerously low body temperature, below 95 °F (35 °C), which occurs when the body loses more heat than it can generate. |
| V15 | High hematocrit | An increase in the percentage or number of red blood cells, that may indicate dehydration or other medical problems affecting the blood. |
| V16 | Low platelets | Platelet aggregation is any disorder in which there is an abnormally low amount of platelets, which are parts of the blood that help the blood to clot. |
| V17 | Edema | Swelling caused by the accumulation of fluid in the body tissues. It usually occurs in the feet, ankles, and legs, but can affect the entire body. |
| V18 | Extravasation | Leakage of blood, lymph, or other fluid from a blood vessel or tube into surrounding tissue. |
| V19 | Bleeding | Bleeding or hemorrhage is the loss of blood, at first uncontrollable. It can be external or inside the body. |
| V20 | Shock | A life-threatening condition that occurs when the body is not receiving sufficient blood flow. Lack of blood flow means that cells and organs do not receive enough oxygen and nutrients to function properly. |
| V21 | Organ failure | Severe failure, reversible or not, of more than one vital organ system. |
| V22 | Dengue severity | Dengue severity. |
| P | V1 | V2 | V3 | V4 | V5 | V6 | V7 | V8 | V9 | V10 | V11 | V12 | V13 | V14 | V15 | V16 | V17 | V18 | V19 | V20 | V21 | V22 |
|---|---|---|---|---|---|---|---|---|---|---|---|---|---|---|---|---|---|---|---|---|---|---|
| 1 | 1 | 1 | 1 | 0 | 1 | 1 | 1 | 0 | 0 | 0 | 0 | 0 | 0 | 0 | 0 | 0 | 0 | 0 | 0 | 0 | 0 | 0 |
| 2 | 0 | 1 | 1 | 0 | 1 | 1 | 0 | 1 | 0 | 0 | 0 | 0 | 0 | 0 | 0 | 1 | 0 | 0 | 0 | 0 | 0 | 0 |
| 3 | 0 | 1 | 0 | 0 | 1 | 1 | 0 | 0 | 1 | 0 | 1 | 0 | 0 | 0 | 0 | 1 | 0 | 1 | 0 | 0 | 1 | 0 |
Disclaimer/Publisher’s Note: The statements, opinions and data contained in all publications are solely those of the individual author(s) and contributor(s) and not of MDPI and/or the editor(s). MDPI and/or the editor(s) disclaim responsibility for any injury to people or property resulting from any ideas, methods, instructions or products referred to in the content. |
© 2024 by the authors. Licensee MDPI, Basel, Switzerland. This article is an open access article distributed under the terms and conditions of the Creative Commons Attribution (CC BY) license (https://creativecommons.org/licenses/by/4.0/).
Share and Cite
Hoyos, W.; Hoyos, K.; Ruíz, R. Using Computational Simulations Based on Fuzzy Cognitive Maps to Detect Dengue Complications. Diagnostics 2024, 14, 533. https://doi.org/10.3390/diagnostics14050533
Hoyos W, Hoyos K, Ruíz R. Using Computational Simulations Based on Fuzzy Cognitive Maps to Detect Dengue Complications. Diagnostics. 2024; 14(5):533. https://doi.org/10.3390/diagnostics14050533
Chicago/Turabian StyleHoyos, William, Kenia Hoyos, and Rander Ruíz. 2024. "Using Computational Simulations Based on Fuzzy Cognitive Maps to Detect Dengue Complications" Diagnostics 14, no. 5: 533. https://doi.org/10.3390/diagnostics14050533