

Detection of Severe Lung Infection on Chest Radiographs of COVID-19 Patients: Robustness of AI Models across Multi-Institutional Data
 and
and
Abstract
:1. Introduction
- (1)
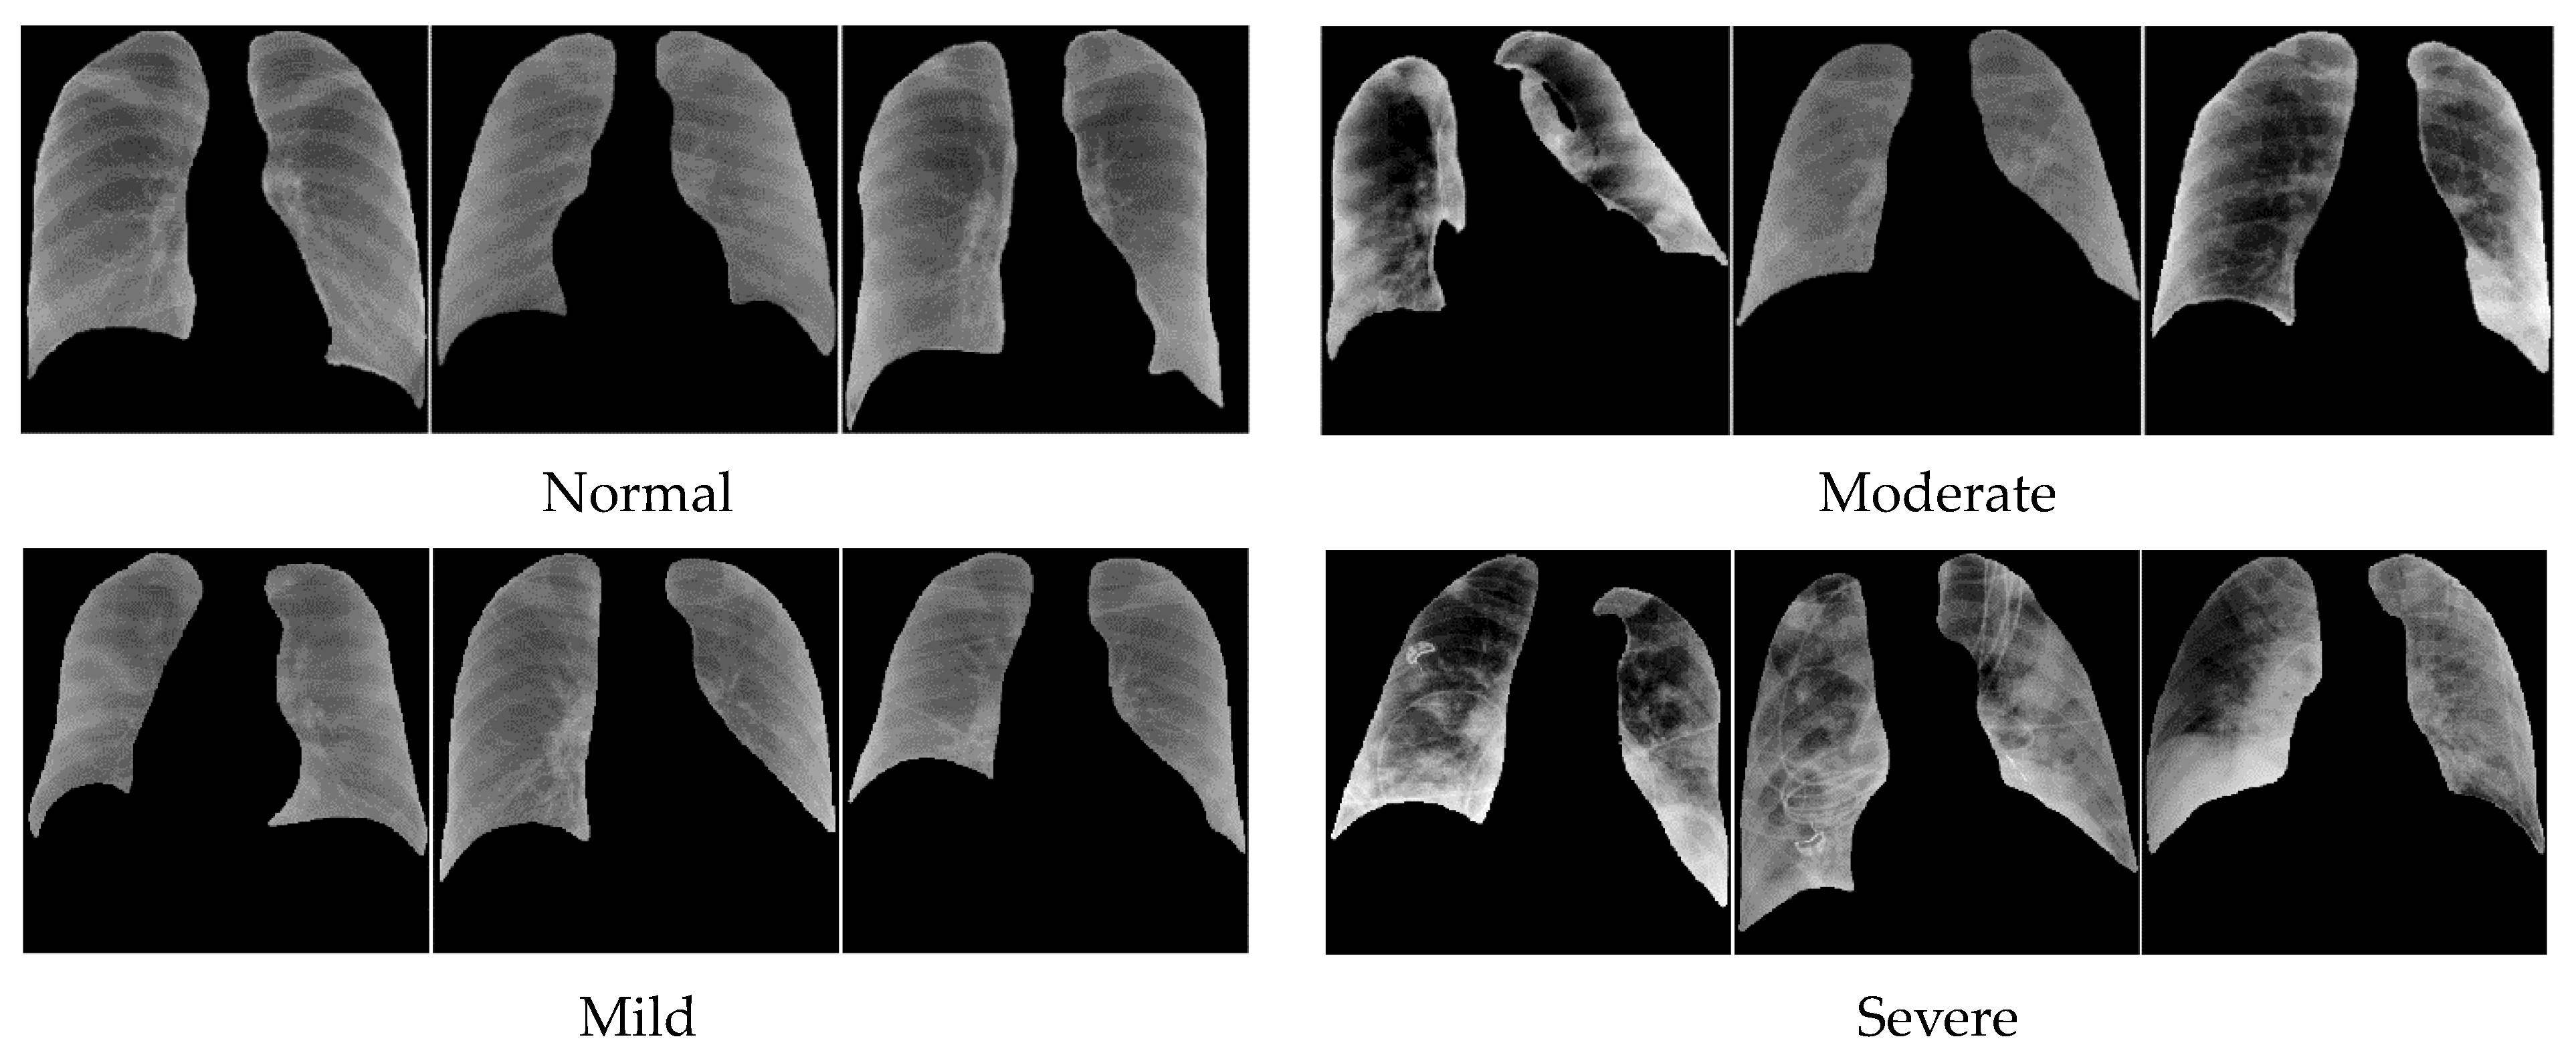
- Tackling a challenging task of classifying severe from non-severe lung infection in COVID patients using a dataset of CXR images containing various degrees of severity (normal, mild, moderate, and severe) infection.
- (2)
- Studying the reproducibility of the performances of the deep learning models trained with data sets of limited sizes and from multi-institutional sources.
- (3)
- Evaluating the generalizability of the trained deep learning models by using both independent internal and external test sets.
2. Materials and Methods
2.1. Datasets
- Negative: negative for pneumonia, no lung opacities.
- Mild: Required if not negative for pneumonia. Opacities in 1–2 lung zones.
- Moderate: Required if not negative for pneumonia. Opacities in 3–4 lung zones.
- Severe: Required if not negative for pneumonia. Opacities in >4 lung zones.
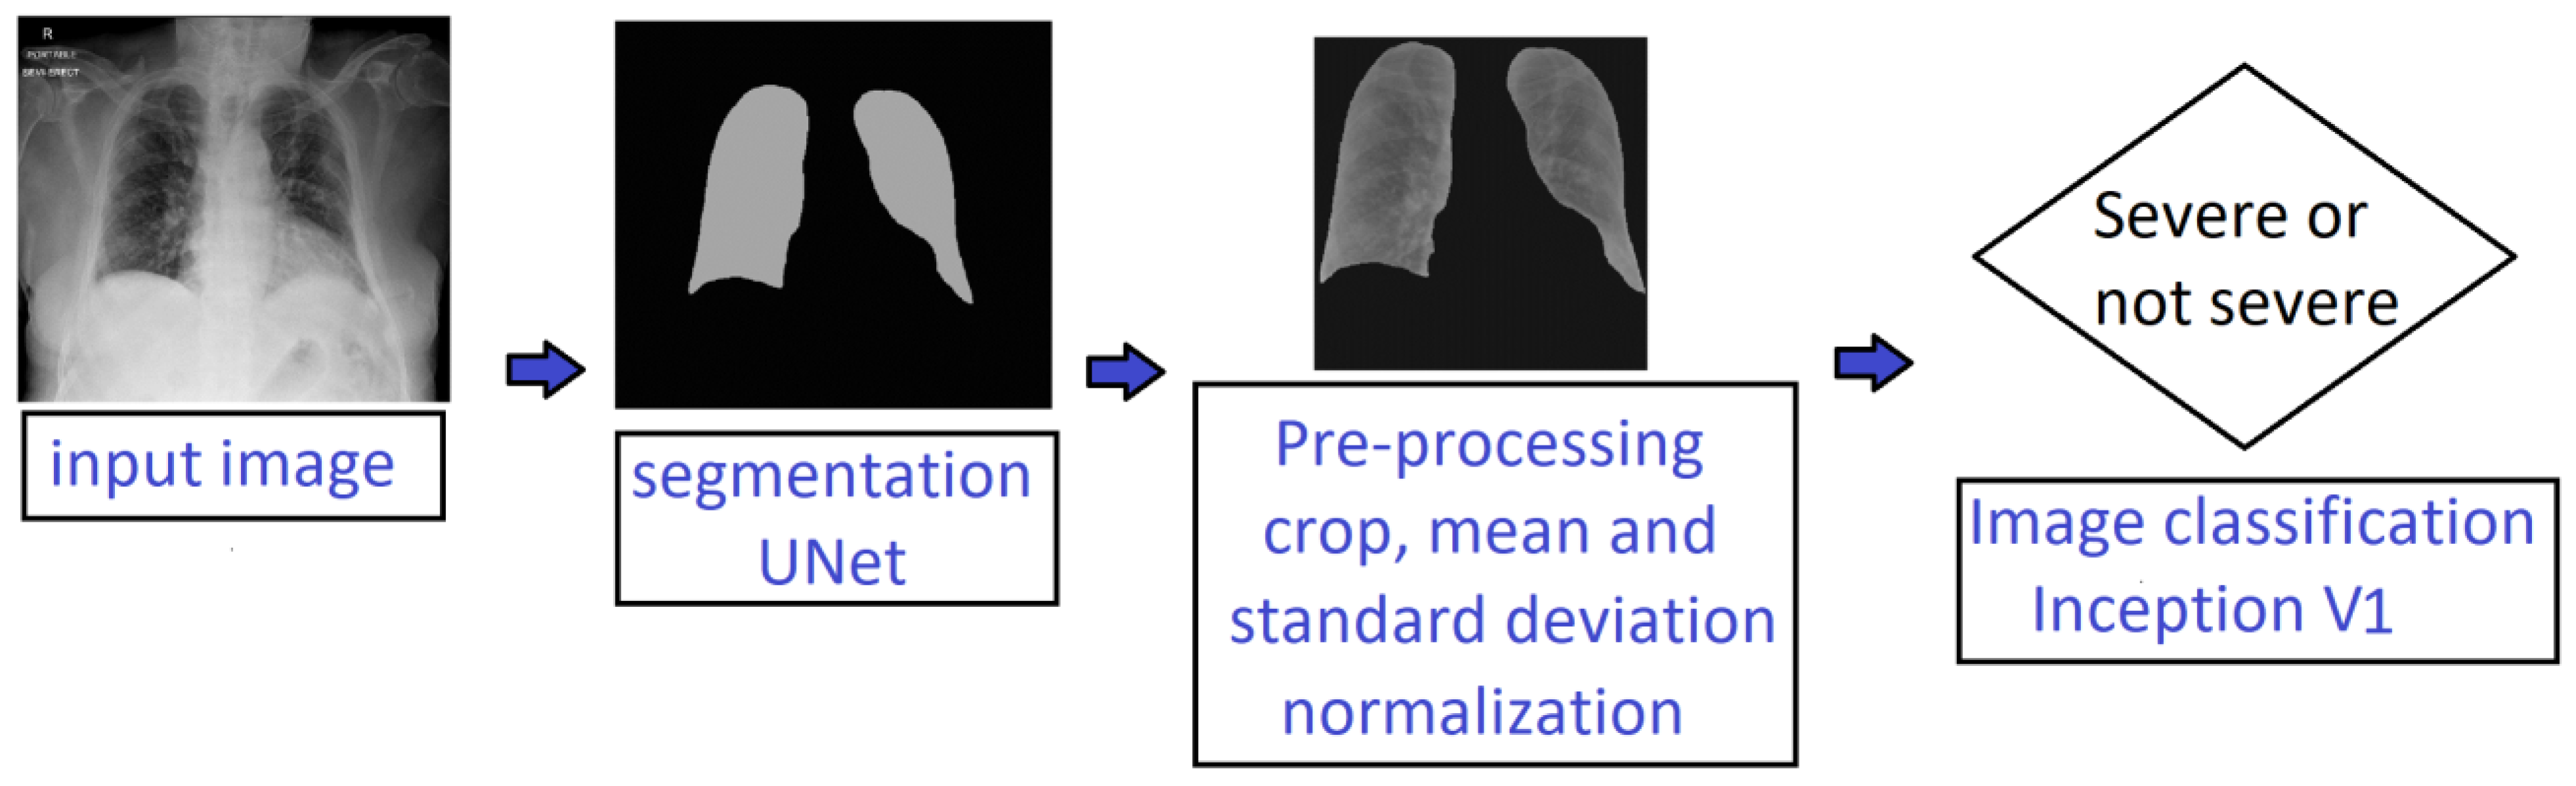
2.2. Deep-Learning-Based Processing Pipeline
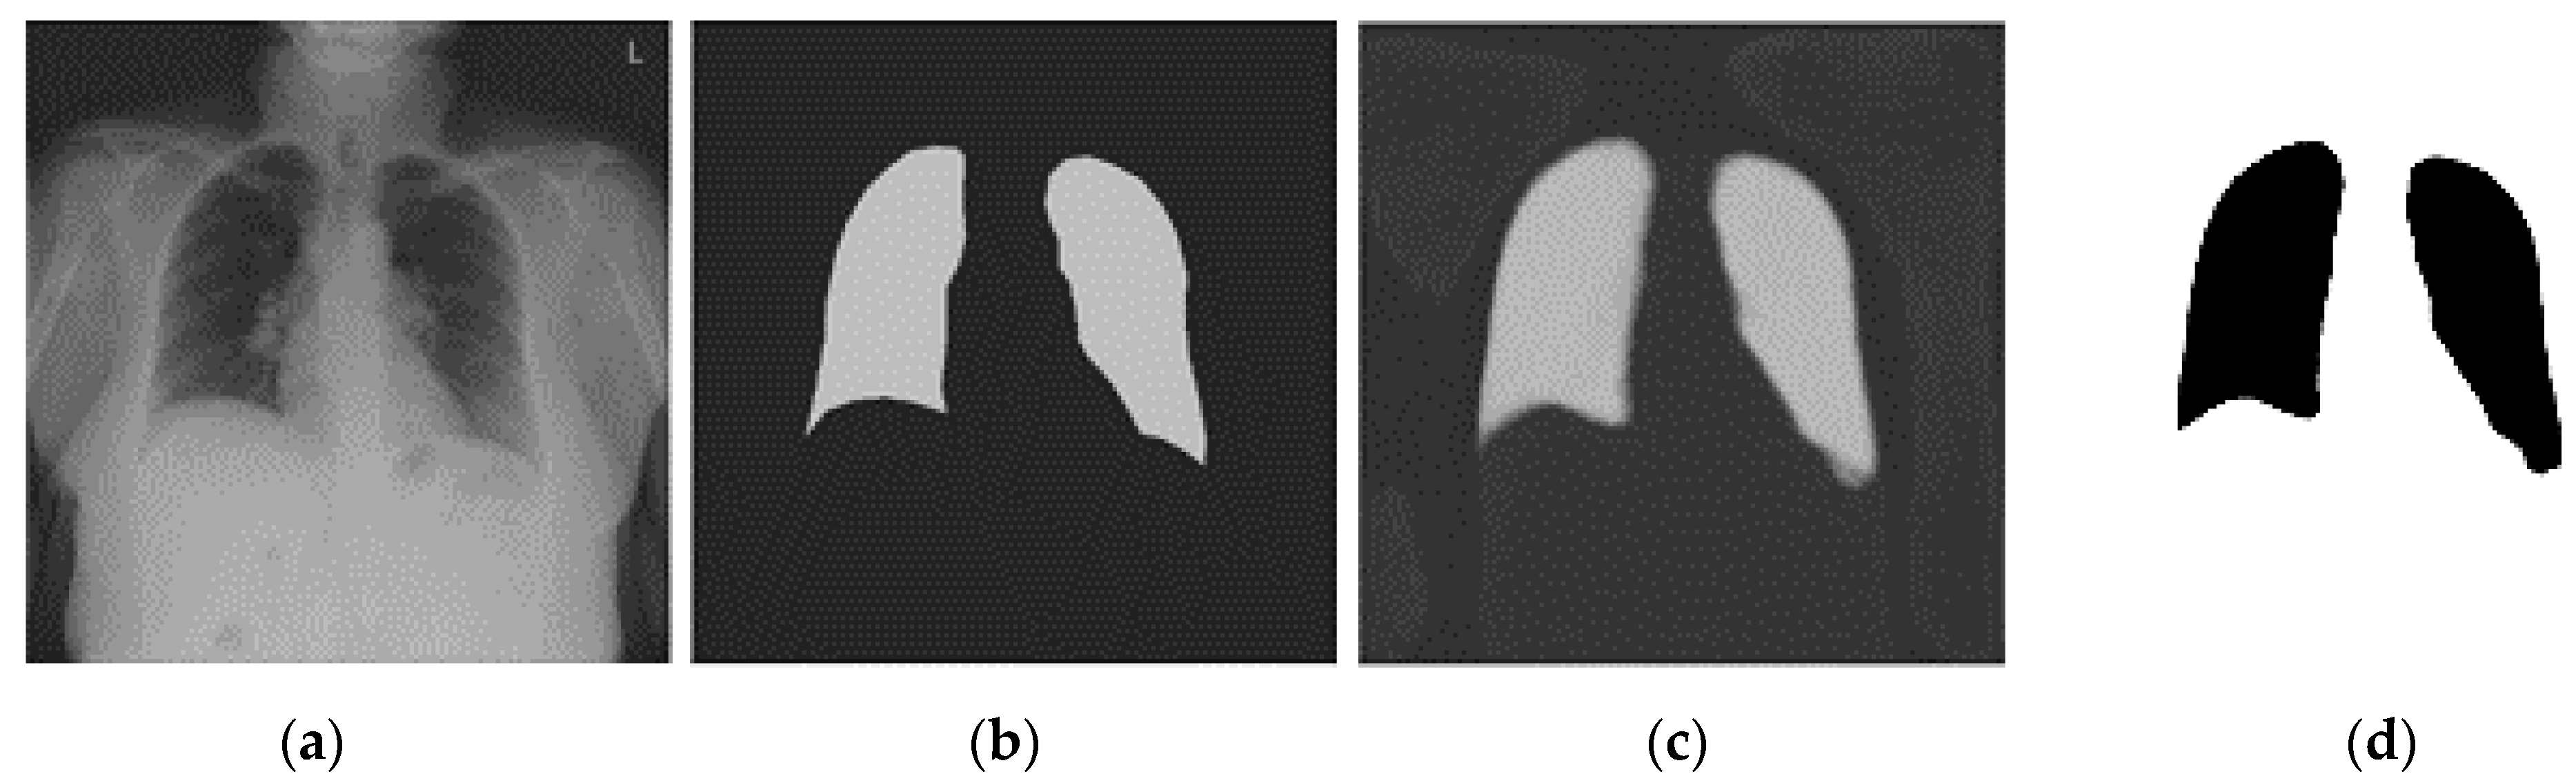
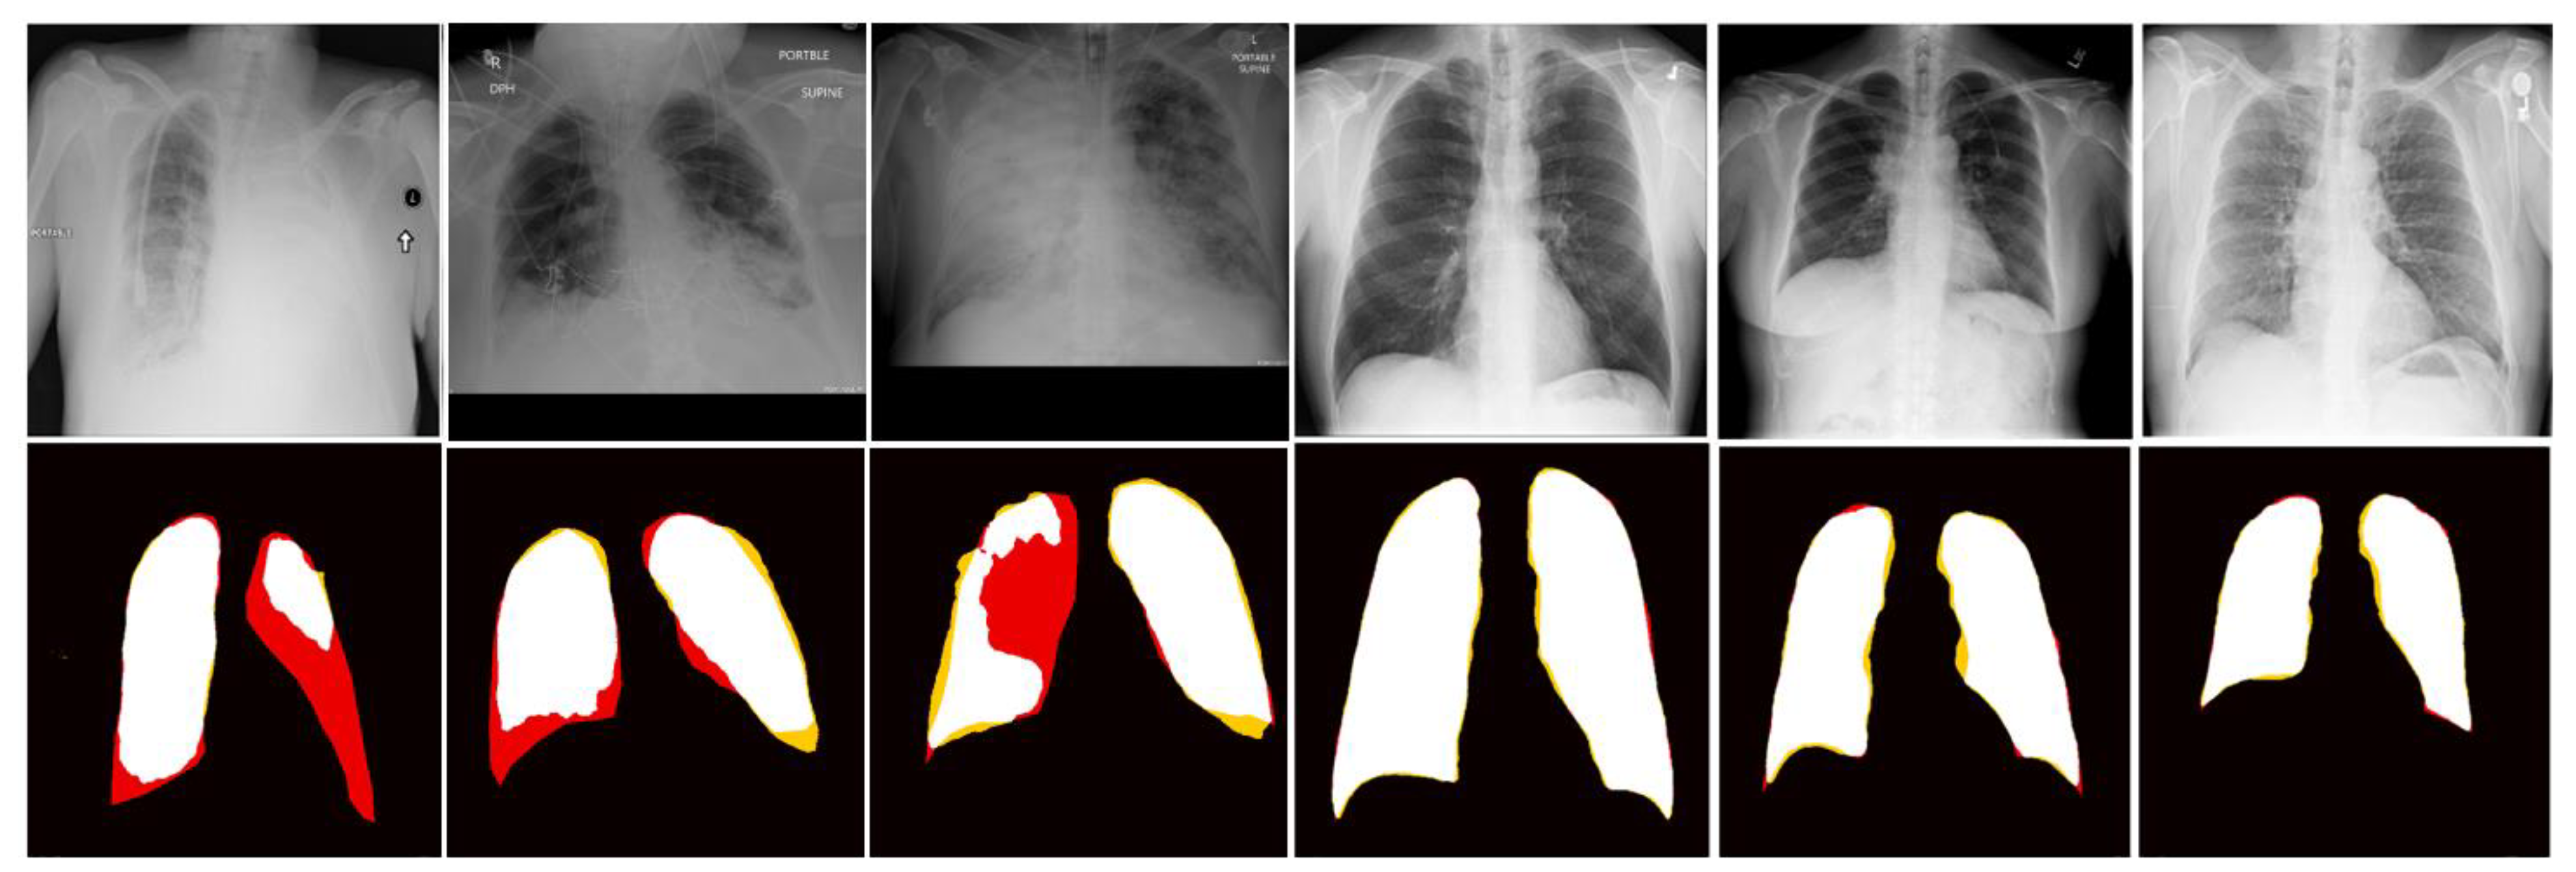
2.2.1. Lung Segmentation
2.2.2. Severity Classification
- Model M: Trained only with the MIDRC training set.
- Model MB: Trained with the combined MIDRC + BrixIA training set.
- Model MBC: Trained with the combined MIDRC + BrixIA + COVIDGR training set.
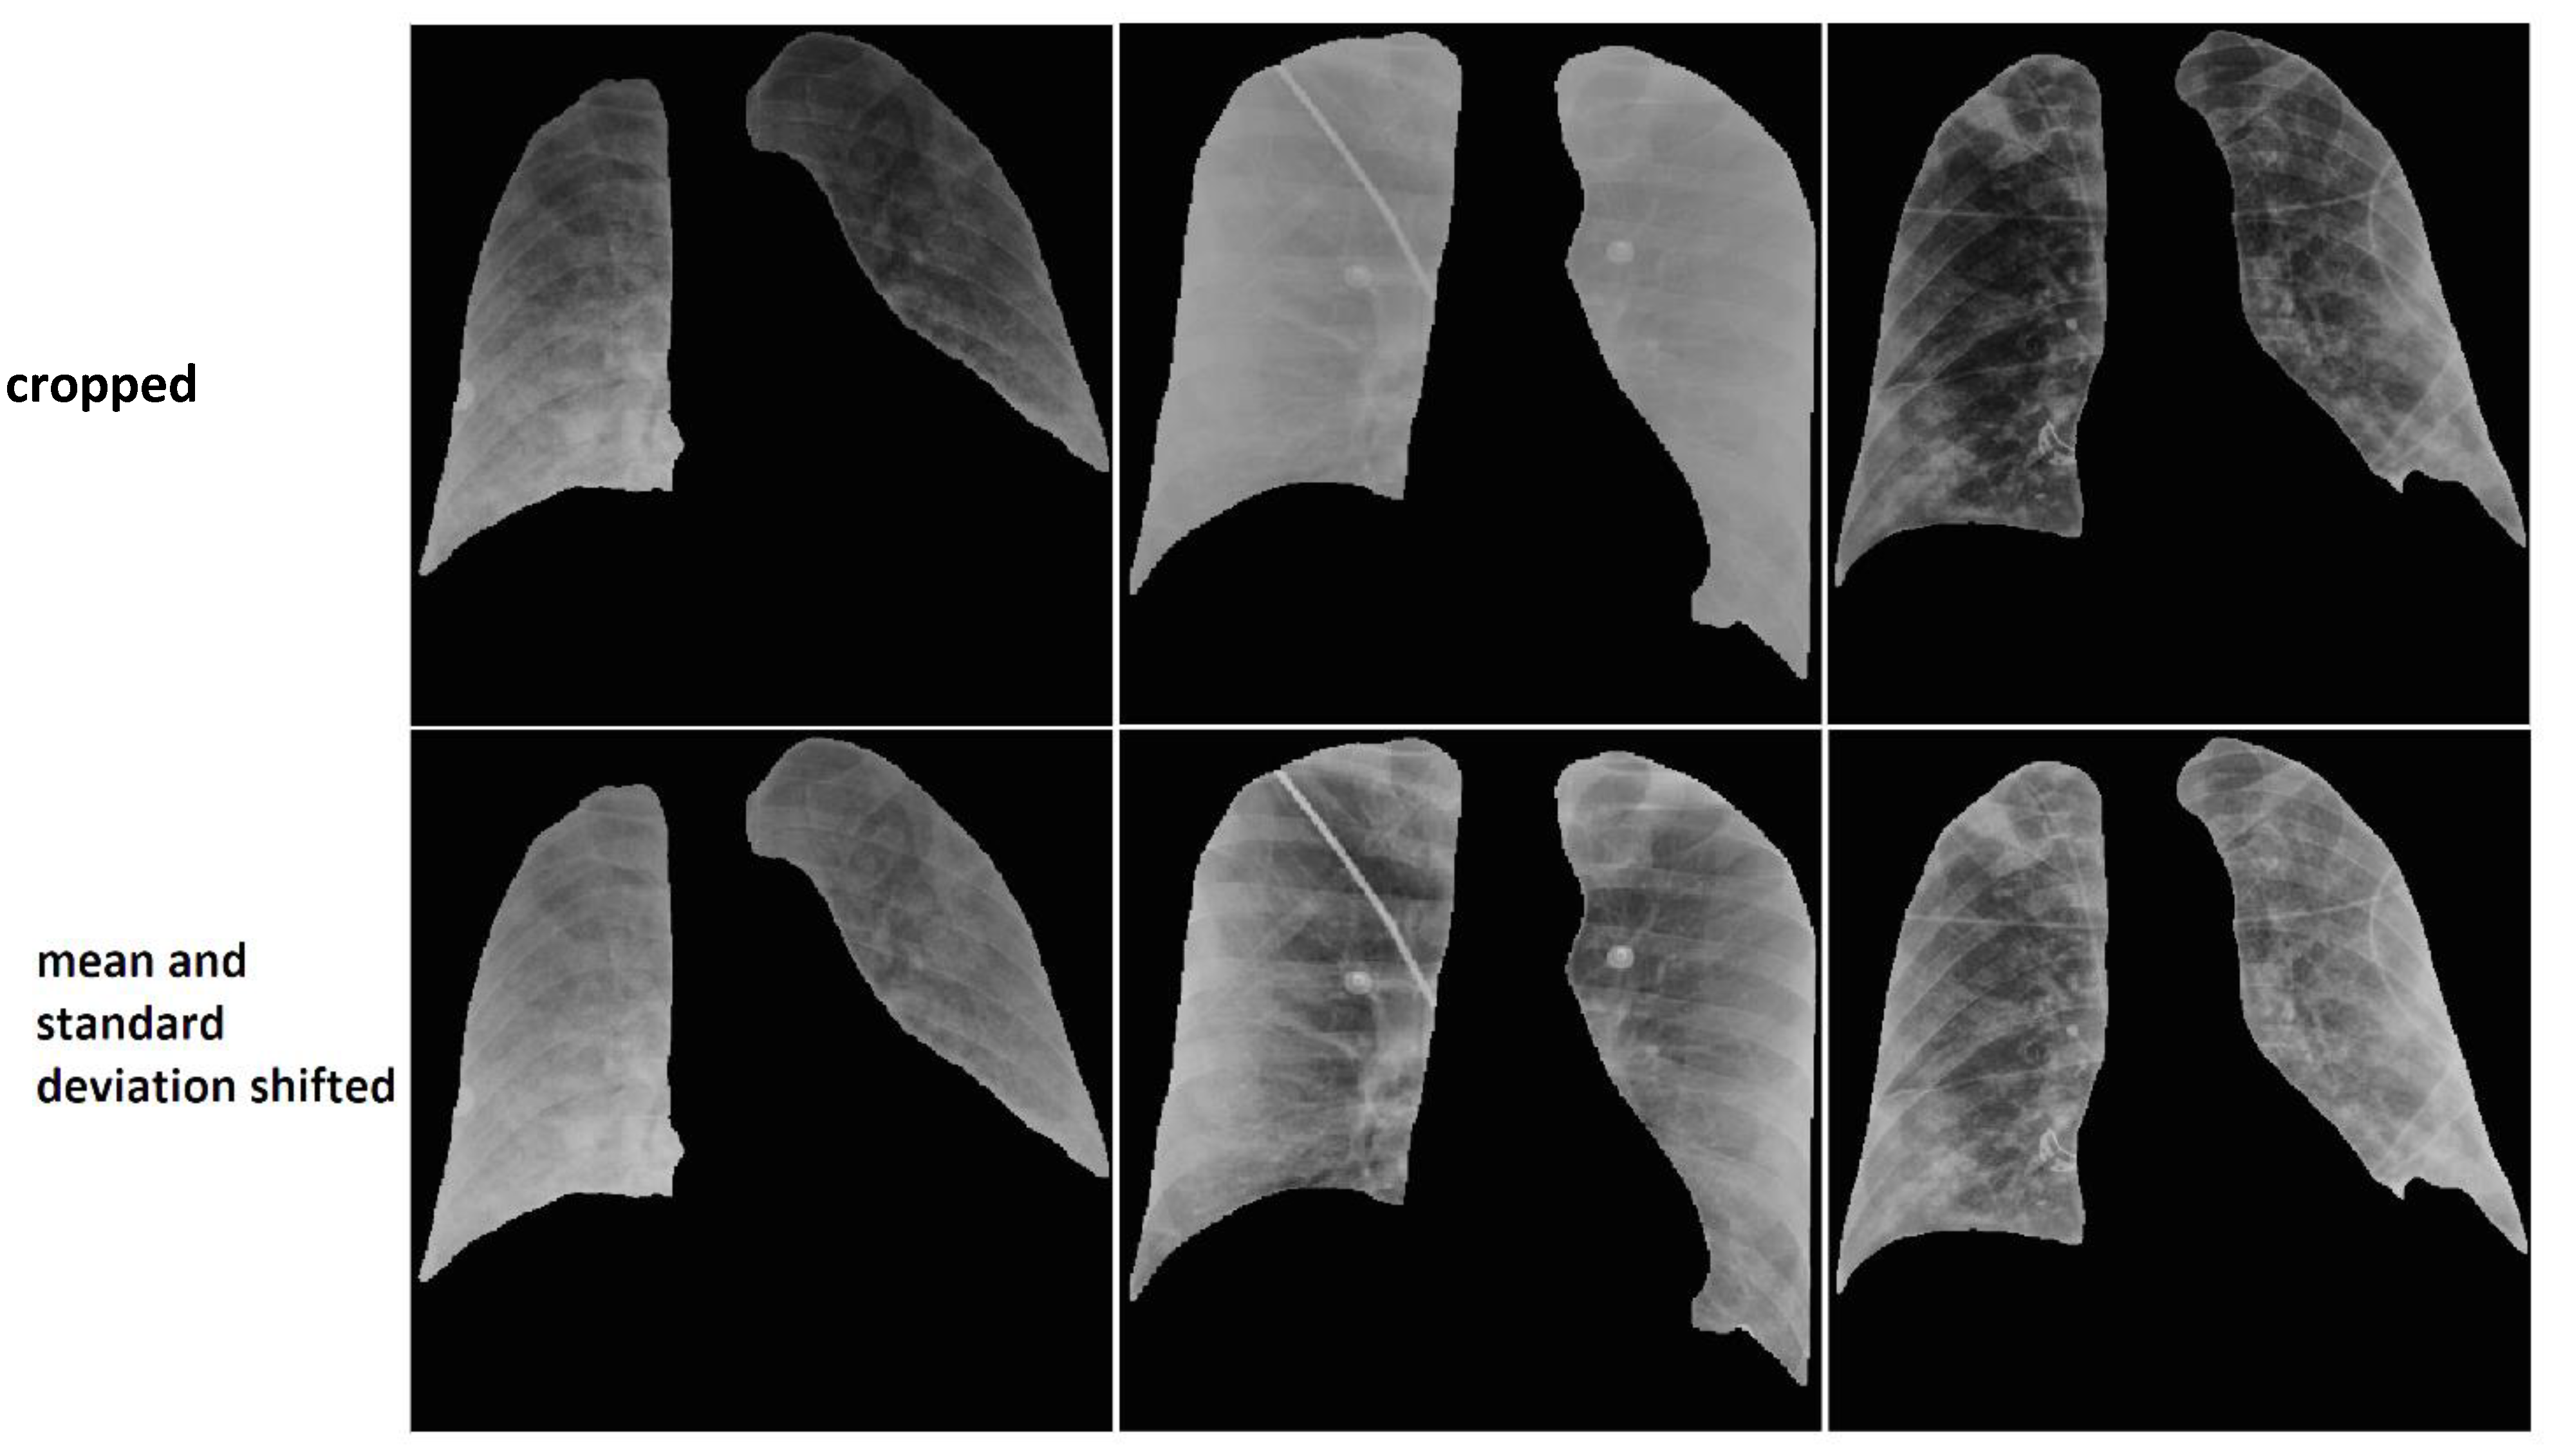
2.2.2.1. Data Harmonization
2.2.2.2. Data Augmentation
3. Results
3.1. Lung Segmentation
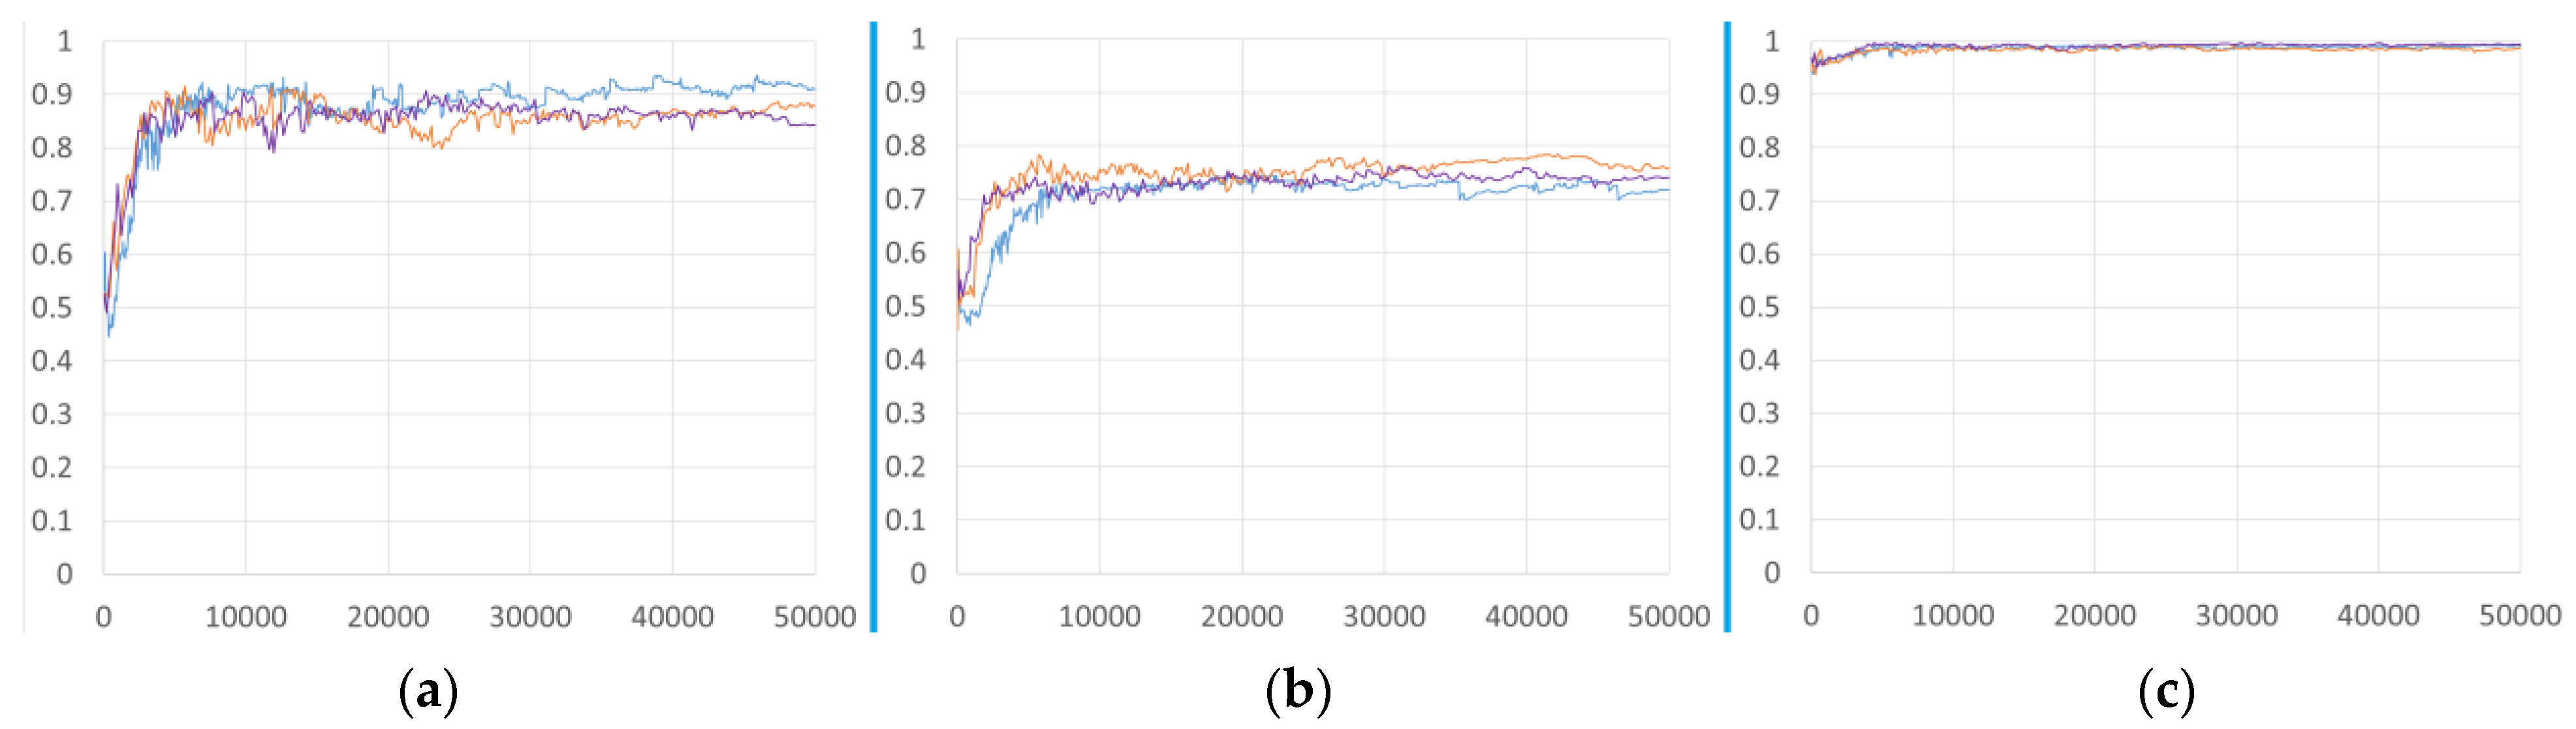
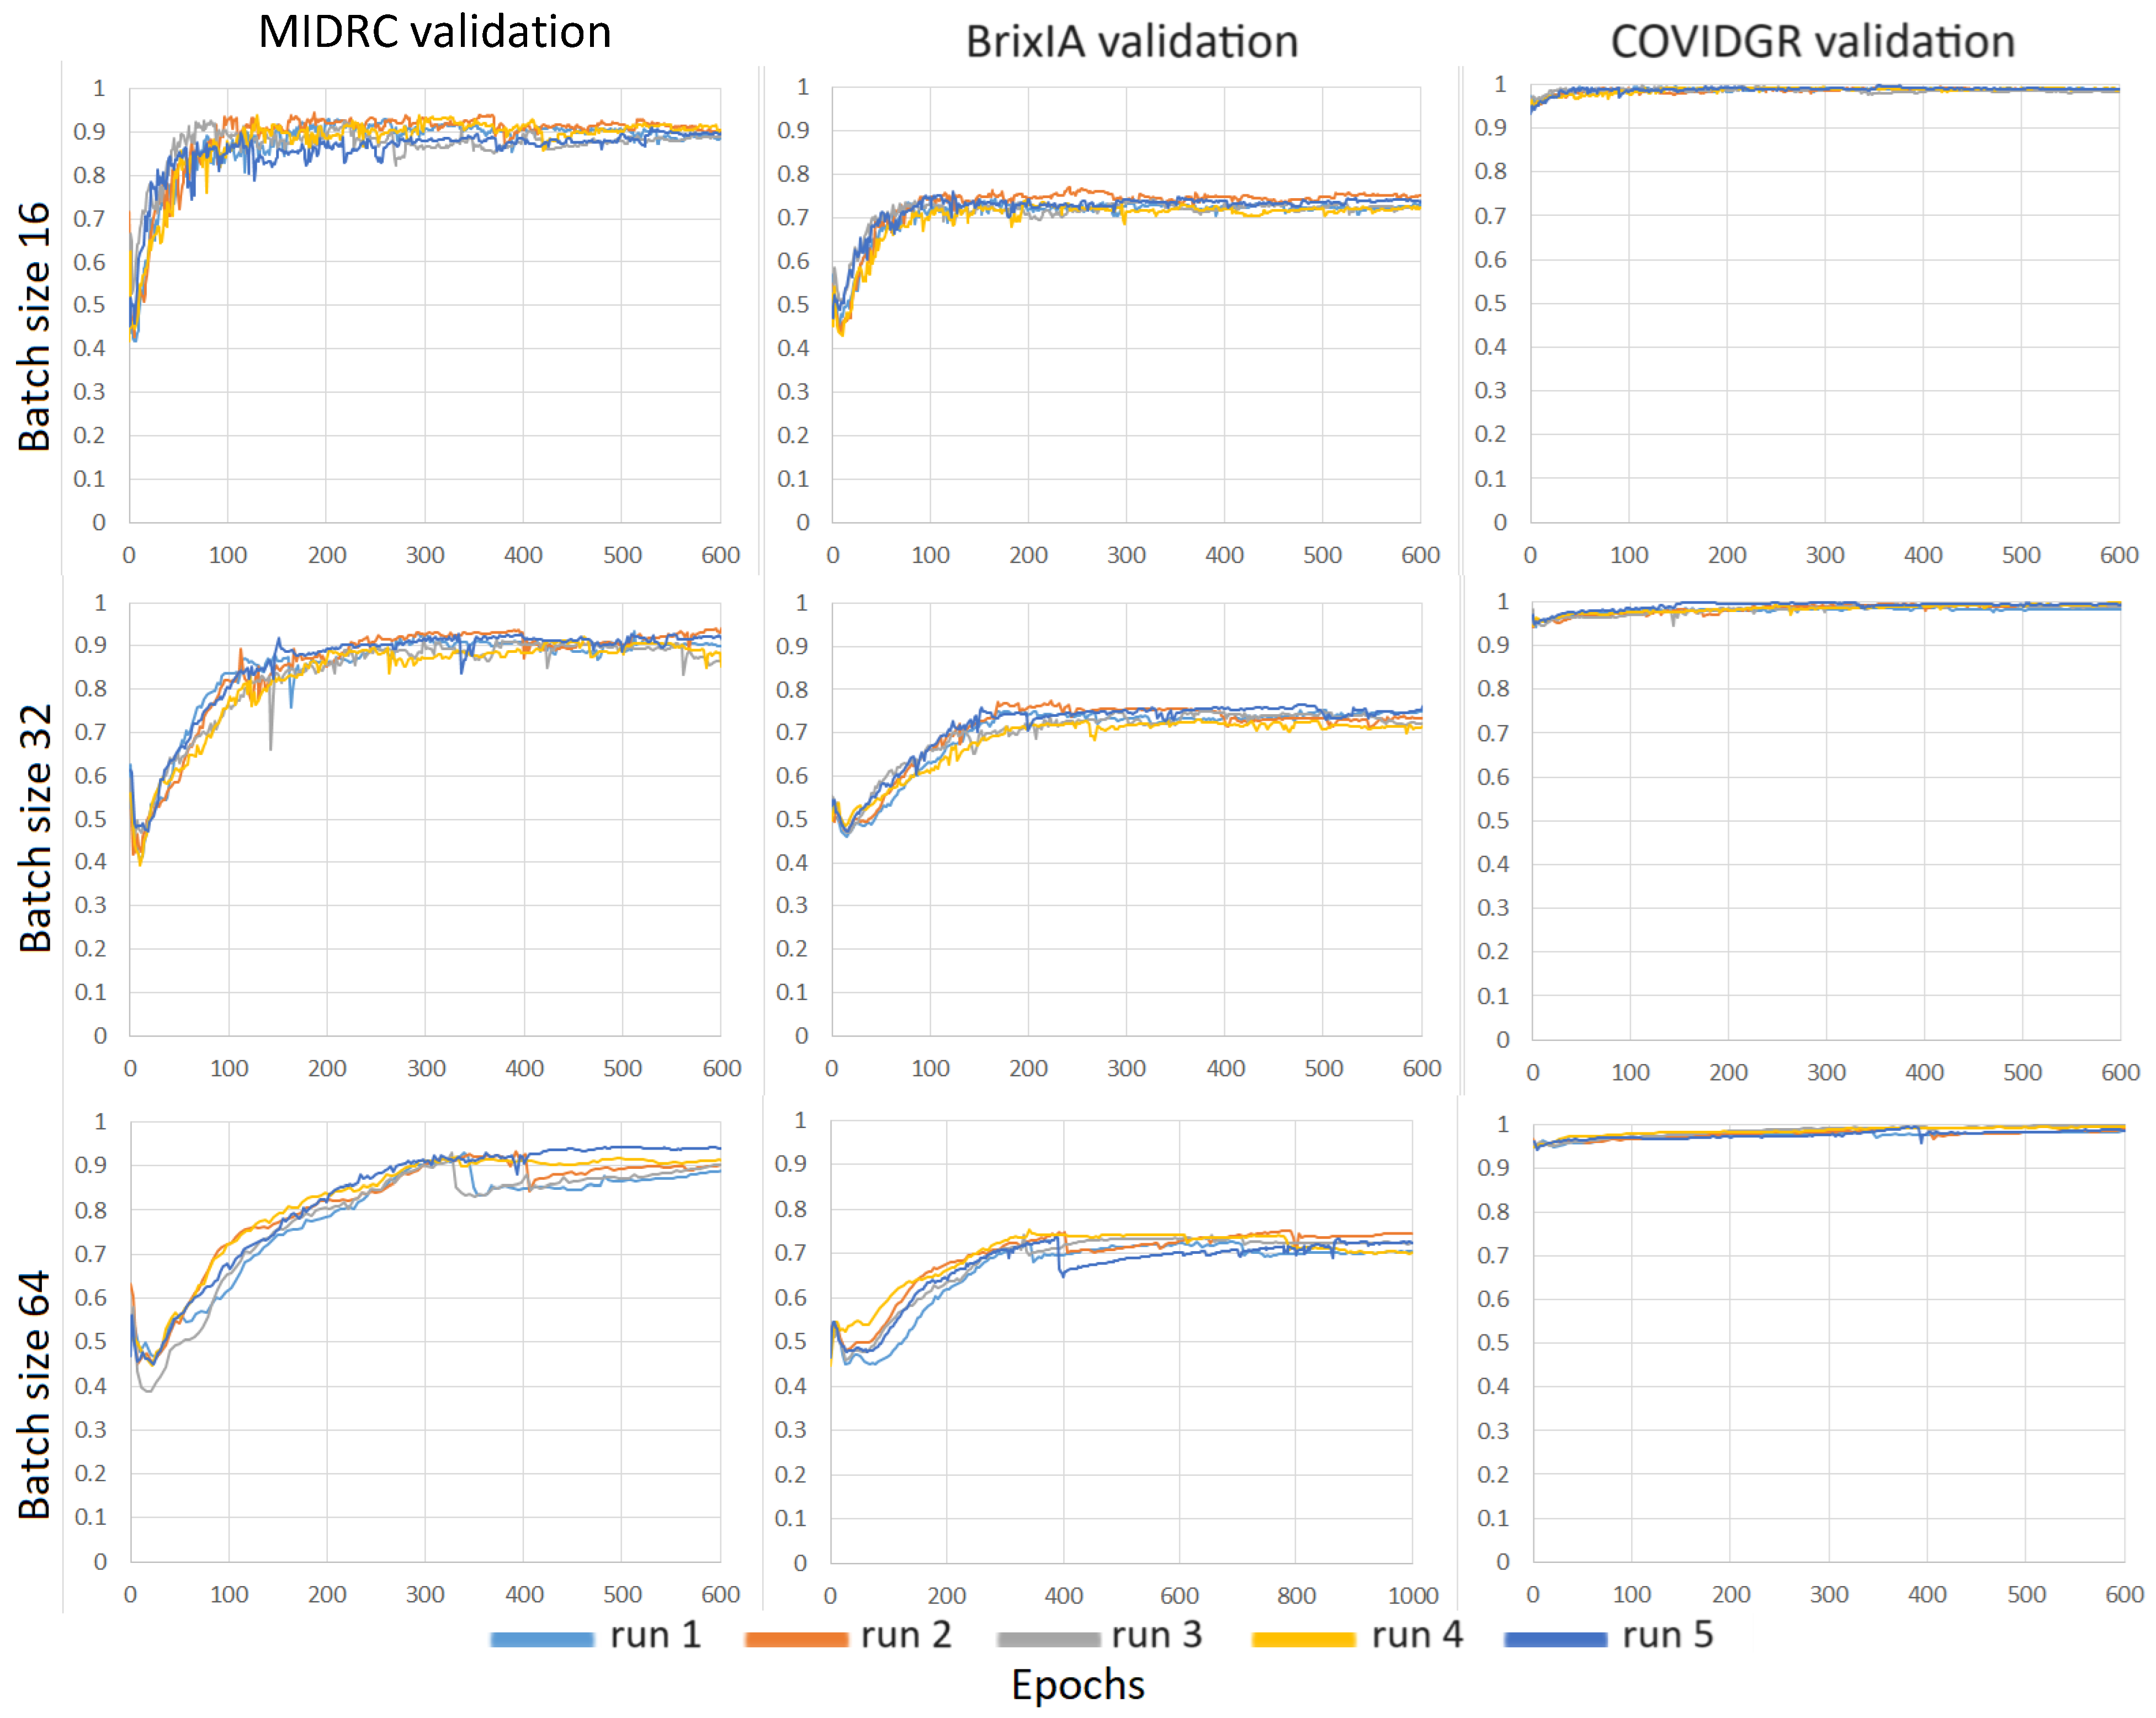
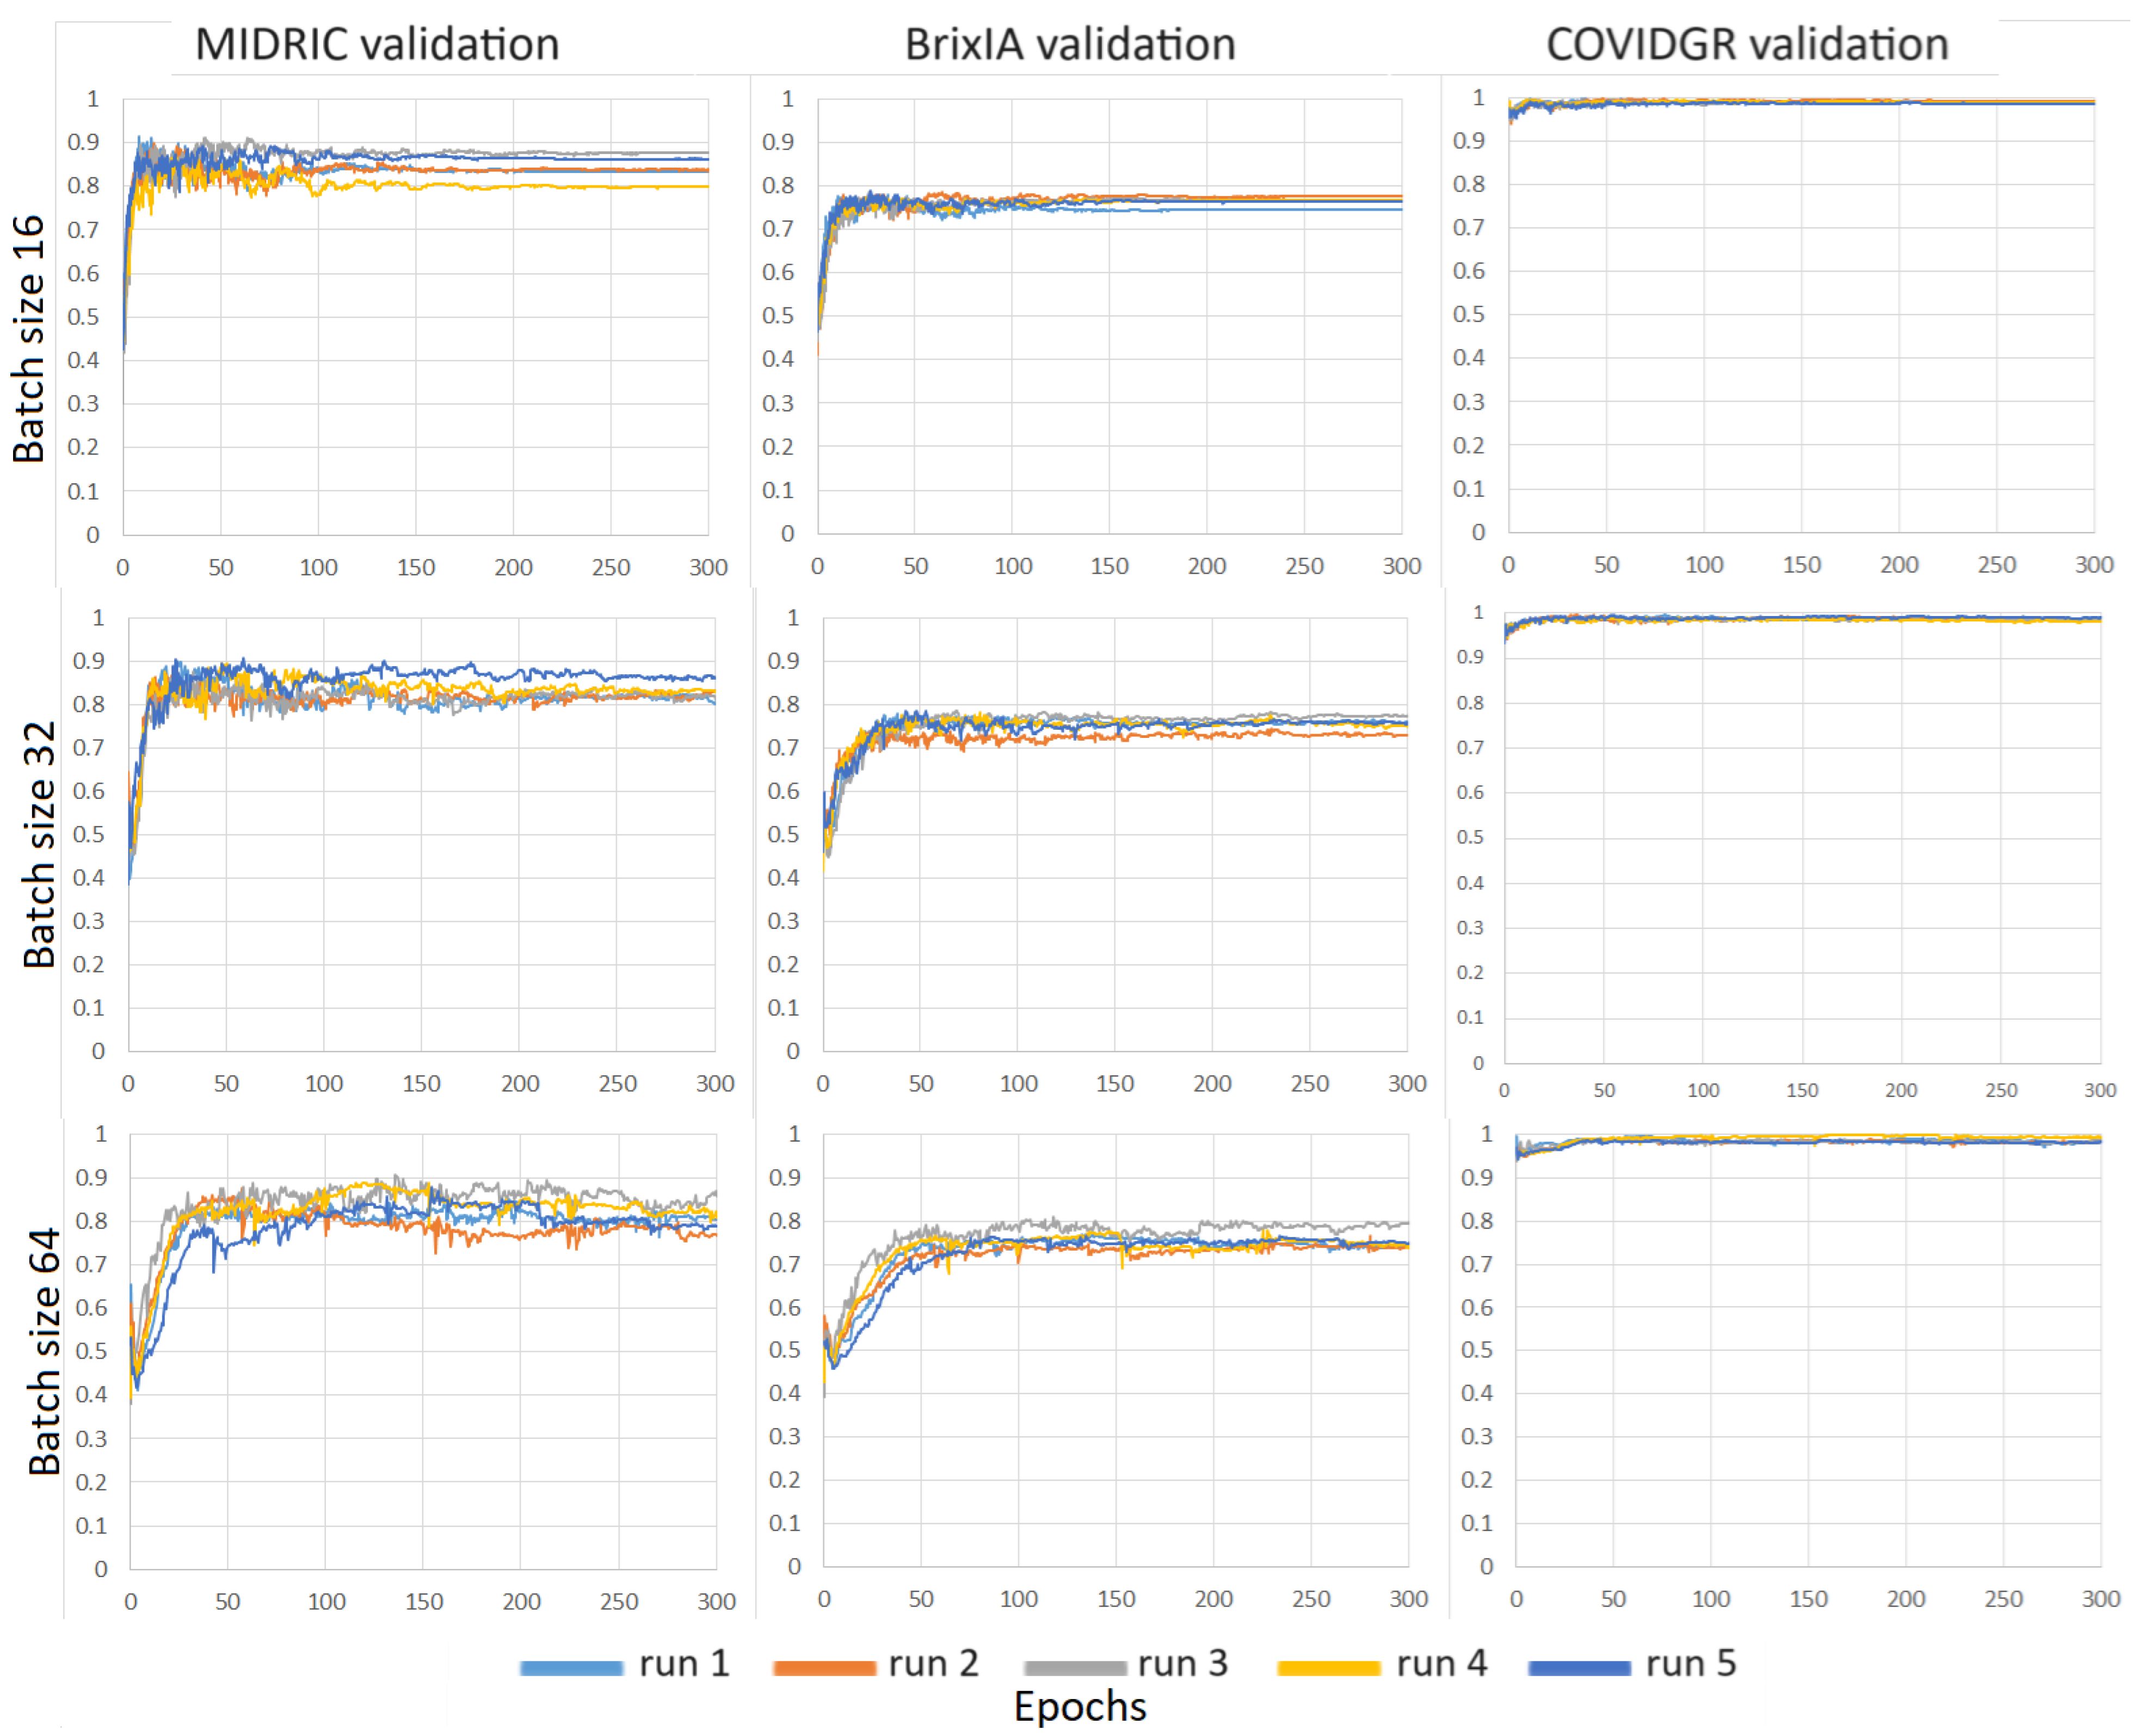
3.2. Severity Assessment
3.3. Severity Classification
4. Discussion
5. Conclusions
Author Contributions
Funding
Institutional Review Board Statement
Informed Consent Statement
Data Availability Statement
Conflicts of Interest
Appendix A

| Batch Size | Models | MIDRC | BrixIA | COVIDGR | UMICH |
|---|---|---|---|---|---|
| Accuracy | |||||
| 16 | M | 0.76 ± 0.01 | 0.74 ± 0.01 | 0.74 ± 0.04 | 0.73 ± 0.01 |
| MB | 0.77 ± 0.01 | 0.77 ± 0.02 | 0.72 ± 0.03 | 0.75 ± 0.02 | |
| MBC | 0.77 ± 0.02 | 0.77 ± 0.01 | 0.76 ± 0.06 | 0.73 ± 0.02 | |
| 32 | M | 0.75 ± 0.02 | 0.75 ± 0.02 | 0.71 ± 0.05 | 0.73 ± 0.01 |
| MB | 0.75 ± 0.03 | 0.77 ± 0.02 | 0.76 ± 0.06 | 0.75 ± 0.02 | |
| MBC | 0.78 ± 0.01 | 0.78 ± 0.01 | 0.76 ± 0.04 | 0.75 ± 0.02 | |
| 64 | M | 0.74 ± 0.04 | 0.73 ± 0.03 | 0.66 ± 0.07 | 0.68 ± 0.04 |
| MB | 0.77 ± 0.03 | 0.78 ± 0.02 | 0.76 ± 0.10 | 0.74 ± 0.02 | |
| MBC | 0.75 ± 0.03 | 0.75 ± 0.01 | 0.74 ± 0.03 | 0.73 ± 0.02 | |
| Batch Size | Models | MIDRC | BrixIA | COVIDGR | UMICH |
|---|---|---|---|---|---|
| Accuracy | |||||
| 16 | M | 0.77 ± 0.05 | 0.75 ± 0.08 | 0.82 ± 0.05 | 0.77 ± 0.06 |
| MB | 0.80 ± 0.01 | 0.81 ± 0.02 | 0.74 ± 0.05 | 0.84 ± 0.01 | |
| MBC | 0.80 ± 0.02 | 0.79 ± 0.02 | 0.81 ± 0.05 | 0.83 ± 0.02 | |
| 32 | M | 0.77 ± 0.03 | 0.78 ± 0.02 | 0.71 ± 0.07 | 0.80 ± 0.02 |
| MB | 0.81 ± 0.02 | 0.79 ± 0.02 | 0.71 ± 0.02 | 0.83 ± 0.01 | |
| MBC | 0.80 ± 0.01 | 0.79 ± 0.01 | 0.80 ± 0.07 | 0.83 ± 0.03 | |
| Batch Size | Models | Performance Metric | MIDRC | BrixIA | COVIDGR | UMICH |
|---|---|---|---|---|---|---|
| 16 | M | Sensitivity | 0.75 ± 0.06 | 0.77 ± 0.02 | 0.77 ± 0.04 | 0.77 ± 0.05 |
| Specificity | 0.77 ± 0.05 | 0.73 ± 0.02 | 0.74 ± 0.04 | 0.72 ± 0.03 | ||
| MB | Sensitivity | 0.77 ± 0.04 | 0.76 ± 0.04 | 0.75 ± 0.11 | 0.71 ± 0.02 | |
| Specificity | 0.78 ± 0.04 | 0.77 ± 0.03 | 0.71 ± 0.06 | 0.77 ± 0.02 | ||
| MBC | Sensitivity | 0.78 ± 0.03 | 0.79 ± 0.01 | 0.76 ± 0.09 | 0.77 ± 0.03 | |
| Specificity | 0.76 ± 0.05 | 0.77 ± 0.01 | 0.76 ± 0.08 | 0.71 ± 0.03 | ||
| 32 | M | Sensitivity | 0.78 ± 0.03 | 0.75 ± 0.05 | 0.68 ± 0.06 | 0.71 ± 0.05 |
| Specificity | 0.73 ± 0.03 | 0.75 ± 0.04 | 0.72 ± 0.07 | 0.73 ± 0.02 | ||
| MB | Sensitivity | 0.76 ± 0.06 | 0.76 ± 0.04 | 0.69 ± 0.12 | 0.71 ± 0.02 | |
| Specificity | 0.74 ± 0.08 | 0.78 ± 0.04 | 0.78 ± 0.09 | 0.77 ± 0.02 | ||
| MBC | Sensitivity | 0.79 ± 0.04 | 0.76 ± 0.02 | 0.84 ± 0.04 | 0.73 ± 0.05 | |
| Specificity | 0.77 ± 0.03 | 0.78 ± 0.02 | 0.74 ± 0.06 | 0.76 ± 0.05 | ||
| 64 | M | Sensitivity | 0.75 ± 0.04 | 0.66 ± 0.05 | 0.67 ± 0.11 | 0.66 ± 0.08 |
| Specificity | 0.73 ± 0.04 | 0.75 ± 0.05 | 0.66 ± 0.07 | 0.69 ± 0.06 | ||
| MB | Sensitivity | 0.78 ± 0.03 | 0.75 ± 0.04 | 0.67 ± 0.11 | 0.69 ± 0.05 | |
| Specificity | 0.77 ± 0.04 | 0.79 ± 0.03 | 0.79 ± 0.15 | 0.77 ± 0.03 | ||
| MBC | Sensitivity | 0.77 ± 0.03 | 0.78 ± 0.02 | 0.69 ± 0.08 | 0.69 ± 0.02 | |
| Specificity | 0.74 ± 0.06 | 0.74 ± 0.02 | 0.76 ± 0.04 | 0.75 ± 0.02 |
| Batch Size | Models | Performance Metric | MIDRC | BrixIA | COVIDGR | UMICH |
|---|---|---|---|---|---|---|
| 16 | M | Sensitivity | 0.75 ± 0.11 | 0.71 ± 0.15 | 0.80 ± 0.16 | 0.77 ± 0.12 |
| Specificity | 0.79 ± 0.04 | 0.76 ± 0.06 | 0.82 ± 0.04 | 0.77 ± 0.04 | ||
| MB | Sensitivity | 0.82 ± 0.04 | 0.78 ± 0.03 | 0.72 ± 0.09 | 0.82 ± 0.04 | |
| Specificity | 0.78 ± 0.04 | 0.81 ± 0.03 | 0.75 ± 0.07 | 0.85 ± 0.03 | ||
| MBC | Sensitivity | 0.82 ± 0.05 | 0.78 ± 0.01 | 0.79 ± 0.03 | 0.81 ± 0.05 | |
| Specificity | 0.79 ± 0.04 | 0.79 ± 0.02 | 0.82 ± 0.06 | 0.84 ± 0.03 | ||
| 32 | M | Sensitivity | 0.77 ± 0.04 | 0.78 ± 0.04 | 0.69 ± 0.08 | 0.84 ± 0.02 |
| Specificity | 0.77 ± 0.05 | 0.78 ± 0.04 | 0.71 ± 0.08 | 0.78 ± 0.02 | ||
| MB | Sensitivity | 0.81 ± 0.02 | 0.79 ± 0.02 | 0.75 ± 0.06 | 0.84 ± 0.05 | |
| Specificity | 0.80 ± 0.03 | 0.79 ± 0.03 | 0.70 ± 0.03 | 0.83 ± 0.03 | ||
| MBC | Sensitivity | 0.78 ± 0.04 | 0.81 ± 0.03 | 0.85 ± 0.09 | 0.83 ± 0.03 | |
| Specificity | 0.81 ± 0.03 | 0.79 ± 0.02 | 0.79 ± 0.10 | 0.83 ± 0.05 |
References
- Laino, M.E.; Ammirabile, A.; Posa, A.; Cancian, P.; Shalaby, S.; Savevski, V.; Neri, E. The Applications of Artificial Intelligence in Chest Imaging of COVID-19 Patients: A Literature Review. Diagnostics 2021, 11, 1317. [Google Scholar] [CrossRef] [PubMed]
- Nair, A.; Procter, A.; Halligan, S.; Parry, T.; Ahmed, A.; Duncan, M.; Taylor, M.; Chouhan, M.; Gaunt, T.; Roberts, J.; et al. Chest radiograph classification and severity of suspected COVID-19 by different radiologist groups and attending clinicians: Multi-reader, multi-case study. Eur. Radiol. 2023, 33, 2096–2104. [Google Scholar] [CrossRef] [PubMed]
- Way, T.; Chan, H.-P.; Hadjiiski, L.; Sahiner, B.; Chughtai, A.; Song, T.K.; Poopat, C.; Stojanovska, J.; Frank, L.; Attili, A.; et al. Computer-aided diagnosis of lung nodules on CT scans: ROC study of its effect on radiologists’ performance. Acad. Radiol. 2010, 17, 323–332. [Google Scholar] [CrossRef] [PubMed]
- Sun, D.; Hadjiiski, L.; Alva, A.; Zakharia, Y.; Joshi, M.; Chan, H.P.; Garje, R.; Pomerantz, L.; Elhag, D.; Cohan, R.H.; et al. Computerized Decision Support for Bladder Cancer Treatment Response Assessment in CT Urography: Effect on Diagnostic Accuracy in Multi-Institution Multi-Specialty Study. Tomography 2022, 8, 644–656. [Google Scholar] [CrossRef]
- Hadjiiski, L.M.; Chan, H.-P.; Sahiner, B.; Helvie, M.A.; Roubidoux, M.; Blane, C.; Paramagul, C.; Petrick, N.; Bailey, J.; Klein, K.; et al. Improvement of Radiologists’ Characterization of Malignant and Benign Breast Masses in Serial Mammograms by Computer-Aided Diagnosis: An ROC Study. Radiology 2004, 233, 255–265. [Google Scholar] [CrossRef]
- Litmanovich, D.E.; Chung, M.; Kirkbride, R.R.; Kicska, G.; Kanne, J.P. Review of Chest Radiograph Findings of COVID-19 Pneumonia and Suggested Reporting Language. J. Thorac. Imaging 2020, 35, 354–360. [Google Scholar] [CrossRef]
- Tsai, E.; Simpson, S.; Lungren, M.P.; Hershman, M.; Roshkovan, L.; Colak, E.; Erickson, B.J.; Shih, G.; Stein, A.; Kalpathy-Cramer, J.; et al. Data from Medical Imaging Data Resource Center (MIDRC)—RSNA International COVID Radiology Database (RICORD) Release 1c—Chest X-ray, COVID+ (MIDRC-RICORD-1C). The Cancer Imaging Archive. 2021. Available online: https://wiki.cancerimagingarchive.net/pages/viewpage.action?pageId=70230281 (accessed on 1 October 2023).
- Clark, K.; Vendt, B.; Smith, K.; Freymann, J.; Kirby, J.; Koppel, P.; Moore, S.; Phillips, S.; Maffitt, D.; Pringle, M.; et al. The Cancer Imaging Archive (TCIA): Maintaining and Operating a Public Information Repository. J. Digit. Imaging 2013, 26, 1045–1057. [Google Scholar] [CrossRef]
- Feyaerts, D.; Hedou, J.; Gillard, J.; Chen, H.; Tsai, E.S.; Peterson, L.S.; Ando, K.; Manohar, M.; Do, E.; Dhondalay, G.K.R.; et al. Integrated plasma proteomic and single-cell immune signaling network signatures demarcate mild, moderate, and severe COVID-19. Cell Rep. Med. 2022, 3, 100680. [Google Scholar] [CrossRef]
- Danilov, V.V.; Litmanovich, D.; Proutski, A.; Kirpich, A.; Nefaridze, D.; Karpovsky, A.; Gankin, Y. Automatic scoring of COVID-19 severity in X-ray imaging based on a novel deep learning workflow. Sci. Rep. 2022, 12, 12791. [Google Scholar] [CrossRef]
- Frid-Adar, M.; Amer, R.; Gozes, O.; Nassar, J.; Greenspan, H. COVID-19 in CXR: From Detection and Severity Scoring to Patient Disease Monitoring. IEEE J. Biomed. Health Inform. 2021, 25, 1892–1903. [Google Scholar] [CrossRef] [PubMed]
- Namburu, A.; Sumathi, D.; Raut, R.; Jhaveri, R.H.; Dhanaraj, R.K.; Subbulakshmi, N.; Balusamy, B. FPGA-Based Deep Learning Models for Analysing Corona Using Chest X-ray Images. Mob. Inf. Syst. 2022, 2022, 2110785. [Google Scholar] [CrossRef]
- Ren, K.; Hong, G.; Chen, X.; Wang, Z. A COVID-19 medical image classification algorithm based on Transformer. Sci. Rep. 2023, 13, 5359. [Google Scholar] [CrossRef] [PubMed]
- Hadi, M.U.; Qureshi, R.; Ahmed, A.; Iftikhar, N. A lightweight CORONA-NET for COVID-19 detection in X-ray images. Expert Syst. Appl. 2023, 225, 120023. [Google Scholar] [CrossRef] [PubMed]
- Constantinou, M.; Exarchos, T.; Vrahatis, A.G.; Vlamos, P. COVID-19 Classification on Chest X-ray Images Using Deep Learning Methods. Int. J. Environ. Res. Public Health 2023, 20, 2035. [Google Scholar] [CrossRef] [PubMed]
- Ullah, Z.; Usman, M.; Latif, S.; Gwak, J. Densely attention mechanism based network for COVID-19 detection in chest X-rays. Sci. Rep. 2023, 13, 261. [Google Scholar] [CrossRef]
- Samala, R.K.; Hadjiiski, L.; Chan, H.P.; Zhou, C.; Stojanovska, J.; Agarwal, P.; Fung, C. Severity assessment of COVID-19 using imaging descriptors: A deep-learning transfer learning approach from non-COVID-19 pneumonia. In Medical Imaging 2021: Computer-Aided Diagnosis; SPIE: Bellingham, WA, USA, 2021; Volume 11597. [Google Scholar] [CrossRef]
- Park, S.; Kim, G.; Oh, Y.; Seo, J.B.; Lee, S.M.; Kim, J.H.; Moon, S.; Lim, J.-K.; Ye, J.C. Multi-task vision transformer using low-level chest X-ray feature corpus for COVID-19 diagnosis and severity quantification. Med. Image Anal. 2022, 75, 102299. [Google Scholar] [CrossRef]
- Sahoo, P.; Saha, S.; Sharma, S.K.; Mondal, S.; Gowda, S. A Multi-stage framework for COVID-19 detection and severity assessment from chest radiography images using advanced fuzzy ensemble technique (R). Expert Syst. Appl. 2024, 238, 121724. [Google Scholar] [CrossRef]
- Bergantini, L.; d’Alessandro, M.; Cameli, P.; Otranto, A.; Luzzi, S.; Bianchi, F.; Bargagli, E. Cytokine profiles in the detection of severe lung involvement in hospitalized patients with COVID-19: The IL-8/IL-32 axis. Cytokine 2022, 151, 155804. [Google Scholar] [CrossRef]
- Huyut, M.T. Automatic Detection of Severely and Mildly Infected COVID-19 Patients with Supervised Machine Learning Models. IRBM 2023, 44, 100725. [Google Scholar] [CrossRef]
- Al Rahhal, M.M.; Bazi, Y.; Jomaa, R.M.; AlShibli, A.; Alajlan, N.; Mekhalfi, M.L.; Melgani, F. COVID-19 Detection in CT/X-ray Imagery Using Vision Transformers. J. Pers. Med. 2022, 12, 310. [Google Scholar] [CrossRef]
- Tabik, S.; Gomez-Rios, A.; Martin-Rodriguez, J.L.; Sevillano-Garcia, I.; Rey-Area, M.; Charte, D.; Guirado, E.; Suarez, J.L.; Luengo, J.; Valero-Gonzalez, M.A.; et al. COVIDGR Dataset and COVID-SDNet Methodology for Predicting COVID-19 Based on Chest X-ray Images. IEEE J. Biomed. Health Inform. 2020, 24, 3595–3605. [Google Scholar] [CrossRef]
- PadChest. Available online: https://bimcv.cipf.es/bimcv-projects/padchest/ (accessed on 2 October 2023).
- Stony Brook University COVID-19 Positive Cases (COVID-19-NY-SBU). Available online: https://wiki.cancerimagingarchive.net/pages/viewpage.action?pageId=89096912 (accessed on 2 October 2023).
- Chest Imaging with Clinical and Genomic Correlates Representing a Rural COVID-19 Positive Population (COVID-19-AR). Available online: https://wiki.cancerimagingarchive.net/pages/viewpage.action?pageId=70226443 (accessed on 2 October 2023).
- Cohen, J.P.; Morrison, P.; Dao, L.; Roth, K.; Duong, T.Q.; Ghassemi, M. COVID-19 Image Data Collection: Prospective Predictions Are the Future. arXiv 2020, arXiv:2006.11988. Available online: https://github.com/ieee8023/covid-chestxray-dataset (accessed on 1 June 2023). [CrossRef]
- Borghesi, A.; Maroldi, R. COVID-19 outbreak in Italy: Experimental chest X-ray scoring system for quantifying and monitoring disease progression. Radiol. Medica 2020, 125, 509–513. [Google Scholar] [CrossRef]
- Signoroni, A.; Savardi, M.; Benini, S.; Adami, N.; Leonardi, R.; Gibellini, P.; Vaccher, F.; Ravanelli, M.; Borghesi, A.; Maroldi, R.; et al. BS-Net: Learning COVID-19 pneumonia severity on a large chest X-ray dataset. Med. Image Anal. 2021, 71, 102046. [Google Scholar] [CrossRef]
- BrixIA Home Page, #BrixIA COVID19 Severity Score Assessment Project and Database. Available online: https://brixia.github.io/ (accessed on 1 October 2023).
- COVIDGR Home Page, GitHub—Ari-Dasci/OD-Covidgr: Datasets of X-ray Imaging for Detection of COVID-19. Available online: https://github.com/ari-dasci/OD-covidgr/ (accessed on 1 October 2023).
- MIDRC—Medical Imaging and Data Resource Center. Available online: https://www.midrc.org/ (accessed on 2 October 2023).
- Murphy, M.C.; Little, B.P. Chronic Pulmonary Manifestations of COVID-19 Infection: Imaging Evaluation. Radiology 2023, 307, e222379. [Google Scholar] [CrossRef] [PubMed]
- Ronneberger, O.; Fischer, P.; Brox, T. U-Net: Convolutional Networks for Biomedical Image Segmentation. In Proceedings of the 18th International Conference on Medical Image Computing and Computer-Assisted Intervention (MICCAI), Munich, Germany, 5–9 October 2015; pp. 234–241. [Google Scholar]
- Gielczyk, A.; Marciniak, A.; Tarczewska, M.; Lutowski, Z. Pre-processing methods in chest X-ray image classification. PLoS ONE 2022, 17, e0265949. [Google Scholar] [CrossRef] [PubMed]
- Szegedy, C.; Liu, W.; Jia, Y.; Sermanet, P.; Reed, S.; Anguelov, D.; Erhan, D.; Vanhoucke, V.; Rabinovich, A. Going Deeper with Convolutions. Proceedings of IEEE Conference on Computer Vision and Pattern Recognition (CVPR), Boston, MA, USA, 7–12 June 2015; pp. 1–9. [Google Scholar]
- Szegedy, C.; Ioffe, S.; Vanhoucke, V.; Alemi, A.A. Inception-v4, Inception-ResNet and the Impact of Residual Connections on Learning. In Proceedings of the 31st AAAI Conference on Artificial Intelligence, San Francisco, CA, USA, 4–9 February 2017; pp. 4278–4284. [Google Scholar]
- Samala, R.K.; Chan, H.P.; Hadjiiski, L.; Helvie, M.A.; Richter, C.D.; Cha, K.H. Breast Cancer Diagnosis in Digital Breast Tomosynthesis: Effects of Training Sample Size on Multi-Stage Transfer Learning Using Deep Neural Nets. IEEE Trans. Med. Imaging 2019, 38, 686–696. [Google Scholar] [CrossRef] [PubMed]
- Samala, R.K.; Chan, H.P.; Hadjiiski, L.M.; Helvie, M.A.; Richter, C.D. Generalization error analysis for deep convolutional neural network with transfer learning in breast cancer diagnosis. Phys. Med. Biol. 2020, 65, 105002. [Google Scholar] [CrossRef] [PubMed]
- Samala, R.K.; Chan, H.P.; Hadjiiski, L.; Helvie, M.A. Risks of feature leakage and sample size dependencies in deep feature extraction for breast mass classification. Med. Phys. 2021, 48, 2827–2837. [Google Scholar] [CrossRef] [PubMed]
- Apostolopoulos, I.D.; Mpesiana, T.A. Covid-19: Automatic detection from X-ray images utilizing transfer learning with convolutional neural networks. Phys. Eng. Sci. Med. 2020, 43, 635–640. [Google Scholar] [CrossRef]


| Method | Year | Data | Class Groups | Results |
|---|---|---|---|---|
| Statistical approach [9] | 2021 | Plasma and single-cell proteomic | Mild, moderate, severe | AUCtraining = 0.799 AUCvalidation = 0.773 |
| Deep Learning [10] | 2022 | CXR | COVID-19 and normal | Mean absolute error of 0.30 |
| Deep Learning [11] | 2021 | CXR | Severity level (scores from 0 to 8) | confusion matrix: Sensitivity = 0.94 Specificity = 0.98 |
| Deep learning [12] ResNet | 2022 | CXR | COVID-19, virus, bacteria, ARDS, SARS, Streptococcus, normal | Accuracy = 98% |
| Deep learning [13] | 2023 | CXR | COVID-19, virus, bacteria, and normal | Accuracy = 97.65% |
| Deep learning [14] CORONA-NET | 2023 | CXR | COVID-19, viral pneumonia, normal | Accuracy = 99.57% |
| Deep learning [15] ResNet | 2023 | CXR | COVID-19, non-COVID-19, and normal | Accuracy = 96% |
| Deep learning [16] DAM-Net | 2023 | CXR | COVID-19, pneumonia, and normal | Accuracy = 97.22% Sensitivity = 96.87% Specificity = 99.12% |
| Deep learning [17] | 2021 | CXR | Severity descriptors vs. radiologist’s severity ratings, normal vs. abnormal | Correlation = 0.68 (p < 0.0001) AUC = 0.78 |
| Cytokine profiles with statistical approaches [20] | 2022 | Cytokine concentration | Severe, moderate, and mild | AUC = 0.83 |
| Supervised machine learning models [21] | 2023 | Feature-dataset consisting of the routine blood values and demographic data that affect the prognosis of COVID-19 | Severely and mildly | AUC range: 0.75 to 0.95 Accuracy range: 94.05% to 97.86% |
| Vision Transformers [22] | 2022 | CXR and CT | COVID-19, pneumonia, and normal | Accuracy = 94.62% |
| COVID_SDNet [23] | 2020 | CXR | Severe, moderate, and mild | Accuracy = 81.0% ± 2.9% Sensitivity = 76.8% ± 6.3% Specificity = 85.2% ± 5.4% |
| Multi-task vision [18] | 2022 | CXR | Severity degree from 0 to 6 | Accuracy range: 78.7% to 97.7% |
| Multi-stage framework [19] | 2023 | CXR | Mild, moderate, severe, and critical | Accuracy = 97.63% |
| Name of Database | Year of Data Collection | Type of Labels | Public Available | Severity COVID19 Rate | Number of Images |
|---|---|---|---|---|---|
| Cohen et al. [27] | 2020 | Defined by other paper [9]:
| yes | yes | 679 X-ray images from 412 patients |
| BrixIA [28,29,30] | 2020 | The lungs were divided into six regions and each region was scored ranging from 0 to 3. Consensus from 5 radiologists | yes | yes | 4695 |
| COVIDGR [23,31] | 2020 | Data were rated by 1 radiologist as negative, mild, moderate, or severe | yes | yes | 852 |
| MIDRC [32] | 2022 | Data were rated by 3 radiologists as negative, mild, moderate, or severe | yes | yes | 823 with severity labels for COVID-19 |
| TRAINING | VALIDATION | TESTING | ||||||||
|---|---|---|---|---|---|---|---|---|---|---|
| Total | Severe | Non-Severe | Total | Severe | Non-Severe | Total | Severe | Non-Severe | ||
| MIDRC | images | 582 | 129 (22%) | 453 (78%) | 68 | 18 (26%) | 50 (74%) | 173 | 70 (40%) | 103 (60%) |
| cases | 425 | 50 | 26 | |||||||
| BrixIA | images | 3285 | 563 (17%) | 2722 (83%) | 470 | 58 (12%) | 412 (88%) | 940 | 184 (20%) | 756 (80%) |
| cases | 3206 | 464 | 917 | |||||||
| COVIDGR | images | 300 | 56 (19%) | 244 (81%) | 42 | 7 (17%) | 35 (83%) | 83 | 15 (18%) | 68 (82%) |
| cases | 300 | 42 | 83 | |||||||
| UMICH | images | -- | -- | -- | -- | -- | -- | 250 | 86 (34%) | 164 (66%) |
| cases | -- | -- | 235 | |||||||
| Mean of Jaccard | Mean of Dice Coefficient | Mean of Hausdorff Distance | Mean of Average Euclidean Distance | |
|---|---|---|---|---|
| Mean | 0.82 | 0.90 | 37.7 mm | 5.4 mm |
| Standard deviation | 0.07 | 0.04 | 24.6 mm | 2.7 mm |
| Batch Size | Models | MIDRC | BrixIA | COVIDGR | UMICH |
|---|---|---|---|---|---|
| AUC | |||||
| 16 | M | 0.82 ± 0.01 | 0.82 ± 0.01 | 0.80 ± 0.04 | 0.80 ± 0.01 |
| MB | 0.84 ± 0.01 | 0.84 ± 0.01 | 0.78 ± 0.02 | 0.80 ± 0.02 | |
| MBC | 0.84 ± 0.02 | 0.85 ± 0.00 | 0.82 ± 0.02 | 0.80 ± 0.01 | |
| 32 | M | 0.82 ± 0.02 | 0.81 ± 0.01 | 0.75 ± 0.04 | 0.77 ± 0.01 |
| MB | 0.82 ± 0.02 | 0.84 ± 0.01 | 0.76 ± 0.03 | 0.80 ± 0.01 | |
| MBC | 0.83 ± 0.02 | 0.84 ± 0.00 | 0.84 ± 0.01 | 0.81 ± 0.02 | |
| 64 | M | 0.79 ± 0.03 | 0.76 ± 0.02 | 0.62 ± 0.07 | 0.71 ± 0.05 |
| MB | 0.83 ± 0.02 | 0.83 ± 0.01 | 0.78 ± 0.06 | 0.78 ± 0.02 | |
| MBC | 0.82 ± 0.03 | 0.83 ± 0.01 | 0.77 ± 0.03 | 0.78 ± 0.02 | |
| Batch Size | Models | MIDRC | BrixIA | COVIDGR | UMICH |
|---|---|---|---|---|---|
| AUC | |||||
| 16 | M | 0.82 ± 0.09 | 0.79 ± 0.14 | 0.82 ± 0.15 | 0.82 ± 0.10 |
| MB | 0.86 ± 0.01 | 0.88 ± 0.01 | 0.79 ± 0.04 | 0.89 ± 0.01 | |
| MBC | 0.88 ± 0.01 | 0.87 ± 0.01 | 0.84 ± 0.02 | 0.89 ± 0.01 | |
| 32 | M | 0.84 ± 0.03 | 0.85 ± 0.01 | 0.74 ± 0.05 | 0.87 ± 0.02 |
| MB | 0.88 ± 0.02 | 0.88 ± 0.01 | 0.79 ± 0.03 | 0.89 ± 0.02 | |
| MBC | 0.87 ± 0.01 | 0.88 ± 0.01 | 0.85 ± 0.06 | 0.89 ± 0.01 | |
Disclaimer/Publisher’s Note: The statements, opinions and data contained in all publications are solely those of the individual author(s) and contributor(s) and not of MDPI and/or the editor(s). MDPI and/or the editor(s) disclaim responsibility for any injury to people or property resulting from any ideas, methods, instructions or products referred to in the content. |
© 2024 by the authors. Licensee MDPI, Basel, Switzerland. This article is an open access article distributed under the terms and conditions of the Creative Commons Attribution (CC BY) license (https://creativecommons.org/licenses/by/4.0/).
Share and Cite
Sobiecki, A.; Hadjiiski, L.M.; Chan, H.-P.; Samala, R.K.; Zhou, C.; Stojanovska, J.; Agarwal, P.P. Detection of Severe Lung Infection on Chest Radiographs of COVID-19 Patients: Robustness of AI Models across Multi-Institutional Data. Diagnostics 2024, 14, 341. https://doi.org/10.3390/diagnostics14030341
Sobiecki A, Hadjiiski LM, Chan H-P, Samala RK, Zhou C, Stojanovska J, Agarwal PP. Detection of Severe Lung Infection on Chest Radiographs of COVID-19 Patients: Robustness of AI Models across Multi-Institutional Data. Diagnostics. 2024; 14(3):341. https://doi.org/10.3390/diagnostics14030341
Chicago/Turabian StyleSobiecki, André, Lubomir M. Hadjiiski, Heang-Ping Chan, Ravi K. Samala, Chuan Zhou, Jadranka Stojanovska, and Prachi P. Agarwal. 2024. "Detection of Severe Lung Infection on Chest Radiographs of COVID-19 Patients: Robustness of AI Models across Multi-Institutional Data" Diagnostics 14, no. 3: 341. https://doi.org/10.3390/diagnostics14030341