Article

Image Quality Analysis of Photon-Counting CT Compared with Dual-Source CT: A Phantom Study for Chest CT Examinations

1
Medical Physics Department, University Hospital, 59037 Lille, France
2
Radiology Department, Heart-Lung Institute, University Hospital, 59037 Lille, France
*
Author to whom correspondence should be addressed.
Diagnostics 2023, 13(7), 1325; https://doi.org/10.3390/diagnostics13071325
Submission received: 28 February 2023 / Revised: 27 March 2023 / Accepted: 29 March 2023 / Published: 3 April 2023
(This article belongs to the Special Issue Quantitative Imaging in Computed Tomography)

Abstract

:
A comparison was made between the image quality of a photon-counting CT (PCCT) and a dual-source CT (DSCT). The evaluation of image quality was performed using a Catphan CT phantom, and the physical metrics, such as the noise power spectrum and task transfer function, were measured for both PCCT and DSCT at three CT dose indices (1, 5 and 10 mGy). Polyenergetic and virtual monoenergetic reconstructions were used to evaluate the performance differences by simulating a Gaussian spot with a radius of 5 mm and calculating the detectability index. The highest iterative reconstruction level was able to decrease the noise by about 70% compared with the filtered back projection using a parenchyma reconstruction kernel. The PCCT task transfer functions remained constant, while those of the DSCT increased with the reconstruction strength level. At monoenergetic 70 keV, a 50% decrease in noise was observed for DSCT with image smoothing, while PCCT had the same 50% decrease in noise without any smoothing. The PCCT detectability index at a reconstruction strength level of two was equivalent to the highest level of ADMIRE 5 for DSCT. The PCCT showed its superiority over the DSCT, especially for lung nodule detection.

1. Introduction

Computed tomography (CT) technology has advanced in the past decades, improving image quality while lowering patient radiation exposure [1]. Current CT scanners have evolved into spectral CT, such as dual-source spectral CT (DSCT), which was released by Siemens in 2006 [2], as well as dual-layer CT scanners and fast kV switching CT scanners, released by Philips and GE or Toshiba, respectively [3]. Siemens dual-source CT scanners yield spectral information and use two different voltages on each X-ray tube, with an associated beam filtration to yield the spectral information. Spectral CT scanners are then based on solid-state scintillation detectors, such as current CT scanners. Absorbed X-rays are converted by the scintillator into visible light photons, which are then converted into electrons with the help of a backside photodiode. The created electrical current amplitude is then proportional to the energy of the absorbed photon. The main drawback of this detector technology is that low-energy photons contribute less than high-energy photons. Furthermore, image noise and CT number drifts are caused by electronic noise at low X-ray flux. The DSCT detection used in this study is based on StellarInfinity detectors, which are third-generation detectors with reduced electronic noise, even in the case of low tube intensity [4].
Recently, photon-counting detectors have been implemented in CT, which may become state-of-the-art CT detection technology in a few years. A commercial version of dual-source photon-counting CT (PCCT) was released by Siemens in 2021 [5,6]. Photon-counting detectors are based on the direct conversion of X-ray photons using a semiconductor material [7] made of cadmium telluride (CdTe). The voltage pulse height is proportional to the energy of the absorbed photon. When the lowest threshold energy is overcome, the X-ray photon is counted, and its energy is classified by means of three other thresholds. Hence, PCCT scanners enable spectral acquisition using a single detector. Electronic noise is eliminated by the low threshold energy (lower than 20 keV), which is not the case for standard indirect conversion detectors [8]. The main challenge for this new detection technology is in achieving an acceptable detector layer thickness in the range of millimeters. Therefore, better geometric efficiency is provided by a thinner detector layer and smaller pixel elements compared to scintillator detectors. Therefore, a high spatial resolution is reached, and pile-up effects are reduced. A PCCT ultra-high spatial resolution (UHR) is achieved with the QuantaMax detector elements, which have an area of 0.150 × 0.176 mm2 given at the isocenter. The standard acquisition mode means that pixels are grouped, in pairs, in each direction into a macropixel.
Since the first clinical PCCT was released, several technical and clinical studies have been performed and have shown that image quality was improved while keeping the dose constant [9,10,11,12,13,14,15,16]. As the PCCT is used in our thoracic imaging department, the goal of our study was to investigate the PCCT performance in lung nodule detection using physical metrics, which were compared with those obtained using DSCT, which was previously used in the same department. Noise power spectrum (NPS), task transfer function (TTF) and detectability index (d’) were evaluated within the Catphan 600 phantom dedicated to imaging. Firstly, the physical metrics were measured for both CT scanners using polyenergetic reconstruction since the parenchyma reconstruction kernel is used in clinical routine. Secondly, these metrics were evaluated using a virtual monoenergetic reconstruction at 70 keV. The consistency of the new iterative reconstruction (IR) algorithm linked to the PCCT was investigated by changing the reconstruction strength level and the volume computed tomography dose index (CTDIvol).

2. Materials and Methods

2.1. Acquisition and Reconstruction of the Phantom

The Catphan 600 phantom (Phantom Laboratory, Salem, MA, USA) is specifically designed for quality control in CT imaging. The CTP489 module was used to measure NPS, and the CTP404 module was used to determine the TTF of an air insert.
The phantom was scanned with a 144-sliced Naeotom Alpha PCCT scanner, software version VA40A (Siemens Healthcare GmbH, Erlangen, Germany), and with a 192-sliced Somatom Force DSCT scanner, software version VB20A (Siemens Healthcare GmbH, Erlangen, Germany). The maximal collimations in the cranio-caudal direction were 144 × 0.4 mm and 192 × 0.6 mm at the isocenter for PCCT and DSCT, respectively. For the DSCT scanner, the maximal fields of view (FOV) of the two detectors are 50 cm and 26 cm, while the second detector has a maximal FOV of 36 cm for the PCCT scanner.
Acquisitions on both CTs were based on a thoracic protocol at different CTDIvol: 1, 5 and 10 mGy, which correspond to a low-dose examination, an intermediate-dose examination in our department and a higher-dose examination, corresponding to the French national diagnostic reference level (DRL) [17]. By adapting the mAs, CTDIvol display values equivalent to the wanted CTDIvol were reached. Both systems’ CTDIvol display values were controlled before the measurements and were in conformity with French national regulations [18].
The slice thickness was fixed at 1 mm for each phantom acquisition. The other acquisition and reconstruction parameters are listed in Table 1. For the polyenergetic reconstruction, the reconstruction kernels Bl56 and Bl57 dedicated to parenchyma were used for PCCT and DSCT, respectively. Bl56 and Bl57 were used because they are the closest kernels available on the respective CT, as the same kernel was not available. The kVp 80/Sn150 couple was chosen to correspond to the clinical routine for thorax examination on DSCT. For the virtual monoenergetic reconstruction at 70 keV, the Qr40 kernel was applied for both CT scanners to obtain virtual monoenergetic images (VMIs). The 70 keV energy was chosen because CT acquisitions without iodine injection have been reconstructed at this energy in clinical routine. Both DSCT X-ray tubes and their associated detectors were used during acquisition, while only the X-ray tube with a maximal FOV of 50 cm was needed to perform the PCCT virtual monoenergetic reconstructions.
Table 1 shows that IR algorithms and all the available reconstruction strength levels were applied to each CT acquisition. When no iteration was performed, the reconstruction was equivalent to a weighted filtered back projection (WFBP). For the DSCT scanner, the iterative algorithm Advanced Modeled Iterative Reconstruction (ADMIRE) was applied at each iteration level from one to five. Its model is based on the IR algorithm that uses advanced noise reduction methods such as noise and system modeling [16]. The PCCT scanner was released with a new iterative algorithm, namely, Quantum IR (QIR), with four strength levels. Statistical optimization of spectral data to reduce target noise level and a correction for geometric cone beam artifacts were included by default [10,12]. The higher the iteration level, the smaller the noise.

2.2. Physical Metrics

Prior to physical metrics evaluation, the CT numbers within the air insert and background of each CT acquisition of the phantom were measured to estimate the contrast, as recommended in the AAPM report [19].
The software imQuest v7.1 (Clinical Imaging Physics Group, Department of Radiology, Duke Health, imquest@duke.edu) was chosen to evaluate the NPS, TTF and detectability index. The calculation is based on the AAPM report 266, which is dedicated to CT performance [19]. The details and formulas of the NPS, TTF and detectability index can also be found in the AAPM report [19].

2.2.1. Noise Power Spectrum

The one-dimensional NPS was measured in the homogeneous CTP489 module using five square regions of interest of 3.8 × 3.8 mm2, as shown in Figure 1. More than 90 slices were used for the calculation. Furthermore, the noise magnitude, the NPS peak and average frequencies were analyzed for each reconstructed CT image set, describing the NPS frequency content [19]. The NPS behavior was studied as a function of reconstruction strength levels for each CTDIvol and for the three different CTDIvol values (1, 5 and 10 mGy).
In order to compare the shape of the NPS curves, the NPS was normalized by the maximum of the FBP NPS curve for each reconstruction strength level using Equation (1):
N P S n o r m ( f ) = N P S   ( f ) N P S F B P ( f P )

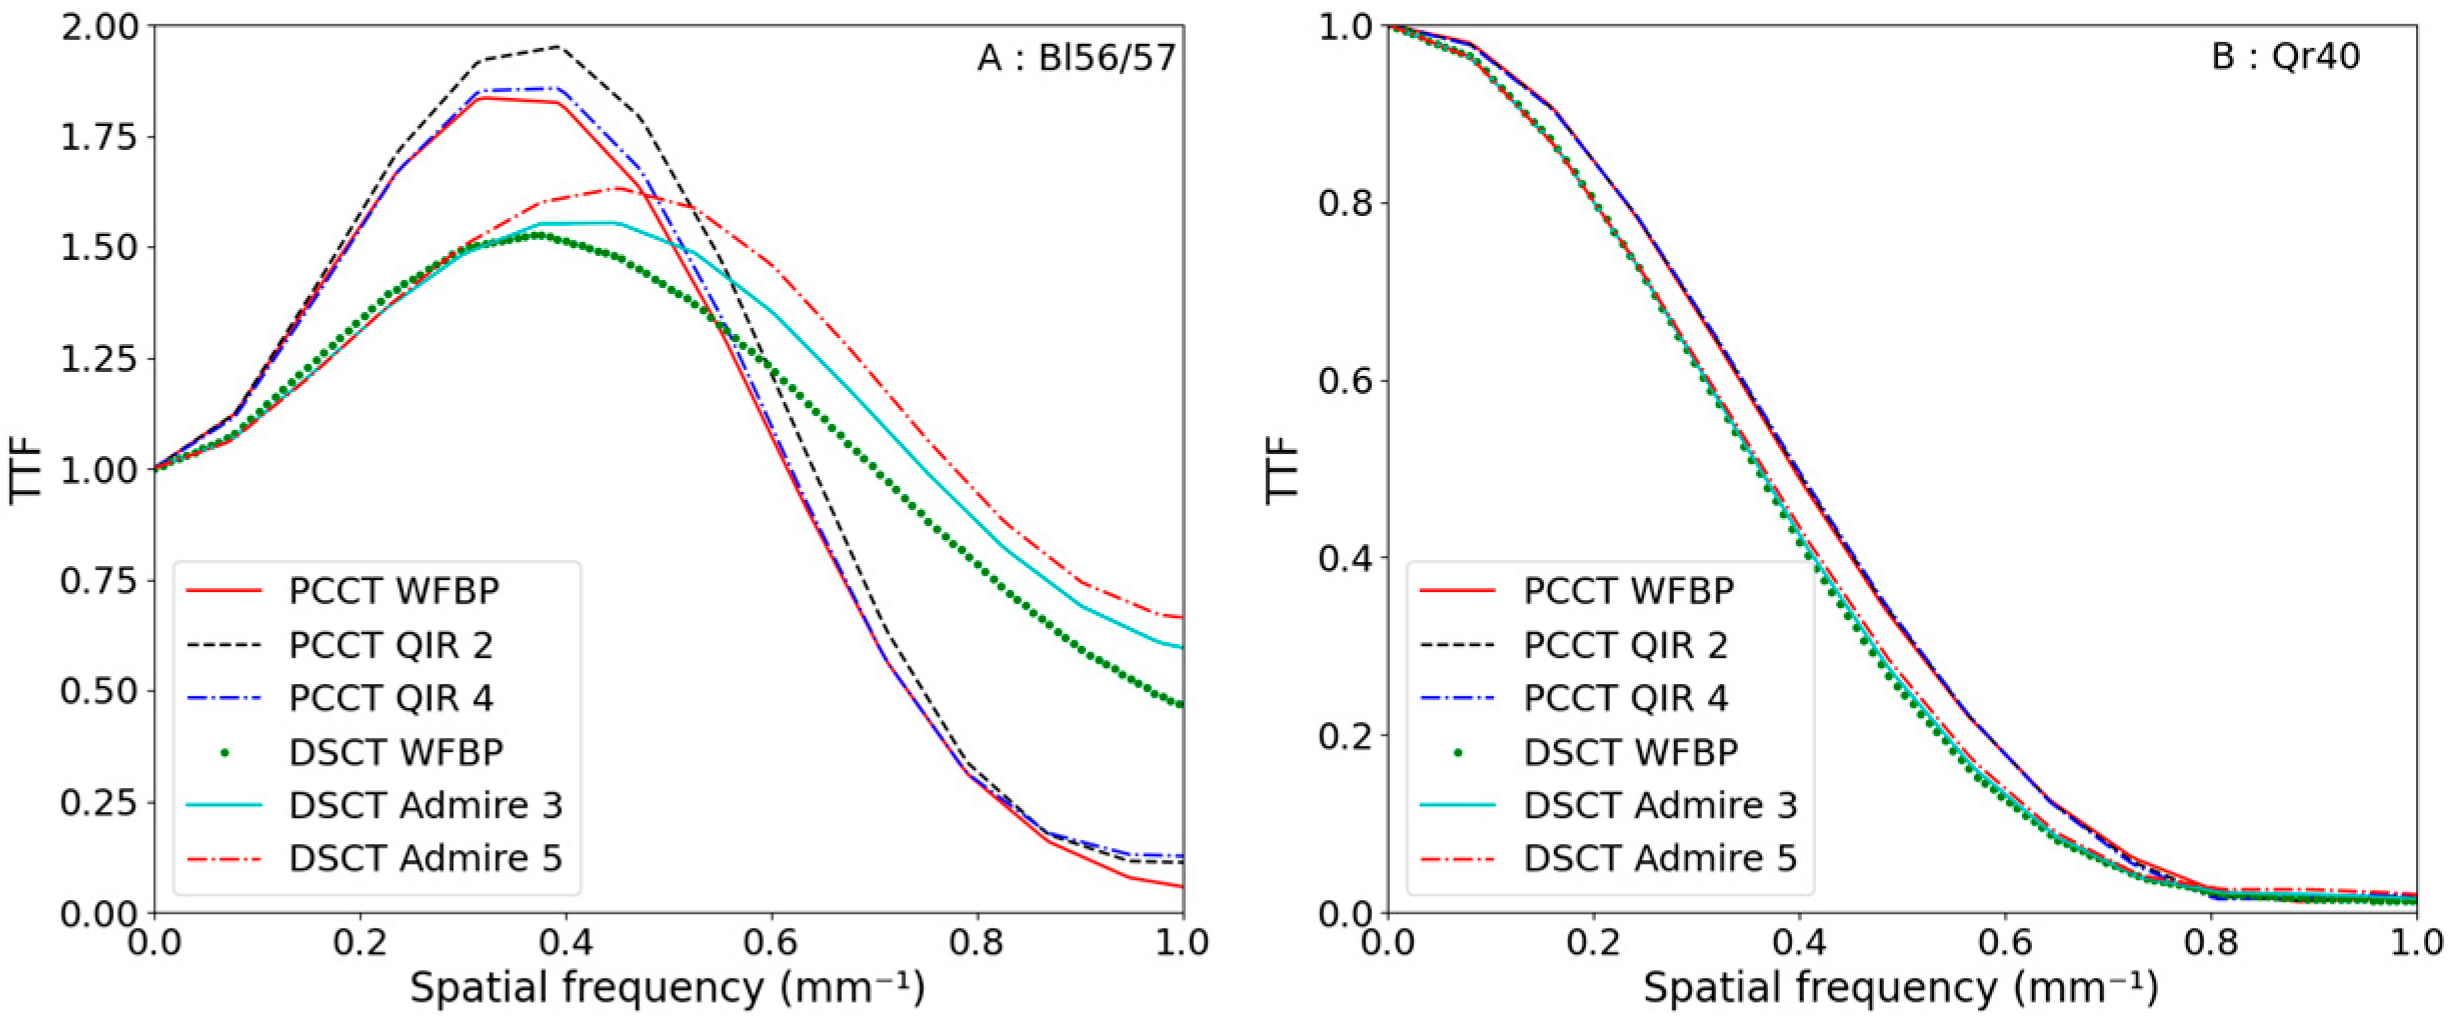
2.2.2. Task Transfer Function

The air rod insert surrounded by the background material was considered relevant to simulate a solid nodule in the lung, as sufficient high contrast was reached for this specific task, Figure 1. The TTF was calculated from the radial edge spread functions passing through the air insert, as explained in the AAPM report [19]. The total CNR must be higher than 15, as recommended in the AAPM report, to achieve a reliable estimate of the TTF.

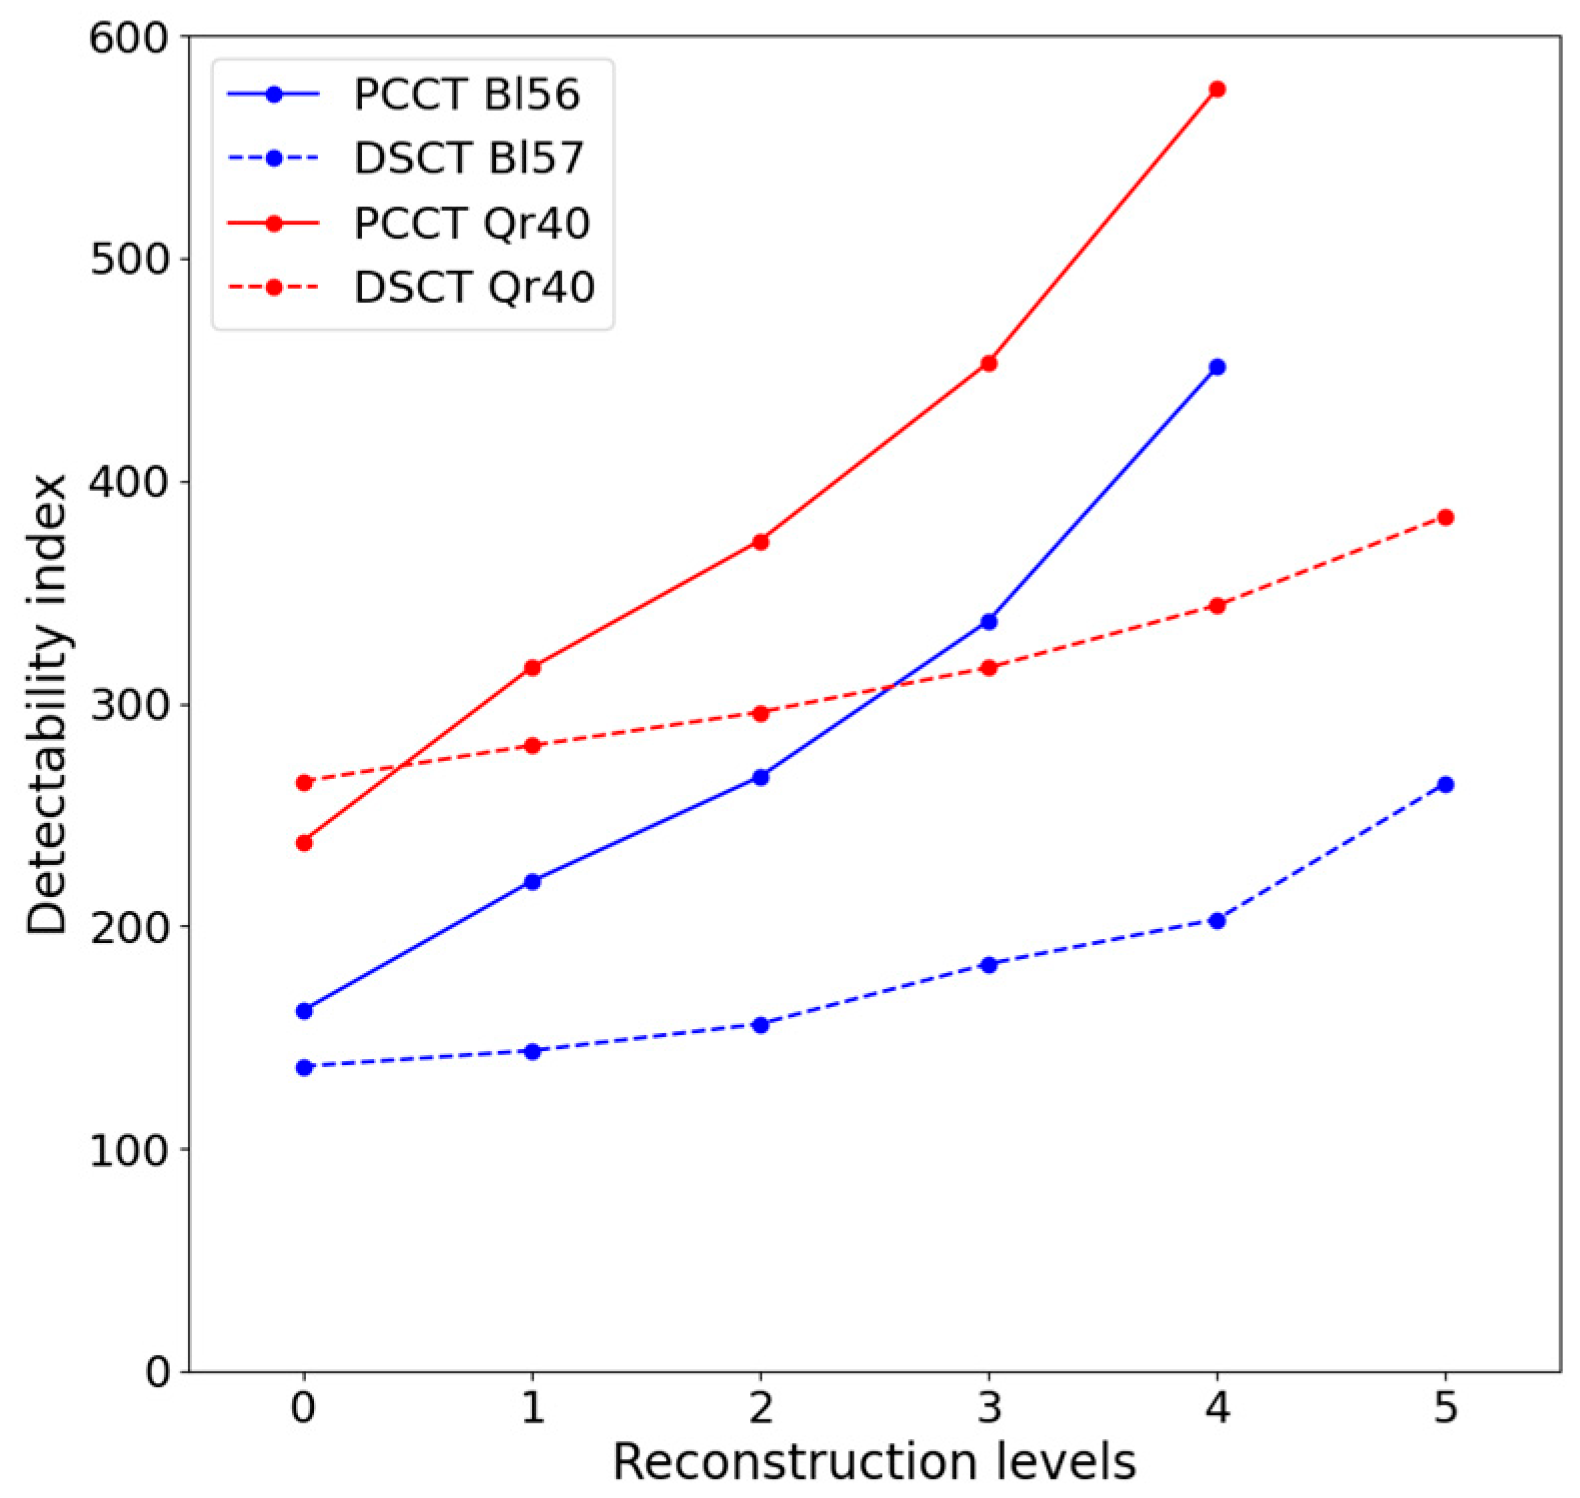
2.2.3. Detectability Index

The detectability index assessment was based on a clinical task simulated by a non-prewhitening observer model with an eye filter (NPWE). The simulated nodule was a Gaussian spot with a radius of 5 mm. The interpretation conditions were based on the Saunders model with 0.2 mm display pixel pitch, a zoom of 1 and an observer at a distance of 500 mm. The detectability indices were assessed using the NPS and the TTFair of each configuration to evaluate the performance of the PCCT in the case of polyenergetic and virtual monoenergetic reconstructions.

3. Results

3.1. Acquisition and Reconstruction of the Phantom

The two relevant phantom modules are shown in Figure 1. The homogeneous module of the Catphan phantom gave an HU mean value of 2 within the homogeneous module. No drastic changes in HU within the air insert and the background are presented in Table 2. Consequently, the contrast was considered equivalent for each protocol and well representative of the desired clinical task.

3.2. Physical Metrics

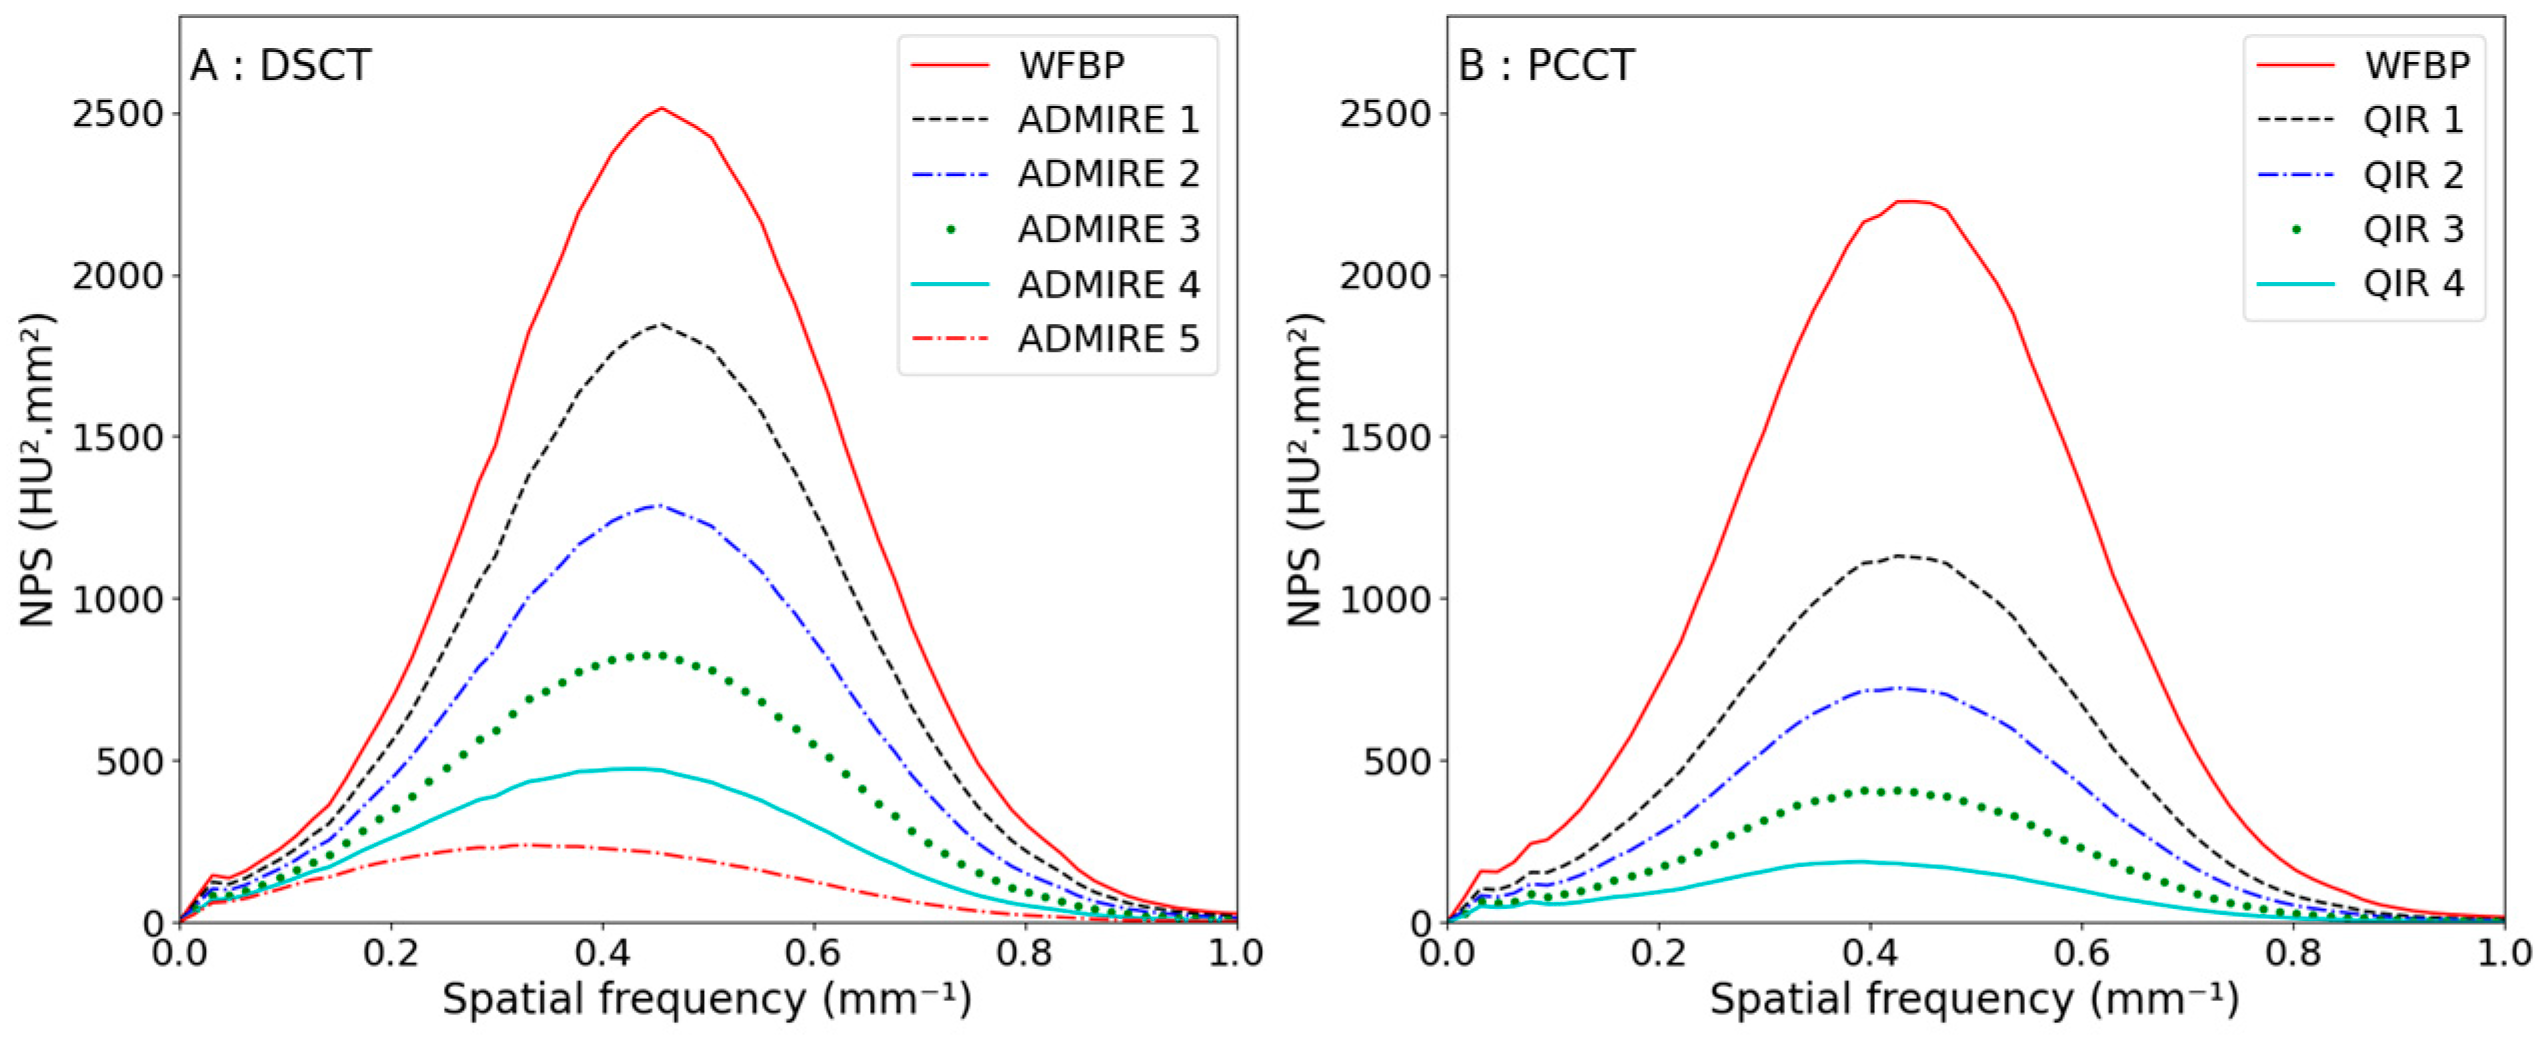
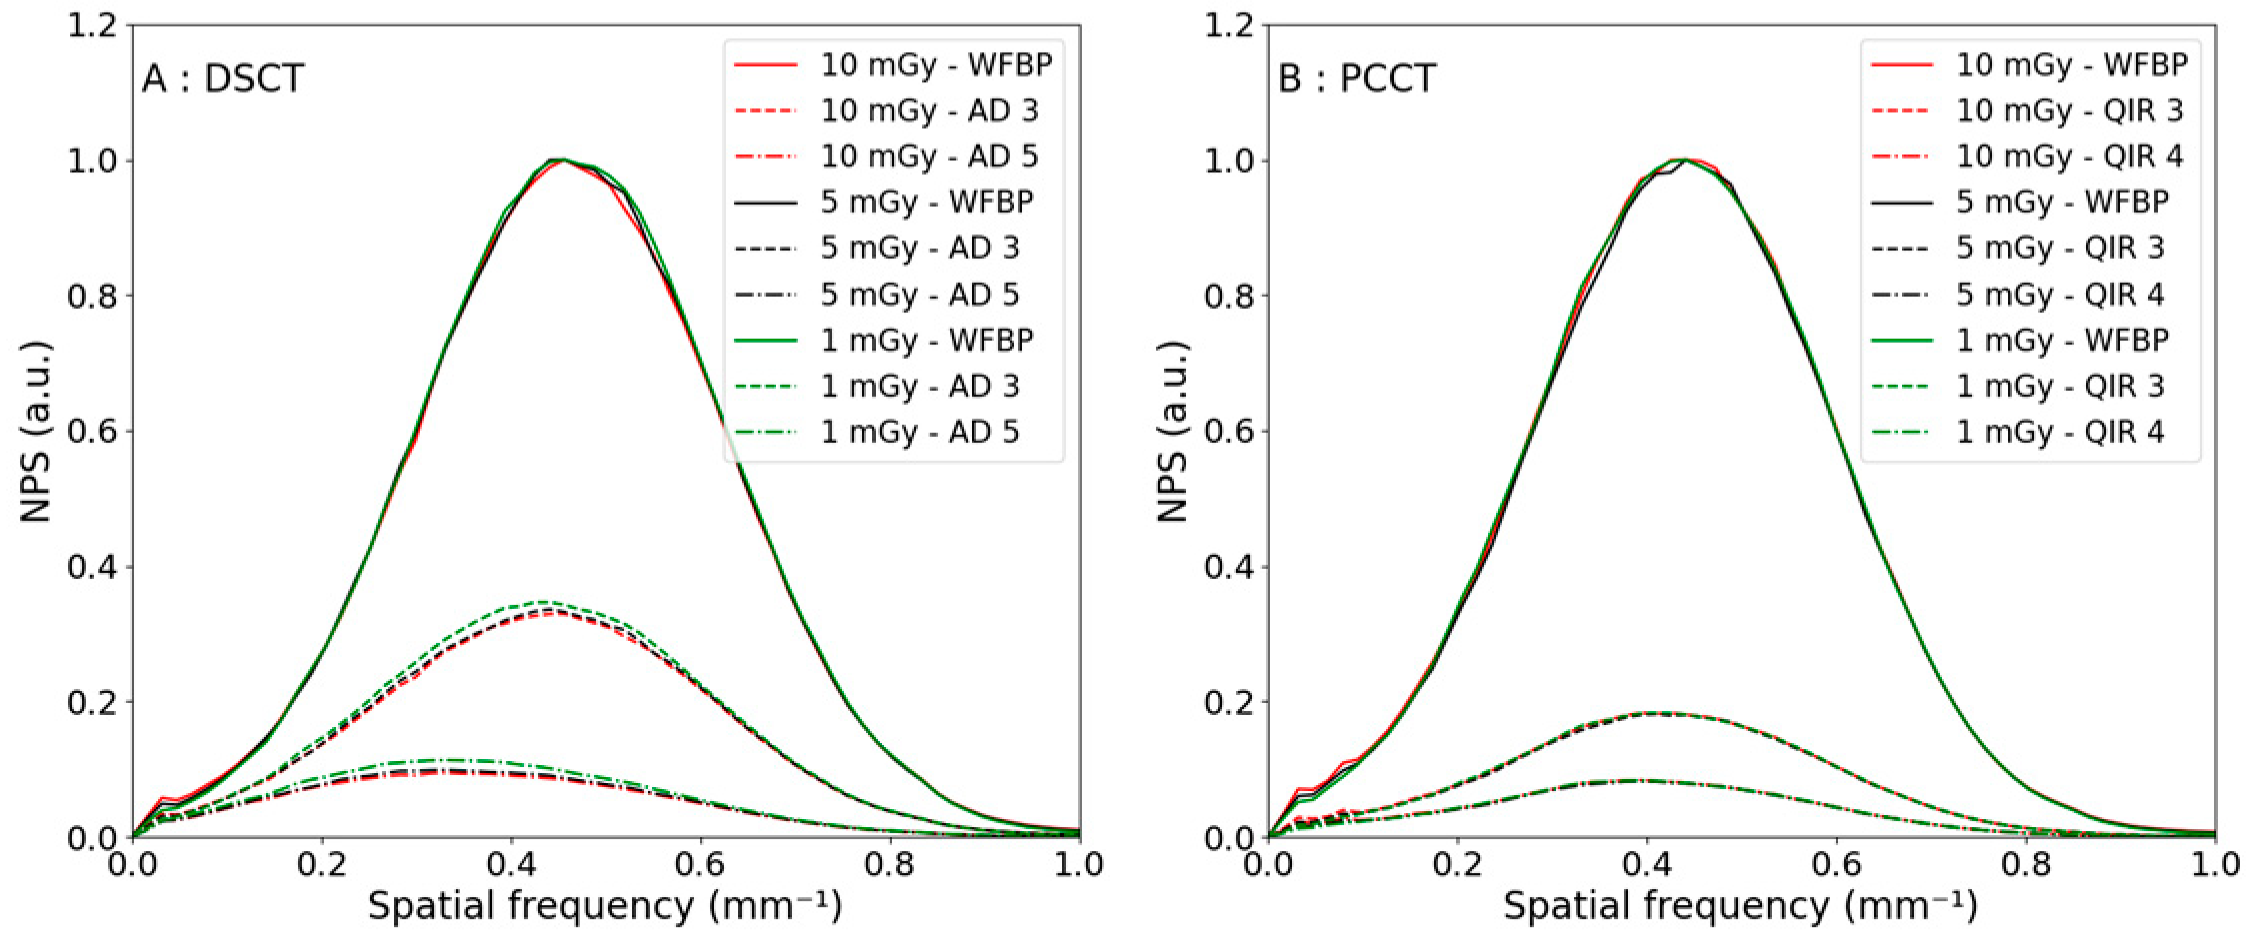
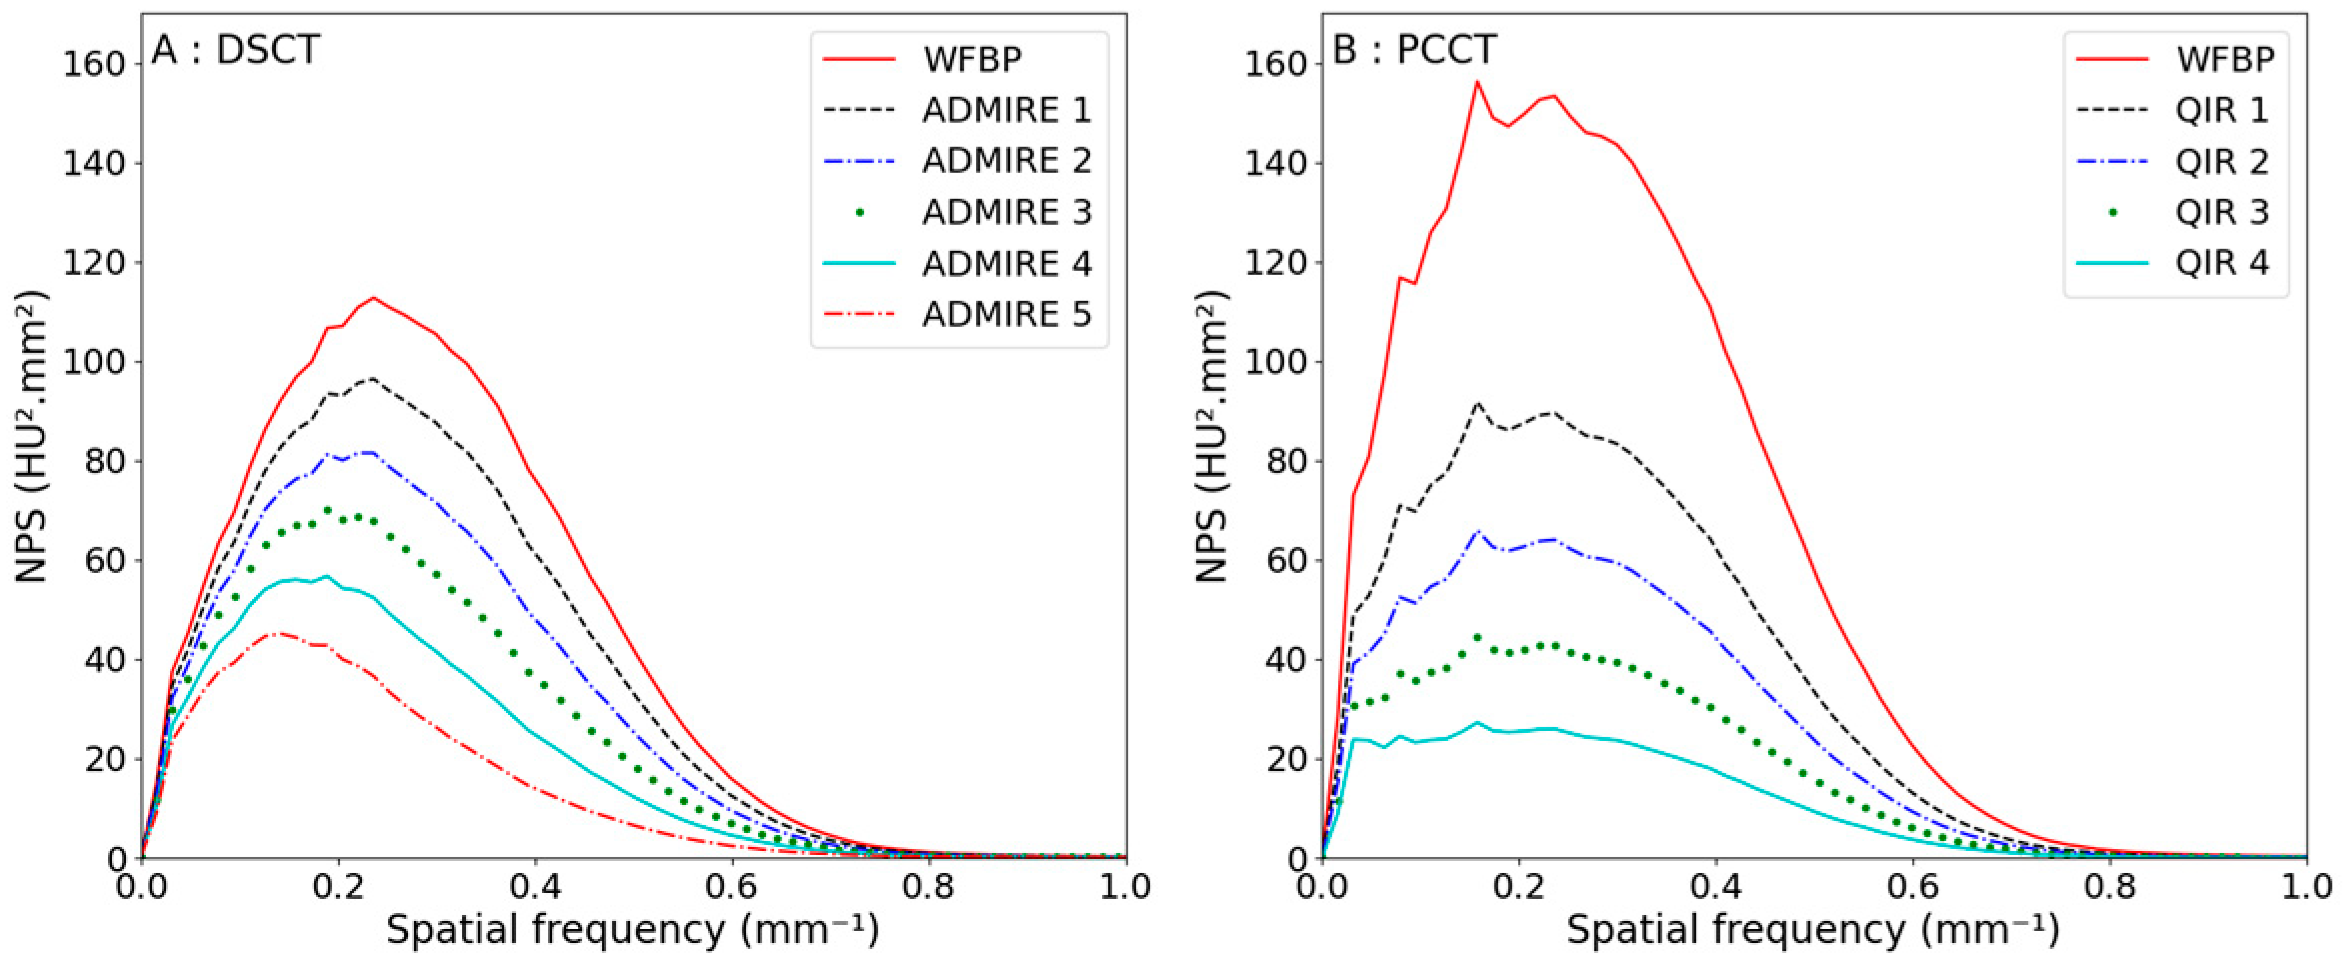
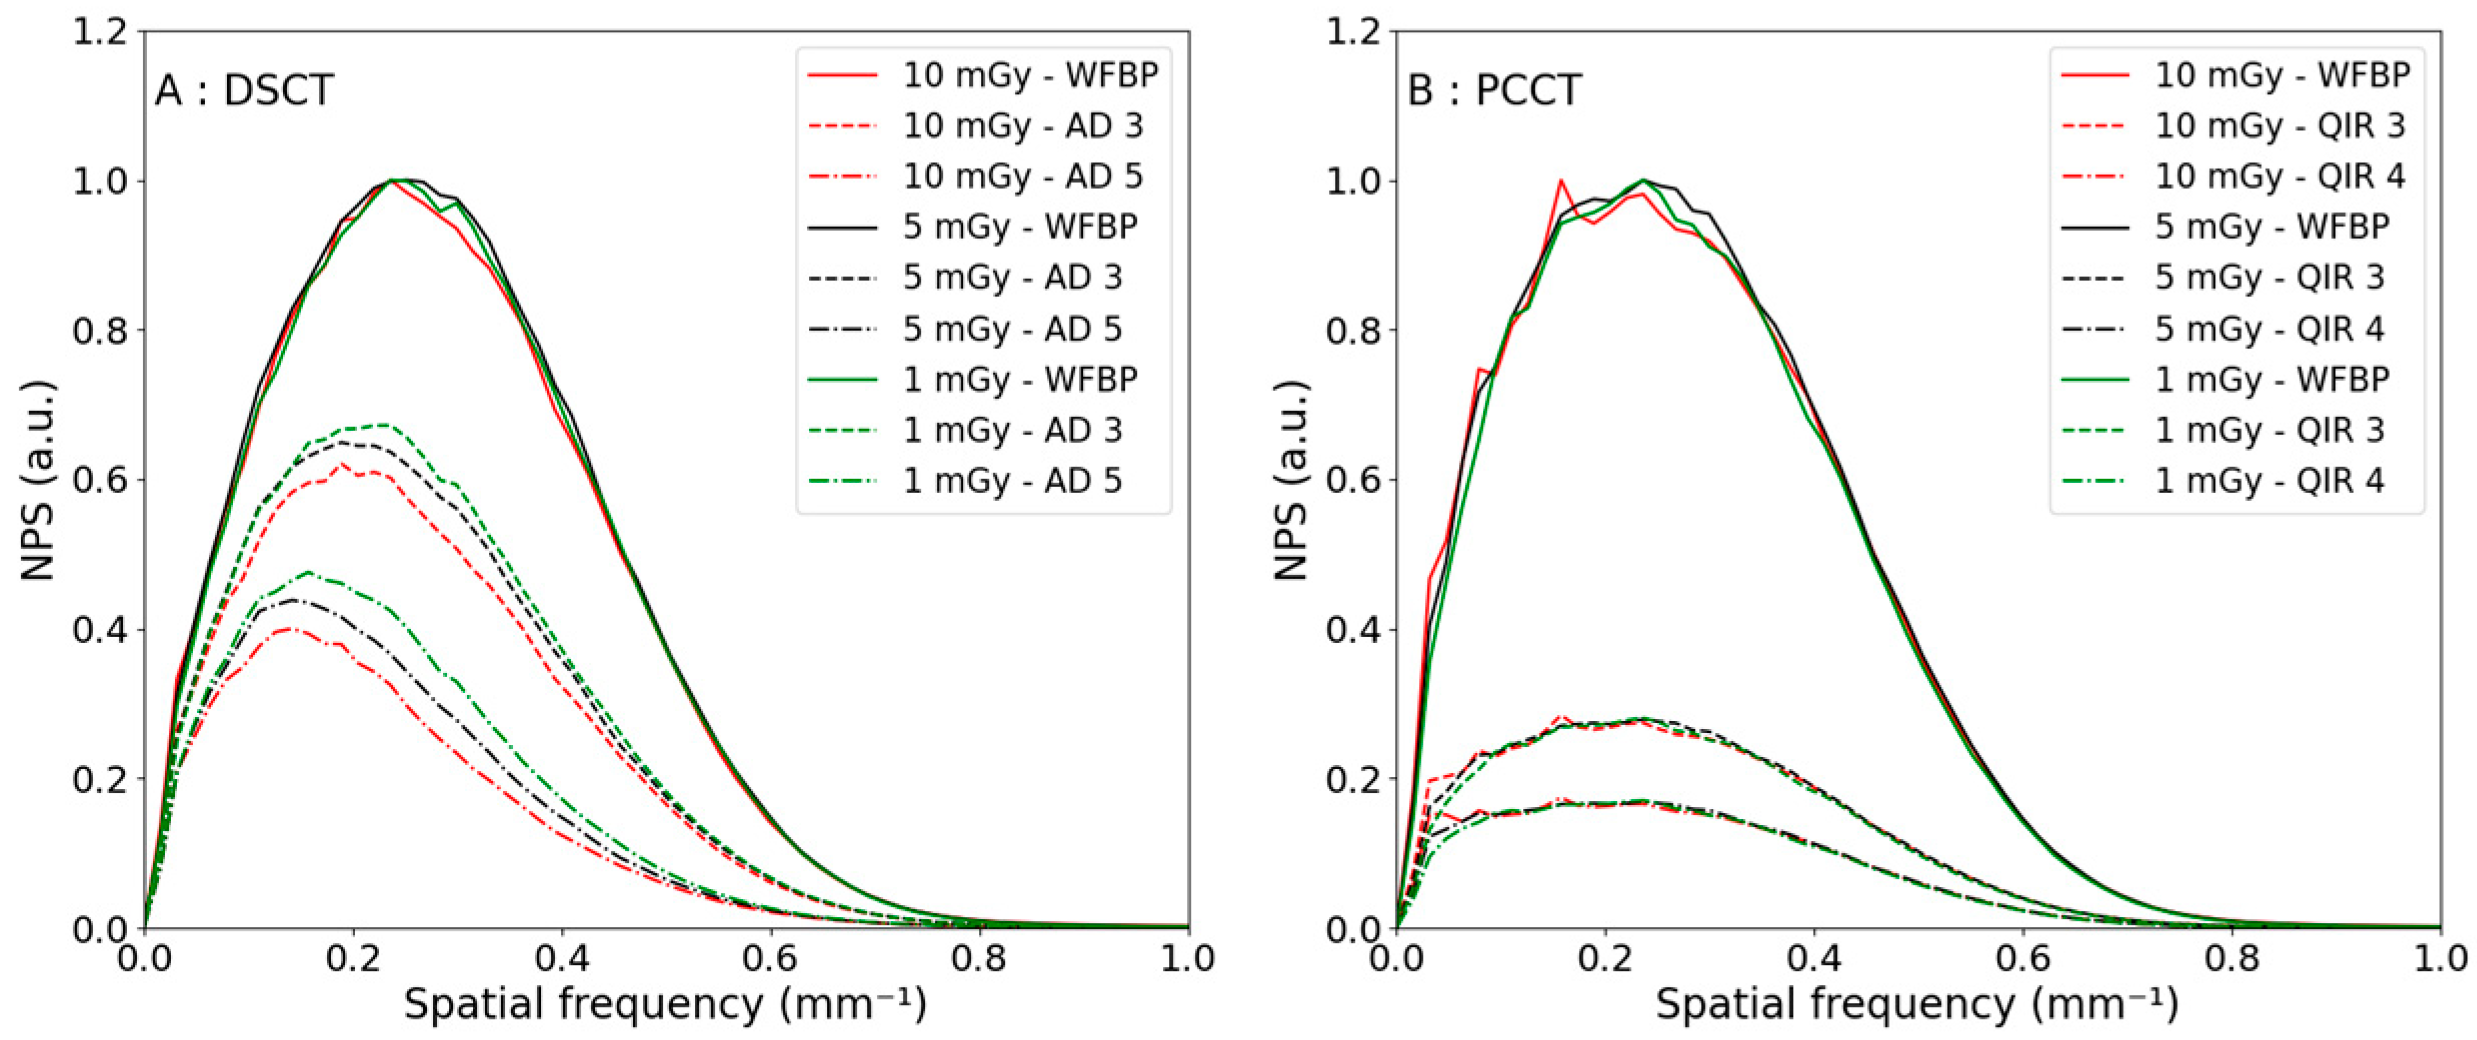
3.2.1. Noise Power Spectrum

The NPS curves as a function of the reconstruction levels are shown in Figure 2 for a CTDIvol of 10 mGy for a polyenergetic reconstruction. The NPS shapes were similar for both CTs. For each additional reconstruction strength level, the noise reduction was higher for the PCCT; the first iterative level from WFBP to QIR 1 led to a noise decrease of 29% compared with 14% for the DSCT. Moreover, the normalized NPS curves as a function of the reconstruction levels for the three different CTDIvol are shown in Figure 3. The noise reductions were equivalent at lower CTDIvol.
The peak frequency, the averaged frequency and the noise reduction are presented in Table 3 for a CTDIvol of 10 mGy. The peak frequencies were shifted to low spatial frequencies when increasing the reconstruction strength level for both CT scanners. Furthermore, the peak frequencies and averaged frequencies were unchanged for the lower CTDIvol.
In the case of the 70 keV reconstruction, the NPS shapes were shifted to lower spatial frequencies for both CT scanners, as shown in Figure 4 and Table 4.
The noise reduction was less efficient for the 70 keV reconstruction, with a total noise reduction of −59% against −71%, but the noise baseline was five times smaller compared with the polyenergetic reconstruction for the PCCT scanner. The peak and averaged frequencies were kept constant when increasing the PCCT reconstruction strength, as they were shifted to lower spatial frequencies for the DSCT, meaning that there are fewer texture changes for PCCT images.
The results found for the 5 and 1 mGy CTDIvol have the same shape as 10 mGy, as seen in Figure 5. However, the noise reduction is a little higher for the highest CTDIvol.

3.2.2. Task-Based Transfer Function

The task transfer functions were compared in the case of polyenergetic and virtual monoenergetic acquisitions. As previously said, TTF was calculated for the air insert, reproducing a solid nodule in the lungs. All total CNRs were over 15 (between 19 and 660), as recommended by AAPM [19].
For the reconstruction kernels dedicated to parenchyma, edge enhancement is provided by the algorithm, as seen in Figure 6 [20]. TTFair obtained on both CTs are quite different, where edge enhancement is more pronounced on the PCCT; in fact, the maximum of TTF is higher. Moreover, the spatial resolution is better on DSCT as the f50% is higher, as seen in Table 5. On DSCT, f50% increased with the reconstruction strength level, whereas on the PCCT, the behavior of TTFair was less dependent on it.
For the different CTDIvol acquisitions at 1, 5 and 10 mGy on PCCT, the results were similar for 5 and 10 mGy. For 1 mGy, the results were different, and the enhancement was less pronounced. F50% was higher but still much lower than the results obtained with DSCT, as shown in Table 5.
For the virtual monoenergetic acquisition, TTFAir obtained on both CTs had the same shape, as seen in Figure 4. F50% were a little different at 0.36 vs. 0.40 mm−1 for DSCT and PCCT, respectively. In any case, TTFAir seemed independent of the reconstruction strength levels and CTDIvol on each CT, as seen in Table 6.

3.2.3. Detectability Index

The detectability index comparison is illustrated in Figure 7. The detectability index, d’, of the clinical task was calculated based on the previously described parameters. Without IR, d’ was close on both CTs at 162 versus 137 for PCCT and DSCT, respectively, for polyenergetic acquisitions and 265 versus 238 for PCCT and DSCT, respectively, for virtual monoenergetic acquisitions. Nevertheless, d’ increased more sharply on PCCT than on DSCT for high reconstruction strength levels. In fact, d’ for the highest strength levels for DSCT (ADMIRE 5) were 59% and 67% of d’ for PCCT (QIR 4) for polyenergetic and virtual monoenergetic reconstructions, respectively. In terms of d’ values, the highest level of ADMIRE (5) on DSCT was equivalent to QIR 2 on PCCT (264 vs. 267 and 384 vs. 373 for polyenergetic and virtual monoenergetic acquisitions, respectively).
d’ at different CTDIvol were calculated and increased in the same way for all CTDIvol, 2.8× and 2.4× between WFBP and QIR 4 for polyenergetic and virtual monoenergetic acquisitions, respectively, in Table 7 and Table 8.

4. Discussion

Concerning the detector technology, the PCCT suppresses the electronic noise by defining the first energy threshold just above the electronic noise level (20 keV) [21] but also decreases the noise by suppressing the conversion to light step. However, the noise was of the same magnitude using the polyenergetic reconstruction for both CTs. The PCCT noise using the virtual monoenergetic WFBP reconstruction was higher than that of the DSCT. An explanation could be the generation of the detectors (Stellarinfinity) present on DSCT, which are already designed to reduce electronic noise [4].
For polyenergetic acquisition, NPSs have the same shape on both CTs. The fmean and the fpeak were close, with a maximum difference of 0.04 mm−1 between both CTs for an equivalent reconstruction strength level. For the VMI at 70 keV, the NPS shapes between both CTs were different, as shown in Figure 4; nevertheless, the fmean were close, and the maximum difference in the fpeak was 0.06 mm−1 for the equivalent reconstruction level, as shown in Table 4. The major difference was the shift to low frequencies that is more pronounced for the DSCT. The QIR algorithm seems more constant than ADMIRE, as the shift only appears at the highest reconstruction strength levels with a lower intensity than that of the DSCT.
Sartoretti et al. found similar results for the Bl64 reconstruction kernel, a noise diminution of the same order of magnitude [11]. The noise values for the different QIR levels were 78%, 59%, 43% and 29% of the QIR-off level against 71%, 59%, 43% and 29% in our study. They also observed a shift in fpeak for QIR 4 (−6.7%), which is lower than the shifts observed in our study (−12% for QIR 4 and −7% for QIR 3). An explanation could be the sharpness of the kernel used.
Woeltjen et al. studied image quality on patient images rated by physicians on several criteria [10]. They compared images obtained on an energy-integrating detector CT (EID CT) without IR to images obtained on PCCT without IR and with QIR 2. They found that the noise in the PCCT images with IR was lower than that on EID CT in enlarged images of a part of the lung and the same order on axial slices (the whole lung). Moreover, the CTDIvol used on PCCT were lower than on EID CT. These results confirm the contribution of IR in the diminution in noise in images.
Booij et al. obtained close noise and CNR on both DSCT and PCCT, for water and water with iodine inserts in anthropomorphic phantoms, for VMI at 70 keV using the WFBP reconstruction [9]. Similar results were obtained in this study with a global noise of 8.2 HU on both CTs.
The parenchyma reconstruction kernels used in this study provided an edge enhancement. This results in a TTF over 1 for some spatial frequencies. On PCCT, the most enhanced frequency is 0.38 mm−1, and on DSCT, it is 0.45 mm−1. Moreover, the TTF decreased more rapidly for PCCT (under 0.25 for frequencies over 0.8 mm−1), as it was over 0.5 at 0.8 mm−1 for all reconstruction strength levels for DSCT. On DSCT, we found TTF behavior similar to a study of Solomon et al. [22], namely, that TTF increased with reconstruction strength levels, but this study was for different contrasts because their reconstruction kernel was suitable for soft tissues.
Moreover, the parenchyma reconstruction kernels used for PCCT were not the ones used in clinical routine for PCCT. Most acquisitions are performed with ultra-high spatial resolution modes using the Bl60 reconstruction kernel, and Sartoretti et al. [11] chose a Bl64 reconstruction kernel to analyze image quality on patient images, which can correspond to clinical routine as well. A study could be conducted on the influence of the reconstruction kernel on ultra-high spatial resolution images obtained with PCCT.
Sartoretti et al. [11] showed that spatial resolution decreased slightly when QIR increased for high contrast with the Bl64 reconstruction kernel. We did not observe a TTF dependence with QIR levels: the TTF shapes were unchanged for QIR 1 to 3, and the WFBP and QIR 4 TTF were superimposed. Their fpeak was around 0.4 mm−1, which is very close to our result. However, their f50% was higher than ours, reflecting a better spatial resolution. These differences could be explained by the edge spread functions (ESFs) around the insert rod used to compute TTF: Sartoretti et al. based their study on seventy-two radial ESFs with a 10-degree angular aperture, whereas imQuest software was developed from TG-233 recommendations [19] with radial bin widths of 1/10th the image pixel size (0.06 mm). With the 20 cm diameter phantom, the spatial resolution (characterized by TTF) was identical for 5 and 10 mGy, but the edge enhancement was less marked for 1 mGy and complemented by a slight gain for spatial frequencies greater than 0.7 mm−1.
An important difference in image acquisition to obtain VMI is the use of only one X-ray tube on PCCT. The second X-ray tube is used for high-pitch or cardiac imaging. Consequently, the acquisition parameters cannot be similar on the two CTs in the VMI. However, these parameters are close to clinical routine, which allows the comparison of the results, as performed by Liu et al. [23]. The TTFs at 70 keV VMI were independent of reconstruction levels on both CTs. The PCCT TTFs were also independent of the value of the CTDIvol. The difference in f50% between the two CTs was 0.05 mm−1 (0.40 mm−1 for PCCT and 0.35 mm−1 for DSCT). The VMI spatial resolution has not been studied so far using TTF [9,24,25]. One limitation of our study was that the TTF was analyzed for only one VMI at 70 keV. It would be very interesting to know if this independence of the TTF from the reconstruction kernel and dose level appeared for other VMI energies.
In our acquisition conditions, the TTFs were little influenced by reconstruction strength levels and dose levels using the polyenergetic reconstruction. The TTFs using the VMI reconstruction were unchanged, whatever the reconstruction strength and dose levels for both CT scanners. The detectability index, therefore, increased proportionally with the noise diminution due to the increase in the reconstruction strength level and dose. As expected, the highest detectability index was obtained on PCCT for 10 mGy at QIR 4. Sartoretti et al. showed a spatial resolution reduction with a reconstruction strength level increase [11]. They concluded that QIR 3 was the best compromise strength between noise reduction and spatial resolution.
Si-Mohamed et al. investigated the differences in image quality and detectability between various CT scanners and algorithms for Philips [14,16]. A smaller noise gap between the DSCT and the PCCT of the Siemens company was observed compared to the Philips CT. Furthermore, the Philips PCCT images produced a ring artifact, which was highlighted at low NPS frequencies. The detectability index increased much faster for PCCT than DSCT on the Siemens CT scanners, which is in contrast to the results obtained for the Philips preclinical prototype [14]. However, Si-Mohamed et al. and our study found a PCCT detectability increase compared to energy-integrating detector CTs for solid lung nodules, improving the clinical routine.
Bartlett et al. [15], who compared patient images on energy-integrated detector CT and PCCT for WFBP, found a better nodule detection for only one reader of two for PCCT images. Our WFBP results are in accordance with close detectability indices: 137 and 162 for DSCT and PCCT, respectively, for polyenergetic acquisition.
The detectability indices calculated in our study are also higher than those in a study of Si-Mohamed et al. for the same contrast. This could be explained, in part, by a different clinical task, as we took a nodule of 5 mm diameter against 4 mm [14].
Another limitation of our study came from the absence of scoring images by a radiologist. Even if the detectability index aims to reproduce the radiologist’s eyes, it does not consider the radiologist’s feeling in front of the image. It was proven in a previous study that even though the detectability index increased and noise decreased, radiologists do not rate the image quality as better [11,14]. Those images were qualified as “artificial”. Moreover, only one energy VMI was studied. A further study could provide different VMI energies to characterize the benefit of the different reconstructions to diagnostic tasks.

5. Conclusions

The PCCT outperformed the DSCT with a better detectability index of the solid nodule in the lung. The virtual monoenergetic reconstruction showed its superiority in terms of noise level before running the iterative reconstruction and in terms of TTF.

Author Contributions

Conceptualization, M.D. and J.-B.M.; formal analysis, M.D. and J.-B.M.; investigation, J.-B.M.; data curation, M.D.; writing—original draft preparation, M.D.; writing—review and editing, M.D., F.D., J.-B.M., L.D. and M.R.; supervision, F.D. All authors have read and agreed to the published version of the manuscript.

Funding

This research received no external funding.

Institutional Review Board Statement

Not applicable.

Informed Consent Statement

Not applicable.

Data Availability Statement

Not applicable.

Conflicts of Interest

The authors declare no conflict of interest.

References

  1. Booij, R.; Budde, R.P.J.; Dijkshoorn, M.L.; van Straten, M. Technological developments of X-ray computed tomography over half a century: User’s influence on protocol optimization. Eur. J. Radiol. 2020, 131, 109261. [Google Scholar] [CrossRef] [PubMed]
  2. Flohr, T.G.; McCollough, C.H.; Bruder, H.; Petersilka, M.; Gruber, K.; Süβ, C.; Grasruck, M.; Stierstorfer, K.; Krauss, B.; Raupach, R.; et al. First performance evaluation of a dual-source CT (DSCT) system. Eur. Radiol. 2006, 16, 256–268. [Google Scholar] [CrossRef] [PubMed]
  3. Greffier, J.; Villani, N.; Defez, D.; Dabli, D.; Si-Mohamed, S. Spectral CT imaging: Technical principles of dual-energy CT and multi-energy photon-counting CT. In Diagnostic and Interventional Imaging; Elsevier Masson s.r.l.: Amsterdam, The Netherlands, 2022. [Google Scholar] [CrossRef]
  4. Flohr, T.; Schmidt, B.; Merz, J.; Aulbach, P. Somatom Force Get Two Steps Ahead with Dual Source CT, 2018, Computed Tomography, Siemens Healthcare GmbH, Forchheim, Germany, White Paper. Available online: https://ctmeeting.shpci.org/data/CT_SOMATOM-Force_Whitepaper_DualSource_HOOD05162002908728_152104378.pdf (accessed on 26 March 2023).
  5. Rajendran, K.; Petersilka, M.; Henning, A.; Shanblatt, E.R.; Schmidt, B.; Flohr, T.G.; Ferrero, A.; Baffour, F.; Diehn, F.E.; Yu, L.; et al. First Clinical Photon-counting Detector CT System: Technical Evaluation. Radiology 2022, 303, 130–138. [Google Scholar] [CrossRef] [PubMed]
  6. Willemink, M.J.; Persson, M.; Pourmorteza, A.; Pelc, N.J.; Fleischmann, D. Photon-counting CT: Technical principles and clinical prospects. Radiology 2018, 289, 293–312. [Google Scholar] [CrossRef] [PubMed]
  7. Flohr, T.; Petersilka, M.; Henning, A.; Ulzheimer, S.; Ferda, J.; Schmidt, B. Photon-counting CT review. In Physica Medica; Elsevier B.V. for the European Federation of Organisations for Medical Physics (EFOMP) and Associazione Italiana di Fisica Medica (AIFM): Amsterdam, the Netherlands, 2020; Volume 79, pp. 126–136. [Google Scholar] [CrossRef]
  8. Tortora, M.; Gemini, L.; D’iglio, I.; Ugga, L.; Spadarella, G.; Cuocolo, R. Spectral Photon-Counting Computed Tomography: A Review on Technical Principles and Clinical Applications. J. Imaging 2022, 8, 112. [Google Scholar] [CrossRef] [PubMed]
  9. Booij, R.; van der Werf, N.R.; Dijkshoorn, M.L.; van der Lugt, A.; van Straten, M. Assessment of Iodine Contrast-To-Noise Ratio in Virtual Monoenergetic Images Reconstructed from Dual-Source Energy-Integrating CT and Photon-Counting CT Data. Diagnostics 2022, 12, 1467. [Google Scholar] [CrossRef] [PubMed]
  10. Woeltjen, M.M.; Niehoff, J.H.; Michael, A.E.; Horstmeier, S.; Moenninghoff, C.; Borggrefe, J.; Kroeger, J.R. Low-Dose High-Resolution Photon-Counting CT of the Lung: Radiation Dose and Image Quality in the Clinical Routine. Diagnostics 2022, 12, 1441. [Google Scholar] [CrossRef] [PubMed]
  11. Sartoretti, T.; Racine, D.; Mergen, V.; Jungblut, L.; Monnin, P.; Flohr, T.G.; Martini, K.; Frauenfelder, T.; Alkadhi, H.; Euler, A. Quantum Iterative Reconstruction for Low-Dose Ultra-High-Resolution Photon-Counting Detector CT of the Lung. Diagnostics 2022, 12, 522. [Google Scholar] [CrossRef] [PubMed]
  12. Hagen, F.; Hofmann, J.; Wrazidlo, R.; Gutjahr, R.; Schmidt, B.; Faby, S.; Nikolaou, K.; Horger, M. Image quality and dose exposure of contrast-enhanced abdominal CT on a 1st generation clinical dual-source photon-counting detector CT in obese patients vs. a 2nd generation dual-source dual energy integrating detector CT. Eur. J. Radiol. 2022, 151, 110325. [Google Scholar] [CrossRef] [PubMed]
  13. Sartoretti, T.; Landsmann, A.; Nakhostin, D.; Eberhard, M.; Roeren, C.; Mergen, V.; Higashigaito, K.; Raupach, R.; Alkadhi, H.; Euler, A. Quantum Iterative Reconstruction for Abdominal Photon-counting Detector CT Improves Image Quality. Radiology 2022, 303, 339–348. [Google Scholar] [CrossRef] [PubMed]
  14. Si-Mohamed, S.A.; Greffier, J.; Miailhes, J.; Boccalini, S.; Rodesch, P.-A.; Vuillod, A.; van der Werf, N.; Dabli, D.; Racine, D.; Rotzinger, D.; et al. Comparison of image quality between spectral photon-counting CT and dual-layer CT for the evaluation of lung nodules: A phantom study. Eur. Radiol. 2022, 32, 524–532. [Google Scholar] [CrossRef] [PubMed]
  15. Bartlett, D.J.; Koo, C.W.; Bartholmai, B.J.; Rajendran, K.; Weaver, J.M.; Halaweish, A.F.; Leng, S.; McCollough, C.H.; Fletcher, J.G. High-Resolution Chest Computed Tomography Imaging of the Lungs: Impact of 1024 Matrix Reconstruction and Photon-Counting Detector Computed Tomography. Investig. Radiol. 2019, 54, 129–137. [Google Scholar] [CrossRef] [PubMed]
  16. Si-Mohamed, S.A.; Boccalini, S.; Villien, M.; Yagil, Y.; Erhard, K.; Boussel, L.; Douek, P.C. First Experience with a Whole-Body Spectral Photon-Counting CT Clinical Prototype. Investig. Radiol. 2023. [Google Scholar] [CrossRef] [PubMed]
  17. Ministère des Solidarités et de la Santé. Arrêté du 23 mai 2019 Portant Homologation de la Décision no 2019-DC-0667 de l’Autorité de Sûreté Nucléaire du 18 avril 2019 Relative aux Modalités D’évaluation des Doses de Rayonnements Ionisants Délivrées aux Patients lors d’un acte de Radiologie, de Pratiques Interventionnelles Radioguidées ou de Médecine Nucléaire et à la Mise à jour des Niveaux de Référence Diagnostiques Associés; Ministère des Solidarités et de la Santé: Paris, France, 2019. [Google Scholar]
  18. Ministère de la santé, de la jeunesse et des sports. Décision du 22 Novembre 2007 Fixant les Modalités du Contrôle de Qualité des Scanographes; Ministère des Solidarités et de la Santé: Paris, France, 2007. [Google Scholar]
  19. Samei, E.; Bakalyar, D.; Boedeker, K.L.; Brady, S.; Fan, J.; Leng, S.; Myers, K.J.; Popescu, L.M.; Giraldo, J.C.R.; Ranallo, F.; et al. Performance evaluation of computed tomography systems: Summary of AAPM Task Group 233. Med. Phys. 2019, 46, e735–e756. [Google Scholar] [CrossRef] [PubMed] [Green Version]
  20. Ott, J.G.; Becce, F.; Monnin, P.; Schmidt, S.; Bochud, F.O.; Verdun, F.R. Update on the non-prewhitening model observer in computed tomography for the assessment of the adaptive statistical and model-based iterative reconstruction algorithms (Physics in Medicine & Biology (2014) 59 (4047–4064)). In Physics in Medicine and Biology; Institute of Physics Publishing: Bristol, UK, 2014; Volume 59, p. 5203. [Google Scholar] [CrossRef] [Green Version]
  21. Solomon, J.B.; Christianson, O.; Samei, E. Quantitative comparison of noise texture across CT scanners from different manufacturers. Med. Phys. 2012, 39, 6048–6055. [Google Scholar] [CrossRef] [PubMed]
  22. Solomon, J.; Wilson, J.; Samei, E. Characteristic image quality of a third generation dual-source MDCT scanner: Noise, resolution, and detectability. Med. Phys. 2015, 42, 4941–4953. [Google Scholar] [CrossRef] [PubMed]
  23. Liu, L.P.; Shapira, N.; Chen, A.A.; Shinohara, R.T.; Sahbaee, P.; Schnall, M.; Litt, H.I.; Noël, P.B. First-generation clinical dual-source photon-counting CT: Ultra-low-dose quantitative spectral imaging. Eur. Radiol. 2022, 32, 8579–8587. [Google Scholar] [CrossRef] [PubMed]
  24. Racine, D.; Mergen, V.; Viry, A.; Eberhard, M.M.; Becce, F.; Rotzinger, D.C.; Alkadhi, H.M.; Euler, A. Photon-Counting Detector CT with Quantum Iterative Reconstruction Impact on Liver Lesion Detection and Radiation Dose Reduction. Investig. Radiol. 2022. [Google Scholar] [CrossRef]
  25. Michael, A.E.; Boriesosdick, J.; Schoenbeck, D.; Woeltjen, M.M.; Saeed, S.; Kroeger, J.R.; Horstmeier, S.; Lennartz, S.; Borggrefe, J.; Niehoff, J.H. Image-Quality Assessment of Polyenergetic and Virtual Monoenergetic Reconstructions of Unenhanced CT Scans of the Head: Initial Experiences with the First Photon-Counting CT Approved for Clinical Use. Diagnostics 2022, 12, 265. [Google Scholar] [CrossRef]
Figure 1. Visualization of the two relevant modules of the CATPHAN phantom and imQuest ROI for physical metrics evaluation. The left picture shows the homogeneous module, and the right picture is the module with the inserts.
Diagnostics 13 01325 g001
Figure 2. Noise power spectra curves using polyenergetic reconstruction with a CTDIvol of 10 mGy when increasing the iteration level of the reconstruction algorithm for the DSCT (A) and the PCCT (B).
Diagnostics 13 01325 g002
Figure 3. Noise power spectra curves in the case of polyenergetic reconstruction, with a CTDIvol of 10 mGy in red, 5 mGy in black and 1 mGy in green, when increasing the iteration level of the reconstruction algorithm for the DSCT (A) and the PCCT (B). WFBP—weighted filtered back projection and AD—ADMIRE.
Diagnostics 13 01325 g003
Figure 4. Noise power spectra curves in the case of monoenergetic images for a CTDIvol of 10 mGy when increasing the reconstruction level for the DSCT (A) and the PCCT (B).
Diagnostics 13 01325 g004
Figure 5. Noise power spectra curves in the case of virtual monoenergetic reconstruction, with a CTDIvol of 10 mGy in red, 5 mGy in black and 1 mGy in green, when increasing the iteration level of the reconstruction algorithm for the DSCT (A) and the PCCT (B). WFBP—weighted filtered back projection and AD—ADMIRE.
Diagnostics 13 01325 g005
Figure 6. TTFAir obtained on both CTs for polyenergetic and virtual monoenergetic acquisitions for 3 reconstruction strength levels at 10 mGy.
Diagnostics 13 01325 g006
Figure 7. Detectability index on both CTs for polyenergetic (Bl56 and Bl57) and virtual monoenergetic (Qr40) acquisitions and for all reconstruction strength levels.
Diagnostics 13 01325 g007
Table 1. Acquisition and reconstruction parameters for the PCCT and DSCT scanners.
ParenchymaVMI 70 keV
DSCT (1) *PCCT (2) *DSCT (3) *PCCT (4) *
TubeAAA + BA
High voltage (kV)12012080/Sn 150120
Collimation (mm)57.657.657.657.6
Pitch1.51.511
Exposure time per rotation (s)0.50.50.250.25
Field of view (mm)300300300300
Matrix size (pixels)512 × 512512 × 512512 × 512512 × 512
Reconstruction strength levels WFBP +
ADMIRE 1 to 5
WFBP + QIR 1 to 4WFBP +
ADMIRE 1 to 5
WFBP + QIR 1 to 4
* acquisition number. DSCT—dual-source CT; PCCT—photon-counting CT; VMI—virtual monoenergetic imaging; WFBP—weighted filtered back projection; QIR—quantum iterative reconstruction; ADMIRE—Advanced Modeled Iterative Reconstruction.
Table 2. HU mean values in the air insert and in the background were measured for the CTDIvol of 10 mGy. The acquisition number correspondence is indicated in Table 1.
Acquisition1234
HU (air)−983−1042−968−1007
HU (background)98949597
Contrast1081113610631104
Table 3. Global noise and its noise reduction in percentages relative to WFBP, peak frequency (fpeak) and averaged frequency (fmean) values for all reconstruction levels for both CTs.
DSCT PCCT
Noise
(HU)
fpeak
(mm−1)
fmean
(mm−1)
Noise
(HU)
fpeak
(mm−1)
fmean
(mm−1)
WFBP54.80.460.4750.00.440.44
147.1 (−14.1%) *0.460.4635.7 (−28.6%) *0.430.43
239.4 (−28.1%) *0.460.4528.5 (−43.0%) *0.430.43
331.8 (−42.0%) *0.440.4421.4 (−57.2%) *0.410.42
424.2 (−55.8%) *0.430.4214.4 (−71.2%) *0.390.4
516.8 (−69.3%) *0.350.38---
*: noise reduction in percentages relative to WFBP.
Table 4. Global noise and its noise reduction in percentages relative to WFBP, peak frequency (fpeak) and averaged frequency (fmean) values for all reconstruction levels for both CTs for a 10 mGy acquisition.
DSCT PCCT
Noise
(HU)
fpeak
(mm−1)
fmean
(mm−1)
Noise (HU)fpeak
(mm−1)
fmean
(mm−1)
WFBP9.00.250.2910.70.190.28
18.2 (−8.9%) *0.220.288.2 (−23.4%) *0.190.28
27.4 (−17.8%) *0.220.276.9 (−35.5%) *0.190.27
36.6 (−26.7%) *0.200.265.6 (−47.7%) *0.190.27
45.6 (−37.8%) *0.170.254.4 (−58.9%) *0.190.26
54.5 (−50.0%) *0.160.23---
*: noise reduction in percentages relative to WFBP.
Table 5. F50% (mm−1) of PCCT and DSCT for polyenergetic acquisitions for all reconstruction strength levels and for the three CTDIvol (1, 5, 10 mGy).
DSCT-Bl57PCCT-Bl56
10 mGy5 mGy1 mGy10 mGy5 mGy1 mGy
WFBP0.970.960.910.730.750.75
11.131.061.170.750.760.77
21.231.181.240.750.760.79
31.291.251.280.750.770.80
41.401.391.320.730.760.82
51.491.481.34---
Table 6. F50% (mm−1) of PCCT and DSCT for virtual monoenergetic acquisition for all reconstruction strength levels and for the three CTDIvol (1, 5, 10 mGy).
DSCTPCCT
10 mGy5 mGy1 mGy10 mGy5 mGy1 mGy
WFBP0.350.350.350.390.390.39
10.360.350.350.400.390.39
20.360.350.350.400.390.39
30.360.350.350.400.400.40
40.360.350.350.400.400.40
50.360.360.35---
Table 7. Detectability index values when varying the IR level and the CTDIvol for the PCCT scanner for polyenergetic acquisition.
Reconstruction Strength Level10 mGy5 mGy1 mGy
016211049
122015367
226718482
3337233103
4451311140
Table 8. Detectability index values when varying the IR level and the CTDIvol for the PCCT scanner for virtual monoenergetic acquisition.
Reconstruction Strength Level10 mGy5 mGy1 mGy
023817581
1316227106
2373268124
3453325151
4576413192
Disclaimer/Publisher’s Note: The statements, opinions and data contained in all publications are solely those of the individual author(s) and contributor(s) and not of MDPI and/or the editor(s). MDPI and/or the editor(s) disclaim responsibility for any injury to people or property resulting from any ideas, methods, instructions or products referred to in the content.

