
Impact of Breathing Phase, Liver Segment, and Prandial State on Ultrasound Shear Wave Speed, Shear Wave Dispersion, and Attenuation Imaging of the Liver in Healthy Volunteers
 , ,
, ,
Abstract
:1. Introduction
2. Materials and Methods
2.1. Study Design
- a
- Following inspiration (Right Inspiration Fasting, RIF);
- b
- In the left lobe (Left Expiration Fasting, LEF);
- c
- With volunteers in a nonfasting state (Right Expiration Nonfasting, RENF).
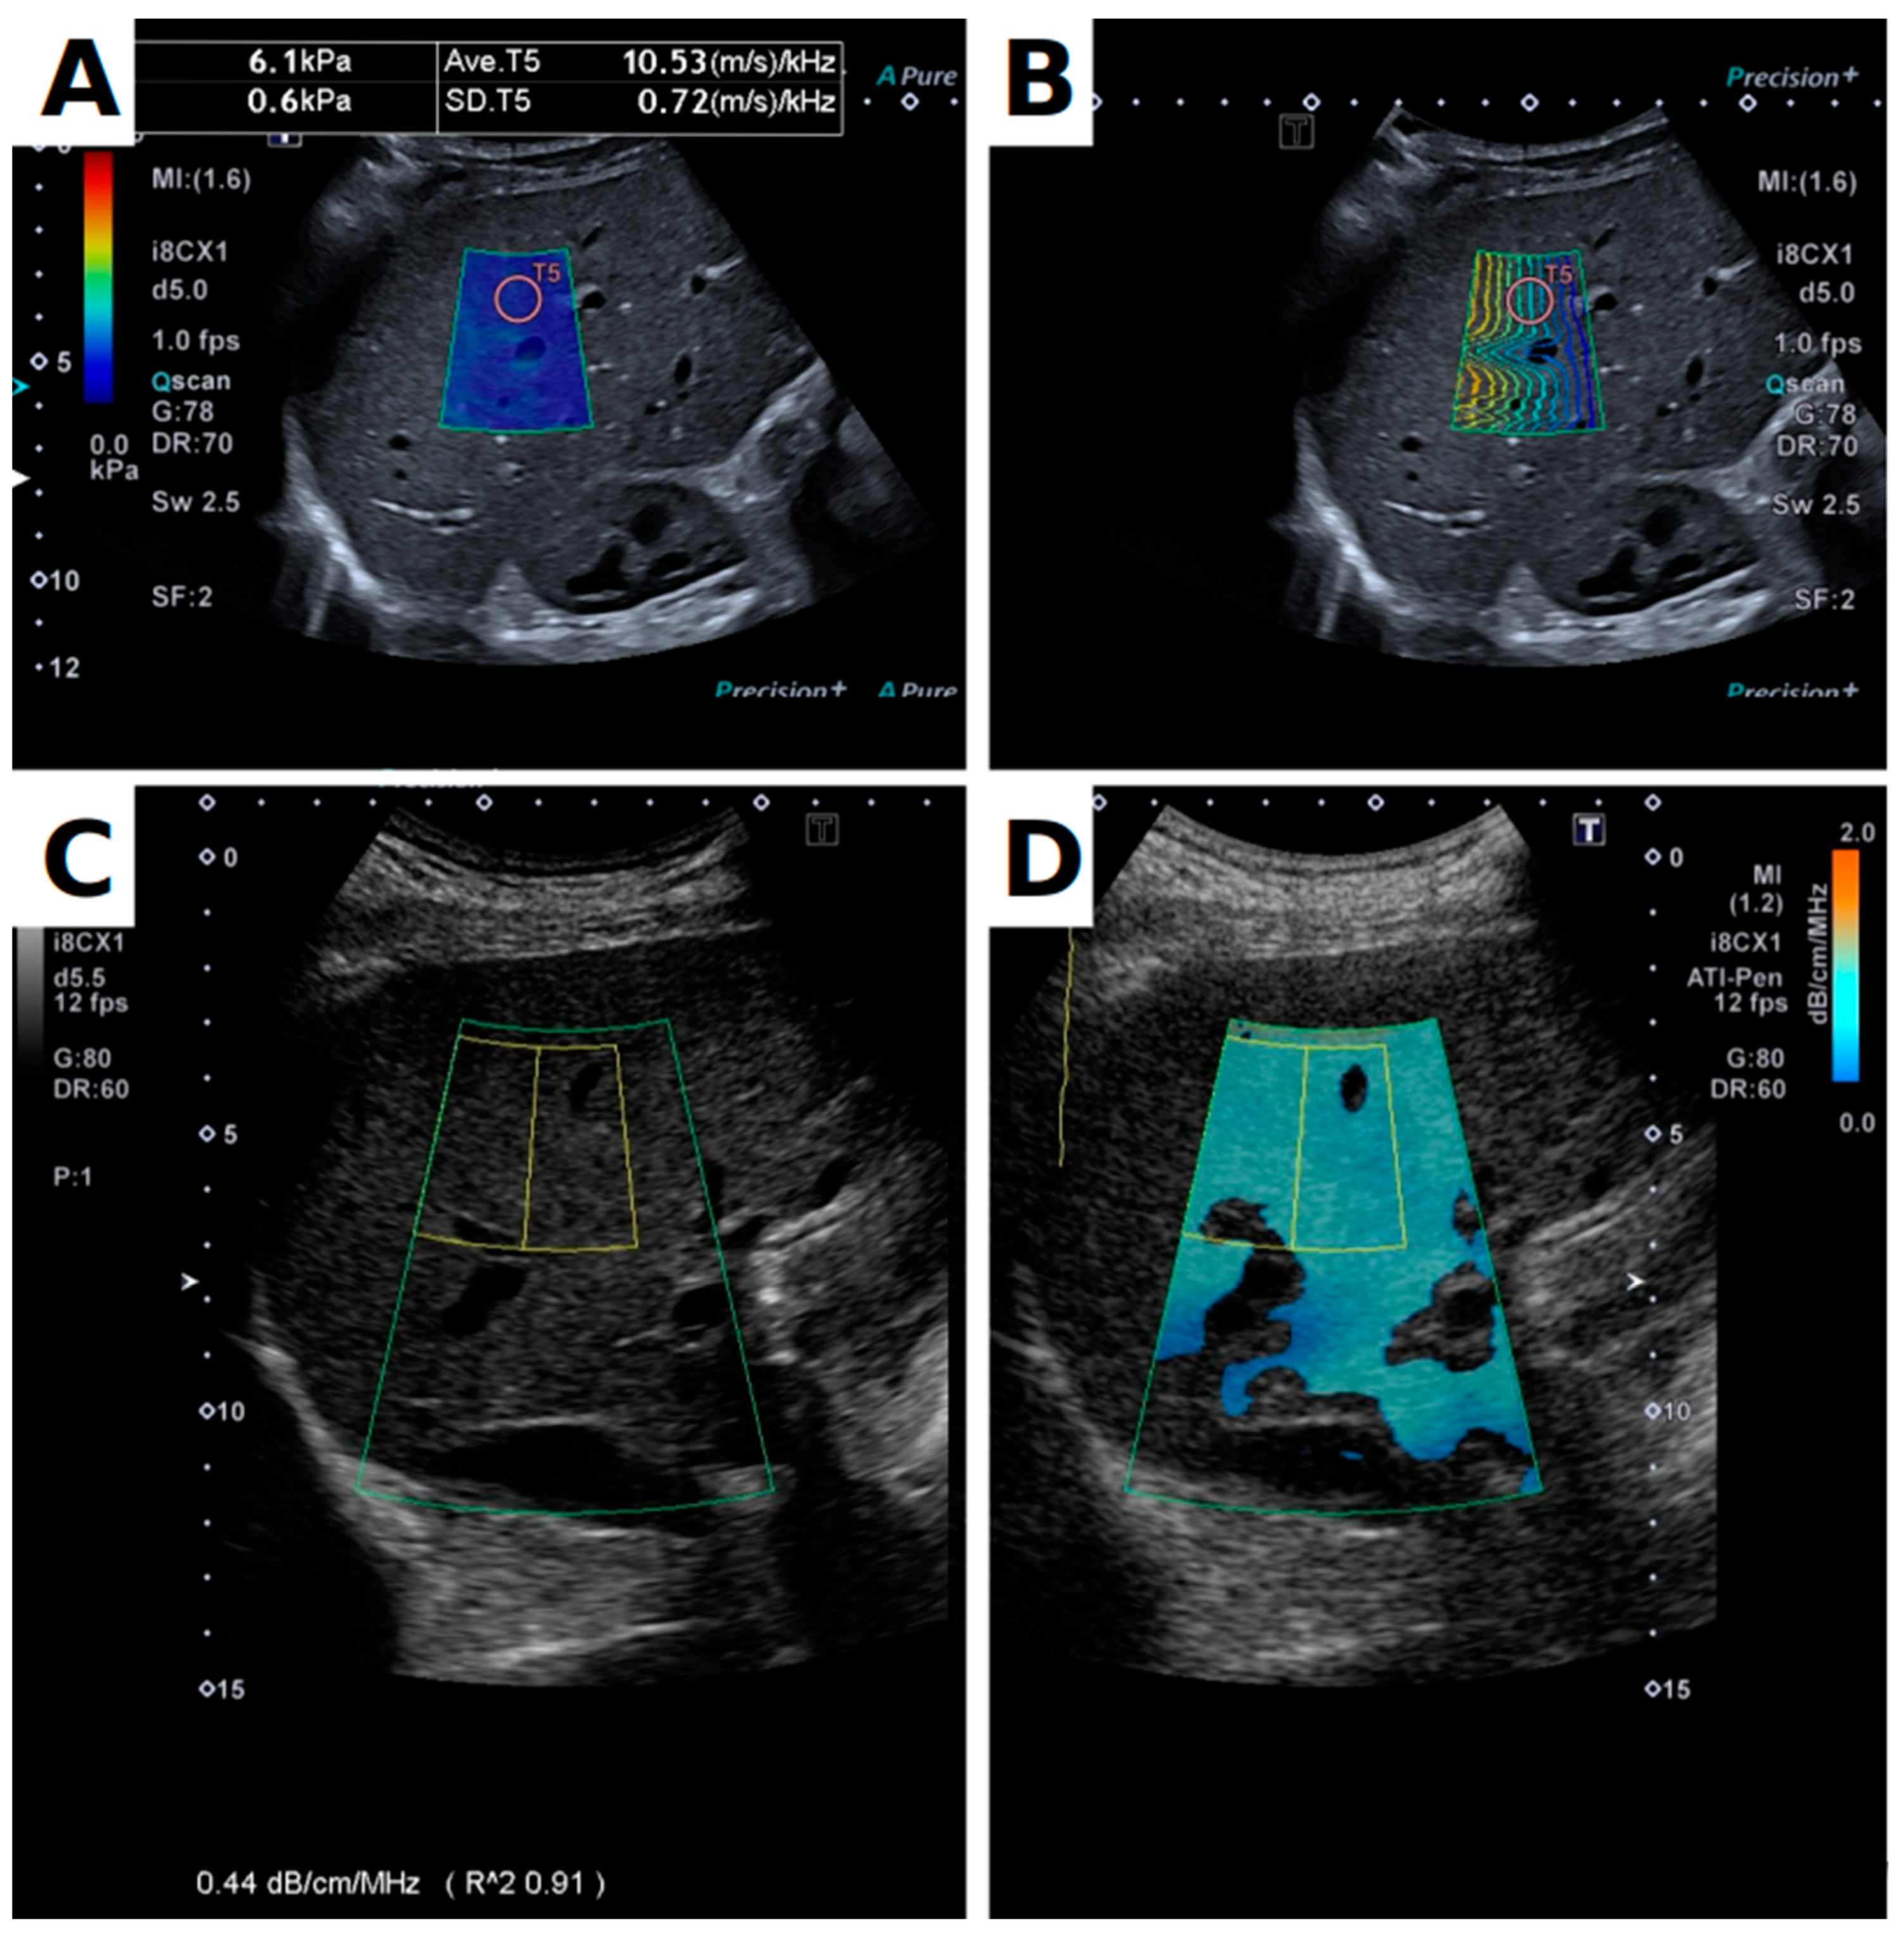
2.2. Equipment and Protocol
2.3. Data Processing and Statistics
3. Results
3.1. Data Quality
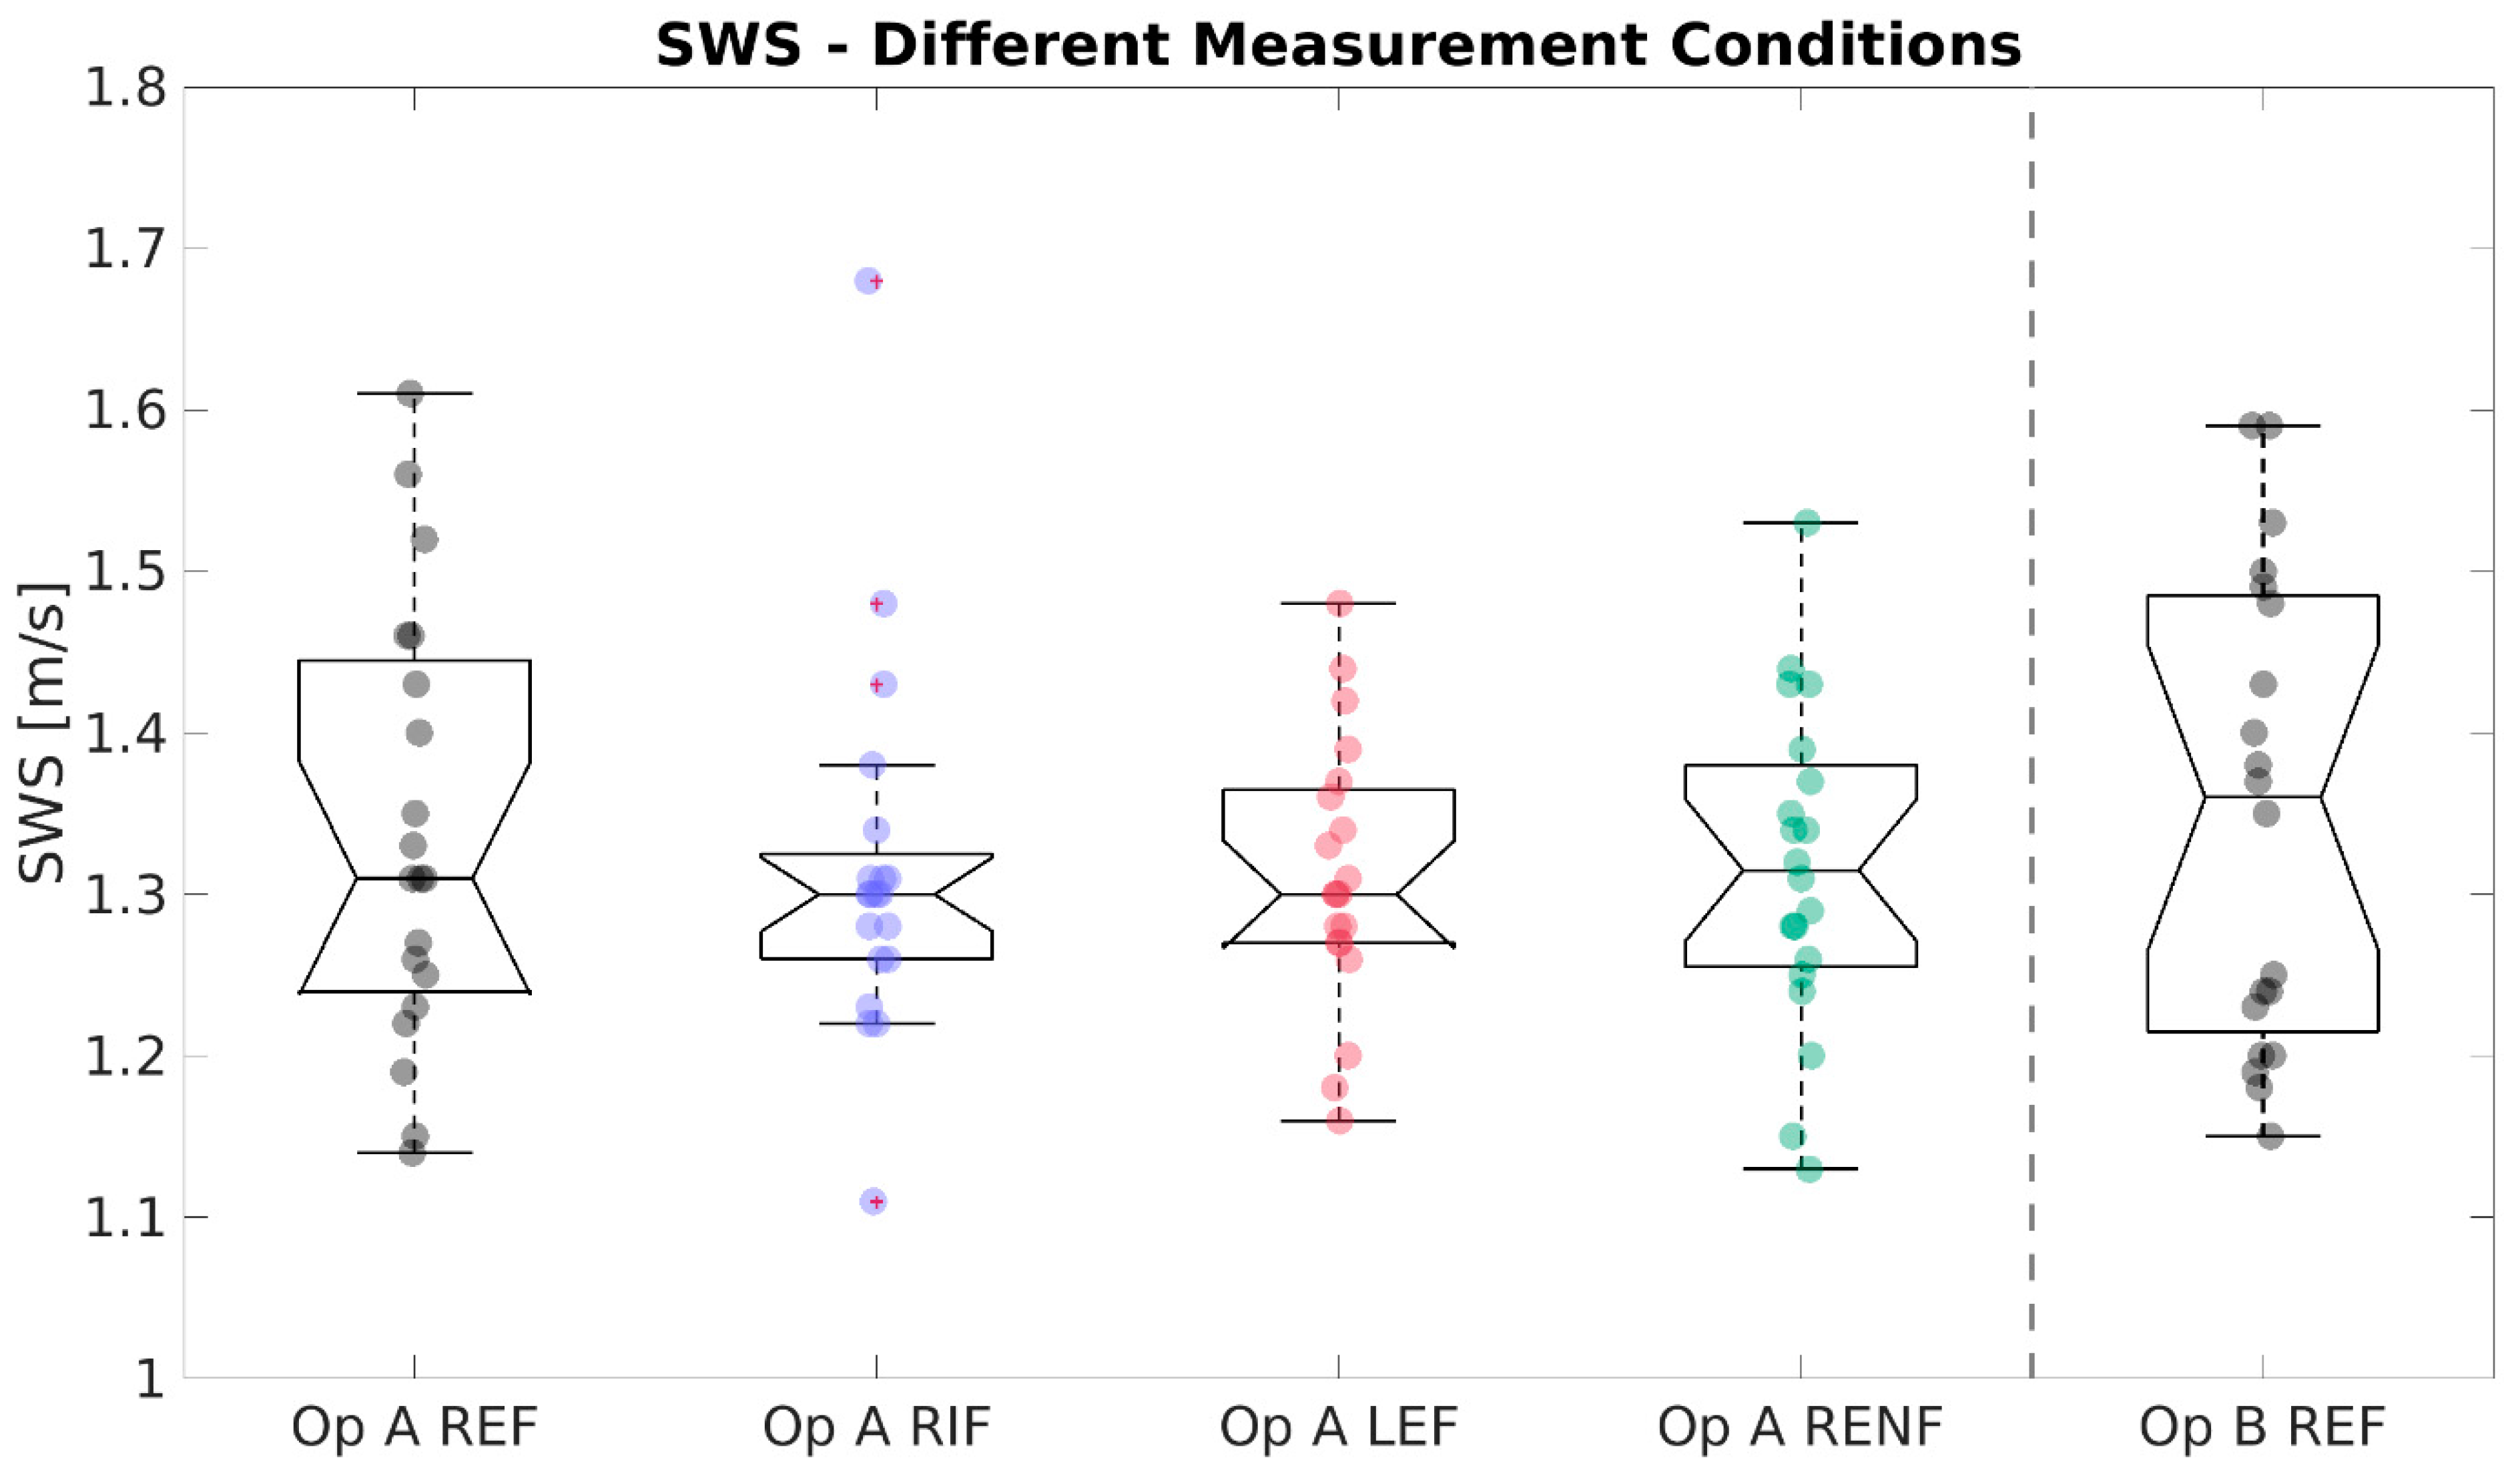
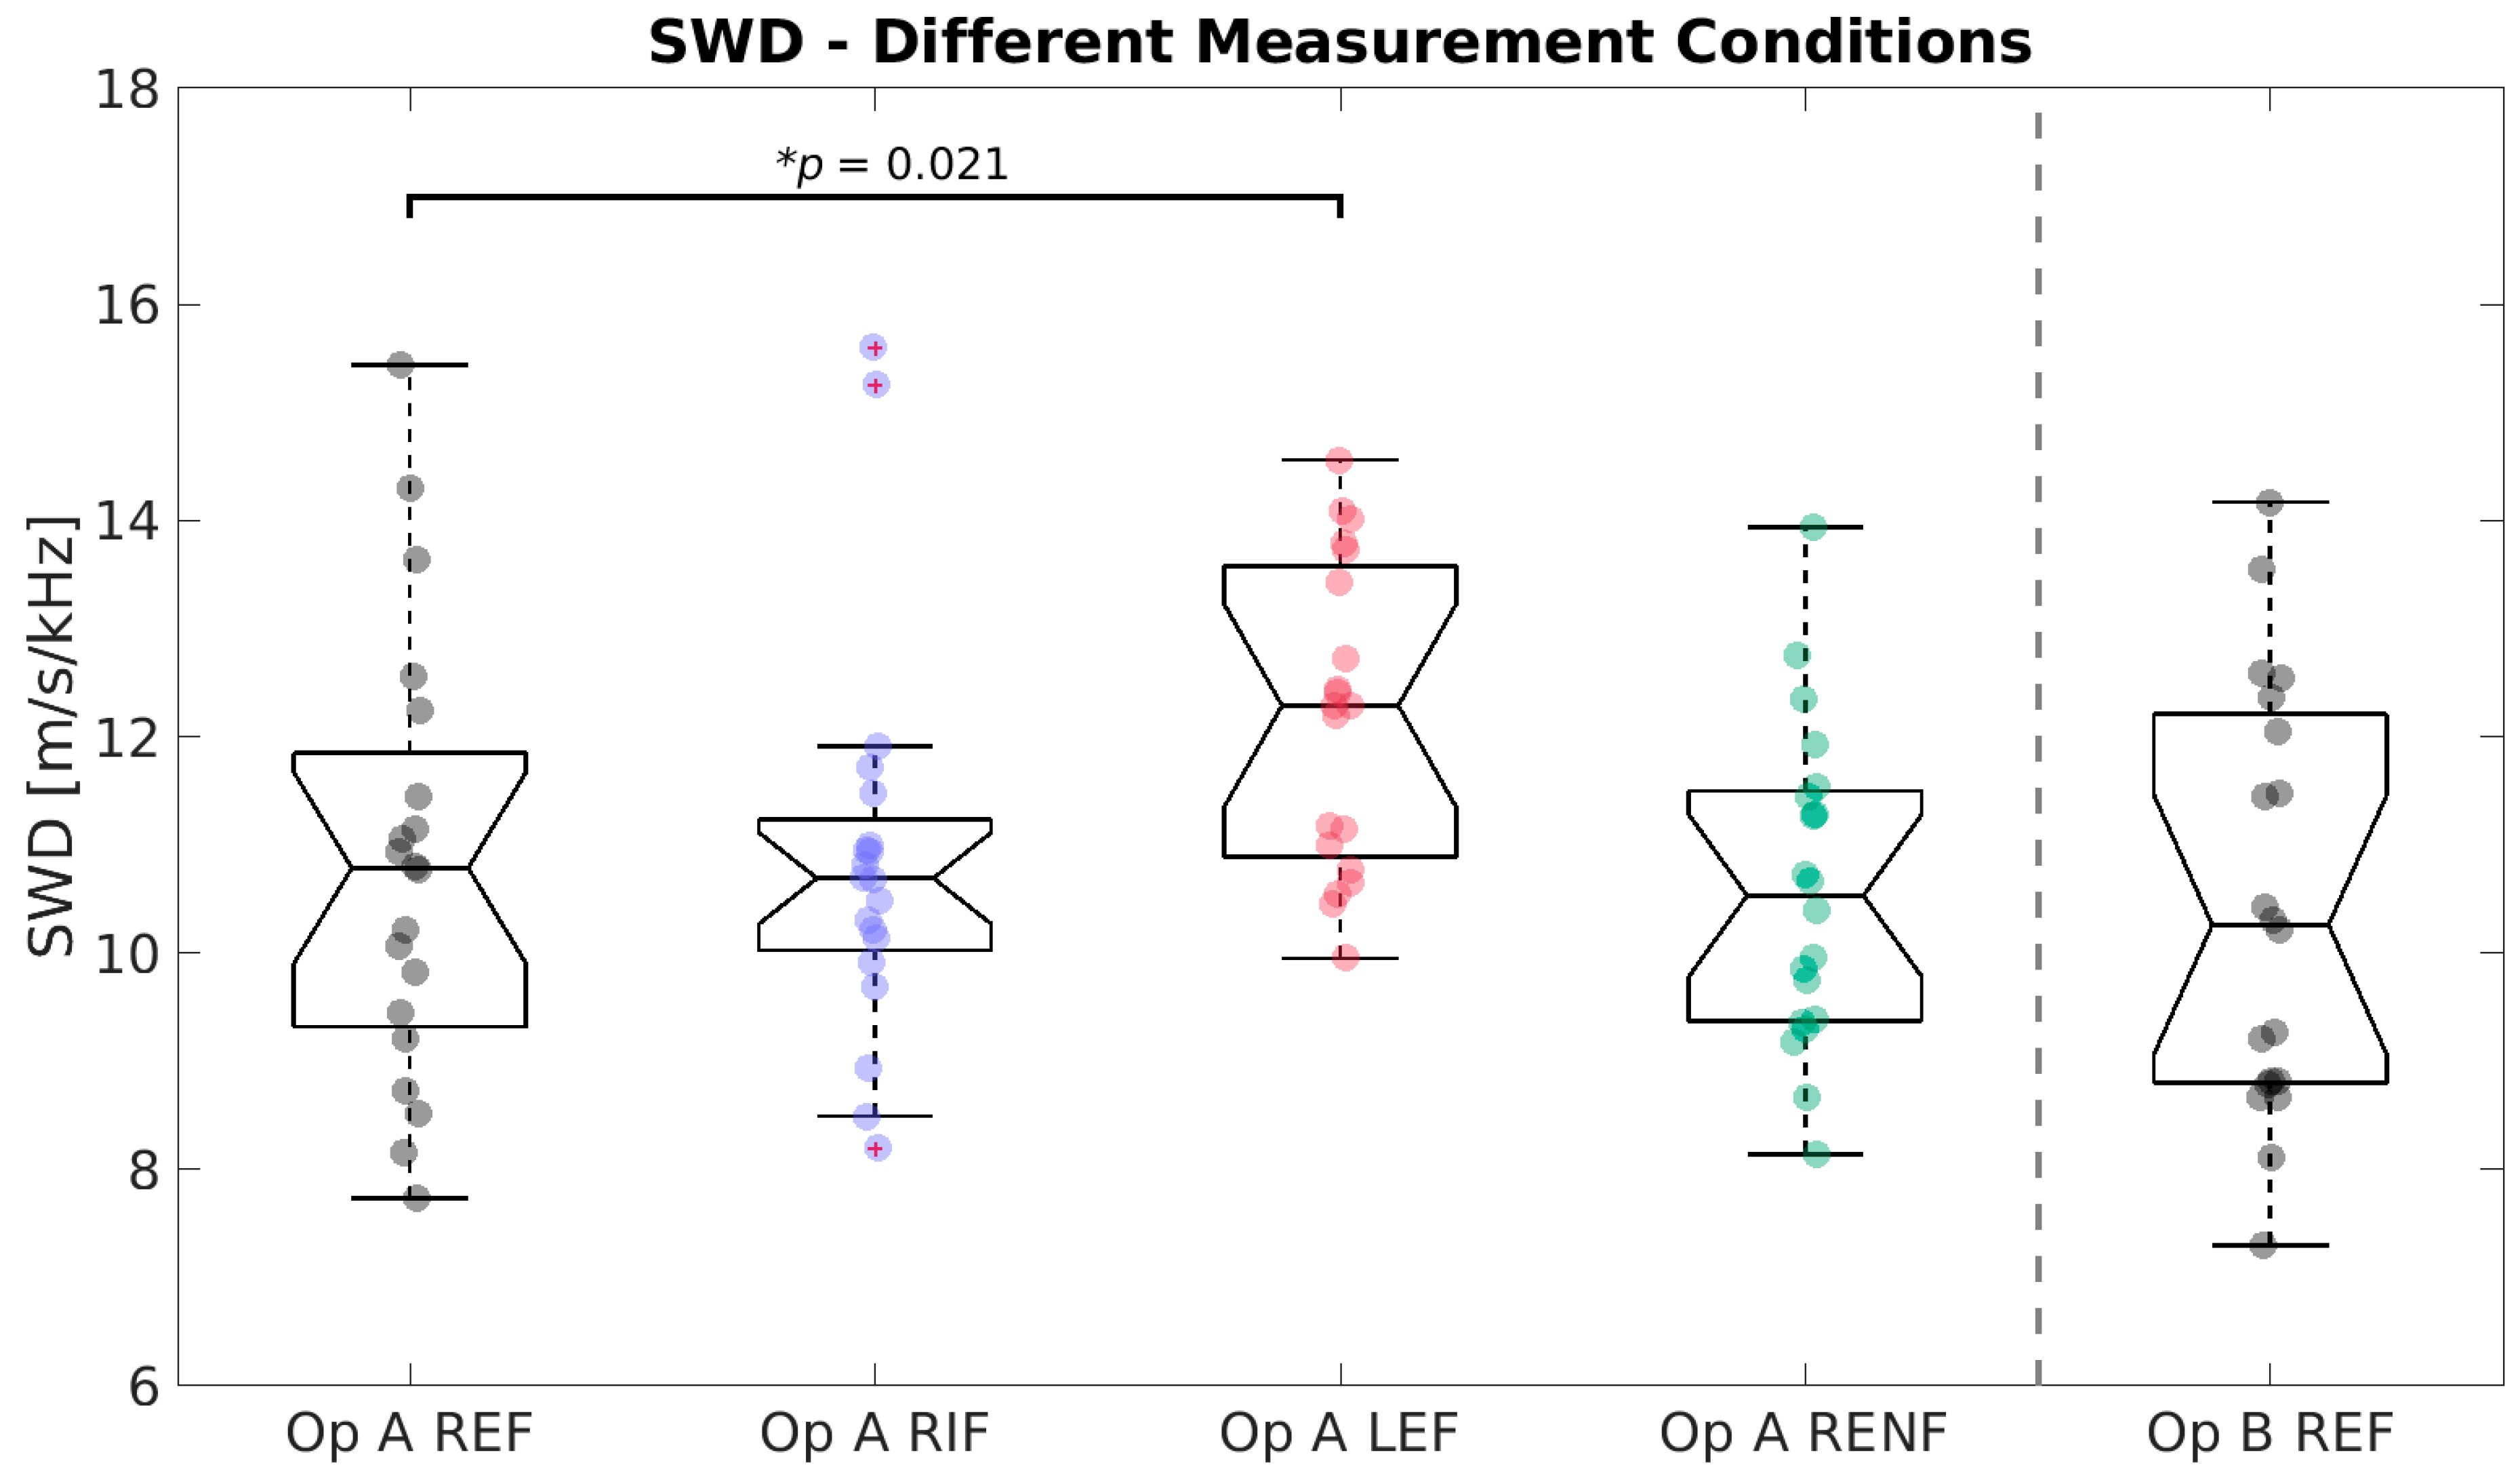
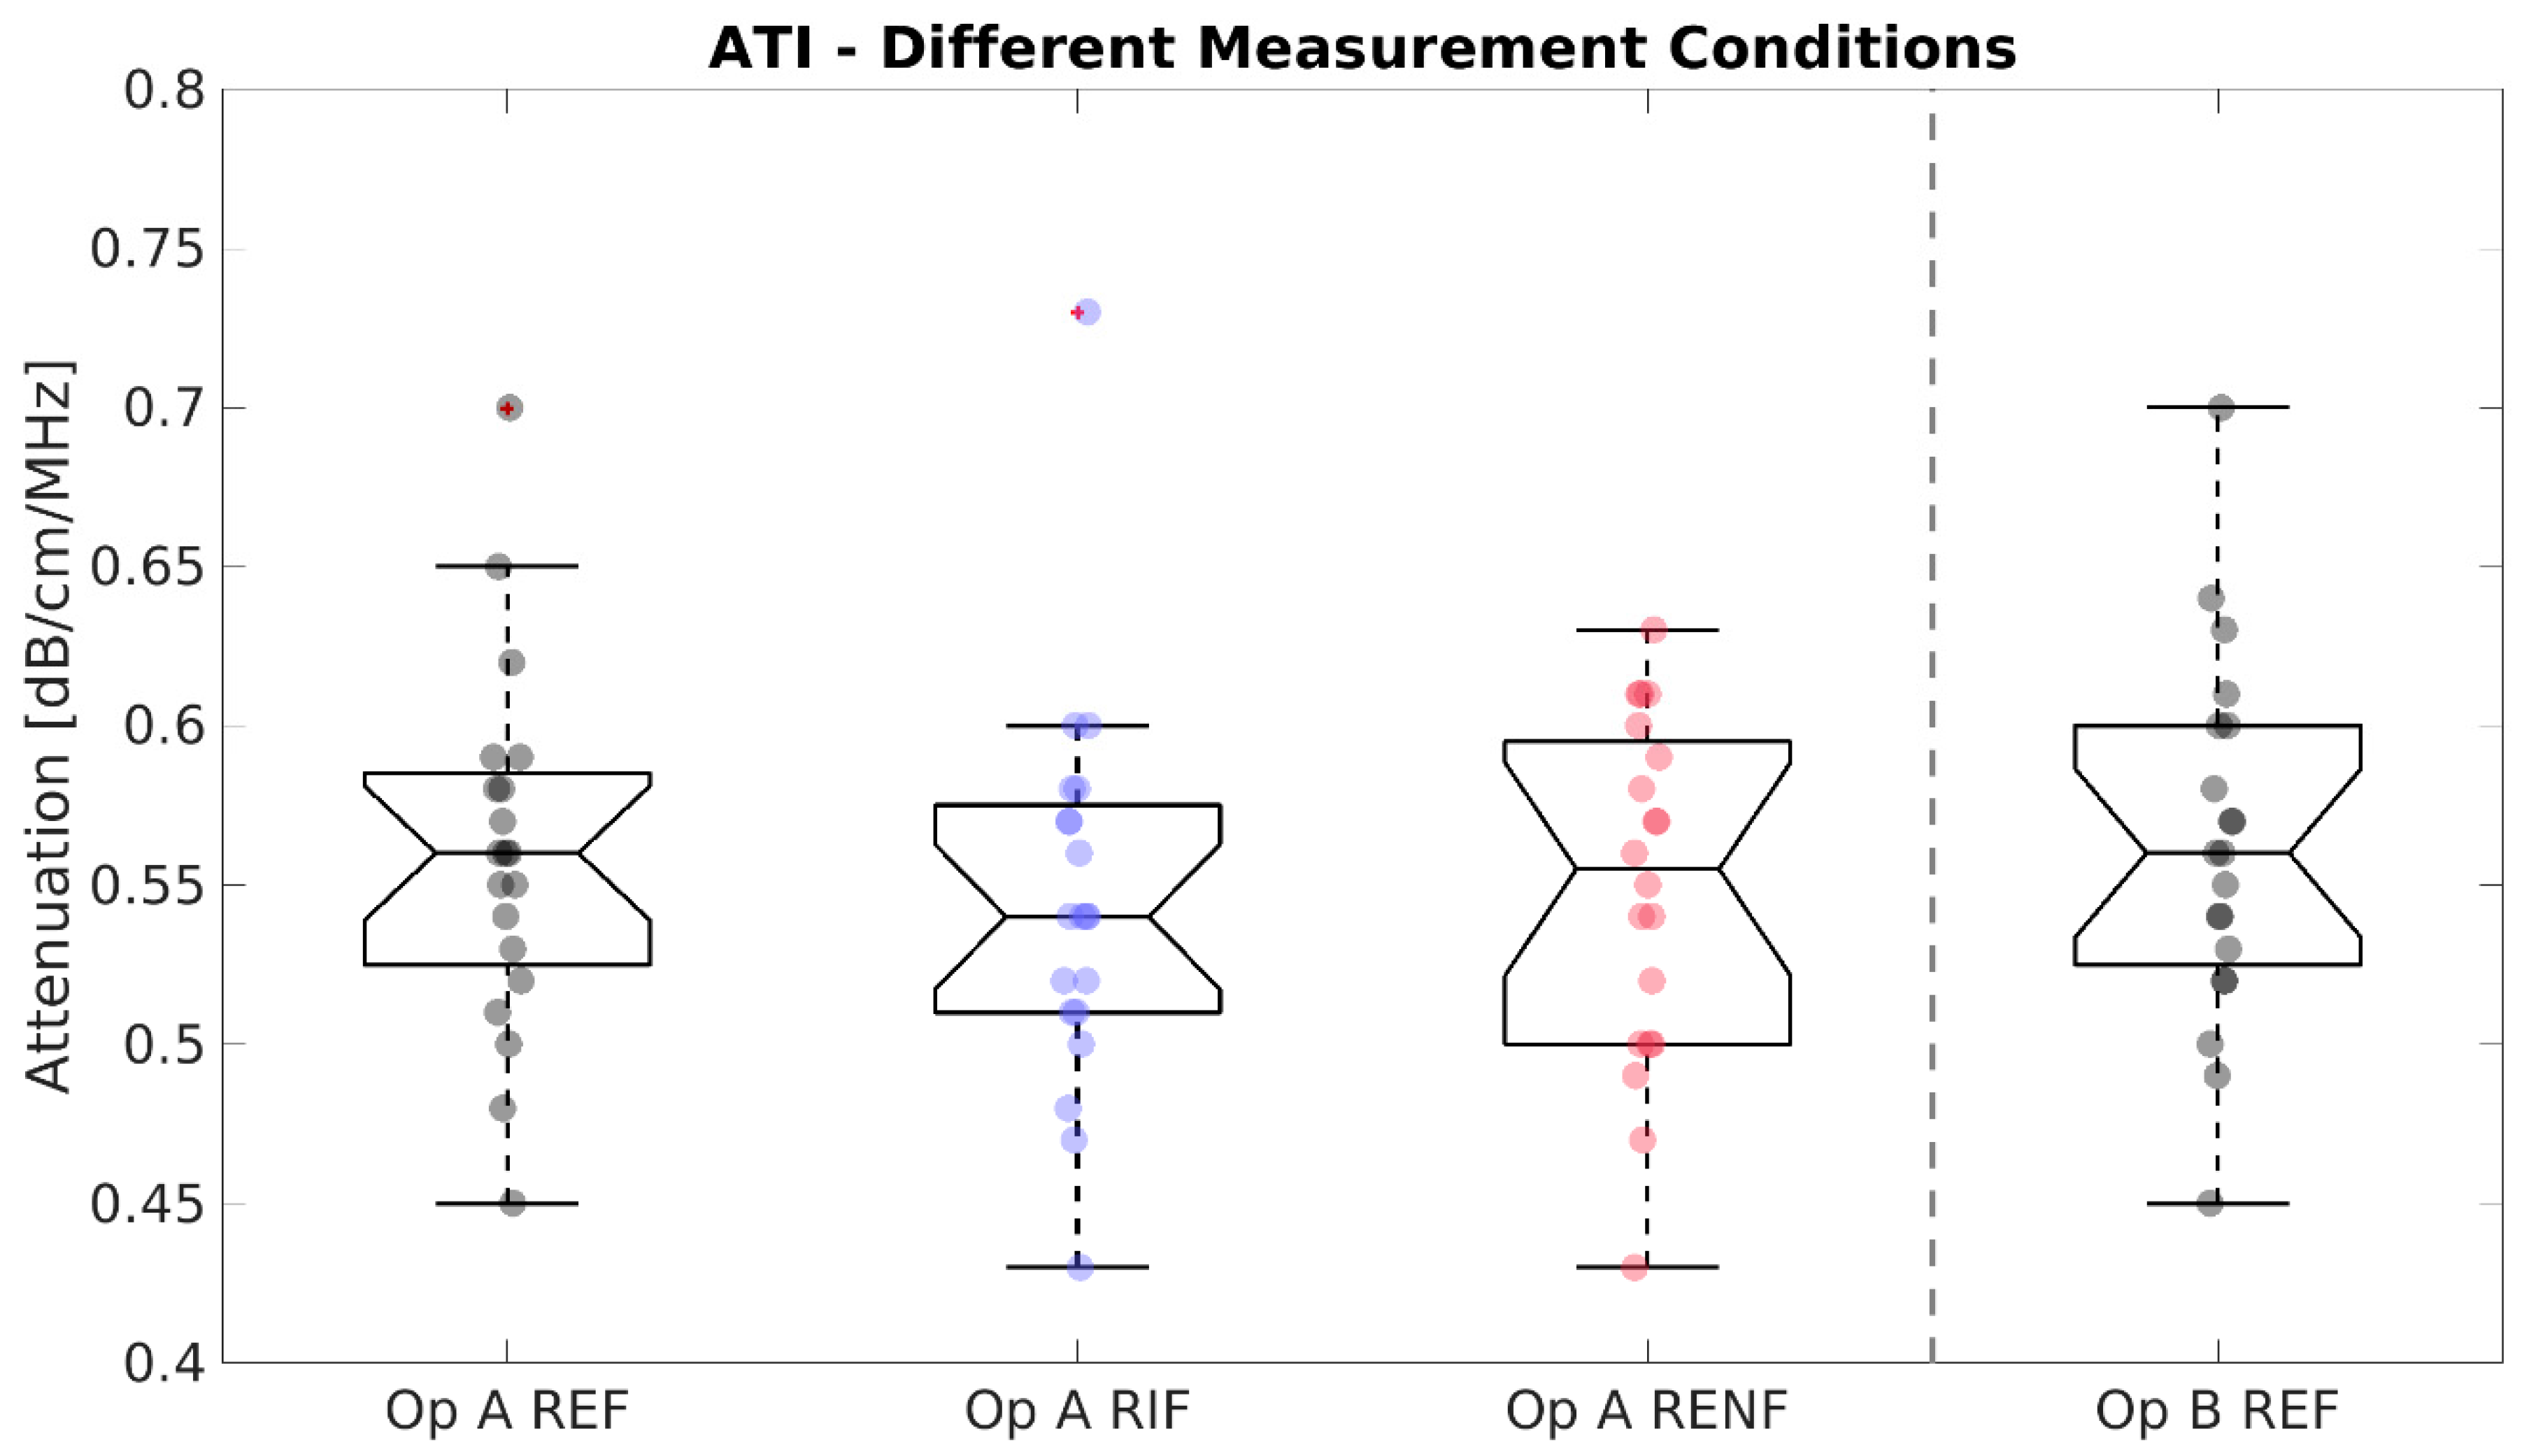
3.2. SWS, SWD, and ATI Results
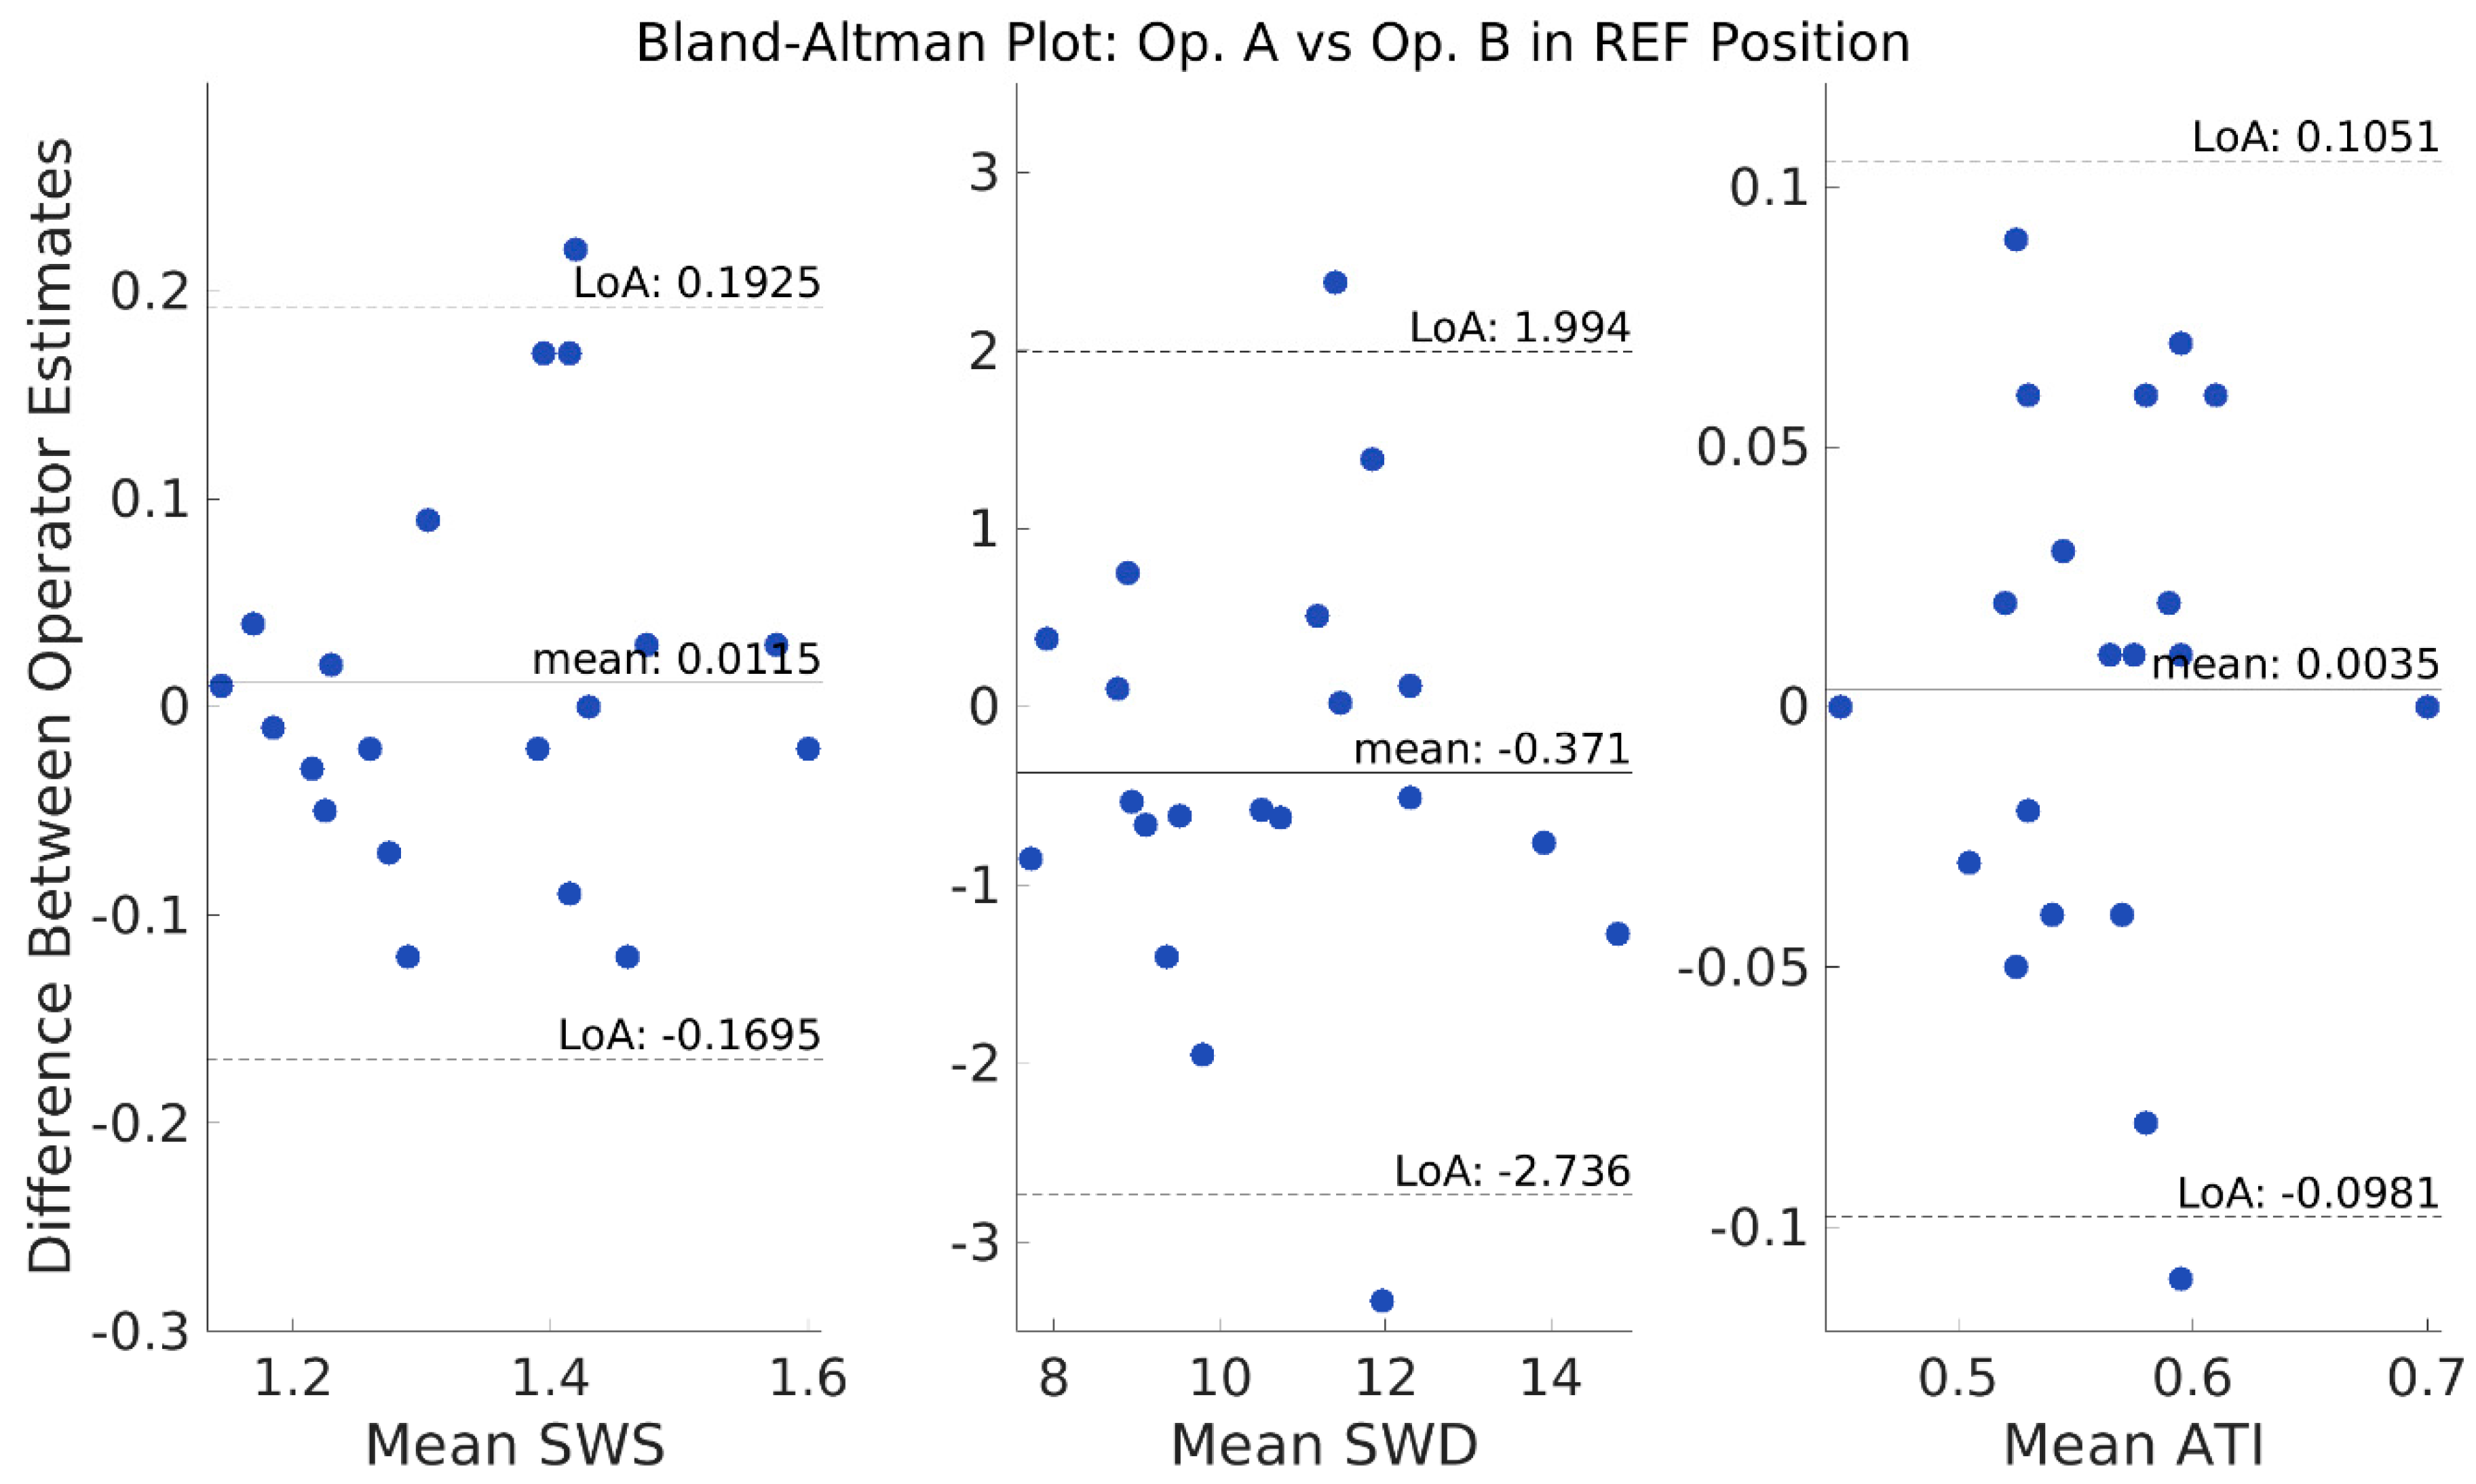
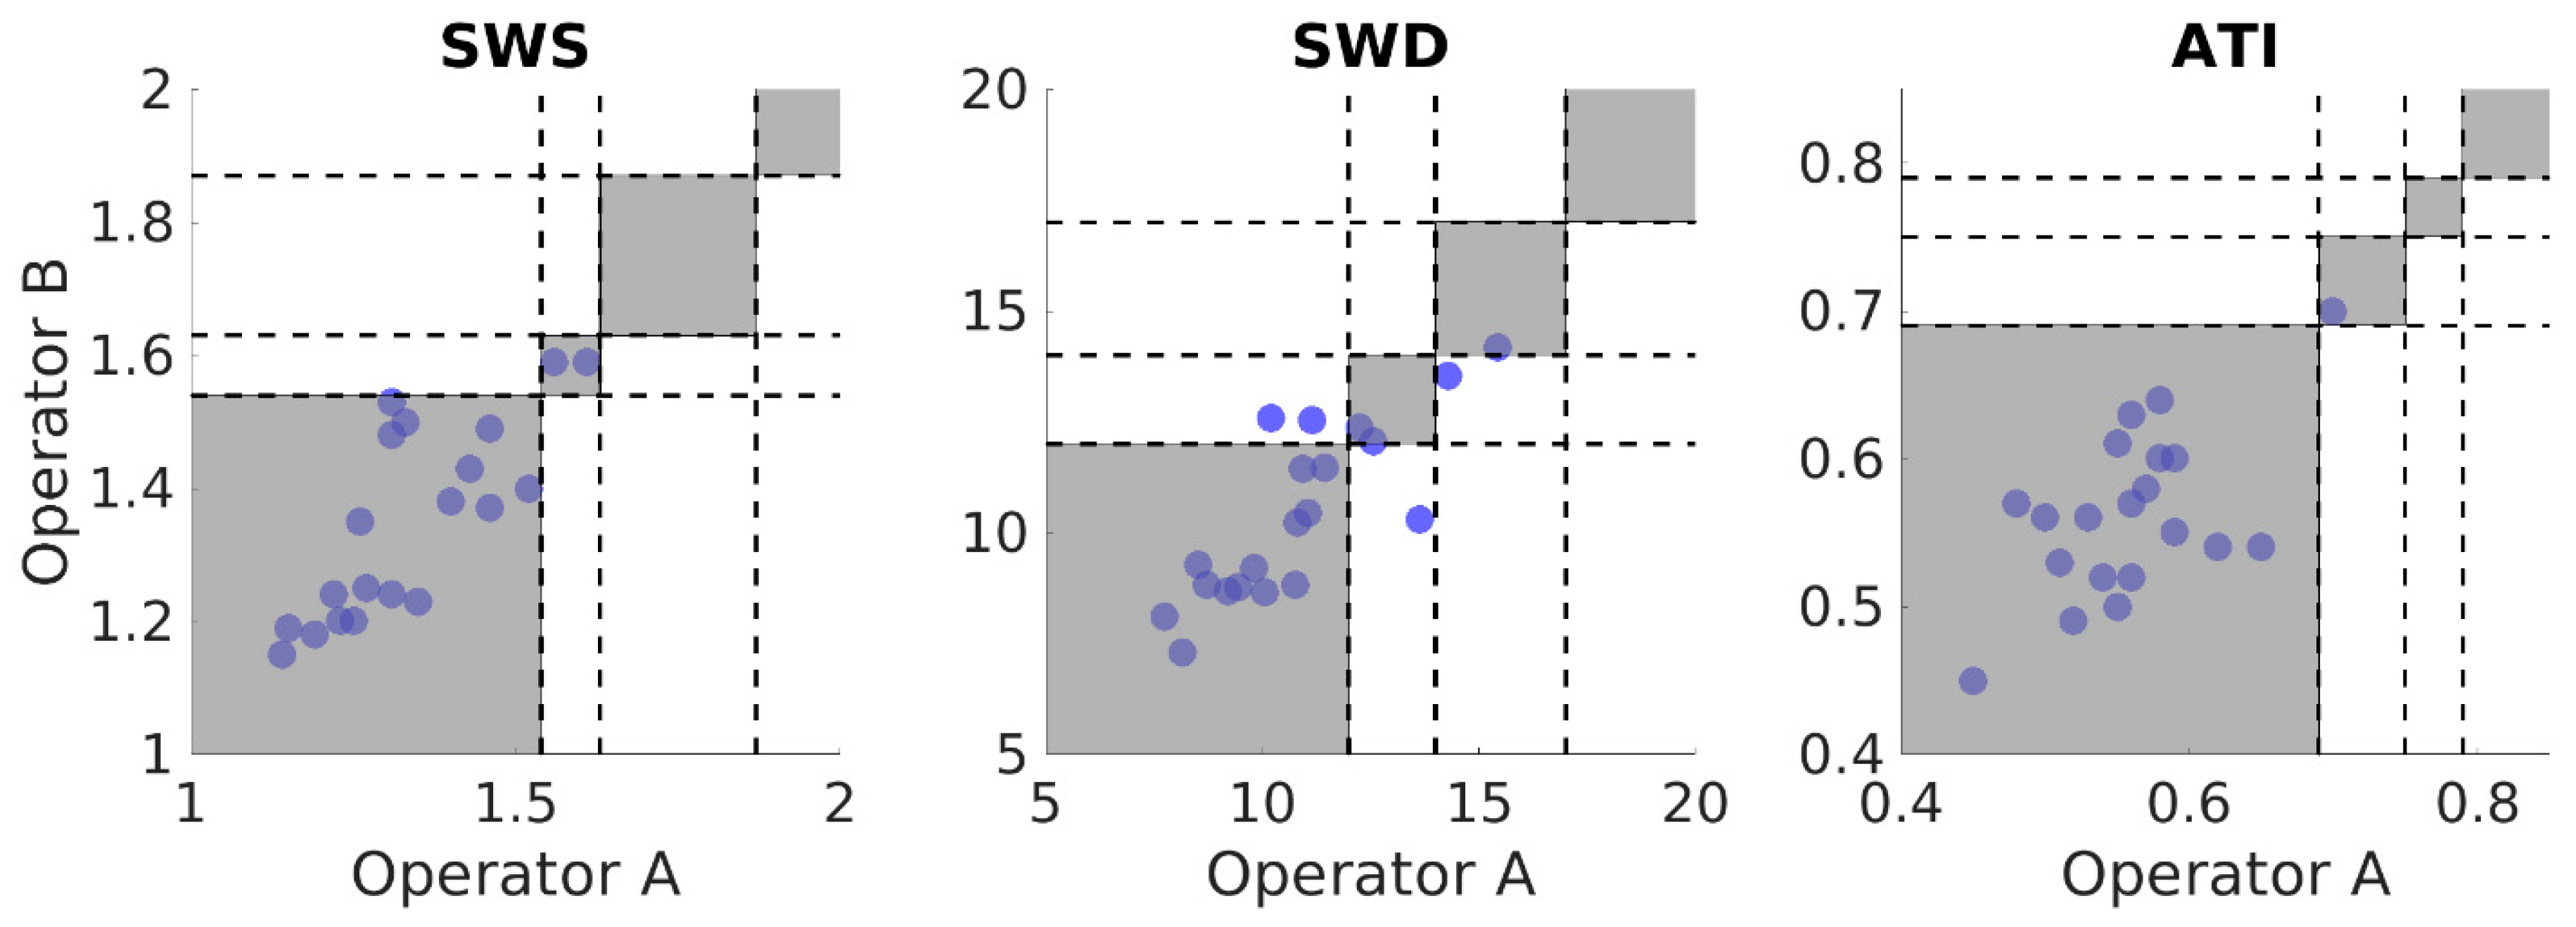
3.3. Reliability
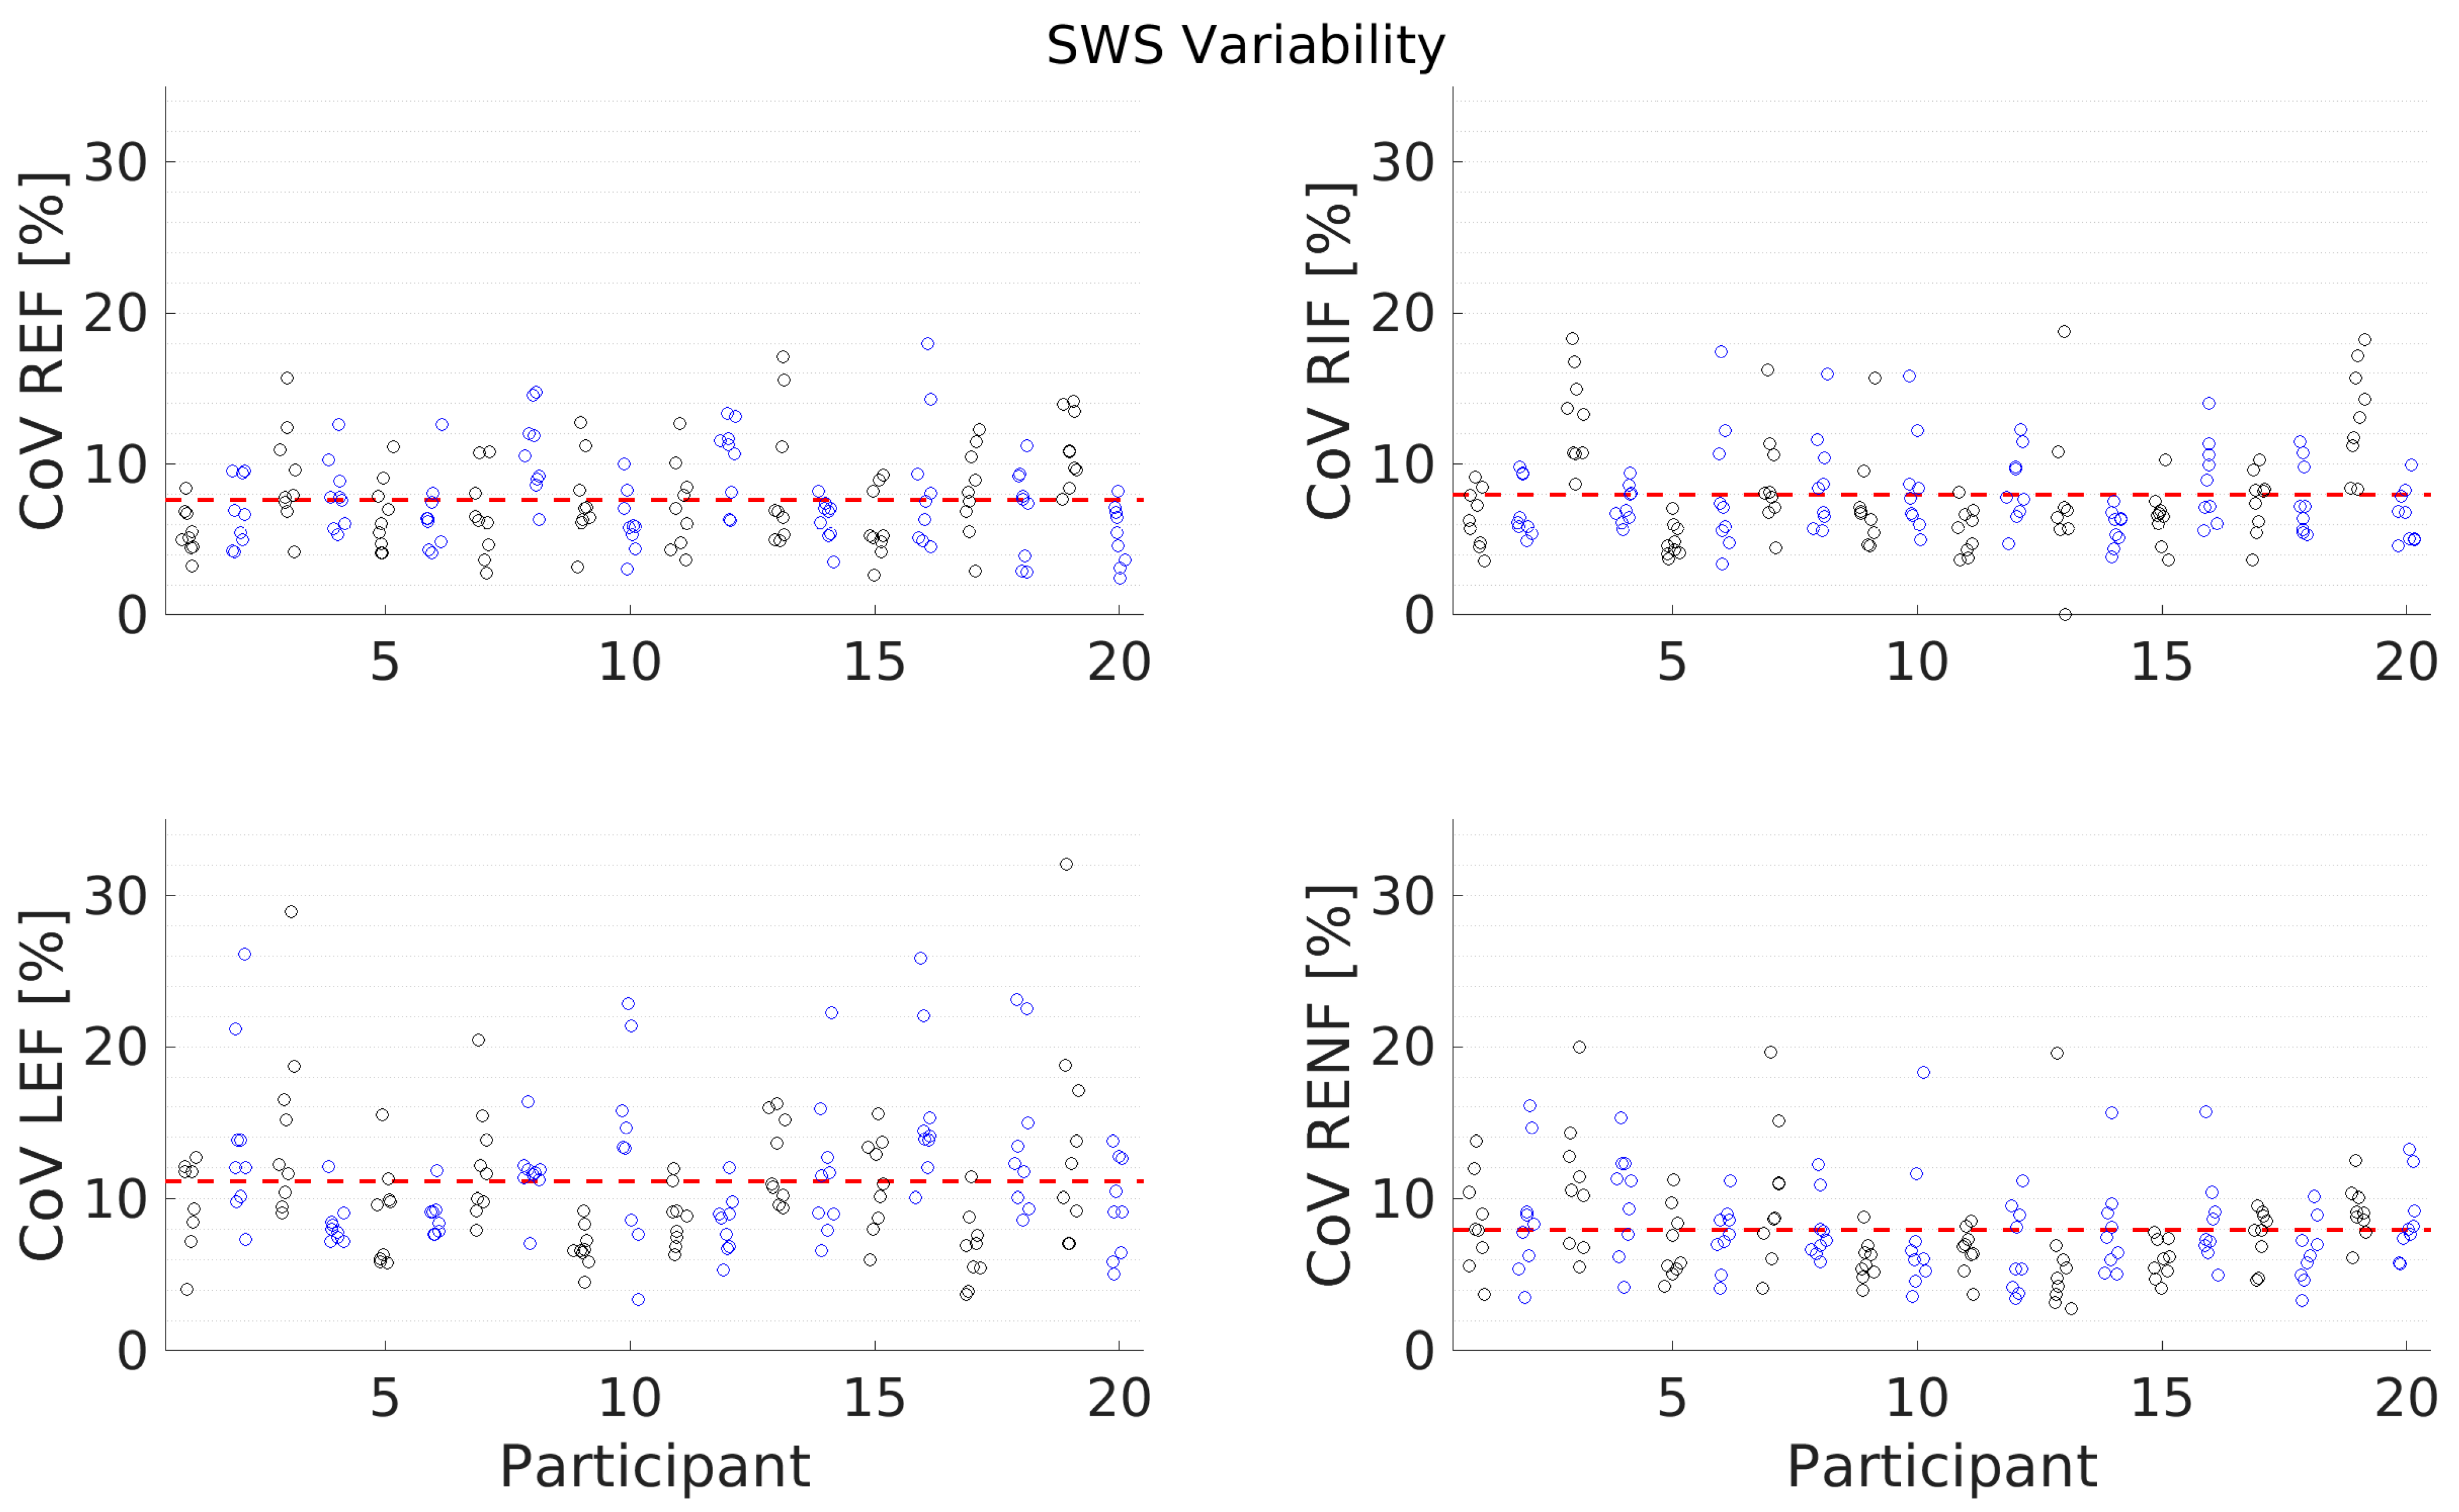
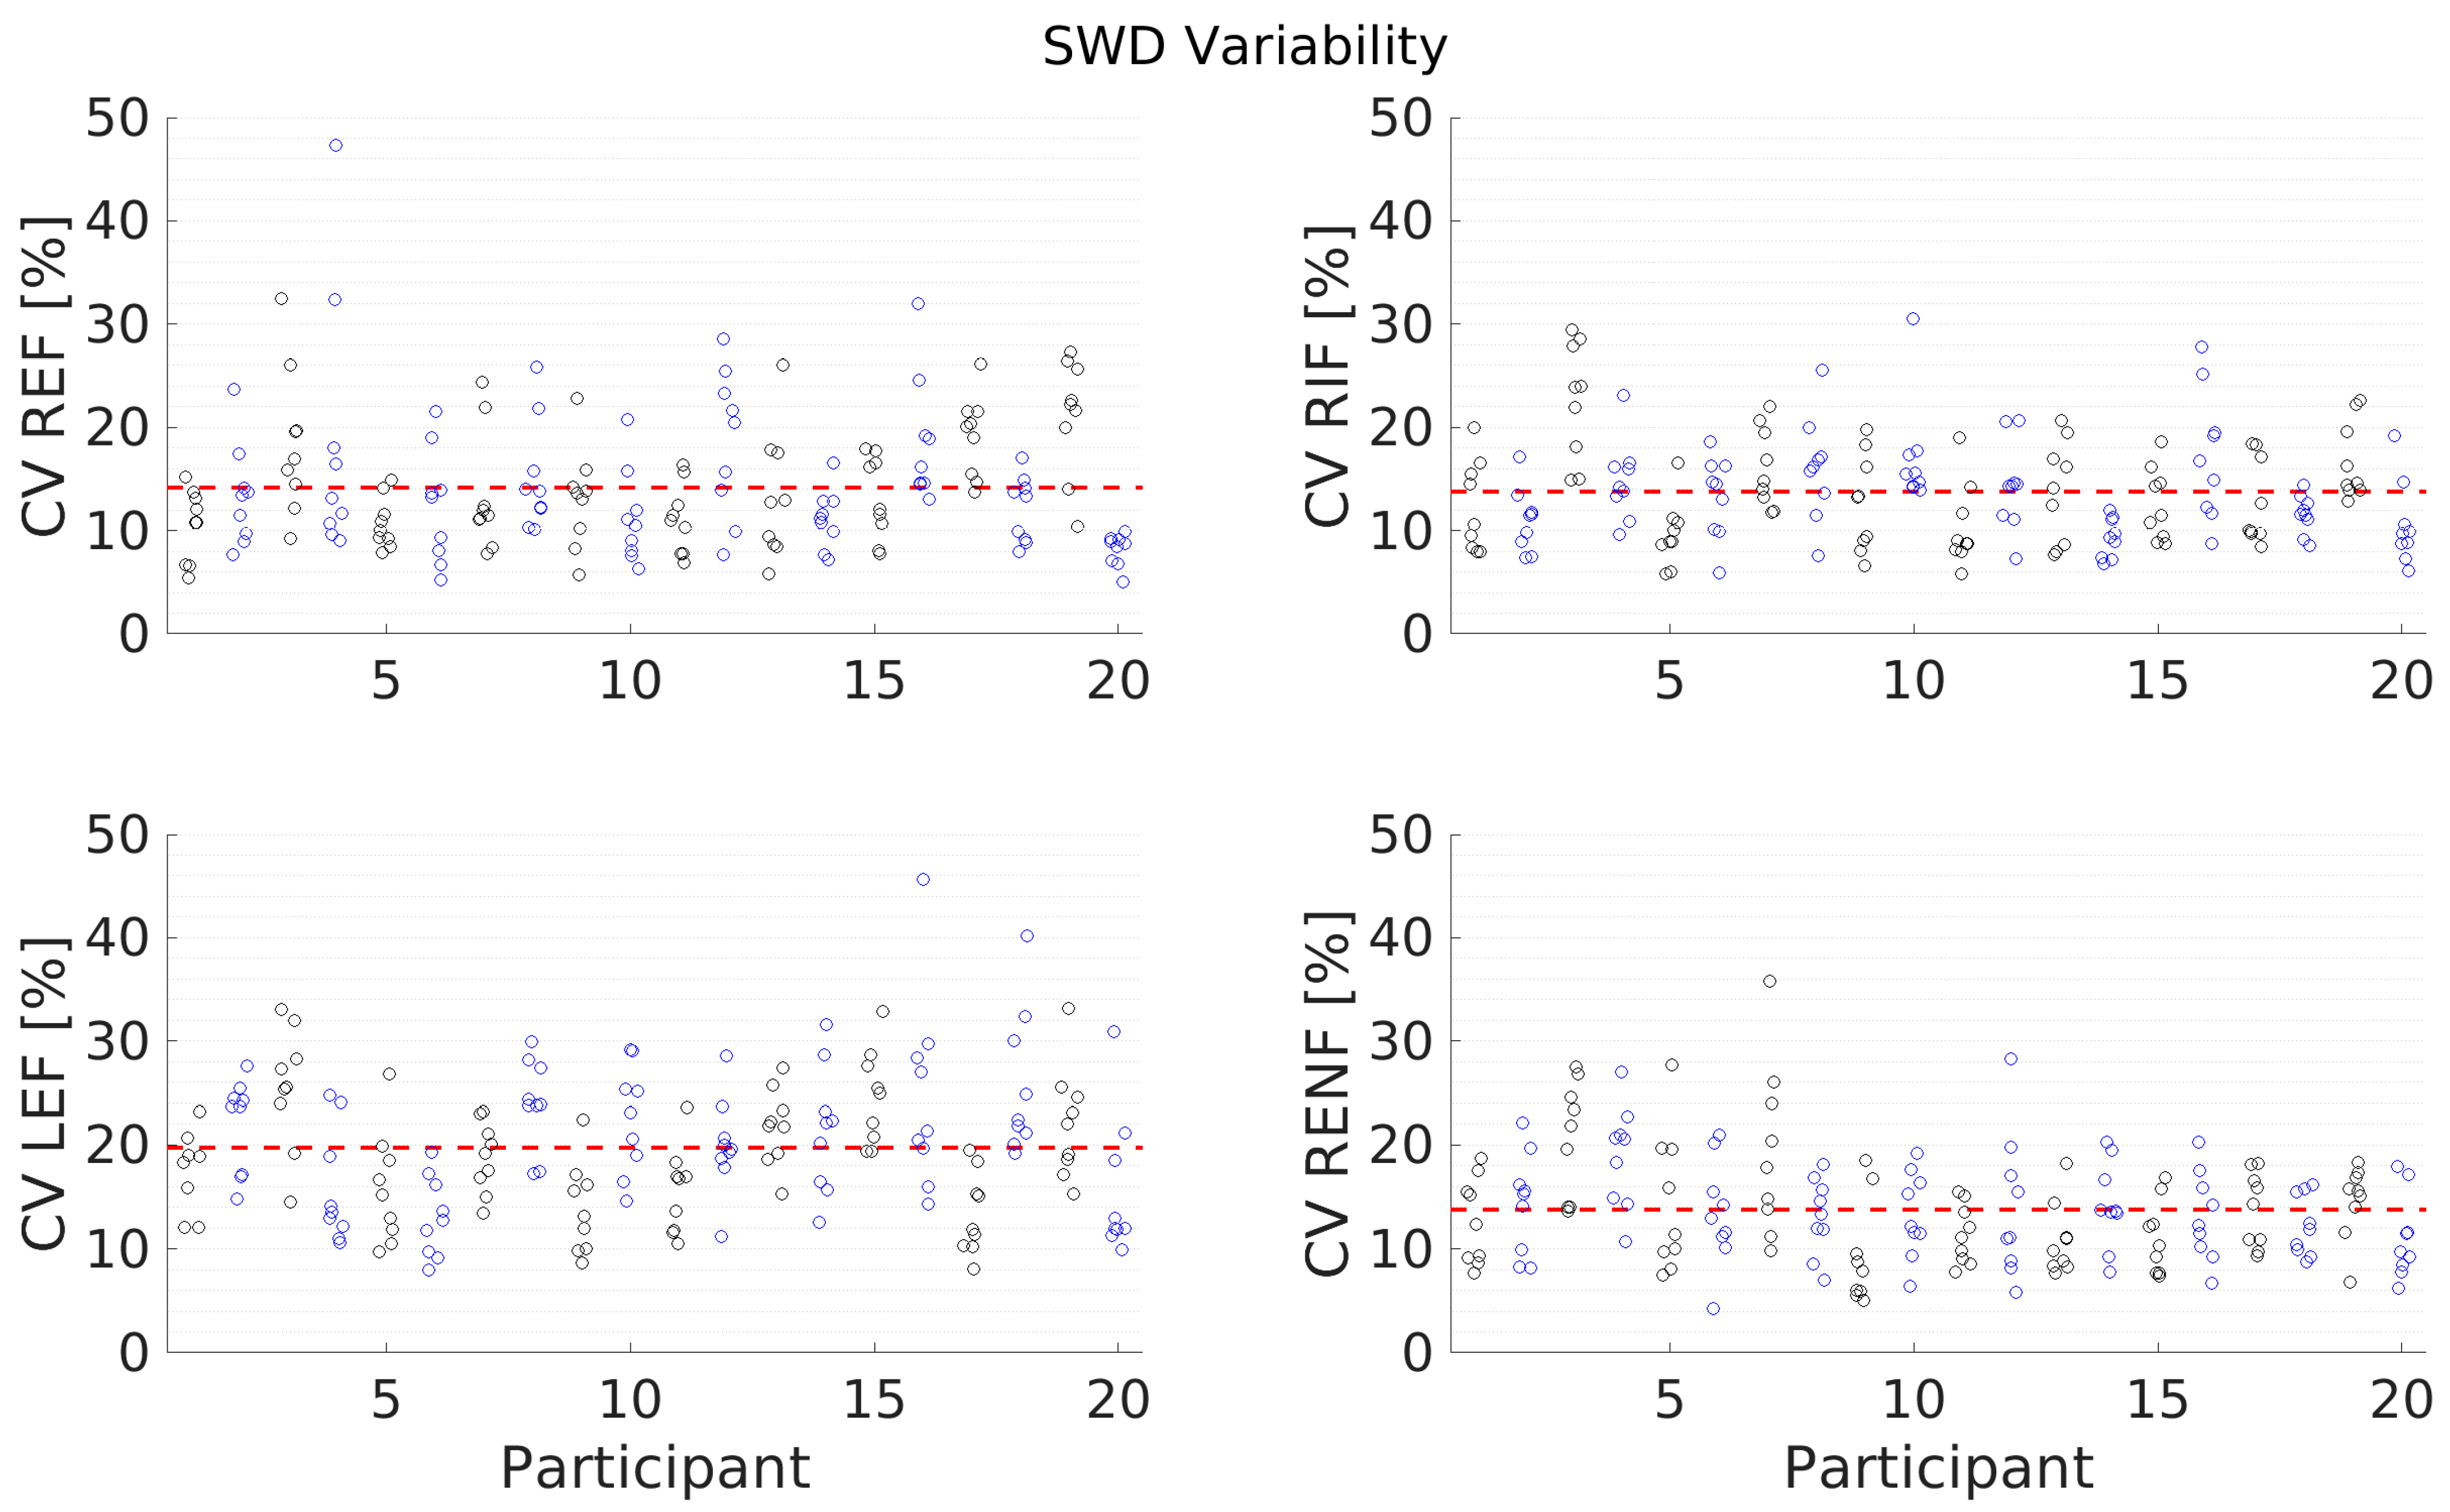
3.4. Variability
4. Discussion
4.1. Data Quality
4.2. SWS
4.3. SWD
4.4. ATI
4.5. Reliability
4.6. Limitations
5. Conclusions
Author Contributions
Funding
Institutional Review Board Statement
Informed Consent Statement
Data Availability Statement
Acknowledgments
Conflicts of Interest
References
- Asrani, S.K.; Devarbhavi, H.; Eaton, J.; Kamath, P.S. Burden of liver diseases in the world. J. Hepatol. 2019, 70, 151–171. [Google Scholar] [CrossRef] [PubMed]
- Lu, L.-G.; Zeng, M.-D.; Mao, Y.-M.; Li, J.-Q.; Qiu, D.-K.; Fang, J.-Y.; Cao, A.-P.; Wan, M.-B.; Li, C.-Z.; Ye, J.; et al. Relationship between clinical and pathologic findings in patients with chronic liver diseases. World J. Gastroenterol. 2003, 9, 2796–2800. [Google Scholar] [CrossRef]
- Panqueva, R.P. Pathological aspects of fatty liver disease. Rev. Col. Gastroenterol. 2014, 29, 82–88. [Google Scholar]
- Ferraioli, G.; Wong, V.W.-S.; Castera, L.; Berzigotti, A.; Sporea, I.; Dietrich, C.F.; Choi, B.I.; Wilson, S.R.; Kudo, M.; Barr, R.G. Liver Ultrasound Elastography: An Update to the World Federation for Ultrasound in Medicine and Biology Guidelines and Recommendations. Ultrasound Med. Biol. 2018, 44, 2419–2440. [Google Scholar] [CrossRef] [Green Version]
- Barr, R.G.; Ferraioli, G.; Palmeri, M.L.; Goodman, Z.D.; Garcia-Tsao, G.; Rubin, J.; Garra, B.; Myers, R.P.; Wilson, S.R.; Rubens, D.; et al. Elastography Assessment of Liver Fibrosis: Society of Radiologists in Ultrasound Consensus Conference Statement. Radiology 2015, 276, 845–861. [Google Scholar] [CrossRef] [Green Version]
- Chen, S.; Fatemi, M.; Greenleaf, J. Quantifying elasticity and viscosity from measurement of shear wave speed dispersion. JASA 2004, 115, 2781. [Google Scholar] [CrossRef] [PubMed]
- Ferraioli, G.; Maiocchi, L.; Dellafiore, C.; Tinelli, C.; Above, E.; Filice, C. Performance and cutoffs for liver fibrosis staging of a two-dimensional shear wave elastography technique. Eur. J. Gastroenterol. Hepatol. 2021, 33, 89–95. [Google Scholar] [CrossRef]
- Herrmann, E.; de Lédinghen, V.; Cassinotto, C.; Chu, W.C.; Leung, V.Y.; Ferraioli, G.; Filice, C.; Castera, L.; Vilgrain, V.; Ronot, M.; et al. Assessment of biopsy-proven liver fibrosis by two-dimensional shear wave elastography: An individual patient data-based meta-analysis. Hepatology 2018, 67, 260–272. [Google Scholar] [CrossRef] [Green Version]
- Zheng, J.; Guo, H.; Zeng, J.; Huang, Z.; Zheng, B.; Ren, J.; Xu, E.; Li, K.; Zheng, R. Two-dimensional Shear-Wave Elastography and Conventional US: The Optimal Evaluation of Liver Fibrosis and Cirrhosis. Radiology 2015, 275, 290–300. [Google Scholar] [CrossRef] [Green Version]
- Ferraioli, G.; Maiocchi, L.; Savietto, G.; Tinelli, C.; Nichetti, M.; Rondanelli, M.; Calliada, F.; Preda, L.; Filice, C. Performance of the Attenuation Imaging Technology in the Detection of Liver Steatosis. J. Ultrasound Med. 2020, 9999, 1–8. [Google Scholar] [CrossRef]
- Sasso, M.; Beaugrand, M.; de Ledinghen, V.; Douvin, C.; Marcellin, P.; Poupon, R.; Sandrin, L.; Miette, V. Controlled attenuation parameter (CAP): A novel VCTE guided ultrasonic attenuation measurement for the evaluation of hepatic steatosis: Preliminary study and validation in a cohort of patients with chronic liver disease from various causes. Ultrasound Med. Biol. 2010, 36, 1825–1835. [Google Scholar] [CrossRef]
- Ferraioli, G.; Maiocchi, L.; Raciti, M.V.; Tinelli, C.; De Silvestri, A.; Nichetti, M.; De Cata, P.; Rondanelli, M.; Chiovato, L.; Calliada, F.; et al. Detection of Liver Steatosis With a Novel Ultrasound-Based Technique: A Pilot Study Using MRI-Derived Proton Density Fat Fraction as the Gold Standard. Clin. Transl. Gastroenterol. 2019, 10, e00081. [Google Scholar] [CrossRef]
- Jesper, D.; Klett, D.; Schellhaas, B.; Pfeifer, L.; Leppkes, M.; Waldner, M.; Neurath, M.F.; Strobel, D. Ultrasound-Based Attenuation Imaging for the Non-Invasive Quantification of Liver Fat—A Pilot Study on Feasibility and Inter-Observer Variability. IEEE J. Transl. Eng. Health Med. 2020, 8, 1800409. [Google Scholar] [CrossRef] [PubMed]
- Sugimoto, K.; Moriyasu, F.; Oshiro, H.; Takeuchi, H.; Abe, M.; Yoshimasu, Y.; Kasai, Y.; Sakamaki, K.; Hara, T.; Itoi, T. The Role of Multiparametric US of the Liver for the Evaluation of Nonalcoholic Steatohepatitis. Radiology 2020, 296, 532–540. [Google Scholar] [CrossRef] [PubMed]
- Sugimoto, K.; Moriyasu, F.; Oshiro, H.; Takeuchi, H.; Yoshimasu, Y.; Kasai, Y.; Itoi, T. Clinical utilization of shear wave dispersion imaging in diffuse liver disease. Ultrasonography 2020, 39, 3–10. [Google Scholar] [CrossRef] [Green Version]
- Goertz, R.; Egger, C.; Neurath, M.; Strobel, D. Impact of Food Intake, Ultrasound Transducer, Breathing Maneuvers and Body Position on Acoustic Radiation Force Impulse (ARFI) Elastometry of the Liver. Ultraschall Med. 2012, 33, 380–385. [Google Scholar] [CrossRef] [PubMed]
- Goertz, R.; Zopf, Y.; Jugl, V.; Heide, R.; Janson, C.; Strobel, D.; Bernatik, T.; Haendl, T. Measurement of Liver Elasticity with Acoustic Radiation Force Impulse (ARFI) Technology: An Alternative Noninvasive Method for Staging Liver Fibrosis in Viral Hepatitis. Ultraschall Med. 2010, 31, 151–155. [Google Scholar] [CrossRef]
- Kaminuma, C.; Tsushima, Y.; Matsumoto, N.; Kurabayashi, T.; Taketomi-Takahashi, A.; Endo, K. Reliable Measurement Procedure of Virtual Touch Tissue Quantification With Acoustic Radiation Force Impulse Imaging. J. Ultrasound Med. 2011, 30, 745–751. [Google Scholar] [CrossRef]
- Karlas, T.; Pfrepper, C.; Wiegand, J.; Wittekind, C.; Neuschulz, M.; Mössner, J.; Berg, T.; Tröltzsch, M.; Keim, V. Acoustic radiation force impulse imaging (ARFI) for non-invasive detection of liver fibrosis: Examination standards and evaluation of interlobe differences in healthy subjects and chronic liver disease. Scand. J. Gastroenterol. 2011, 46, 12, 1458–1467. [Google Scholar] [CrossRef]
- Ling, W.; Lu, Q.; Quan, J.; Ma, L.; Luo, Y. Assessment of impact factors on shear wave based liver stiffness measurement. Eur. J. Radiol. 2013, 82, 335–341. [Google Scholar] [CrossRef]
- Mederacke, I.; Wursthorn, K.; Kirschner, J.; Rifai, K.; Manns, M.P.; Wedemeyer, H.; Bahr, M.J. Food intake increases liver stiffness in patients with chronic or resolved hepatitis C virus infection. Liver Internat. 2009, 29, 1500–1506. [Google Scholar] [CrossRef] [PubMed]
- Rifai, K.; Cornberg, J.; Mederacke, I.; Bahr, M.J.; Wedemeyer, H.; Malinski, P.; Bantel, H.; Boozari, B.; Potthoff, A.; Manns, M.P.; et al. Clinical feasibility of liver elastography by acoustic radiation force impulse imaging (ARFI). Dig. Liver Dis. 2011, 43, 491–497. [Google Scholar] [CrossRef] [PubMed]
- Toshima, T.; Shirabe, K.; Takeishi, K.; Motomura, T.; Mano, Y.; Uchiyama, H.; Yoshizumi, T.; Soejima, Y.; Taketomi, A.; Maehara, Y. New method for assessing liver fibrosis based on acoustic radiation force impulse: A special reference to the difference between right and left liver. J. Gastroenterol. 2011, 46, 705–711. [Google Scholar] [CrossRef] [PubMed]
- Yun, M.H.; Seo, Y.S.; Kang, H.S.; Lee, K.G.; Kim, J.H.; An, H.; Yim, H.J.; Keum, B.; Jeen, Y.T.; Lee, H.S.; et al. The effect of the respiratory cycle on liver stiffness values as measured by transient elastography. J. Viral Hepat. 2011, 18, 631–636. [Google Scholar] [CrossRef]
- Silva, M.; Moreira, P.C.; Peixoto, A.; Santos, A.L.; Lopes, S.; Gonçalves, R.; Pereira, P.; Cardoso, H.; Macedo, G. Effect of Meal Ingestion on Liver Stiffness and Controlled Attenuation Parameter. GE Port. J. Gastroenterol. 2019, 26, 99–104. [Google Scholar] [CrossRef]
- Furtwængler, N.A.; de Visser, R.O. Lack of international consensus in low-risk drinking guidelines. Drug Alcohol Rev. 2012, 32, 11–18. [Google Scholar] [CrossRef] [PubMed]
- Martiartu, N.K.; Nambiar, S.; Kirchner, I.N.; Paverd, C.; Cester, D.; Frauenfelder, T.; Ruby, L.; Rominger, M.B. Sources of variability in shear-wave speed and dispersion quantification with ultrasound elastography: A phantom study. Ultrasound Med. Biol. 2021, 47, 3529–3542. [Google Scholar] [CrossRef]
- Koo, T.; Li, M. A Guideline of Selecting and Reporting Intraclass Correlation Coefficients for Reliability Research. J. Chiropr. Med. 2016, 15, 155–163. [Google Scholar] [CrossRef] [Green Version]
- Dietrich, C.F.; Bamber, J.; Berzigotti, A.; Bota, S.; Cantisani, V.; Castera, L.; Cosgrove, D.; Ferraioli, G.; Friedrich-Rust, M.; Gilja, O.H.; et al. EFSUMB Guidelines and Recommendations on the Clinical Use of Liver Ultrasound Elastography, Update 2017 (Long Version). Ultraschall Med. 2017, 38, e16–e47. [Google Scholar]
- Popescu, A.; Bota, S.; Sporea, I.; Sirli, R.; Danila, M.; Racean, S.; Suseanu, D.; Gradinaru, O.; Siegfried, C.I. The influence of food intake on liver stiffness values assessed by acoustic radiation force impulse elastography-preliminary results. Ultrasound Med. Biol. 2013, 39, 579–584. [Google Scholar] [CrossRef]
- Pugliese, D.; Ohnishi, K.; Tsunoda, T.; Sabba, C.; Albano, O. Portal hemodynamics after meal in normal subjects and in patients with chronic liver disease studied by echo-Doppler flowmeter. Am. J. Gastroenterol. 1987, 82, 1052–1056. [Google Scholar] [PubMed]
- Sabbá, C.; Ferraioli, G.; Genecin, P.; Colombato, L.; Buonamico, P.; Lerner, E.; Taylor, K.J.; Groszmann, R.J. Evaluation of postprandial hyperemia in superior mesenteric artery and portal vein in healthy and cirrhotic humans: An operator-blind echo-Doppler study. Hepatology 1991, 13, 714–718. [Google Scholar] [CrossRef]
- Chen, S.; Sanchez, W.; Callstrom, M.R.; Gorman, B.; Lewis, J.T.; Sanderson, S.O.; Greenleaf, J.F.; Xie, H.; Shi, Y.; Pashley, M.; et al. Assessment of liver viscoelasticity by using shear waves induced by ultrasound radiation force. Radiology 2013, 266, 964–970. [Google Scholar] [CrossRef] [PubMed] [Green Version]
- Bruce, M.; Kolokythas, O.; Ferraioli, G.; Filice, C.; O’Donnell, M. Limitations and artifacts in shear-wave elastography of the liver. Biomed. Eng. Lett. 2017, 7, 81–89. [Google Scholar] [CrossRef] [PubMed]
- Lee, D.H.; Lee, J.Y.; Bae, J.S.; Yi, N.-J.; Lee, K.-W.; Suh, K.-S.; Kim, H.; Lee, K.B.; Han, J.K. Shear-Wave Dispersion Slope from US Shear-Wave Elastography: Detection of Allograft Damage after Liver Transplantation. Radiology 2019, 293, 327–333. [Google Scholar] [CrossRef]
- Kishimoto, R.; Kikuchi, K.; Koyama, A.; Kershaw, J.; Omatsu, T.; Tachibana, Y.; Suga, M.; Obata, T. Intra- and inter-operator reproducibility of US point shear-wave elastography in various organs: Evaluation in phantoms and healthy volunteers. Eur. Radiol. 2019, 29, 5999–6008. [Google Scholar] [CrossRef] [Green Version]
- Mueller, R.; Buettner, P. A Critical Discussion of Intraclass Correlation Coefficients. Stat. Med. 1994, 13, 2465–2476. [Google Scholar] [CrossRef]


| Mean ± Standard Deviation | Minimum | Maximum | |
|---|---|---|---|
| Age (Years) | 31.8 ± 5.3 | 24.0 | 45.0 |
| Weight (kg) | 73.8 ± 12.4 | 51.0 | 97.0 |
| Height (cm) | 178.1 ± 9.9 | 158.0 | 194.0 |
| Body Mass Index (kg/m2) | 23.1 ± 2.6 | 18.4 | 27.7 |
| Full Name | Abb. | Measurement Purpose | Test Condition (vs. Reference) | Measurement Description |
|---|---|---|---|---|
| Right Expiration Fasting | REF | Reference/ Standard Measurement Condition | N/A | 3 h fast, IC approach, subject supine, relaxed, breath hold following gentle expiration |
| Right Inspiration Fasting | RIF | Test Condition | Inspiration | 3 h fast, IC approach, subject supine, relaxed, breath hold following gentle inspiration |
| Left Expiration Fasting | LEF | Test Condition | Left Lobe | 3 h fast, abdominal approach, subject supine, relaxed, breath hold following gentle expiration |
| Right Expiration Nonfasting | RENF | Test Condition | Nonfasting | 0.5 h postprandial, IC approach, subject supine, relaxed, breath hold following gentle expiration |
| Technique | Cat. 1 | Value | Cat. 2 | Value | Cat. 3 | Value | Cat. 4 | Value |
|---|---|---|---|---|---|---|---|---|
| SWS (m/s) | F0/F1 | <1.54 | F2 | 1.54–1.63 | F3 | 1.64–1.87 | F4 | >1.87 |
| SWD (m/s/kHz) | A0 | <12.0 | A1 | 12.0–14.0 | A2 | 14.1–17.0 | A3 | >17 |
| ATI (dB/cm/MHz) | S0 | <0.69 | S1 | 0.69–0.75 | S2 | 0.76–0.79 | S3 | >0.79 |
| Mean ± SD | Test Condition | Mean ± SD | Equal Var. (Bartlett’s) | Normality (S-W test) | t-Test Used | Final p-Value | |
|---|---|---|---|---|---|---|---|
| SWS REF | 1.34 ± 0.13 m/s | SWS RIF | 1.32 ± 0.12 | Y (p = 0.532) | N (* p = 0.002) | Wilcoxon | 0.551 |
| SWS LEF | 1.31 ± 0.08 | N (* p = 0.043) | Y (p = 0.869) | Welch’s | 0.465 | ||
| SWS RENF | 1.32 ± 0.10 | Y (p = 0.211) | Y (p = 0.989) | Student’s | 0.403 | ||
| Op B SWS REF | 1.35 ± 0.15 | Y (p = 0.714) | Y (p = 0.077) | Student’s | 0.584 | ||
| SWD REF | 10.81 ± 2.05 m/s/kHz | SWD RIF | 10.87 ± 1.84 | Y (p = 0.639) | N (* p = 0.005) | Wilcoxon | 0.903 |
| SWD LEF | 12.18 ± 1.41 | Y (p = 0.115) | Y (p = 0.216) | Student’s | * 0.021 | ||
| SWD RENF | 10.59 ± 1.48 | Y (p = 0.162) | Y (p = 0.858) | Student’s | 0.596 | ||
| Op B SWD REF | 10.44 ± 1.97 | Y (p = 0.858) | Y (p = 0.277) | Student’s | 0.185 | ||
| ATI REF | 0.56 ± 0.06 dB/cm/MHz | ATI RIF | 0.54 ± 0.06 | Y (p = 0.415) | N (* p = 0.035) | Wilcoxon | 0.343 |
| ATI RENF | 0.55 ± 0.05 | Y (p = 0.837) | Y (p = 0.521) | Student’s | 0.355 | ||
| Op B ATI REF | 0.56 ± 0.06 | Y (p = 0.975) | Y (p = 0.822) | Student’s | 0.766 |
| Metric | ICC | ICC 95% CI | ICC Rating | B-A Mean Diff. | B-A LoA |
|---|---|---|---|---|---|
| SWS | 0.79 | [0.54, 0.91] | Good | 0.01 m/s | [−0.17, 0.19] m/s |
| SWD | 0.81 | [0.59, 0.92] | Good | −0.37 m/s/kHz | [−2.74, 1.99] m/s/kHz |
| ATI | 0.60 | [0.22, 0.82] | Moderate | 0.00 dB/cm/MHz | [−0.10, 0.11] dB/cm/MHz |
| Metric | REF | RIF | LEF | RENF | Op B REF |
|---|---|---|---|---|---|
| CoV SWS (%) | 7.63 | 7.94 | 11.08 | 7.95 | 6.90 |
| CoV SWD (%) | 14.16 | 13.74 | 19.68 | 13.77 | 12.07 |
Disclaimer/Publisher’s Note: The statements, opinions and data contained in all publications are solely those of the individual author(s) and contributor(s) and not of MDPI and/or the editor(s). MDPI and/or the editor(s) disclaim responsibility for any injury to people or property resulting from any ideas, methods, instructions or products referred to in the content. |
© 2023 by the authors. Licensee MDPI, Basel, Switzerland. This article is an open access article distributed under the terms and conditions of the Creative Commons Attribution (CC BY) license (https://creativecommons.org/licenses/by/4.0/).
Share and Cite
Paverd, C.; Kupfer, S.; Kirchner, I.N.; Nambiar, S.; Martin, A.; Korta Martiartu, N.; Frauenfelder, T.; Rominger, M.B.; Ruby, L. Impact of Breathing Phase, Liver Segment, and Prandial State on Ultrasound Shear Wave Speed, Shear Wave Dispersion, and Attenuation Imaging of the Liver in Healthy Volunteers. Diagnostics 2023, 13, 989. https://doi.org/10.3390/diagnostics13050989
Paverd C, Kupfer S, Kirchner IN, Nambiar S, Martin A, Korta Martiartu N, Frauenfelder T, Rominger MB, Ruby L. Impact of Breathing Phase, Liver Segment, and Prandial State on Ultrasound Shear Wave Speed, Shear Wave Dispersion, and Attenuation Imaging of the Liver in Healthy Volunteers. Diagnostics. 2023; 13(5):989. https://doi.org/10.3390/diagnostics13050989
Chicago/Turabian StylePaverd, Catherine, Sivert Kupfer, Iara Nascimento Kirchner, Sherin Nambiar, Alexander Martin, Naiara Korta Martiartu, Thomas Frauenfelder, Marga B. Rominger, and Lisa Ruby. 2023. "Impact of Breathing Phase, Liver Segment, and Prandial State on Ultrasound Shear Wave Speed, Shear Wave Dispersion, and Attenuation Imaging of the Liver in Healthy Volunteers" Diagnostics 13, no. 5: 989. https://doi.org/10.3390/diagnostics13050989