
Interpreting Discordant Monosomy 3 FISH and Chromosomal Microarray Analysis Results in Uveal Melanoma

Abstract
:1. Materials and Methods
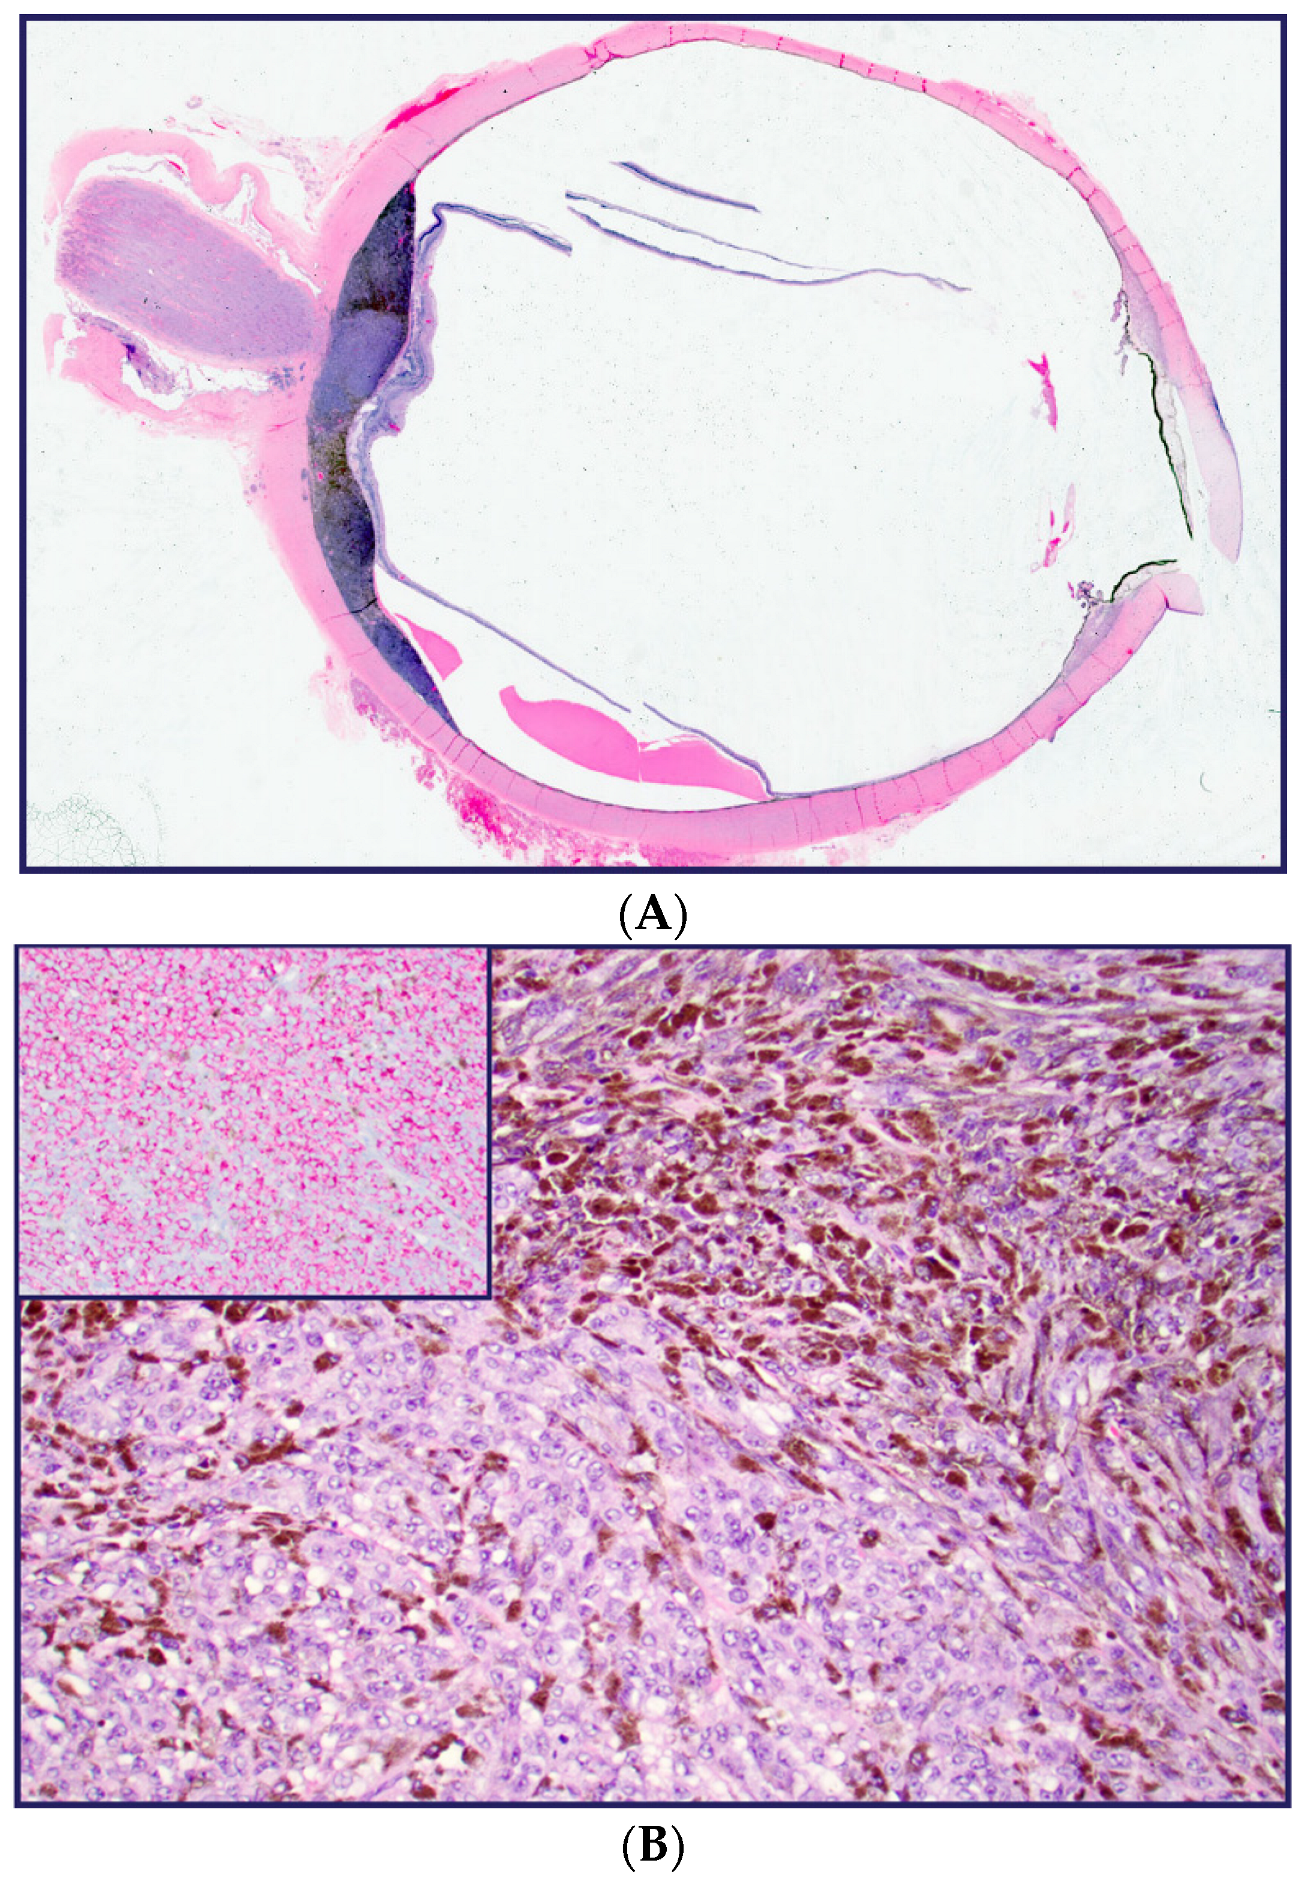
2. Figure and Table Legends
Author Contributions
Funding
Institutional Review Board Statement
Informed Consent Statement
Data Availability Statement
Acknowledgments
Conflicts of Interest
References
- Aronow, M.E.; Topham, A.K.; Singh, A.D. Uveal Melanoma: 5-Year Update on Incidence, Treatment, and Survival (SEER 1973–2013). Ocul. Oncol. Pathol. 2018, 4, 145–151. [Google Scholar] [CrossRef] [PubMed]
- Damato, B.; Duke, C.; Coupland, S.E.; Hiscott, P.; Smith, P.A.; Campbell, I.; Douglas, A.; Howard, P. Cytogenetics of uveal melanoma: A 7-year clinical experience. Ophthalmology 2007, 114, 1925–1931. [Google Scholar] [CrossRef]
- Prescher, G.; Bornfeld, N.; Becher, R. Nonrandom Chromosomal Abnormalities in Primary Uveal Melanoma. JNCI J. Natl. Cancer Inst. 1990, 82, 1765–1969. [Google Scholar] [CrossRef]
- Bornfeld, N.; Prescher, G.; Becher, R.; Hirche, H.; Jöckel, K.H.; Horsthemke, B. Prognostic implications of monosomy 3 in uveal melanoma. Lancet 1996, 347, 1222–1225. [Google Scholar] [CrossRef]
- Scholes, A.G.; Damato, B.E.; Nunn, J.; Hiscott, P.; Grierson, I.; Field, J.K. Monosomy 3 in uveal melanoma: Correlation with clinical and histologic predictors of survival. Investig. Ophthalmol. Vis. Sci. 2003, 44, 1008–1011. [Google Scholar] [CrossRef] [Green Version]
- Theisen, A. Microarray-based comparative genomic hybridization (aCGH). Nat. Educ. 2008, 1, 45. [Google Scholar]
- Sisley, K.; Rennie, I.G.; Parsons, M.A.; Jacques, R.; Hammond, D.W.; Bell, S.M.; Potter, A.M.; Rees, R.C. Abnormalities of chromosomes 3 and 8 in posterior uveal melanoma correlate with prognosis. Genes Chromosomes Cancer 1997, 19, 22–28. [Google Scholar] [CrossRef]


| Patient #1 | Patient #2 | |
|---|---|---|
| Mutations | No clinically significant variance detected. | No clinically significant variance detected. |
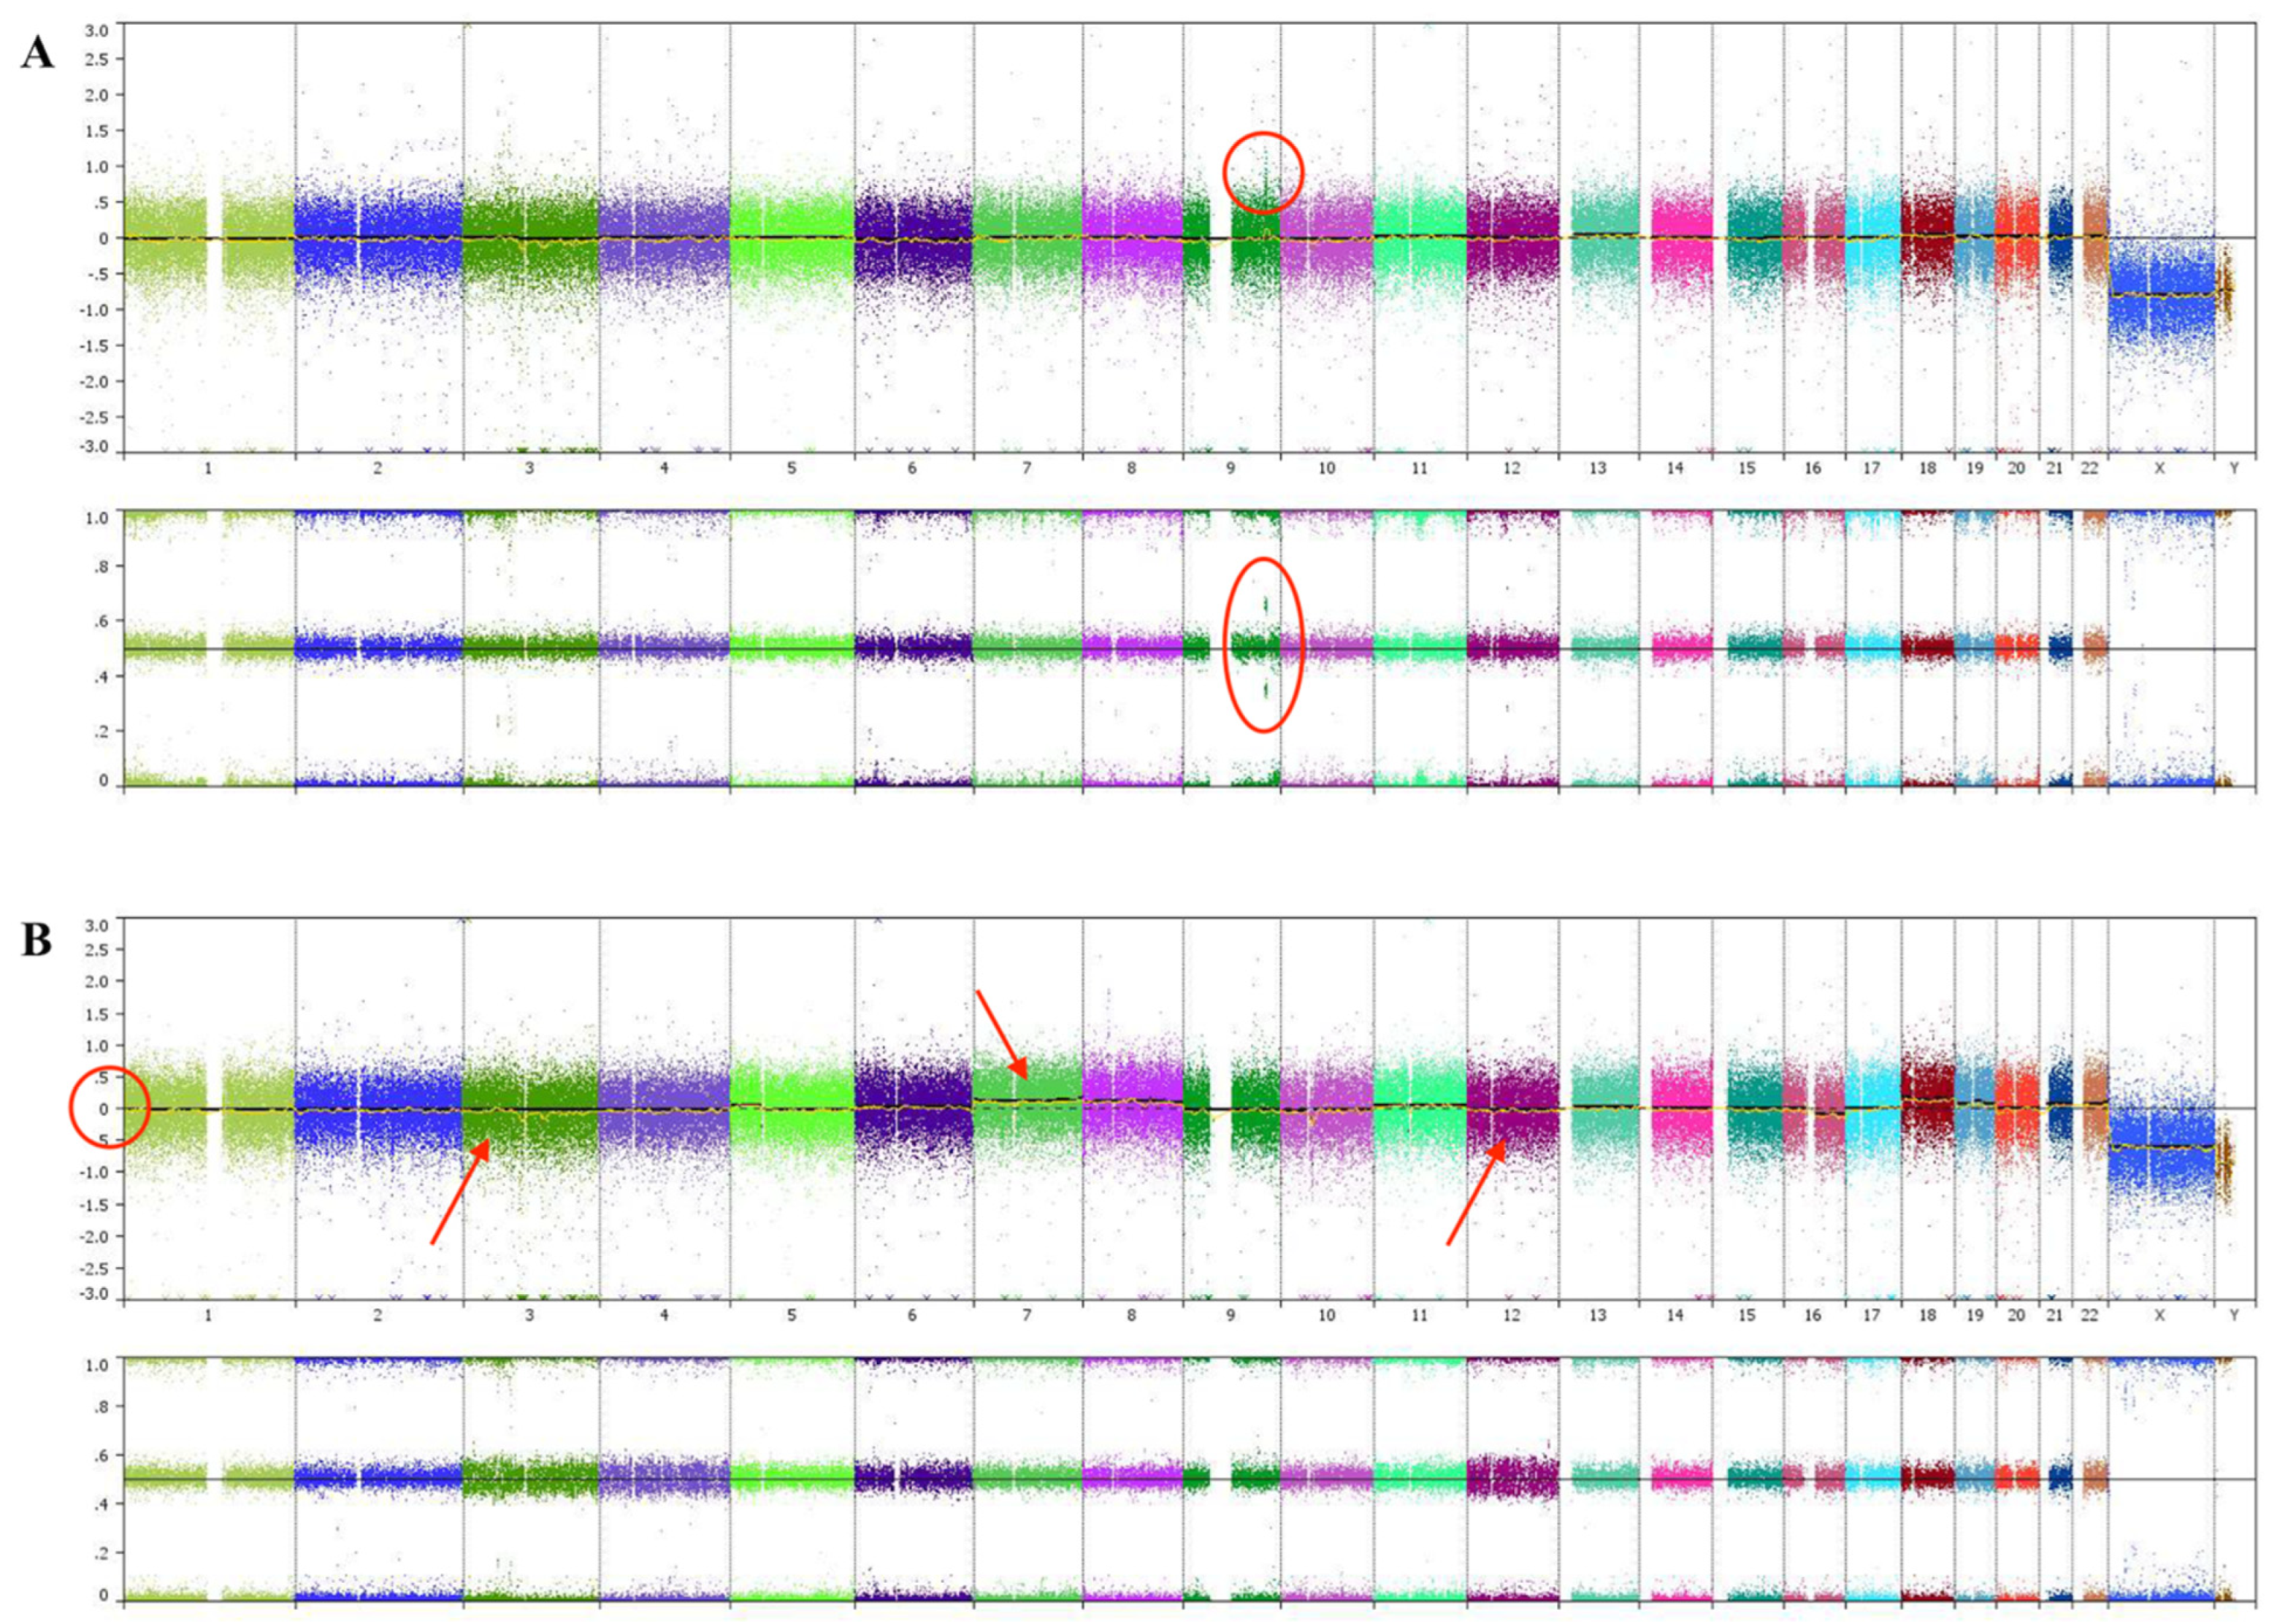
| Chromosomal Gains | 2.27 Mb gain in 9q33.1 encompassing 6 genes (ASTN2, SNORA70C, LOC101928797, TLR4, LINC02578, BRINP1). | Gain of chromosomes 7, 8, 18, 19, and 22. |
| Chromosomal Losses | No chromosomal losses detected. | Monosomy 3 at limit of detection with additional losses of chromosomes 4, 12, and 16q. |
| Monosomy 3 FISH Status | Positive, 63.5% of 200 cells counted (28% cutoff). | Negative. |
Disclaimer/Publisher’s Note: The statements, opinions and data contained in all publications are solely those of the individual author(s) and contributor(s) and not of MDPI and/or the editor(s). MDPI and/or the editor(s) disclaim responsibility for any injury to people or property resulting from any ideas, methods, instructions or products referred to in the content. |
© 2023 by the authors. Licensee MDPI, Basel, Switzerland. This article is an open access article distributed under the terms and conditions of the Creative Commons Attribution (CC BY) license (https://creativecommons.org/licenses/by/4.0/).
Share and Cite
Long, C.P.; Coley, N.; Thorson, J.; Lin, J.H. Interpreting Discordant Monosomy 3 FISH and Chromosomal Microarray Analysis Results in Uveal Melanoma. Diagnostics 2023, 13, 946. https://doi.org/10.3390/diagnostics13050946
Long CP, Coley N, Thorson J, Lin JH. Interpreting Discordant Monosomy 3 FISH and Chromosomal Microarray Analysis Results in Uveal Melanoma. Diagnostics. 2023; 13(5):946. https://doi.org/10.3390/diagnostics13050946
Chicago/Turabian StyleLong, Christopher P., Nicholas Coley, John Thorson, and Jonathan H. Lin. 2023. "Interpreting Discordant Monosomy 3 FISH and Chromosomal Microarray Analysis Results in Uveal Melanoma" Diagnostics 13, no. 5: 946. https://doi.org/10.3390/diagnostics13050946