
Using Visual Patient to Show Vital Sign Predictions, a Computer-Based Mixed Quantitative and Qualitative Simulation Study
 , , , , , ,
  , and
, and
Abstract
:1. Introduction
2. Methods
2.1. Study Design and Population
2.2. VP and VP Predictive
2.2.1. Condition
2.2.2. Urgency
2.3. Study Procedure
2.3.1. Part I: Simulation Study
2.3.2. Part II: Standardized Interviews
2.3.3. Part III: Online Survey
2.4. Outcomes
2.4.1. Part I: Simulation Study
2.4.2. Part II and III: Standardized Interviews and Online Survey
2.5. Statistical Analysis
2.5.1. Part I: Simulation Study
2.5.2. Part II and III: Standardized Interviews and Online Survey
2.5.3. Sample Size Calculation
3. Results
3.1. Part I: Simulation Study
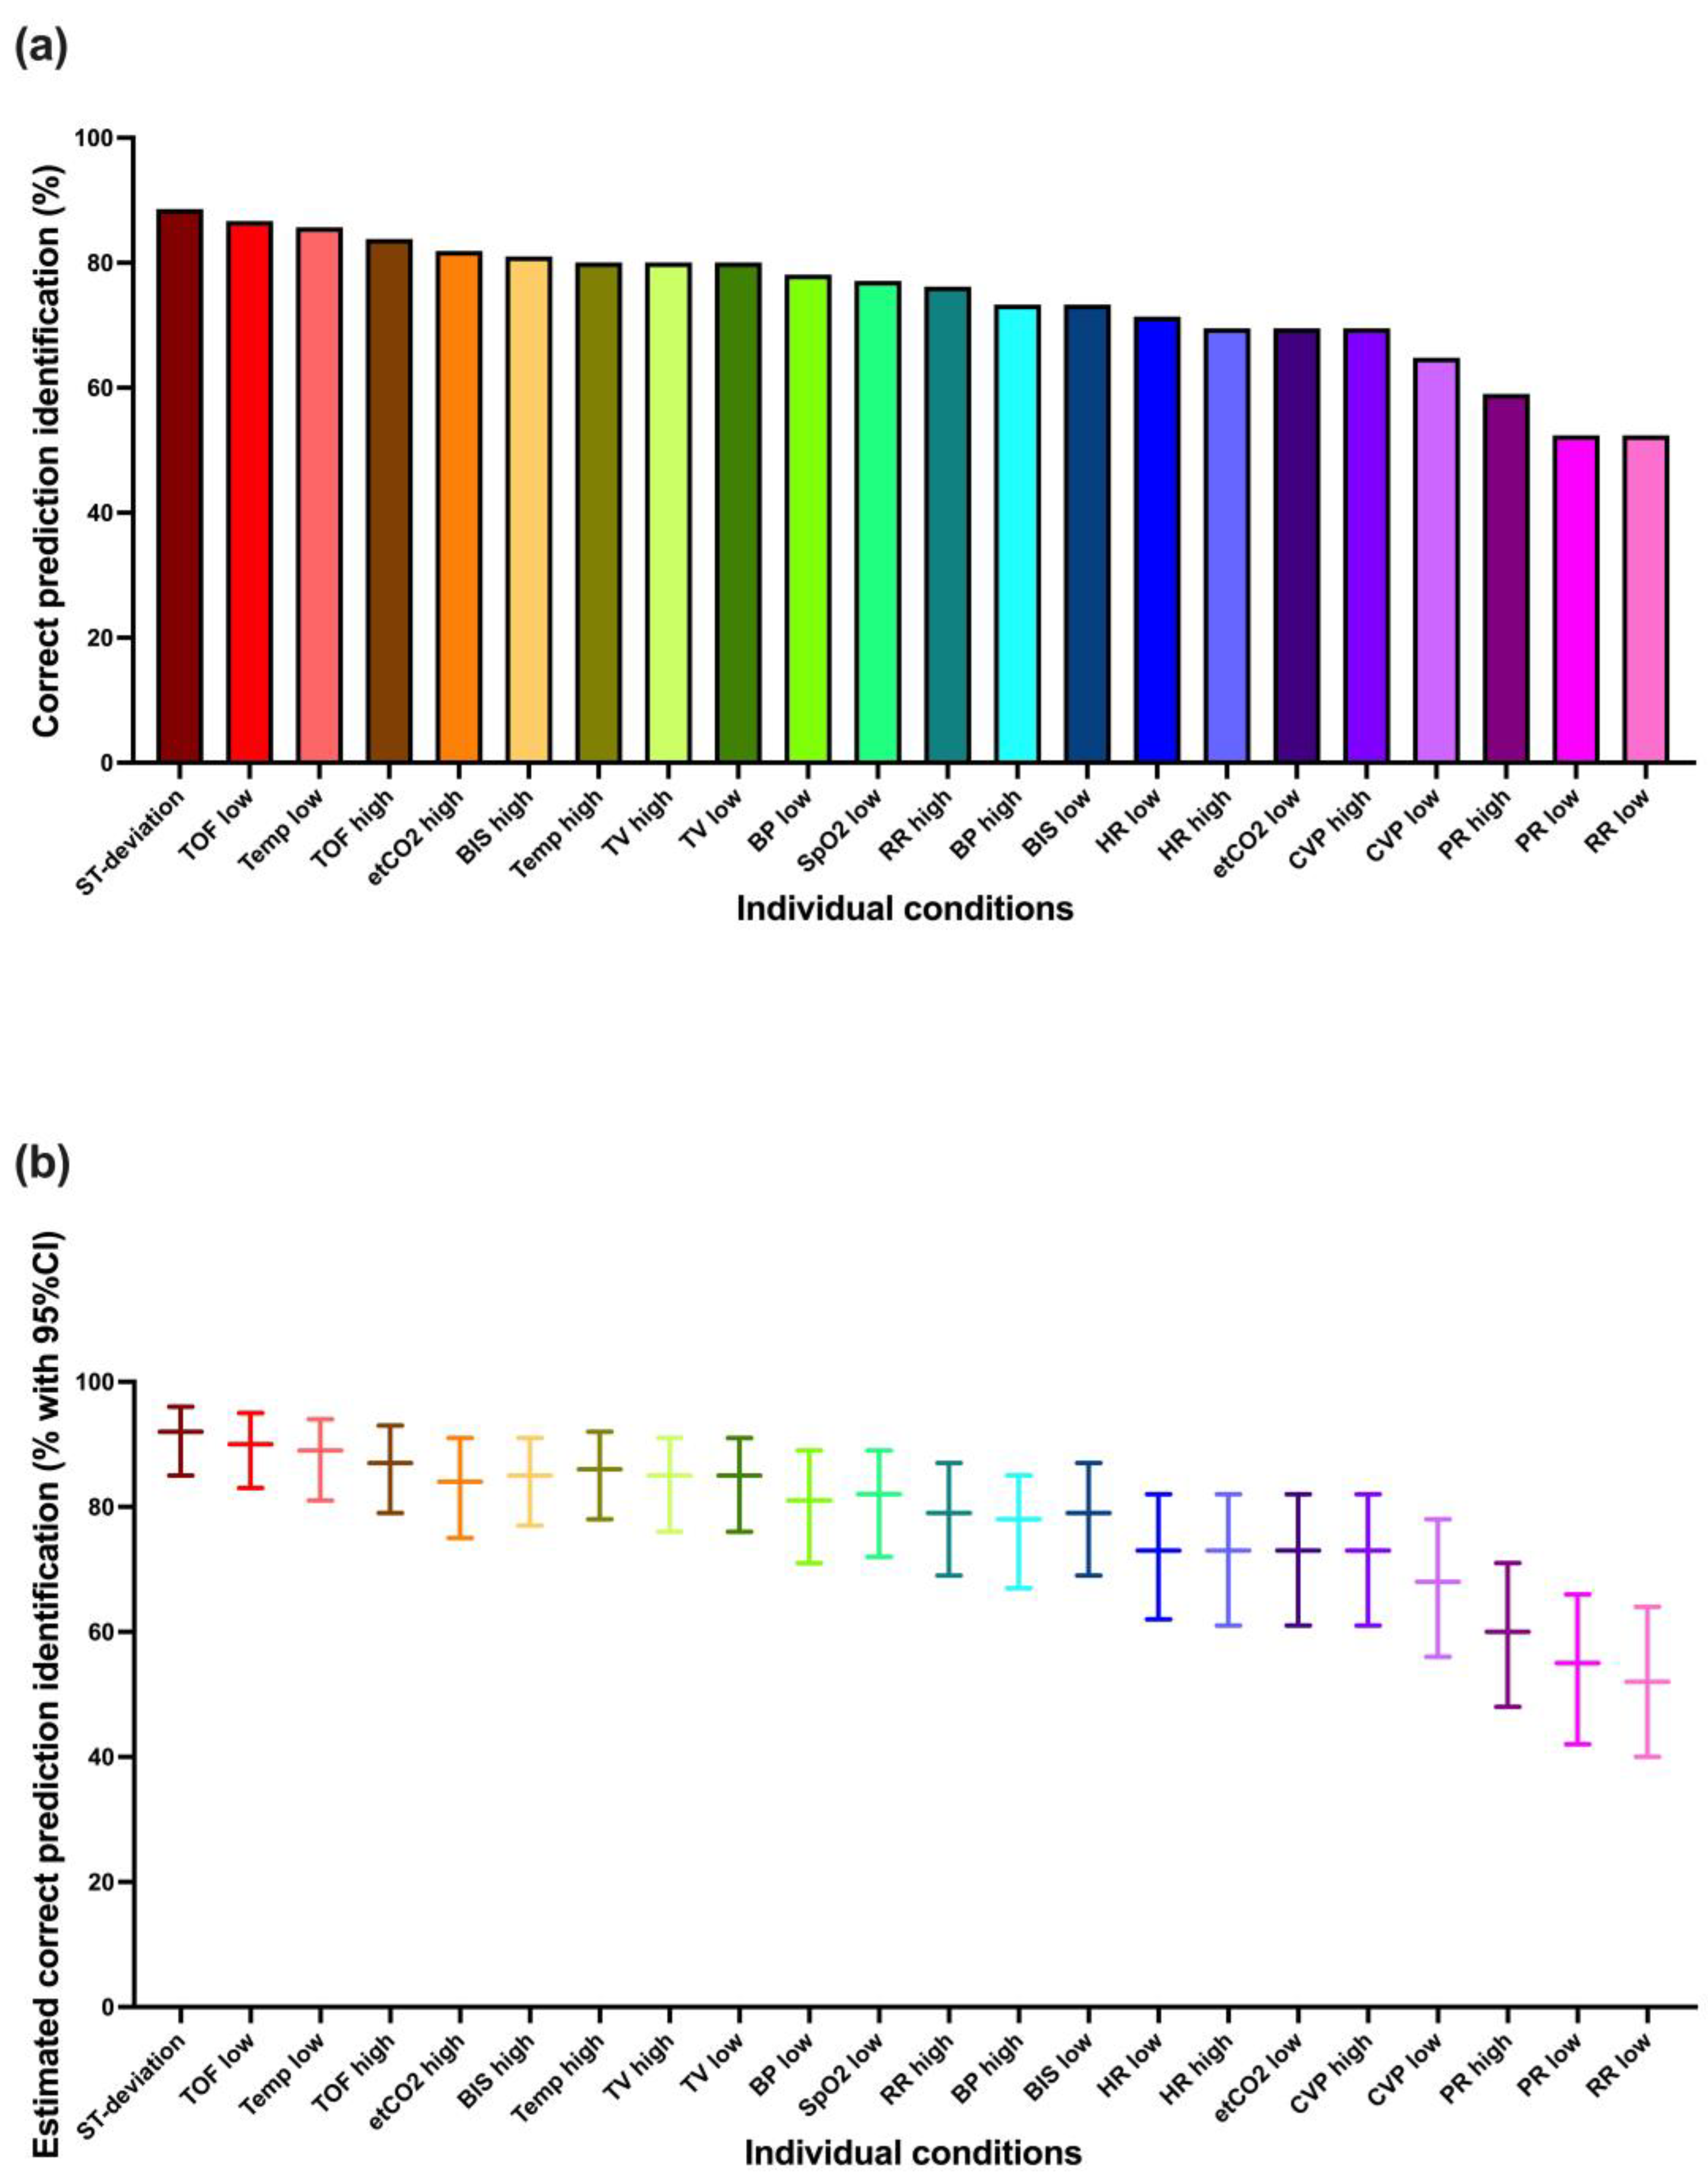
3.1.1. Correct Prediction Identification
3.1.2. Correct Condition Identification
3.1.3. Correct Urgency Identification
3.1.4. Learning Effect
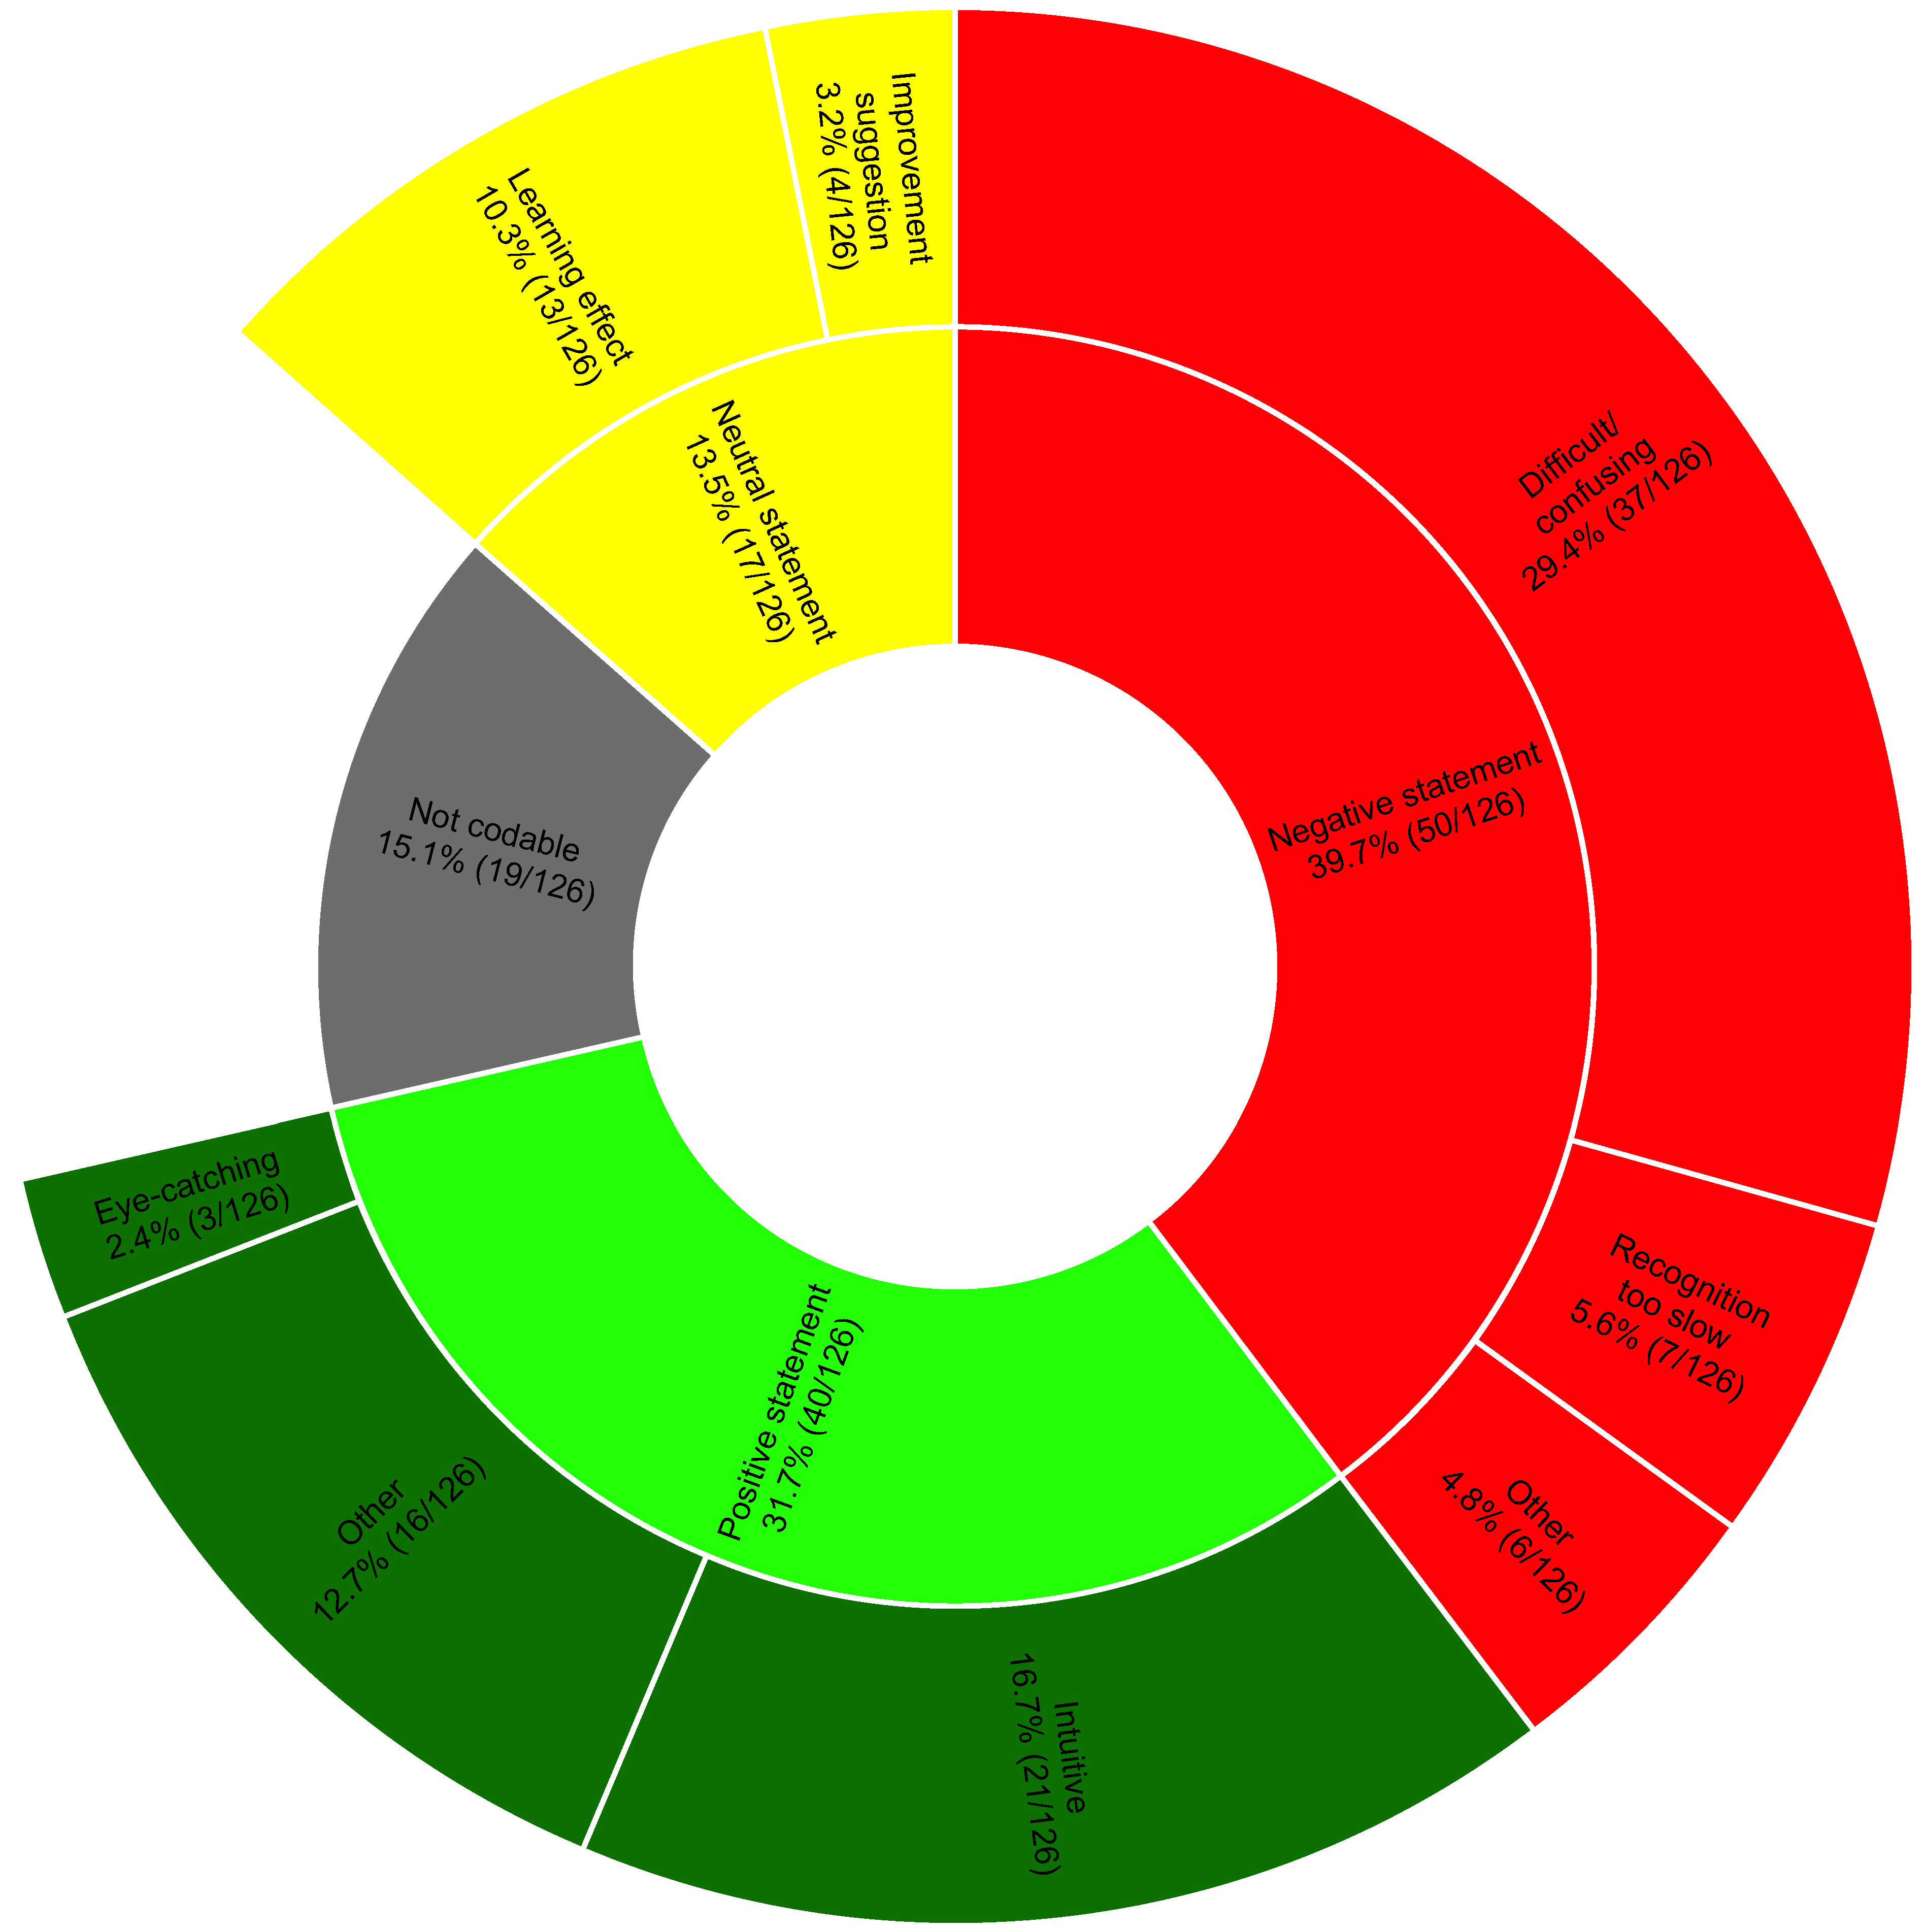
3.2. Part II: Standardized Interviews
3.3. Part III: Online Survey
4. Discussion
Strengths and Limitations
5. Conclusions
Supplementary Materials
Author Contributions
Funding
Institutional Review Board Statement
Informed Consent Statement
Data Availability Statement
Acknowledgments
Conflicts of Interest
References
- Rajkomar, A.; Dean, J.; Kohane, I. Machine Learning in Medicine. N. Engl. J. Med. 2019, 380, 1347–1358. [Google Scholar] [CrossRef]
- Shilo, S.; Rossman, H.; Segal, E. Axes of a revolution: Challenges and promises of big data in healthcare. Nat. Med. 2020, 26, 29–38. [Google Scholar] [CrossRef] [PubMed]
- Pastorino, R.; De Vito, C.; Migliara, G.; Glocker, K.; Binenbaum, I.; Ricciardi, W.; Boccia, S. Benefits and challenges of Big Data in healthcare: An overview of the European initiatives. Eur. J. Public. Health 2019, 29 (Suppl. 3), 23–27. [Google Scholar] [CrossRef]
- Haug, C.J.; Drazen, J.M. Artificial Intelligence and Machine Learning in Clinical Medicine, 2023. N. Engl. J. Med. 2023, 388, 1201–1208. [Google Scholar] [CrossRef]
- Shah, N.H.; Milstein, A.; Bagley, S.C. Making Machine Learning Models Clinically Useful. JAMA 2019, 322, 1351–1352. [Google Scholar] [CrossRef] [PubMed]
- Gambus, P.L.; Jaramillo, S. Machine learning in anaesthesia: Reactive, proactive... predictive! Br. J. Anaesth. 2019, 123, 401–403. [Google Scholar] [CrossRef] [PubMed]
- Topol, E.J. High-performance medicine: The convergence of human and artificial intelligence. Nat. Med. 2019, 25, 44–56. [Google Scholar] [CrossRef]
- Ben-Israel, D.; Jacobs, W.B.; Casha, S.; Lang, S.; Ryu WH, A.; de Lotbiniere-Bassett, M.; Cadotte, D.W. The impact of machine learning on patient care: A systematic review. Artif. Intell. Med. 2020, 103, 101785. [Google Scholar] [CrossRef]
- Shehab, M.; Abualigah, L.; Shambour, Q.; Abu-Hashem, M.A.; Shambour MK, Y.; Alsalibi, A.I.; Gandomi, A.H. Machine learning in medical applications: A review of state-of-the-art methods. Comput. Biol. Med. 2022, 145, 105458. [Google Scholar] [CrossRef]
- Emanuel, E.J.; Wachter, R.M. Artificial Intelligence in Health Care: Will the Value Match the Hype? JAMA 2019, 321, 2281–2282. [Google Scholar] [CrossRef]
- Gianfrancesco, M.A.; Tamang, S.; Yazdany, J.; Schmajuk, G. Potential Biases in Machine Learning Algorithms Using Electronic Health Record Data. JAMA Intern. Med. 2018, 178, 1544–1547. [Google Scholar] [CrossRef] [PubMed]
- Hashimoto, D.A.; Witkowski, E.; Gao, L.; Meireles, O.; Rosman, G. Artificial Intelligence in Anesthesiology: Current Techniques, Clinical Applications, and Limitations. Anesthesiology 2020, 132, 379–394. [Google Scholar] [CrossRef] [PubMed]
- Editorial. Towards trustable machine learning. Nat. Biomed. Eng. 2018, 2, 709–710. [CrossRef] [PubMed]
- Navarro, C.L.A.; Damen, J.A.; Takada, T.; Nijman, S.W.; Dhiman, P.; Ma, J.; Collins, G.S.; Bajpai, R.; Riley, R.D.; Moons, K.G.; et al. Risk of bias in studies on prediction models developed using supervised machine learning techniques: Systematic review. BMJ 2021, 375, n2281. [Google Scholar] [CrossRef]
- Xu, J.; Xiao, Y.; Wang, W.H.; Ning, Y.; Shenkman, E.A.; Bian, J.; Wang, F. Algorithmic fairness in computational medicine. EBioMedicine 2022, 84, 104250. [Google Scholar] [CrossRef]
- Ghassemi, M.; Nsoesie, E.O. In medicine, how do we machine learn anything real? Patterns 2022, 3, 100392. [Google Scholar] [CrossRef]
- Ehrmann, D.E.; Gallant, S.N.; Nagaraj, S.; Goodfellow, S.D.; Eytan, D.; Goldenberg, A.; Mazwi, M.L. Evaluating and reducing cognitive load should be a priority for machine learning in healthcare. Nat. Med. 2022, 28, 1331–1333. [Google Scholar] [CrossRef]
- Tscholl, D.W.; Rössler, J.; Said, S.; Kaserer, A.; Spahn, D.R.; Nöthiger, C.B. Situation Awareness-Oriented Patient Monitoring with Visual Patient Technology: A Qualitative Review of the Primary Research. Sensors 2020, 20, 2112. [Google Scholar] [CrossRef]
- Roche, T.R.; Said, S.; Braun, J.; Maas, E.J.; Machado, C.; Grande, B.; Kolbe, M.; Spahn, D.R.; Nöthiger, C.B.; Tscholl, D.W. Avatar-based patient monitoring in critical anaesthesia events: A randomised high-fidelity simulation study. Br. J. Anaesth. 2021, 126, 1046–1054. [Google Scholar] [CrossRef]
- Tscholl, D.W.; Weiss, M.; Handschin, L.; Spahn, D.R.; Nöthiger, C.B. User perceptions of avatar-based patient monitoring: A mixed qualitative and quantitative study. BMC Anesthesiol. 2018, 18, 188. [Google Scholar] [CrossRef]
- Cheng, A.; Kessler, D.; Mackinnon, R.; Chang, T.P.; Nadkarni, V.M.; Hunt, E.A.; Duval-Arnould, J.; Lin, Y.; Cook, D.A.; Pusic, M.; et al. Reporting Guidelines for Health Care Simulation Research: Extensions to the CONSORT and STROBE Statements. Simul. Healthc. 2016, 11, 238–248. [Google Scholar] [CrossRef] [PubMed]
- Tscholl, D.W.; Weiss, M.; Spahn, D.R.; Noethiger, C.B. How to Conduct Multimethod Field Studies in the Operating Room: The iPad Combined with a Survey App as a Valid and Reliable Data Collection Tool. JMIR Res. Protoc. 2016, 5, e4. [Google Scholar] [CrossRef]
- Brooks, J.; McCluskey, S.; Turley, E.; King, N. The Utility of Template Analysis in Qualitative Psychology Research. Qual. Res. Psychol. 2015, 12, 202–222. [Google Scholar] [CrossRef] [PubMed]
- Kurup, V.; Matei, V.; Ray, J. Role of in-situ simulation for training in healthcare: Opportunities and challenges. Curr. Opin. Anaesthesiol. 2017, 30, 755–760. [Google Scholar] [CrossRef] [PubMed]
- Merry, A.F.; Hannam, J.A.; Webster, C.S.; Edwards, K.E.; Torrie, J.; Frampton, C.; Wheeler, D.W.; Gupta, A.K.; Mahajan, R.P.; Evley, R.; et al. Retesting the Hypothesis of a Clinical Randomized Controlled Trial in a Simulation Environment to Validate Anesthesia Simulation in Error Research (the VASER Study). Anesthesiology 2017, 126, 472–481. [Google Scholar] [CrossRef]
- Moorthy, K.; Vincent, C.; Darzi, A. Simulation based training. BMJ 2005, 330, 493–494. [Google Scholar] [CrossRef]


| Part I (Simulation Study) | Part II (Standardized Interviews) | Part III (Online Survey) | |
|---|---|---|---|
| Participants characteristics | |||
| Participants, n | 70 | 21 | 49 |
| Participants from USZ, n (%) | 35 (50) | 0 (0) | |
| Participants from UKW, n (%) | 18 (26) | 15 (71) | |
| Participants from KGU, n (%) | 17 (24) | 6 (29) | |
| Gender female, n (%) | 42 (60) | 15 (71) | |
| Resident physicians, n (%) | 56 (80) | 17 (81) | 34 (69) |
| Staff physicians, n (%) | 14 (20) | 4 (19) | 15 (31) |
| Age (years), median (IQR) | 31 (28–35) | 33 (27.5–35.5) | 34 (28–37) |
| Work experience (years), median (IQR) | 3.5 (1–6) | 3 (1.5–8) | 4 (2–7) |
| Previous experience with Visual Patient, n (%) | 19 (27) | 4 (19) | |
| Study characteristics | |||
| Different conditions studied, n | 22 | ||
| Different urgencies studied, n | 3 | ||
| Different predictions studied, n | 66 | ||
| Randomly selected predictions per participant, n | 33 |
Disclaimer/Publisher’s Note: The statements, opinions and data contained in all publications are solely those of the individual author(s) and contributor(s) and not of MDPI and/or the editor(s). MDPI and/or the editor(s) disclaim responsibility for any injury to people or property resulting from any ideas, methods, instructions or products referred to in the content. |
© 2023 by the authors. Licensee MDPI, Basel, Switzerland. This article is an open access article distributed under the terms and conditions of the Creative Commons Attribution (CC BY) license (https://creativecommons.org/licenses/by/4.0/).
Share and Cite
Malorgio, A.; Henckert, D.; Schweiger, G.; Braun, J.; Zacharowski, K.; Raimann, F.J.; Piekarski, F.; Meybohm, P.; Hottenrott, S.; Froehlich, C.; et al. Using Visual Patient to Show Vital Sign Predictions, a Computer-Based Mixed Quantitative and Qualitative Simulation Study. Diagnostics 2023, 13, 3281. https://doi.org/10.3390/diagnostics13203281
Malorgio A, Henckert D, Schweiger G, Braun J, Zacharowski K, Raimann FJ, Piekarski F, Meybohm P, Hottenrott S, Froehlich C, et al. Using Visual Patient to Show Vital Sign Predictions, a Computer-Based Mixed Quantitative and Qualitative Simulation Study. Diagnostics. 2023; 13(20):3281. https://doi.org/10.3390/diagnostics13203281
Chicago/Turabian StyleMalorgio, Amos, David Henckert, Giovanna Schweiger, Julia Braun, Kai Zacharowski, Florian J. Raimann, Florian Piekarski, Patrick Meybohm, Sebastian Hottenrott, Corinna Froehlich, and et al. 2023. "Using Visual Patient to Show Vital Sign Predictions, a Computer-Based Mixed Quantitative and Qualitative Simulation Study" Diagnostics 13, no. 20: 3281. https://doi.org/10.3390/diagnostics13203281