
The Effect of Magnetic Resonance Imaging Based Radiomics Models in Discriminating stage I–II and III–IVa Nasopharyngeal Carcinoma
Abstract
:1. Introduction
2. Materials and Methods
2.1. Patients
2.2. Image Acquisition
2.3. Patient Restaging and Human Visual Assessment
2.4. Image Segmentation and Feature Extraction
2.5. Interobserver and Intraobserver Agreement
2.6. Dimensionality Reduction and Radiomics Feature Selection
2.7. Construction of the Radiomics Model
2.8. Statistics Analysis
3. Results
3.1. Patient Characteristics
3.2. Interobserver and Intraobserver Agreement
3.3. Dimensionality Reduction and Radiomics Feature Selection
3.4. Performance of Different Models and Radiologists
4. Discussion
5. Conclusions
Supplementary Materials
Author Contributions
Funding
Institutional Review Board Statement
Informed Consent Statement
Data Availability Statement
Acknowledgments
Conflicts of Interest
References
- Bray, F.; Ferlay, J.; Soerjomataram, I.; Siegel, R.L.; Torre, L.A.; Jemal, A. Global cancer statistics 2018: GLOBOCAN estimates of incidence and mortality worldwide for 36 cancers in 185 countries. CA Cancer J. Clin. 2018, 68, 394–424. [Google Scholar] [CrossRef] [PubMed] [Green Version]
- Chen, Y.P.; Chan, A.T.C.; Le, Q.T.; Blanchard, P.; Sun, Y.; Ma, J. Nasopharyngeal carcinoma. Lancet 2019, 394, 64–80. [Google Scholar] [CrossRef] [PubMed]
- Chua, M.L.K.; Wee, J.T.S.; Hui, E.P.; Chan, A. Nasopharyngeal carcinoma. Lancet 2016, 387, 1012–1024. [Google Scholar] [CrossRef]
- Mao, Y.P.; Tang, L.L.; Chen, L.; Sun, Y.; Qi, Z.Y.; Zhou, G.Q.; Liu, L.Z.; Li, L.; Lin, A.H.; Ma, J. Prognostic factors and failure patterns in non-metastatic nasopharyngeal carcinoma after intensity-modulated radiotherapy. Chin. J. Cancer 2016, 35, 103. [Google Scholar] [CrossRef] [PubMed] [Green Version]
- Colevas, A.D.; Yom, S.S.; Pfister, D.G.; Spencer, S.; Adelstein, D.; Adkins, D.; Brizel, D.M.; Burtness, B.; Busse, P.M.; Caudell, J.J.; et al. NCCN guidelines insights: Head and neck cancers, version 1.2018. J. Natl. Compr. Cancer Netw. 2018, 16, 479–490. [Google Scholar] [CrossRef] [Green Version]
- Rajinikanth, V.; Dey, N. Magnetic Resonance Imaging: Recording, Reconstruction and Assessment; Elsevier: Amsterdam, The Netherlands, 2022; pp. 1–27. [Google Scholar]
- Liao, X.B.; Mao, Y.P.; Liu, L.Z.; Tang, L.L.; Sun, Y.; Wang, Y.; Lin, A.H.; Cui, C.Y.; Li, L.; Ma, J. How does magnetic resonance imaging influence staging according to AJCC staging system for nasopharyngeal carcinoma compared with computed tomography? Int. J. Radiat. Oncol. Biol. Phys. 2008, 72, 1368–1377. [Google Scholar] [CrossRef]
- Miller, F.R.; Wanamaker, J.R.; Lavertu, P.; Wood, B.G. Magnetic resonance imaging and the management of parapharyngeal space tumors. Head Neck 1996, 18, 67–77. [Google Scholar] [CrossRef]
- Chen, W.S.; Li, J.J.; Hong, L.; Xing, Z.B.; Wang, F.; Li, C.Q. Comparison of MRI, CT and 18F-FDG PET/CT in the diagnosis of local and metastatic of nasopharyngeal carcinomas: An updated meta-analysis of clinical studies. Am. J. Transl. Res. 2016, 8, 4532–4547. [Google Scholar]
- Zhao, L.; Pang, Y.; Zheng, H.; Han, C.; Gu, J.; Sun, L.; Wu, H.; Wu, S.; Lin, Q.; Chen, H. Clinical utility of [68Ga] Ga-labeled fibroblast activation protein inhibitor (FAPI) positron emission tomography/computed tomography for primary staging and recurrence detection in nasopharyngeal carcinoma. Eur. J. Nucl. Med. Mol. Imaging 2021, 48, 3606–3617. [Google Scholar] [CrossRef]
- Lee, A.W.M.; Ng, W.T.; Chan, J.Y.W.; Corry, J.; Mäkitie, A.; Mendenhall, W.M.; Rinaldo, A.; Rodrigo, J.P.; Saba, N.F.; Strojan, P.; et al. Management of locally recurrent nasopharyngeal carcinoma. Cancer Treat. Rev. 2019, 79, 101890. [Google Scholar] [CrossRef]
- Zhang, L.; Dong, D.; Li, H.; Tian, J.; Ouyang, F.; Mo, X.; Zhang, B.; Luo, X.; Lian, Z.; Pei, S.; et al. Development and validation of a magnetic resonance imaging-based model for the prediction of distant metastasis before initial treatment of nasopharyngeal carcinoma: A retrospective cohort study. EBioMedicine 2019, 40, 327–335. [Google Scholar] [CrossRef] [PubMed]
- Chakraborty, S.; Chatterjee, S.; Ashour, A.S.; Mali, K.; Dey, N. Intelligent Computing in Medical Imaging: A Study. In Advancements in Applied Metaheuristic Computing; Dey, N., Ed.; IGI Global: Hershey, PA, USA, 2018; pp. 143–163. [Google Scholar]
- Zhang, B.; He, X.; Ouyang, F.; Gu, D.; Dong, Y.; Zhang, L.; Mo, X.; Huang, W.; Tian, J.; Zhang, S. Radiomic machine-learning classifiers for prognostic biomarkers of advanced nasopharyngeal carcinoma. Cancer Lett. 2017, 403, 21–27. [Google Scholar] [CrossRef] [PubMed]
- Aerts, H.J.; Velazquez, E.R.; Leijenaar, R.T.; Parmar, C.; Grossmann, P.; Carvalho, S.; Bussink, J.; Monshouwer, R.; Haibe-Kains, B.; Rietveld, D.; et al. Decoding tumour phenotype by noninvasive imaging using a quantitative radiomics approach. Nat. Commun. 2014, 5, 4006. [Google Scholar] [CrossRef] [Green Version]
- Kadoya, N.; Tanaka, S.; Kajikawa, T.; Tanabe, S.; Abe, K.; Nakajima, Y.; Yamamoto, T.; Takahashi, N.; Takeda, K.; Dobashi, S.; et al. Homology-based radiomic features for prediction of the prognosis of lung cancer based on CT-based radiomics. Med. Phys. 2020, 47, 2197–2205. [Google Scholar] [CrossRef]
- Avanzo, M.; Stancanello, J.; Pirrone, G.; Sartor, G. Radiomics and deep learning in lung cancer. Strahlenther. Onkol. 2020, 196, 879–887. [Google Scholar] [CrossRef]
- Ji, G.W.; Zhu, F.P.; Xu, Q.; Wang, K.; Wu, M.Y.; Tang, W.W.; Li, X.C.; Wang, X.H. Radiomic Features at contrast-enhanced CT predict recurrence in early stage hepatocellular carcinoma: A multi-institutional study. Radiology 2020, 294, 568–579. [Google Scholar] [CrossRef] [PubMed]
- Huang, X.; Mai, J.; Huang, Y.; He, L.; Chen, X.; Wu, X.; Li, Y.; Yang, X.; Dong, M.; Huang, J.; et al. Radiomic nomogram for pretreatment prediction of pathologic complete response to neoadjuvant therapy in breast cancer: Predictive value of staging contrast-enhanced CT. Clin. Breast Cancer 2021, 21, e388–e404. [Google Scholar] [CrossRef]
- Conti, A.; Duggento, A.; Indovina, I.; Guerrisi, M.; Toschi, N. Radiomics in breast cancer classification and prediction. Semin. Cancer Biol. 2021, 72, 238–250. [Google Scholar] [CrossRef]
- Huang, X.; Shu, J.; Yan, Y.; Chen, X.; Yang, C.; Zhou, T.; Li, M. Feasibility of magnetic resonance imaging-based radiomics features for preoperative prediction of extrahepatic cholangiocarcinoma stage. Eur. J. Cancer 2021, 155, 227–235. [Google Scholar] [CrossRef]
- Lan, G.Y.; Guo, Y.; Zhang, X.Y.; Cai, X.L.; Shi, Y. Value of radiomic analysis of data from magnetic resonance elastography for diagnosing fibrosis stages in patients with hepatitis B/C. Chin. J. Acad. Radiol. 2019, 1, 74–84. [Google Scholar] [CrossRef] [Green Version]
- Zhao, L.; Gong, J.; Xi, Y.; Xu, M.; Li, C.; Kang, X.; Yin, Y.; Qin, W.; Yin, H.; Shi, M. MRI-based radiomics nomogram may predict the response to induction chemotherapy and survival in locally advanced nasopharyngeal carcinoma. Eur. Radiol. 2020, 30, 537–546. [Google Scholar] [CrossRef]
- Zhang, L.L.; Huang, M.Y.; Li, Y.; Liang, J.H.; Gao, T.S.; Deng, B.; Yao, J.J.; Lin, L.; Chen, F.P.; Huang, X.D.; et al. Pretreatment MRI radiomics analysis allows for reliable prediction of local recurrence in non-metastatic T4 nasopharyngeal carcinoma. EBioMedicine 2019, 42, 270–280. [Google Scholar] [CrossRef] [Green Version]
- Cai, M.W.; Wang, J.Z.; Yang, Q.; Guo, Y.; Zhang, Z.; Ying, H.M.; Hu, W.G.; Hu, C.S. Combining images and T-staging information to improve the automatic segmentation of nasopharyngeal carcinoma tumors in MR images. IEEE Access 2021, 9, 21323–21331. [Google Scholar] [CrossRef]
- Zhong, L.Z.; Fang, X.L.; Dong, D.; Peng, H.; Fang, M.J.; Huang, C.L.; He, B.X.; Lin, L.; Ma, J.; Tang, L.L.; et al. A deep learning MR-based radiomic nomogram may predict survival for nasopharyngeal carcinoma patients with stage T3N1M0. Radiother. Oncol. 2020, 151, 1–9. [Google Scholar] [CrossRef]
- Yang, K.; Tian, J.; Zhang, B.; Li, M.; Xie, W.; Zou, Y.; Tan, Q.; Liu, L.; Zhu, J.; Shou, A.; et al. A multidimensional nomogram combining overall stage, dose volume histogram parameters and radiomics to predict progression-free survival in patients with locoregionally advanced nasopharyngeal carcinoma. Oral Oncol. 2019, 98, 85–91. [Google Scholar] [CrossRef]
- Wu, S.; Li, H.; Dong, A.; Tian, L.; Ruan, G.; Liu, L.; Shao, Y. Differences in radiomics signatures between patients with early and advanced T-stage nasopharyngeal carcinoma facilitate prognostication. J. Magn. Reson. Imaging 2021, 54, 854–865. [Google Scholar] [CrossRef] [PubMed]
- Huang, J.; He, R.H.; Chen, J.; Li, S.; Deng, Y.Q.; Wu, X.L. Boosting advanced nasopharyngeal carcinoma stage prediction using a Two-stage classification framework based on deep learning. Int. J. Comput. Intell. Syst. 2021, 14, 184. [Google Scholar] [CrossRef]
- Yang, Q.; Guo, Y.; Ou, X.; Wang, J.; Hu, C. Automatic T staging using weakly supervised deep learning for nasopharyngeal carcinoma on MR images. J. Magn. Reson. Imaging 2020, 52, 1074–1082. [Google Scholar] [CrossRef] [PubMed]
- Huang, Y.Q.; Liang, C.H.; He, L.; Tian, J.; Liang, C.S.; Chen, X.; Ma, Z.L.; Liu, Z.Y. Development and validation of a radiomic nomogram for preoperative prediction of lymph node metastasis in colorectal cancer. J. Clin. Oncol. 2016, 34, 2157–2164. [Google Scholar] [CrossRef] [PubMed]
- Tibshirani, R. The lasso method for variable selection in the Cox model. Stat. Med. 1997, 16, 385–395. [Google Scholar] [CrossRef]
- Ren, J.; Tian, J.; Yuan, Y.; Dong, D.; Li, X.; Shi, Y.; Tao, X. Magnetic resonance imaging based radiomics signature for the preoperative discrimination of stage I–II and III–IV head and neck squamous cell carcinoma. Eur. J. Radiol. 2018, 106, 1–6. [Google Scholar] [CrossRef]
- Huang, W.; Quan, T.; Zhao, Q.; Li, S.; Cai, Y.; Zhou, J.; Luo, C.; Ruan, G.; Cui, C.; Liang, S.; et al. MRI of nasopharyngeal carcinoma: Parapharyngeal subspace involvement has prognostic value and influences T-staging in the IMRT era. Eur. Radiol. 2022, 32, 262–271. [Google Scholar] [CrossRef]


| Training Cohort | Validation Cohort | p | |
|---|---|---|---|
| n = 229 | n = 100 | ||
| Age(years) | 50.341 ± 10.274 | 48.570 ± 11.488 | 0.241 |
| Gender | 0.817 | ||
| Male | 162 (70.742%) | 72 (72.000%) | |
| Female | 67 (29.258%) | 28 (28.000%) | |
| Smoking | 0.367 | ||
| Yes | 120 (52.402%) | 47 (47.000%) | |
| No | 109 (47.598%) | 53 (53.000%) | |
| Drinking | 0.186 | ||
| Yes | 105 (45.852%) | 38 (38.000%) | |
| No | 124 (54.148%) | 62 (62.000%) | |
| T stage | 0.528 | ||
| T1 | 36 (15.721%) | 17 (17.000%) | |
| T2 | 90 (39.301%) | 42 (42.000%) | |
| T3 | 63 (27.511%) | 20 (20.000%) | |
| T4 | 40 (17.467%) | 21 (21.000%) | |
| N stage | 0.624 | ||
| N0 | 49 (21.397%) | 24 (24.000%) | |
| N1 | 99 (43.231%) | 44 (44.000%) | |
| N2 | 55 (24.017%) | 18 (18.000%) | |
| N3 | 26 (11.354%) | 14 (14.000%) | |
| Clinical stage | 0.701 | ||
| I | 13 (5.677%) | 6 (6.000%) | |
| II | 71 (31.004%) | 31 (31.000%) | |
| III | 82 (35.808%) | 30 (30.000%) | |
| IV | 63 (27.511%) | 33 (33.000%) |
| Sequence | Numbers of Selected Features | Selected Features | Coefficients |
|---|---|---|---|
| A (CE-T1WI + T1WI + T2WI) | 13 | Intercept | −2.29674179 |
| CE-T1WI_Shape_LeastAxisLength | 0.74147306 | ||
| CE-T1WI_Shape_Maximum2DDiameterSlice | 0.85277531 | ||
| CE-T1WI_LoG.sigma.2.0.mm.3D_GLSZM_ZoneEntropy | 3.20584709 | ||
| T1WI_Wavelet.HLH_GLCM_InverseVariance | 0.13071358 | ||
| T2WI_Wavelet.LLL_firstorder_10Percentile | −0.10023274 | ||
| CE-T1WI_Wavelet.HLL_firstorder_Mean | 0.01520543 | ||
| CE-T1WI_Wavelet.HHL_GLCM_Imc1 | 0.43246473 | ||
| CE-T1WI_Wavelet.LLL_GLCM_ClusterShade | 0.01804038 | ||
| CE-T1WI_NGTDM_Busyness | 0.08374613 | ||
| T1WI_LoG.sigma.0.5.mm.3D_GLSZM_GrayLevelNonUniformity | 0.20730698 | ||
| T1WI_Wavelet.LLH_GLCM_MaximumProbability | −0.57803318 | ||
| T2WI_LoG.sigma.2.0.mm.3D_firstorder_Median | 0.30651800 | ||
| T2WI_Wavelet.LLL_firstorder_Median | −0.81238312 | ||
| B (CE-T1 WI + T1WI) | 9 | Intercept | −3.55286386 |
| CE-T1WI_Shape_LeastAxisLength | 1.19584018 | ||
| CE-T1WI_Shape_Maximum2DDiameterSlice | 0.63791229 | ||
| CE-T1WI_LoG.sigma.2.0.mm.3D_GLSZM_ZoneEntropy | 3.25384123 | ||
| CE-T1WI_Wavelet.HLL_firstorder_Mean | 0.08296501 | ||
| CE-T1WI_Wavelet.HHL_GLCM_Imc1 | 0.30143138 | ||
| CE-T1WI_Wavelet.LLL_GLCM_ClusterShade | 0.02020103 | ||
| CE-T1WI_NGTDM_Busyness | 0.12360246 | ||
| T1WI_LoG.sigma.0.5.mm.3D_GLSZM_GrayLevelNonUniformity | 0.23228234 | ||
| T1WI_Wavelet.LLH_GLCM_MaximumProbability | −0.67821075 | ||
| C (T2WI + T1WI) | 7 | Intercept | −0.45953586 |
| T2WI_LoG.sigma.2.0.mm.3D_firstorder_Median | 0.66448895 | ||
| T2WI_Wavelet.LLL_firstorder_Median | −0.11340379 | ||
| T1WI_Shape_LeastAxisLength | 0.07440248 | ||
| T1WI_Shape_Maximum2DDiameterSlice | 1.30038478 | ||
| T1WI_Shape_MinorAxisLength | 0.04818318 | ||
| T1WI_LoG.sigma.0.5.mm.3D_GLSZM_GrayLevelNonUniformity | 0.48611908 | ||
| T1WI_Wavelet.LLH_GLCM_MaximumProbability | −0.03052694 | ||
| D (CE-T1 WI + T2WI) | 9 | Intercept | −3.66635179 |
| CE-T1WI_Shape_LeastAxisLength | 0.64460654 | ||
| CE-T1WI_Shape_Maximum2DDiameterSlice | 0.96018848 | ||
| CE-T1WI_LoG.sigma.2.0.mm.3D_GLSZM_ZoneEntropy | 3.95808134 | ||
| T2WI_Wavelet.LLL_firstorder_10Percentile | −0.21538833 | ||
| CE-T1WI_Wavelet.HHL_GLCM_Imc1 | 0.30330139 | ||
| CE-T1WI_Wavelet.LLL_GLCM_ClusterShade | 0.00170924 | ||
| CE-T1WI_NGTDM_Busyness | 0.14266115 | ||
| T2WI_LoG.sigma.2.0.mm.3D_firstorder_Median | 0.36736992 | ||
| T2WI_Wavelet.LLL_firstorder_Median | −0.49868865 | ||
| E (CE-T1WI) | 10 | Intercept | −4.66905571 |
| Shape_LeastAxisLength | 1.33242867 | ||
| Shape_Maximum2DDiameterSlice | 0.84780188 | ||
| LoG.sigma.2.0.mm.3D_GLSZM_ZoneEntropy | 3.51313223 | ||
| Wavelet.LHL_GLCM_InverseVariance | −0.16837098 | ||
| LoG.sigma.2.0.mm.3D_GLCM_InverseVariance | −0.03184454 | ||
| Wavelet.HLL_firstorder_Mean | 0.08653895 | ||
| Wavelet.LHL_GLDM_DependenceNonUniformityNormalized | 0.27658583 | ||
| Wavelet.HHL_GLCM_Imc1 | 0.42044564 | ||
| Wavelet.LLL_GLCM_ClusterShade | 0.06160728 | ||
| NGTDM_Busyness | 0.29172003 | ||
| F (T1WI) | 7 | Intercept | −2.53872918 |
| Shape_LeastAxisLength | 1.30506559 | ||
| Shape_Maximum2DDiameterSlice | 1.07343910 | ||
| Wavelet.HLH_GLCM_InverseVariance | 1.31055892 | ||
| LoG.sigma.0.5.mm.3D_GLSZM_GrayLevelNonUniformity | 0.55947887 | ||
| Wavelet.LLH_GLCM_MaximumProbability | −0.76719457 | ||
| Wavelet.HLH_GLCM_Imc1 | 0.07350668 | ||
| Wavelet.HHL_GLSZM_GrayLevelNonUniformity | 0.06013319 | ||
| G (T2WI) | 6 | Intercept | −0.70475300 |
| Shape_LeastAxisLength | 0.32835260 | ||
| Shape_Maximum2DDiameterSlice | 1.44163325 | ||
| Shape_MinorAxisLength | 0.34220331 | ||
| LoG.sigma.2.0.mm.3D_firstorder_Median | 0.79732259 | ||
| Wavelet.LHL_GLSZM_GrayLevelNonUniformity | 0.04805125 | ||
| Wavelet.LLL_firstorder_Median | −0.08102625 |
| Training Cohort | Validation Cohort | ||||||
|---|---|---|---|---|---|---|---|
| Stage I–II | Stage III–IV | p | Stage I–II | Stage III–IV | p | ||
| A (CE-T1WI + T1WI + T2WI) | −0.044 (−0.334–0.414) | 1.122 (0.342–1.719) | <0.001 | −0.080 (−0.701–0.376) | 1.052 (0.421–1.555) | <0.001 | |
| B (CE-T1WI + T1WI) | 0.044 (−0.371–0.438) | 1.059 (0.319–1.742) | <0.001 | −0.089 (−0.541–0.390) | 1.046 (0.505–1.559) | <0.001 | |
| C (T1WI + T2WI) | 0.027 (−0.200–0.413) | 1.006 (0.305–1.555) | <0.001 | 0.059 (−0.335–0.351) | 0.824 (0.305–1.512) | <0.001 | |
| D (CE-T1WI + T2WI) | −0.019 (−0.245–0.463) | 1.072 (0.352–1.697) | <0.001 | −0.125 (−0.582–0.463) | 1.011 (0.514–1.518) | <0.001 | |
| E (CE-T1WI) | 0.034 (−0.336–0.471) | 1.062 (0.267–1.791) | <0.001 | −0.108 (−0.483–0.315) | 1.100 (0.454–1.564) | <0.001 | |
| F (T1WI) | 0.012 (−0.277–0.442) | 0.990 (0.256–1.682) | <0.001 | −0.066 (−0.429–0.233) | 0.882 (0.384–1.720) | <0.001 | |
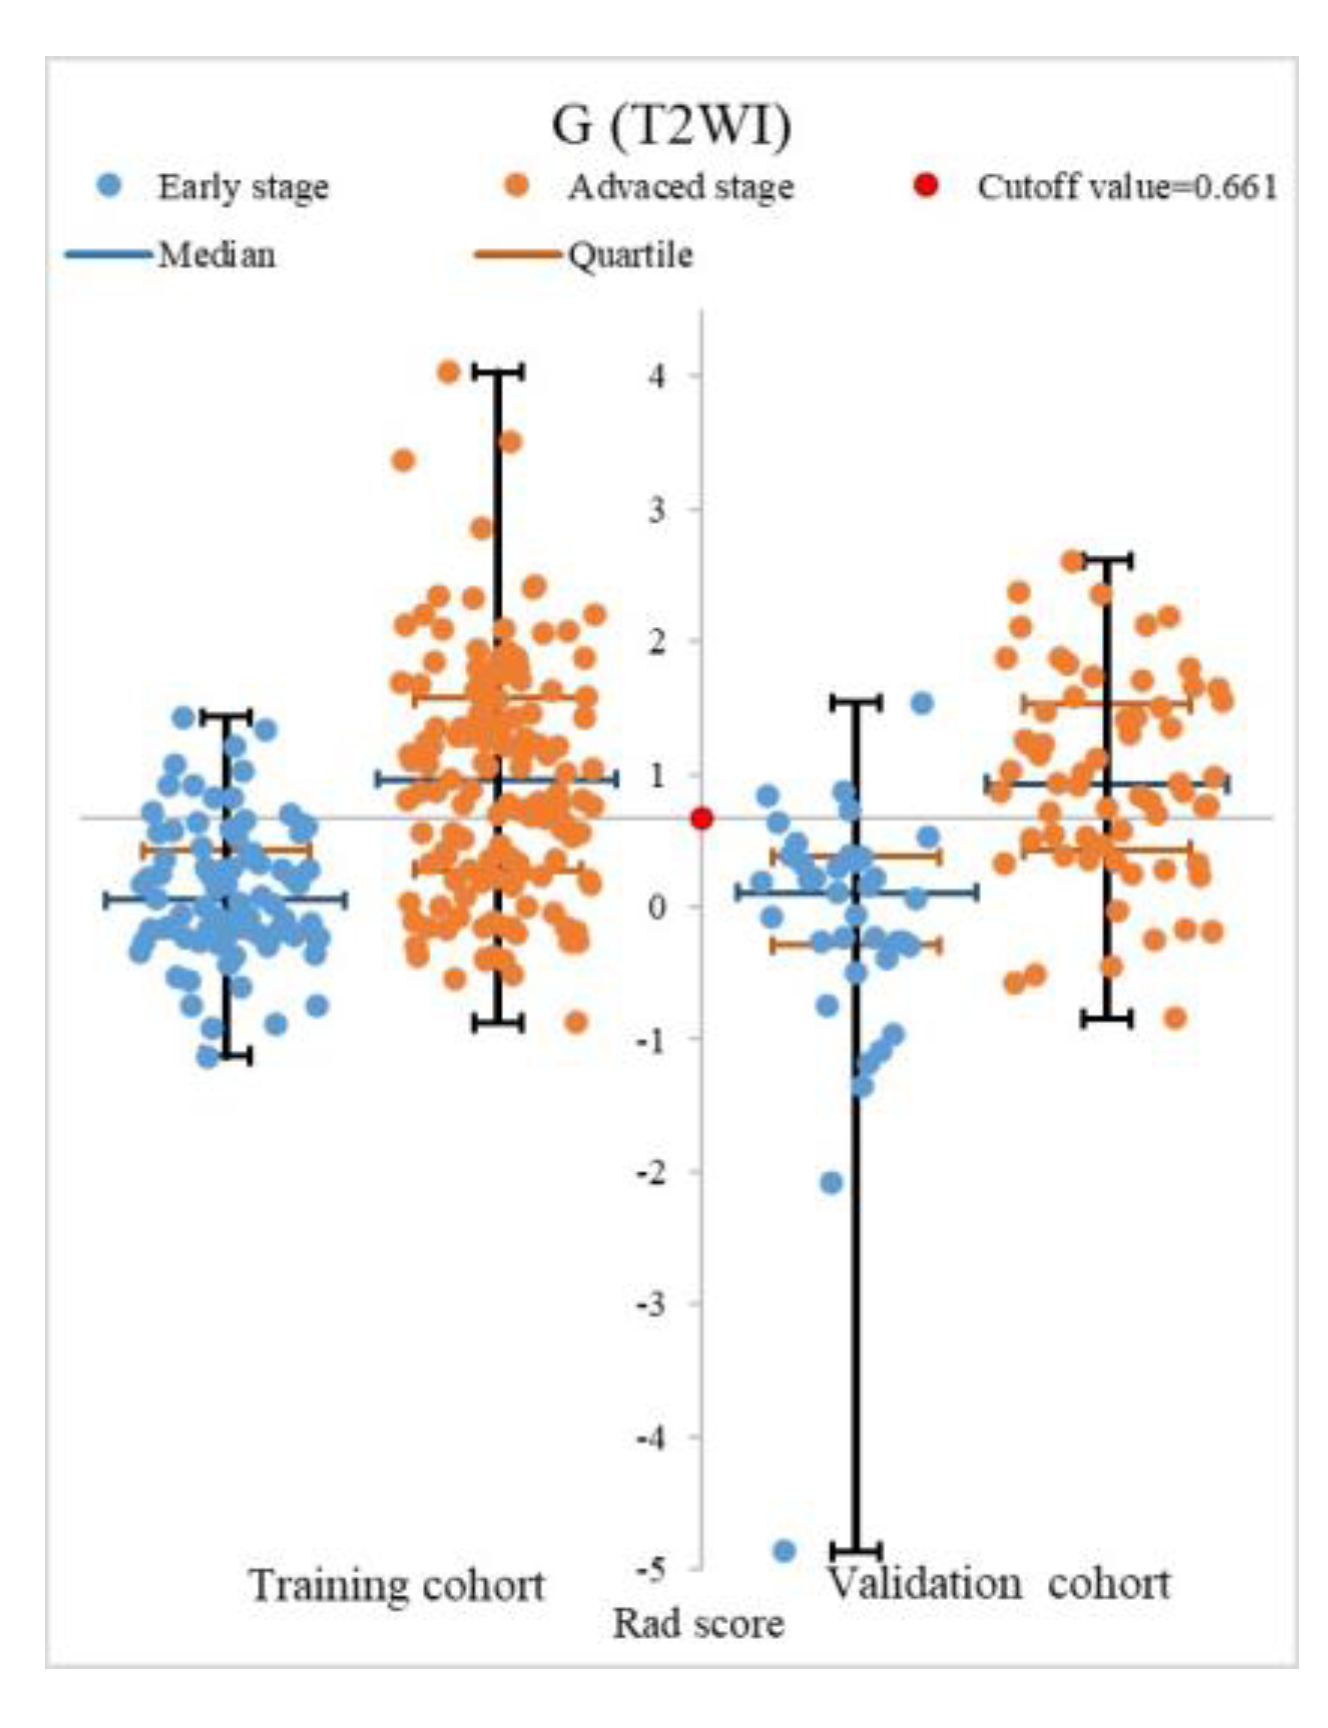
| G (T2WI) | 0.047 (−0.218–0.420) | 0.962 (0.276–1.577) | <0.001 | 0.106 (−0.293–0.375) | 0.924 (0.428–1.529) | <0.001 | |
| 95%CI | AUC | Specificity | Sensitivity | Accuracy | PPV | NPV | Z1 | P1 | Z2 | P2 | ||
|---|---|---|---|---|---|---|---|---|---|---|---|---|
| Reader | training | ― | 0.721 | 0.738 | 0.703 | 0.716 | 0.823 | 0.590 | ― | ― | ― | ― |
| validation | ― | 0.790 | 0.865 | 0.714 | 0.770 | 0.900 | 0.640 | ― | ― | ― | ― | |
| A | training | [0.799–0.895] | 0.847 | 0.571 | 0.820 | 0.729 | 0.768 | 0.649 | 3.725 | 0.000 * | ― | ― |
| validation | [0.741–0.906] | 0.824 | 0.676 | 0.794 | 0.750 | 0.806 | 0.658 | 0.704 | 0.481 | ― | ― | |
| B | training | [0.777–0.879] | 0.820 | 0.560 | 0.814 | 0.721 | 0.761 | 0.635 | 2.775 | 0.006 * | 1.992 | 0.046 * |
| validation | [0.757–0.914] | 0.803 | 0.568 | 0.810 | 0.720 | 0.761 | 0.636 | 0.258 | 0.797 | 0.796 | 0.426 | |
| C | training | [0.768–0.873] | 0.812 | 0.595 | 0.766 | 0.703 | 0.766 | 0.595 | 2.610 | 0.009 * | 2.560 | 0.010 * |
| validation | [0.718–0.887] | 0.804 | 0.514 | 0.809 | 0.700 | 0.739 | 0.613 | 0.308 | 0.758 | 0.658 | 0.511 | |
| D | training | [0.774–0.878] | 0.826 | 0.679 | 0.793 | 0.751 | 0.810 | 0.655 | 3.050 | 0.002 * | 1.814 | 0.070 |
| validation | [0.757–0.914] | 0.836 | 0.703 | 0.762 | 0.740 | 0.814 | 0.634 | 0.953 | 0.341 | −0.674 | 0.500 | |
| E | training | [0.790–0.891] | 0.839 | 0.667 | 0.821 | 0.764 | 0.810 | 0.683 | 3.271 | 0.001 * | 0.433 | 0.665 |
| validation | [0.656–0.853] | 0.760 | 0.622 | 0.794 | 0.730 | 0.781 | 0.639 | 0.953 | 0.341 | 1.523 | 0.128 | |
| F | training | [0.747–0.858] | 0.803 | 0.583 | 0.841 | 0.747 | 0.777 | 0.681 | 2.299 | 0.022 * | 2.644 | 0.008 * |
| validation | [0.759–0.915] | 0.837 | 0.568 | 0.825 | 0.730 | 0.765 | 0.656 | 0.963 | 0.336 | −0.533 | 0.594 | |
| G | training | [0.734–0.848] | 0.791 | 0.631 | 0.766 | 0.716 | 0.782 | 0.609 | 2.015 | 0.044 * | 3.363 | 0.001 * |
| validation | [0.749–0.907] | 0.828 | 0.595 | 0.794 | 0.720 | 0.769 | 0.629 | 0.799 | 0.425 | −0.138 | 0.891 |
Disclaimer/Publisher’s Note: The statements, opinions and data contained in all publications are solely those of the individual author(s) and contributor(s) and not of MDPI and/or the editor(s). MDPI and/or the editor(s) disclaim responsibility for any injury to people or property resulting from any ideas, methods, instructions or products referred to in the content. |
© 2023 by the authors. Licensee MDPI, Basel, Switzerland. This article is an open access article distributed under the terms and conditions of the Creative Commons Attribution (CC BY) license (https://creativecommons.org/licenses/by/4.0/).
Share and Cite
Li, Q.; Yu, Q.; Gong, B.; Ning, Y.; Chen, X.; Gu, J.; Lv, F.; Peng, J.; Luo, T. The Effect of Magnetic Resonance Imaging Based Radiomics Models in Discriminating stage I–II and III–IVa Nasopharyngeal Carcinoma. Diagnostics 2023, 13, 300. https://doi.org/10.3390/diagnostics13020300
Li Q, Yu Q, Gong B, Ning Y, Chen X, Gu J, Lv F, Peng J, Luo T. The Effect of Magnetic Resonance Imaging Based Radiomics Models in Discriminating stage I–II and III–IVa Nasopharyngeal Carcinoma. Diagnostics. 2023; 13(2):300. https://doi.org/10.3390/diagnostics13020300
Chicago/Turabian StyleLi, Quanjiang, Qiang Yu, Beibei Gong, Youquan Ning, Xinwei Chen, Jinming Gu, Fajin Lv, Juan Peng, and Tianyou Luo. 2023. "The Effect of Magnetic Resonance Imaging Based Radiomics Models in Discriminating stage I–II and III–IVa Nasopharyngeal Carcinoma" Diagnostics 13, no. 2: 300. https://doi.org/10.3390/diagnostics13020300