
Adult Acquired Flatfoot Deformity: A Narrative Review about Imaging Findings
 , ,
, ,  and
and 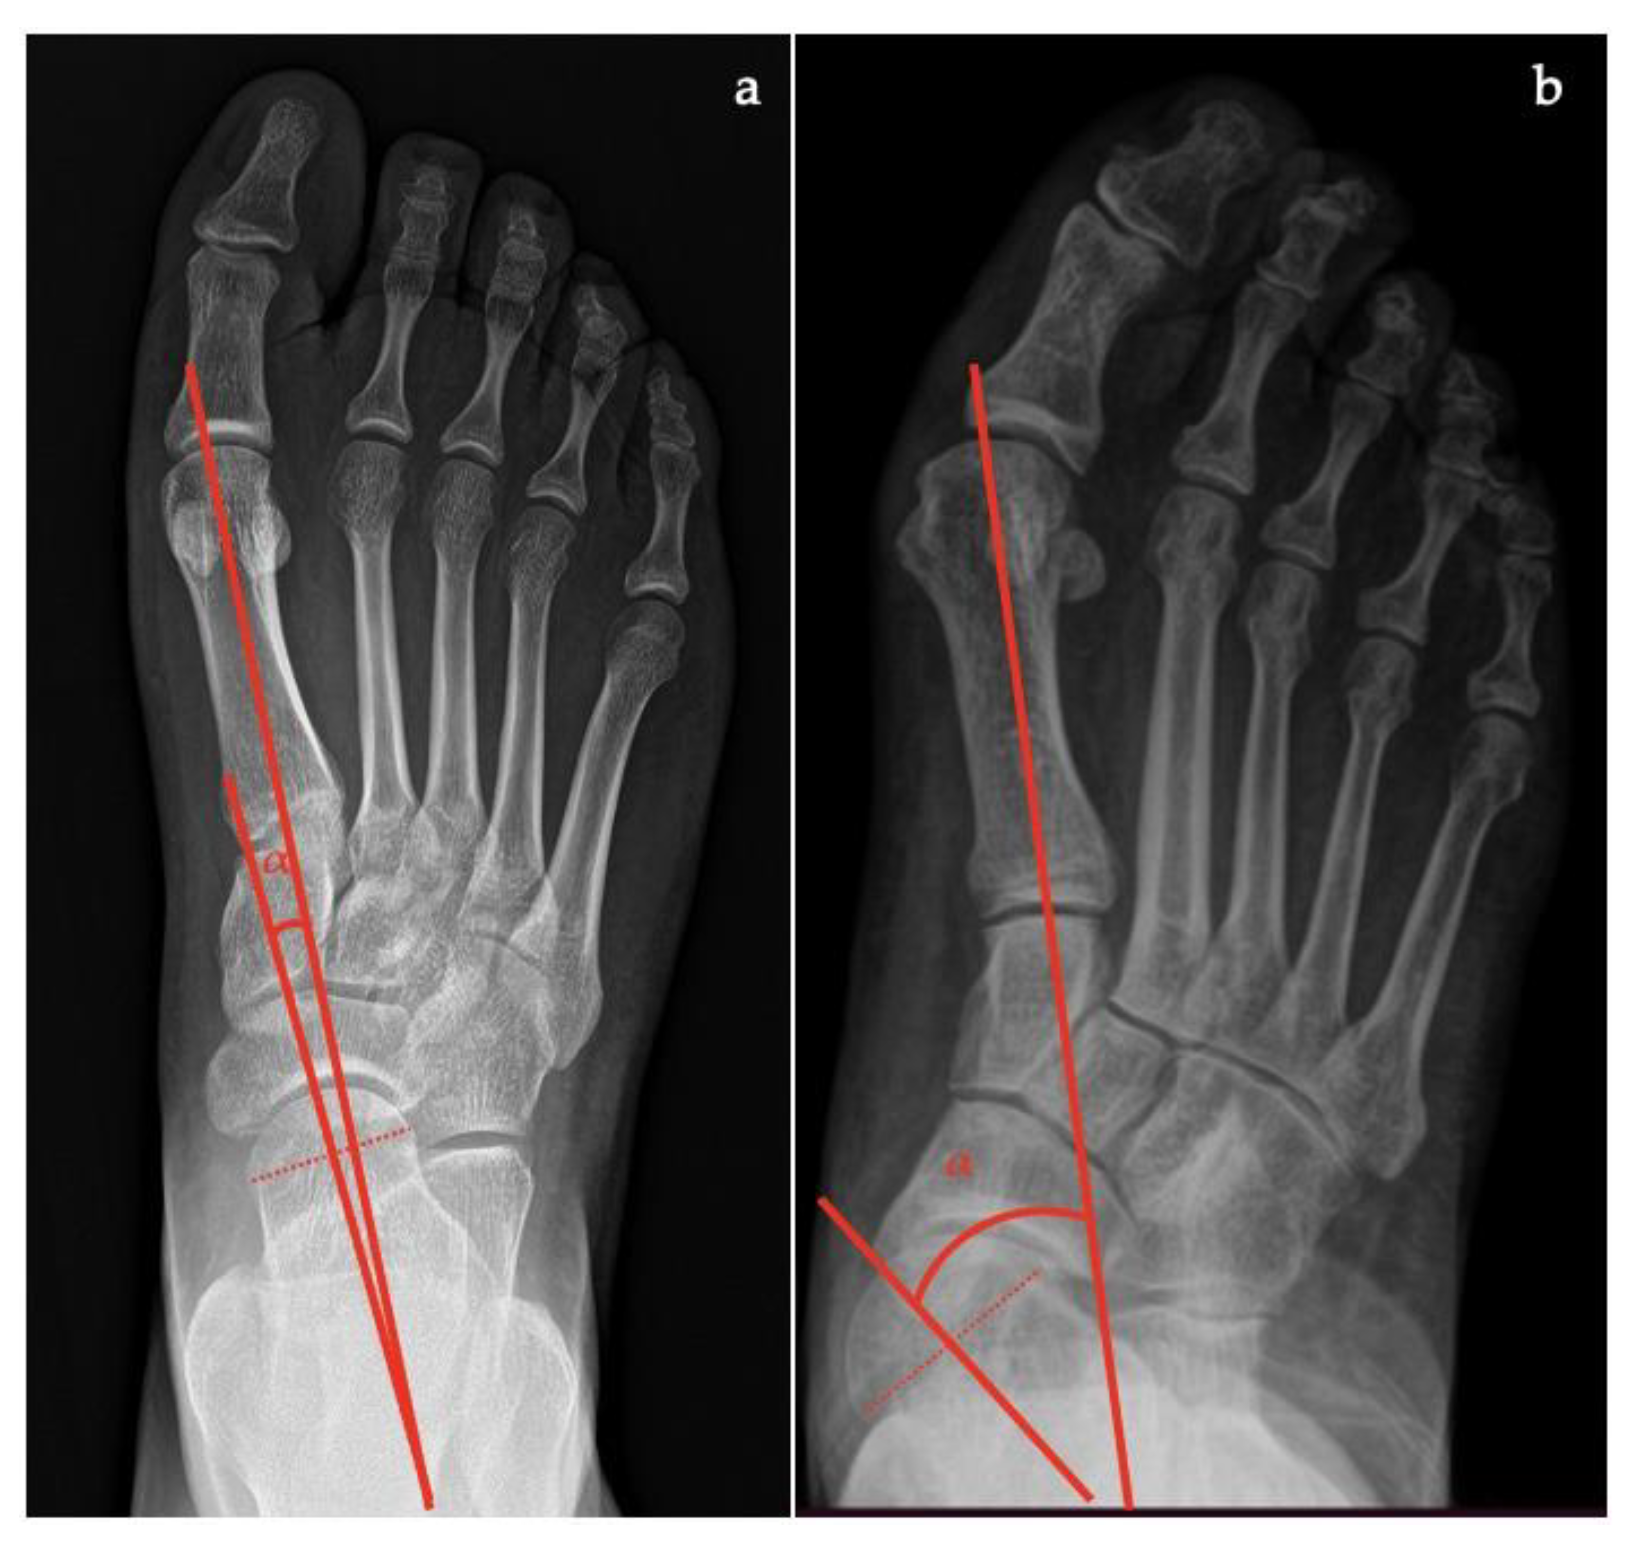
Abstract
:1. Introduction
2. Imaging Techniques
2.1. Radiography
- Talar–first metatarsal angle, between the lines drawn along the long axis of the talus and the first metatarsal (normal 0°, flatfoot: mild >4°, moderate >15°, severe >30°) (Figure 1);
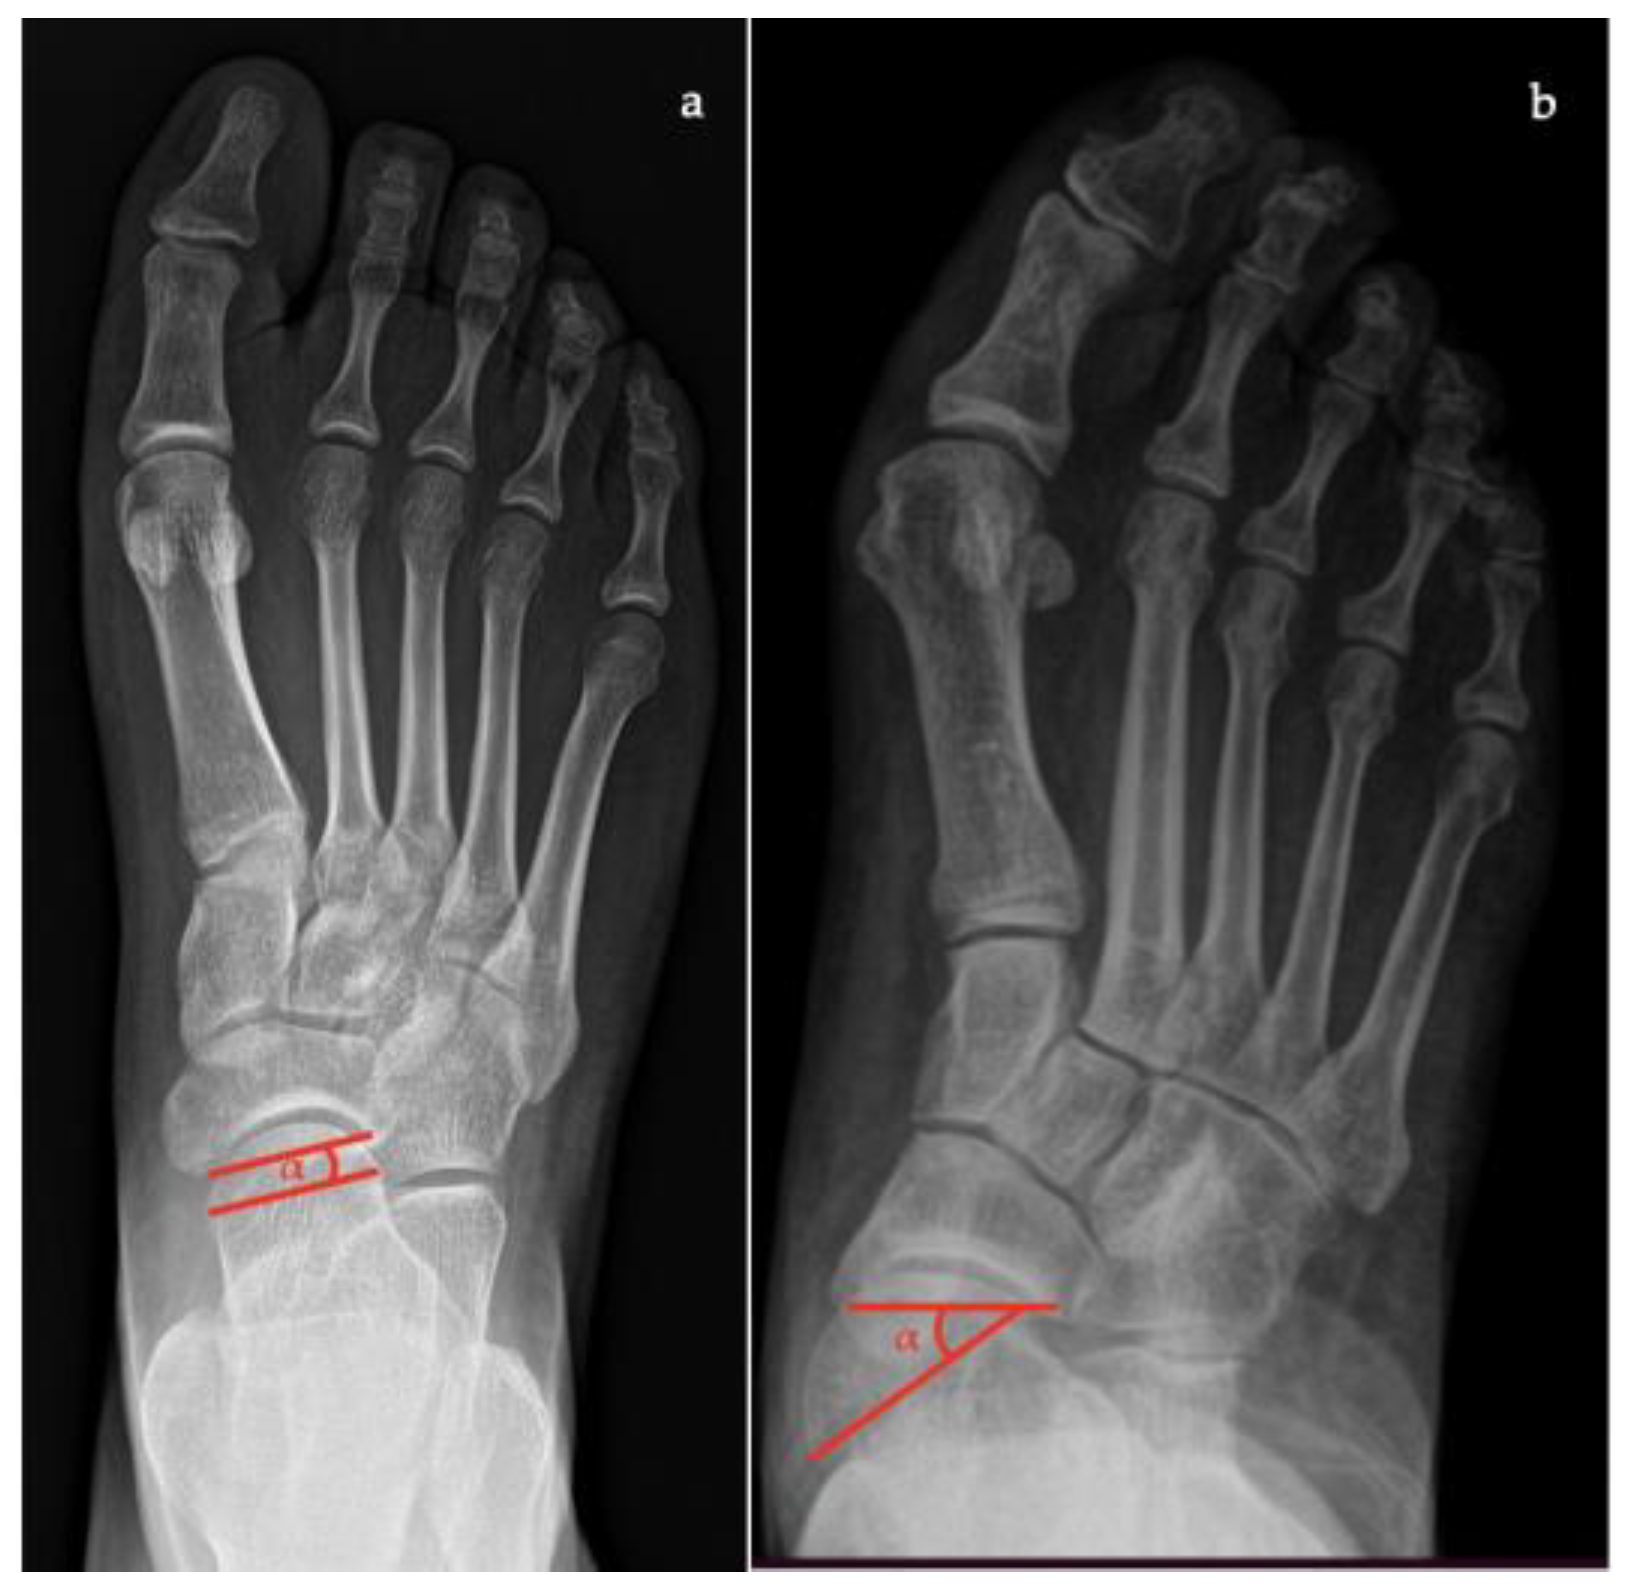
- Talonavicular coverage angle, between the line that joins the medial and lateral articular margins of the talus, and the line that joins the medial and lateral articular margins of the navicular, it represents forefoot abduction (normal, <7°; flatfoot, >7°) (Figure 2);
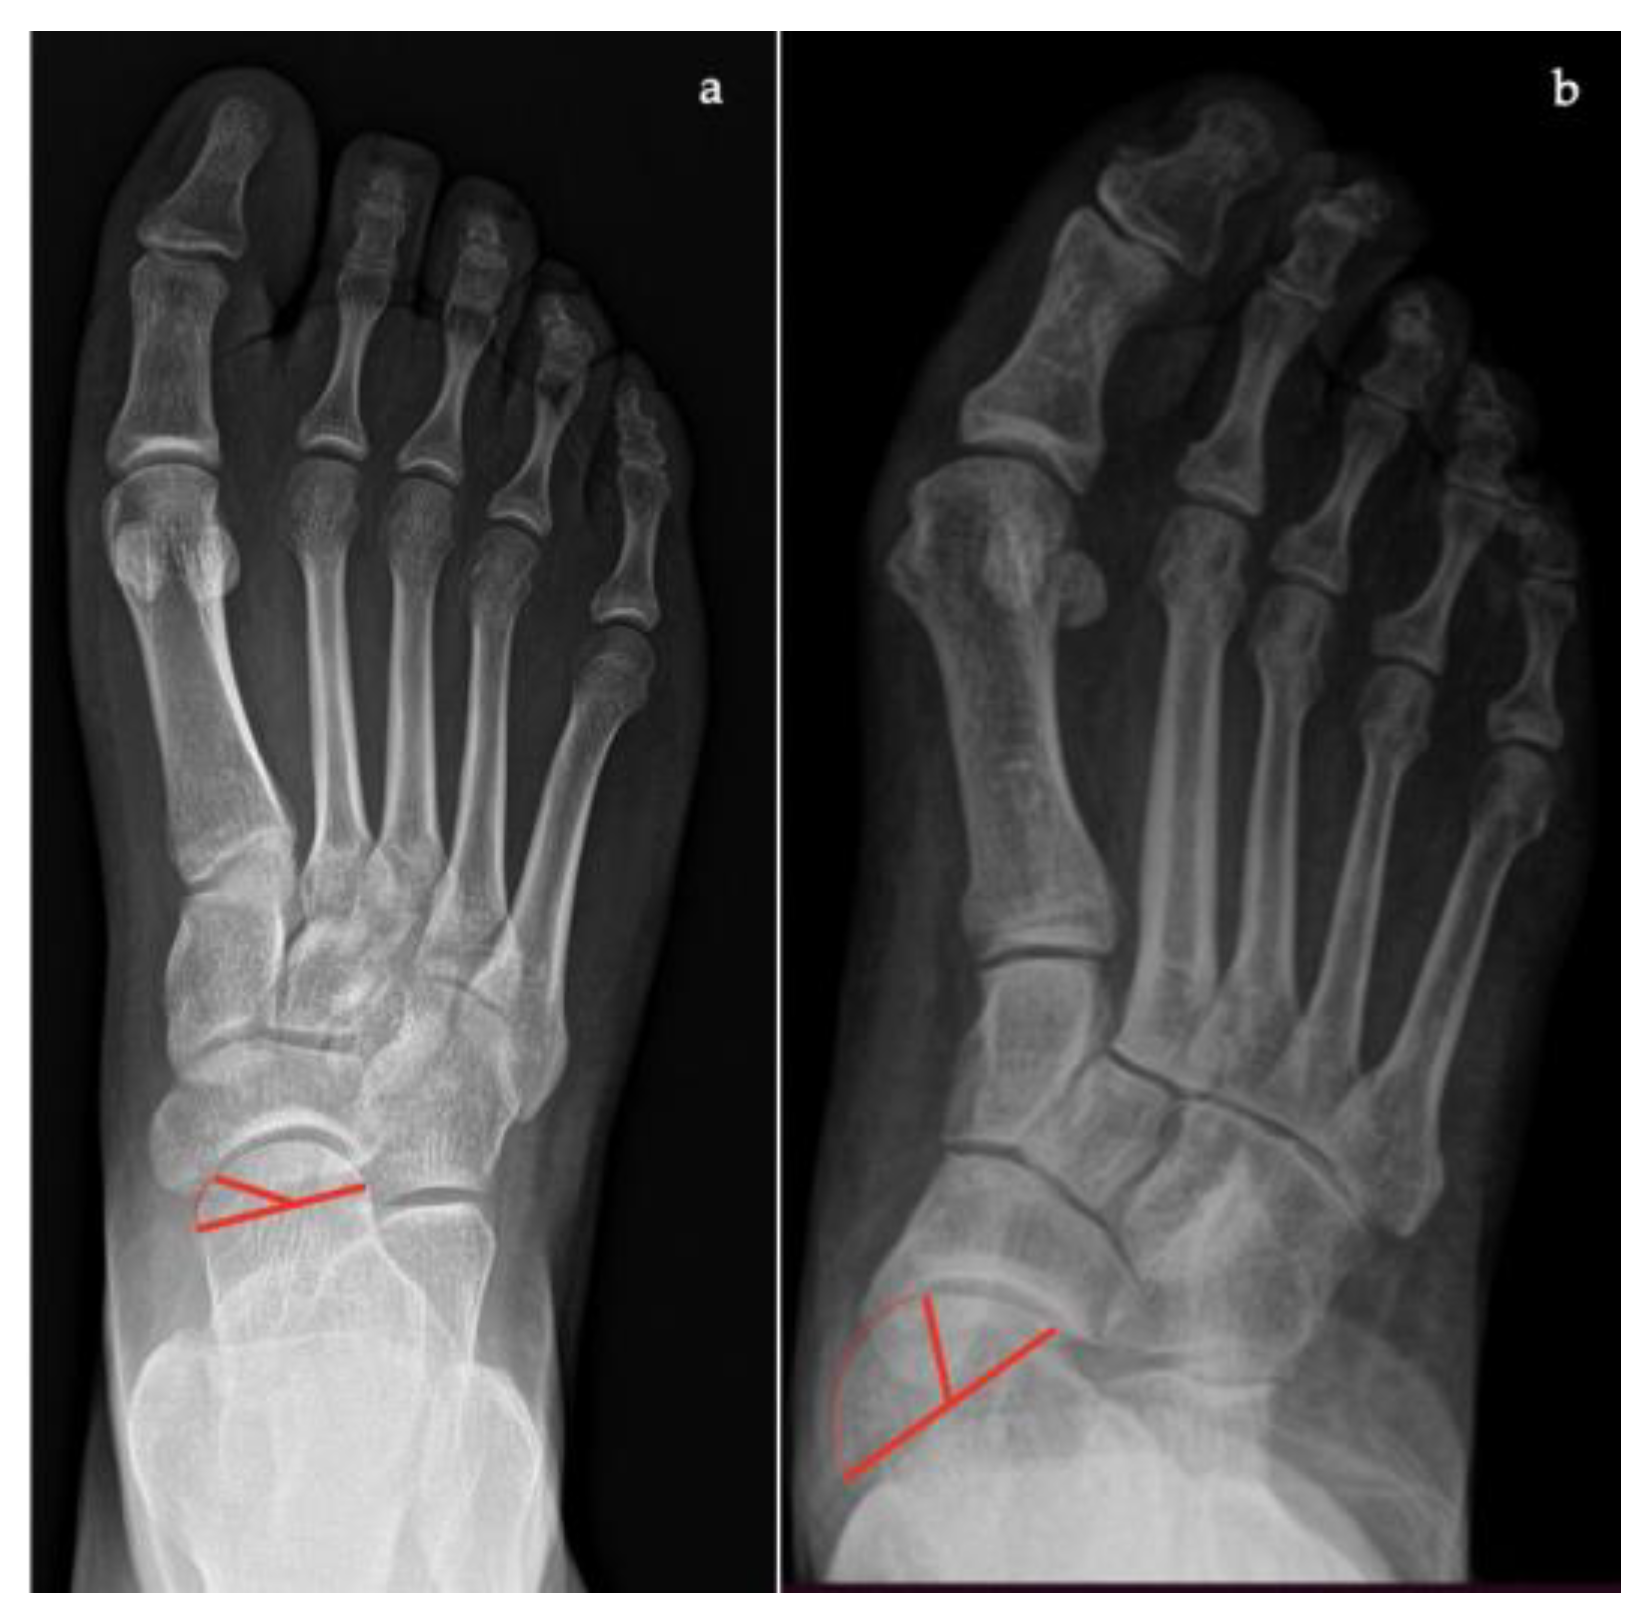
- Talonavicular uncoverage percentage, the percentage of the talus that is not in contact with the navicular medially, useful to evaluate forefoot abduction (normal, 10% to 30%; flatfoot >30%) (Figure 3);
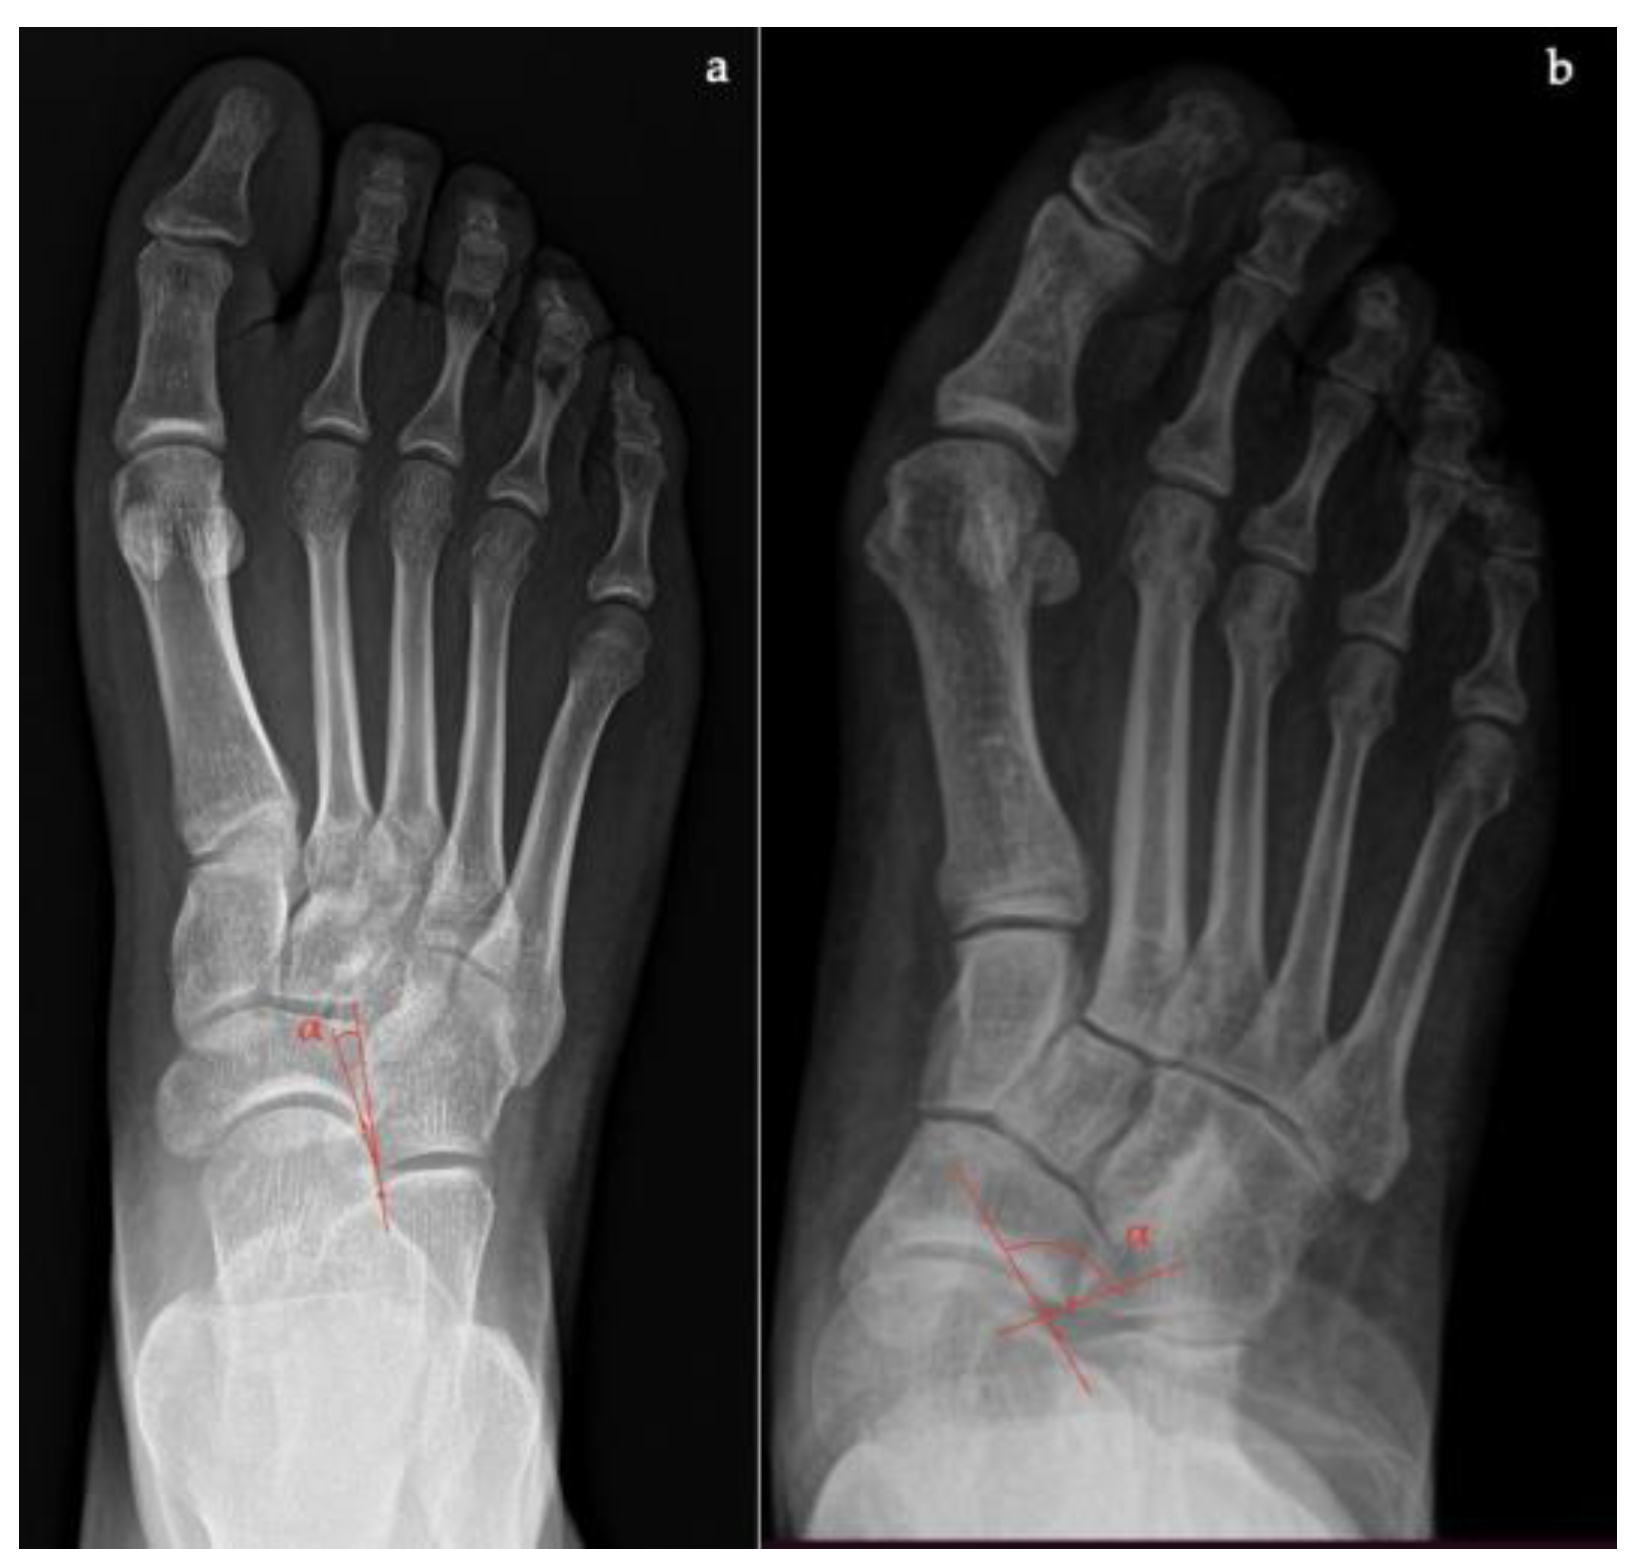
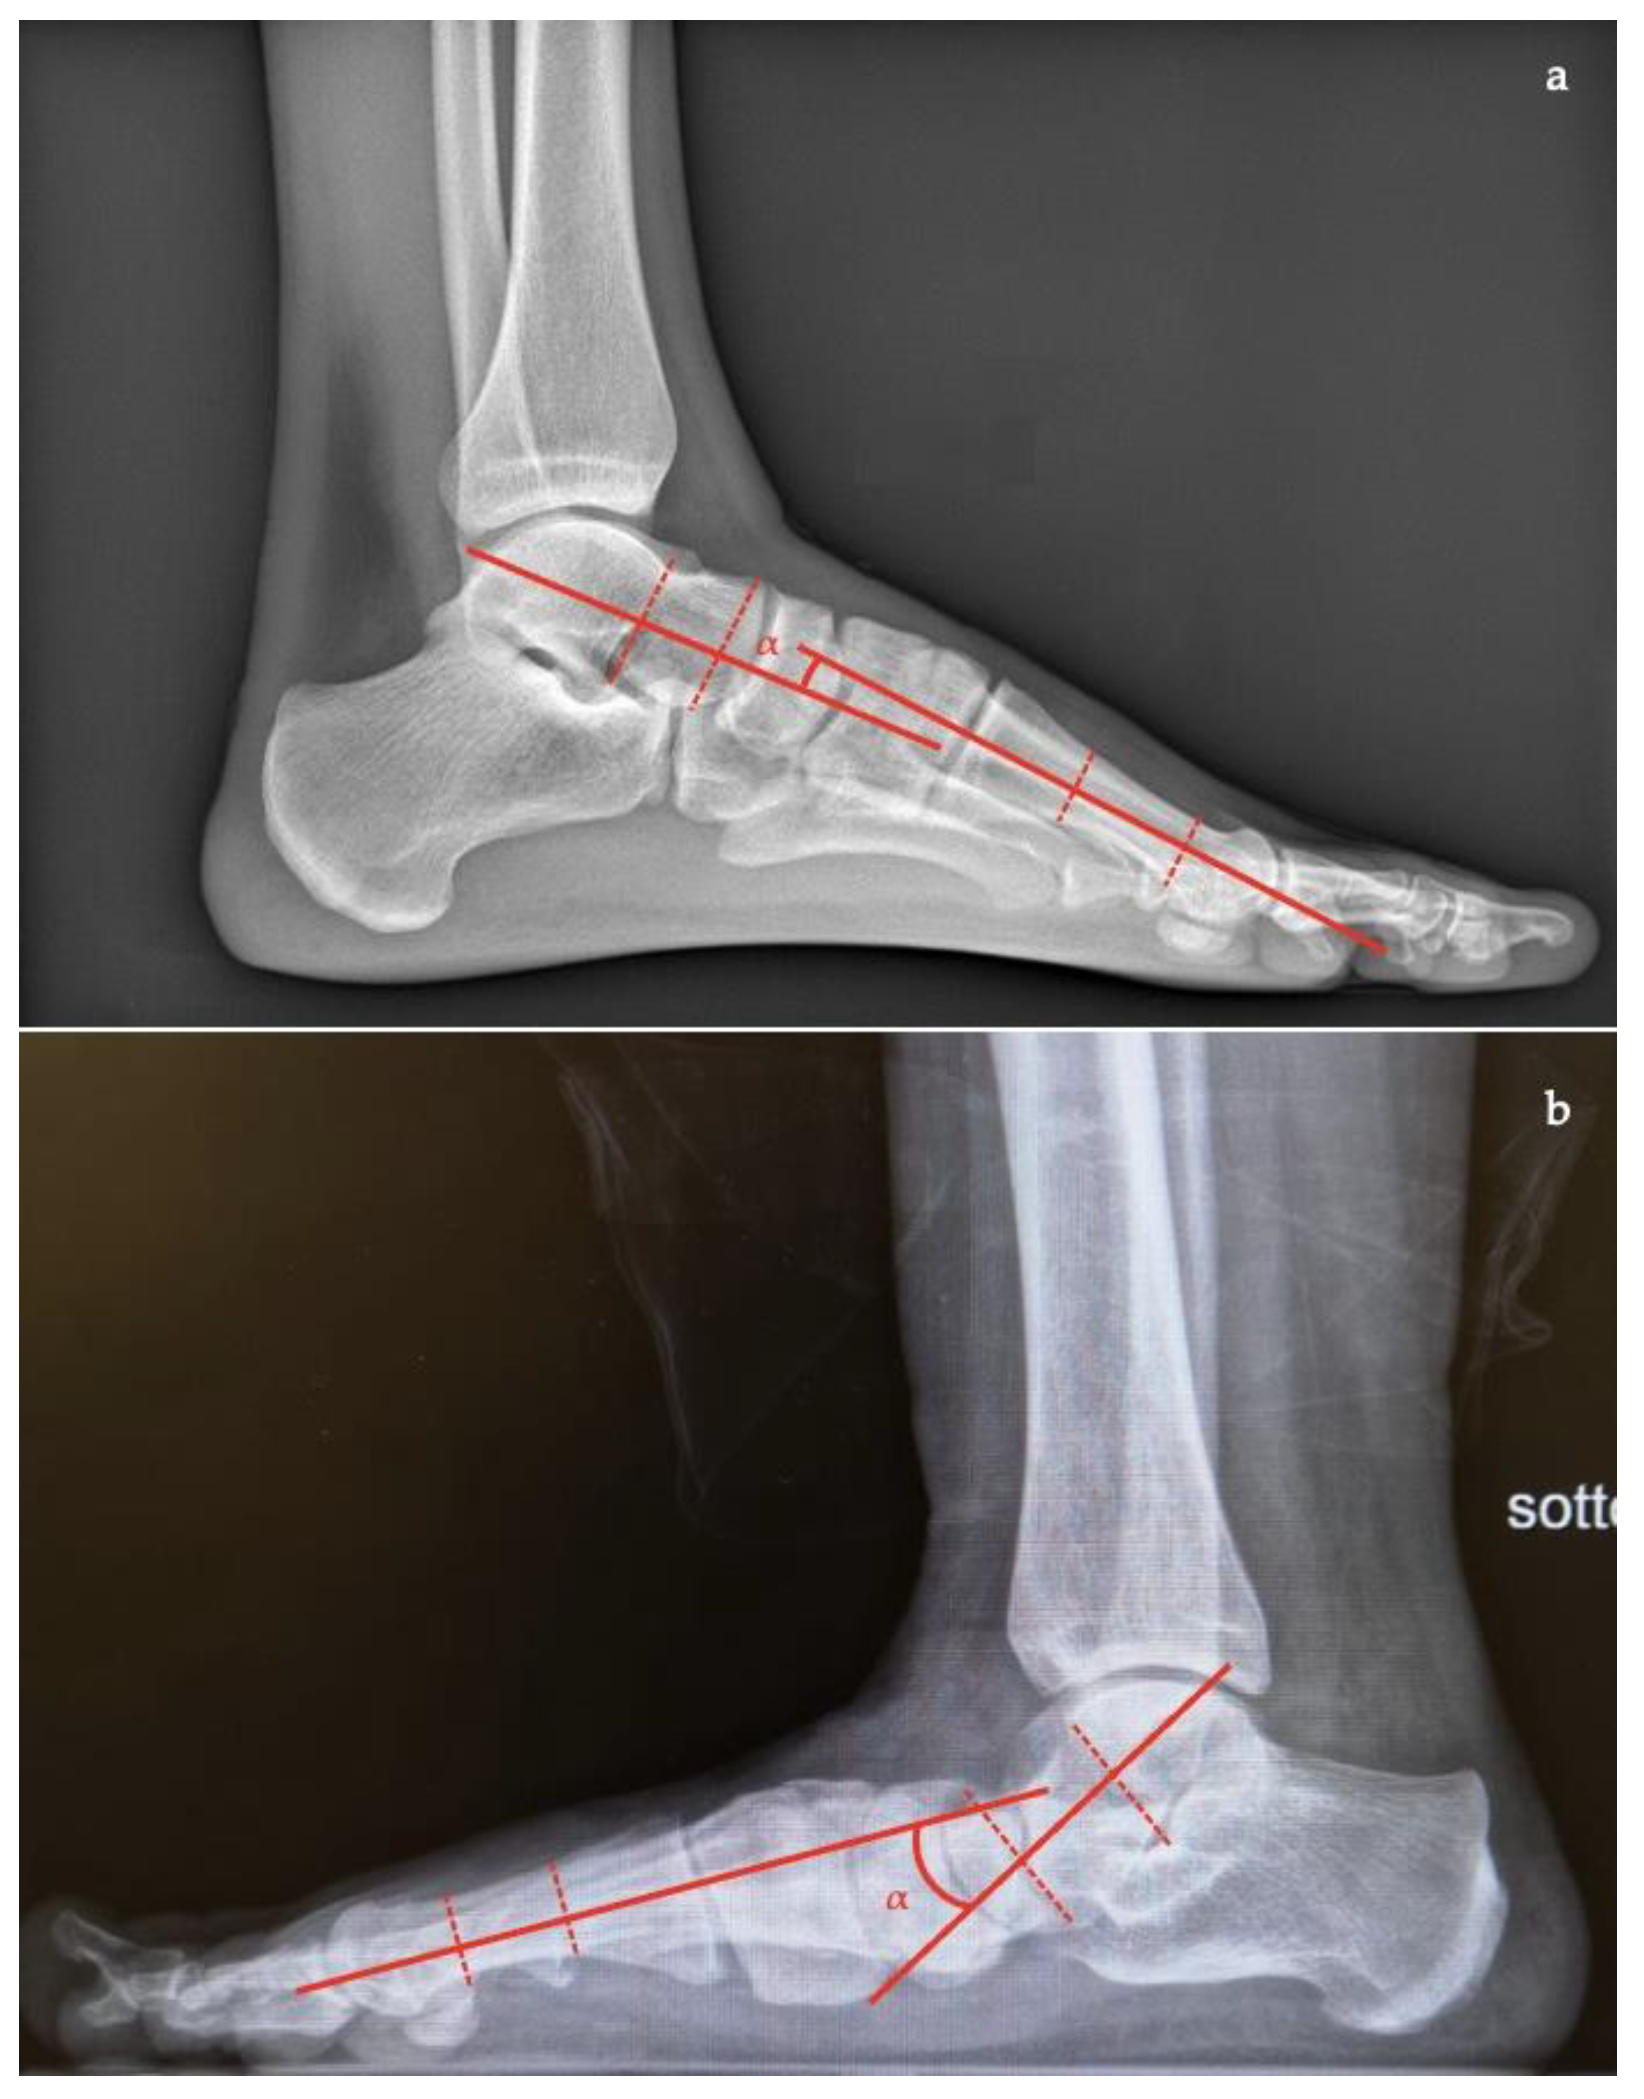
- Talar incongruency angle (normal, 5° = –26°; flatfoot >26°), is formed by the intersection between a line from the most lateral point of the articular surfaces of the talus and the navicular, and a line from the lateral aspect of the talar neck (in its most narrow segment) to the lateral point of the talar articular surface (Figure 4).
- Talar–first metatarsal angle (Meary’s angle), the normal value is 0 ± 10 degrees and is increased in flatfoot deformity (often >20°, apex directed plantarly) (Figure 5);
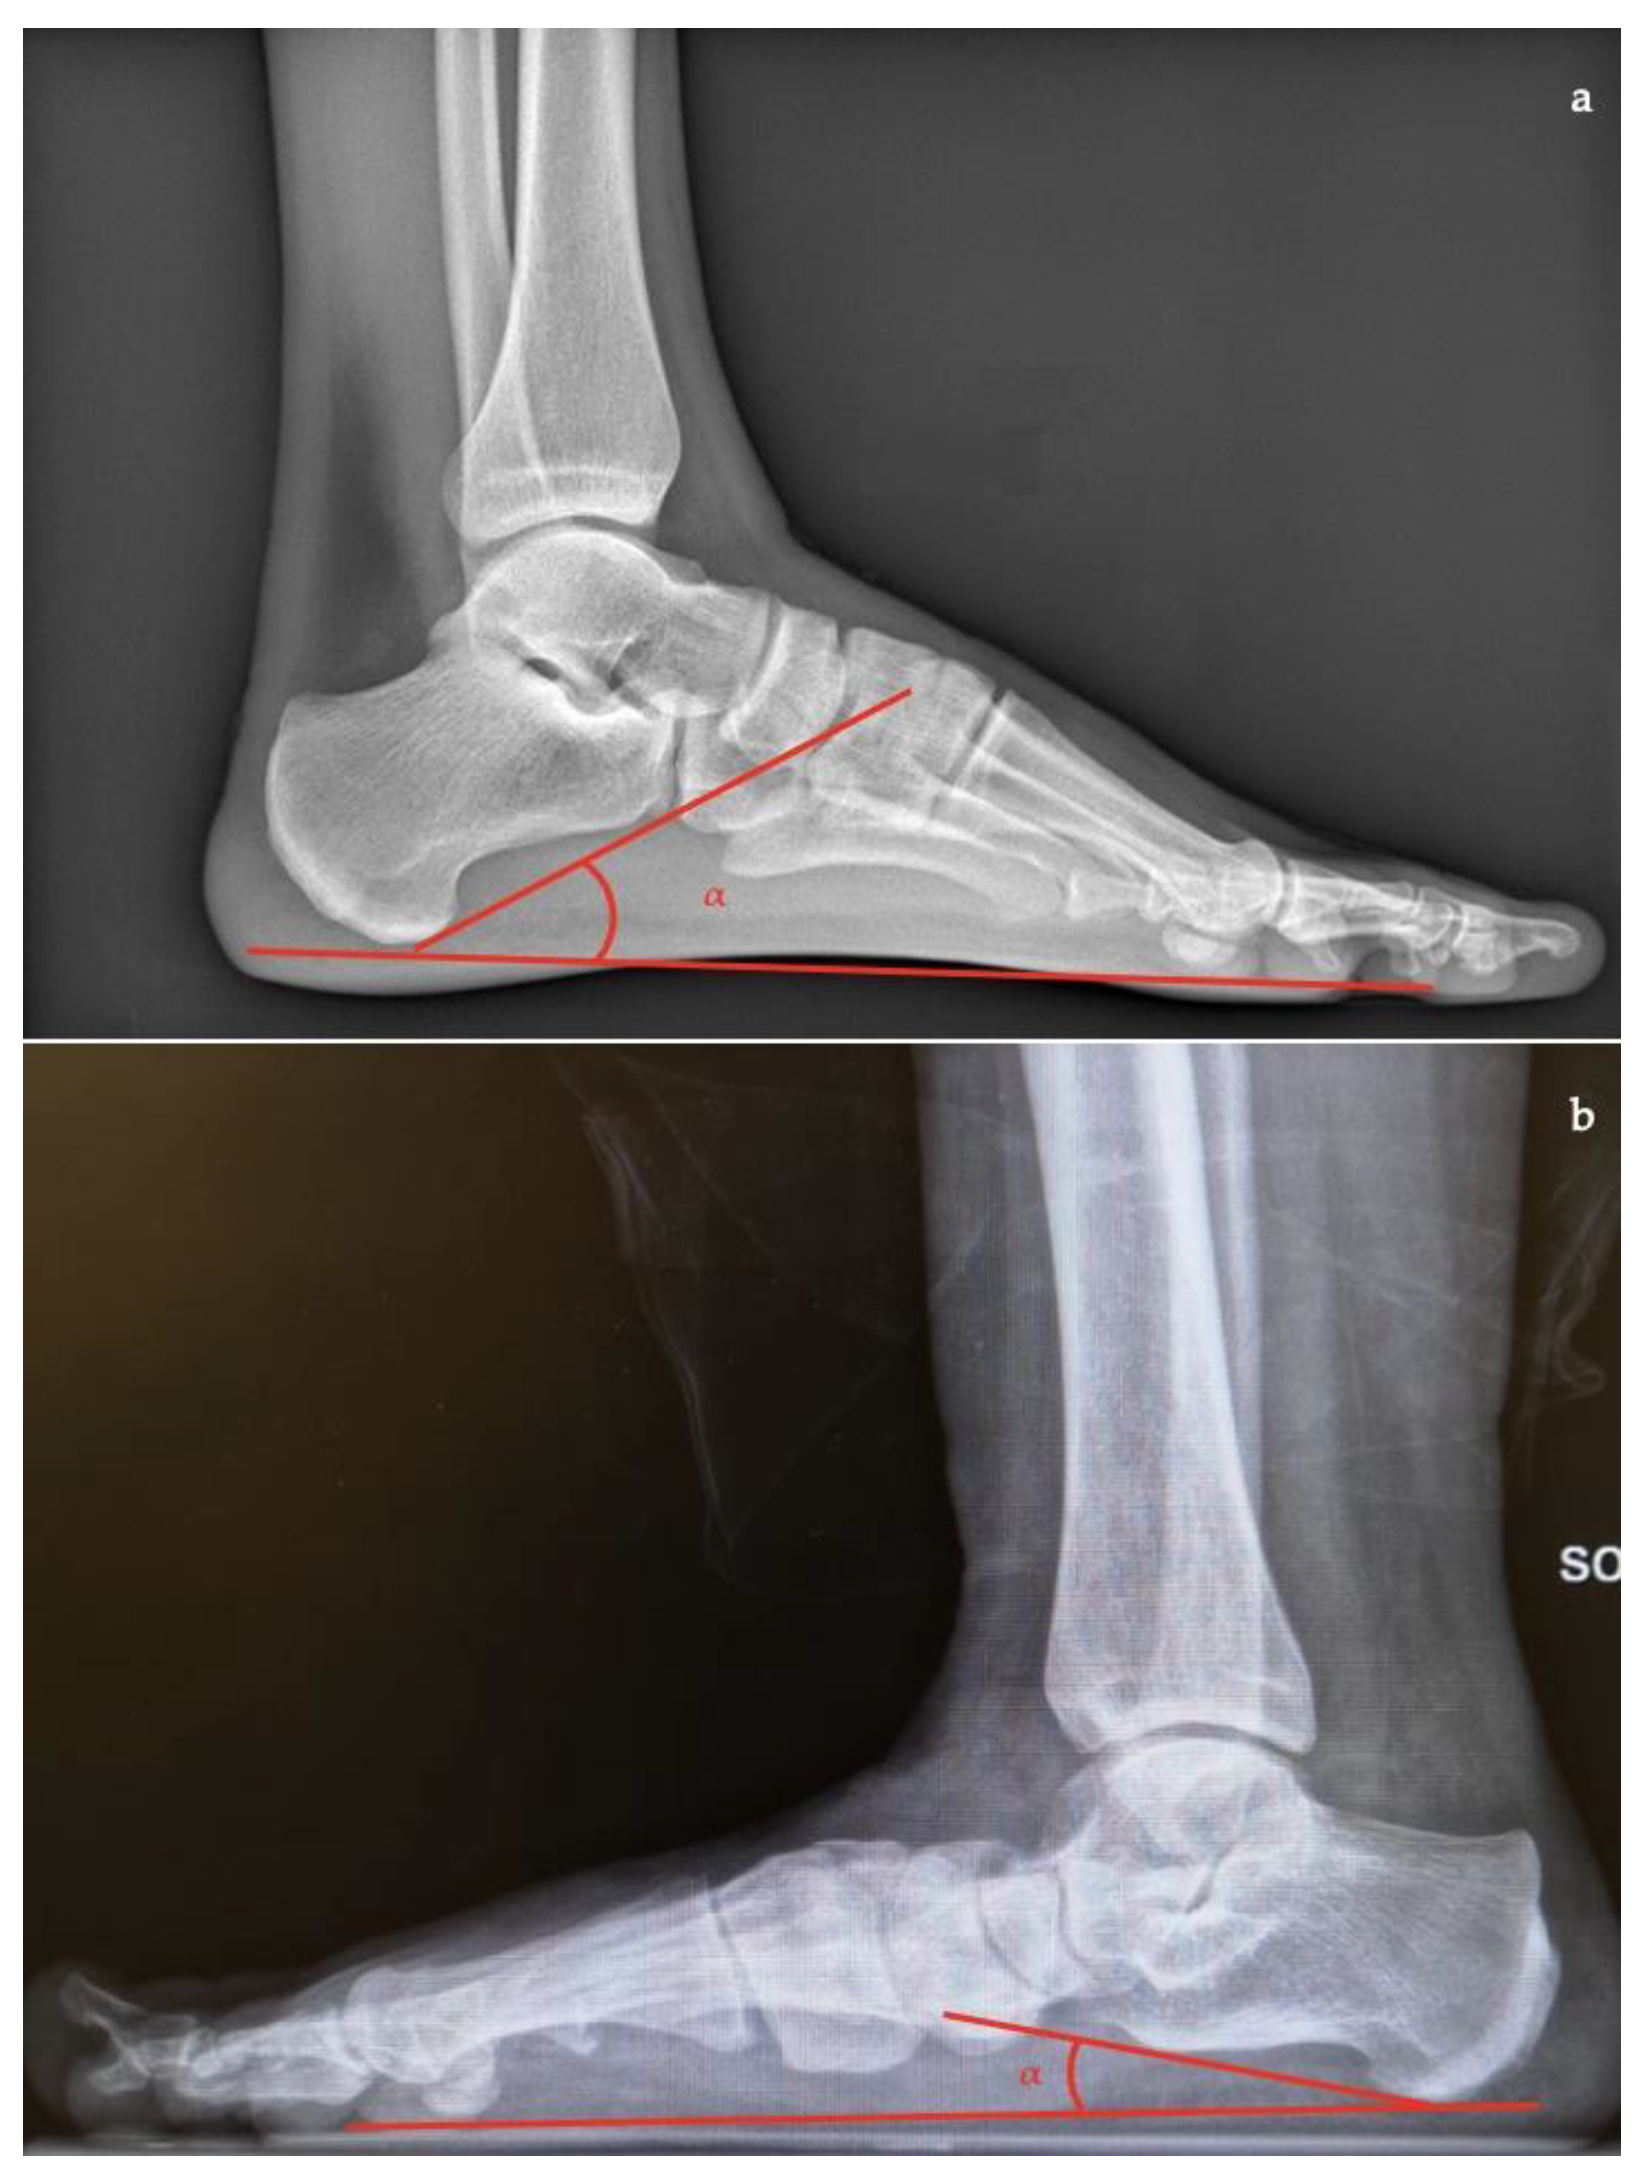
- Calcaneal pitch, the angle between the line parallel to the ground and the line along the inferior inclination axis of the calcaneus (normal, 20–30°; flatfoot, <20°) (Figure 6);
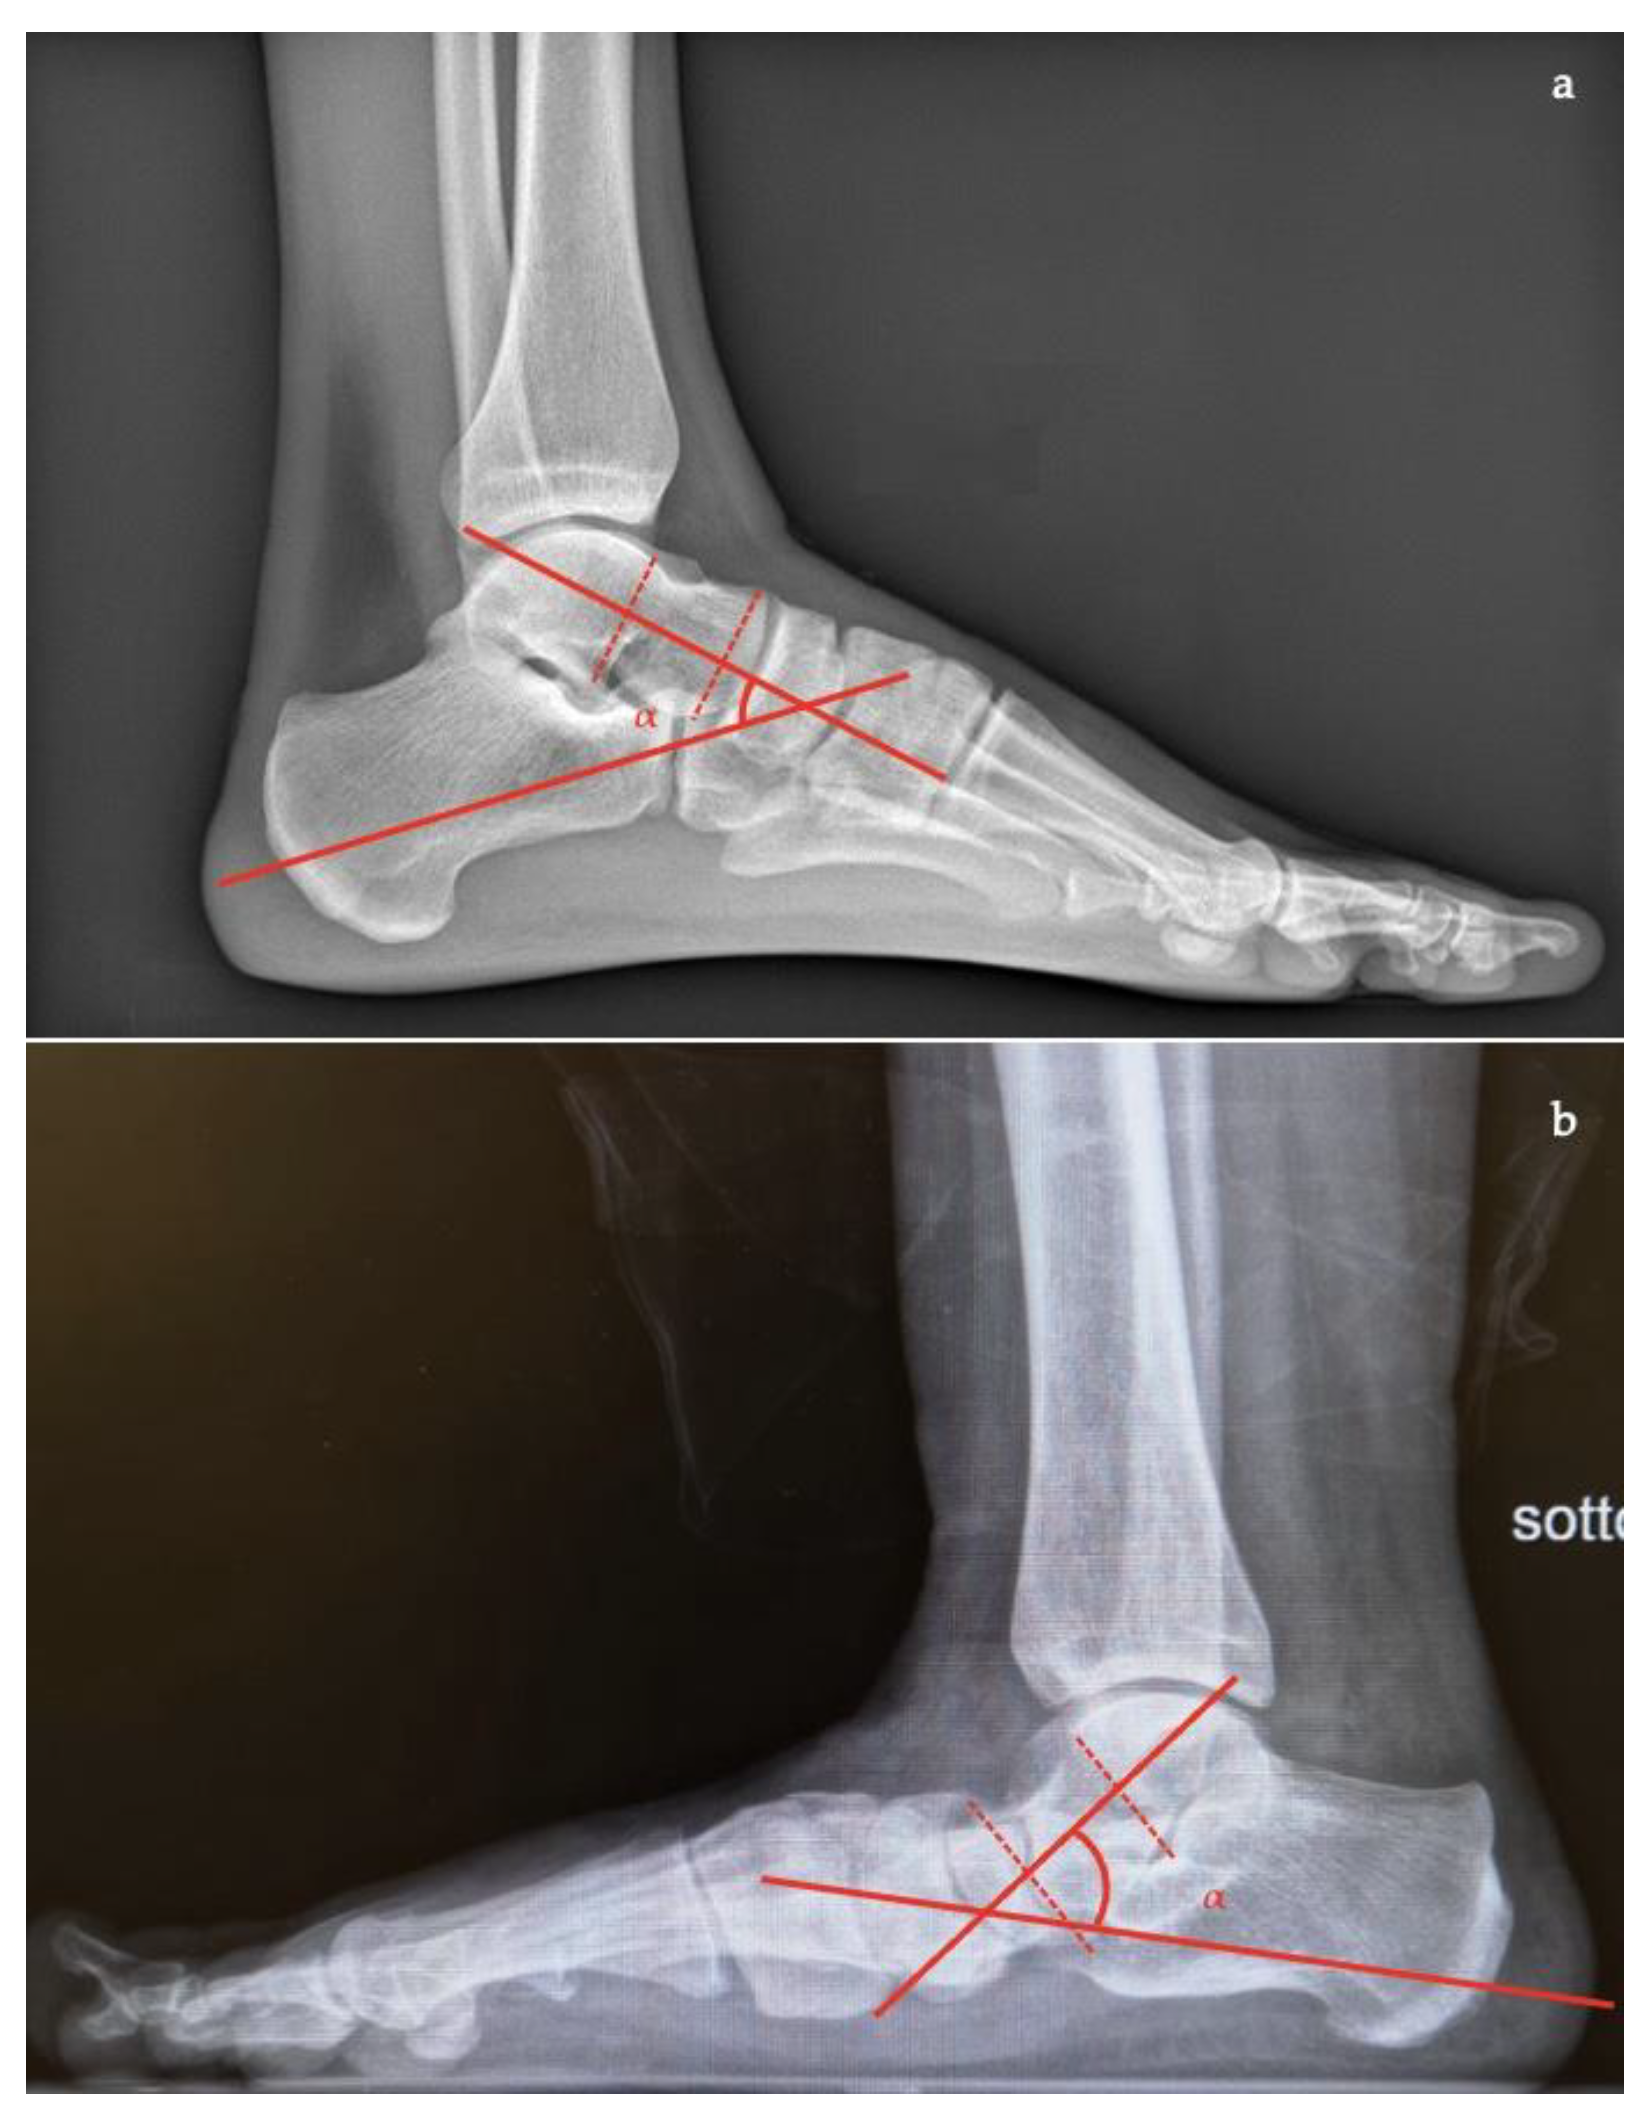
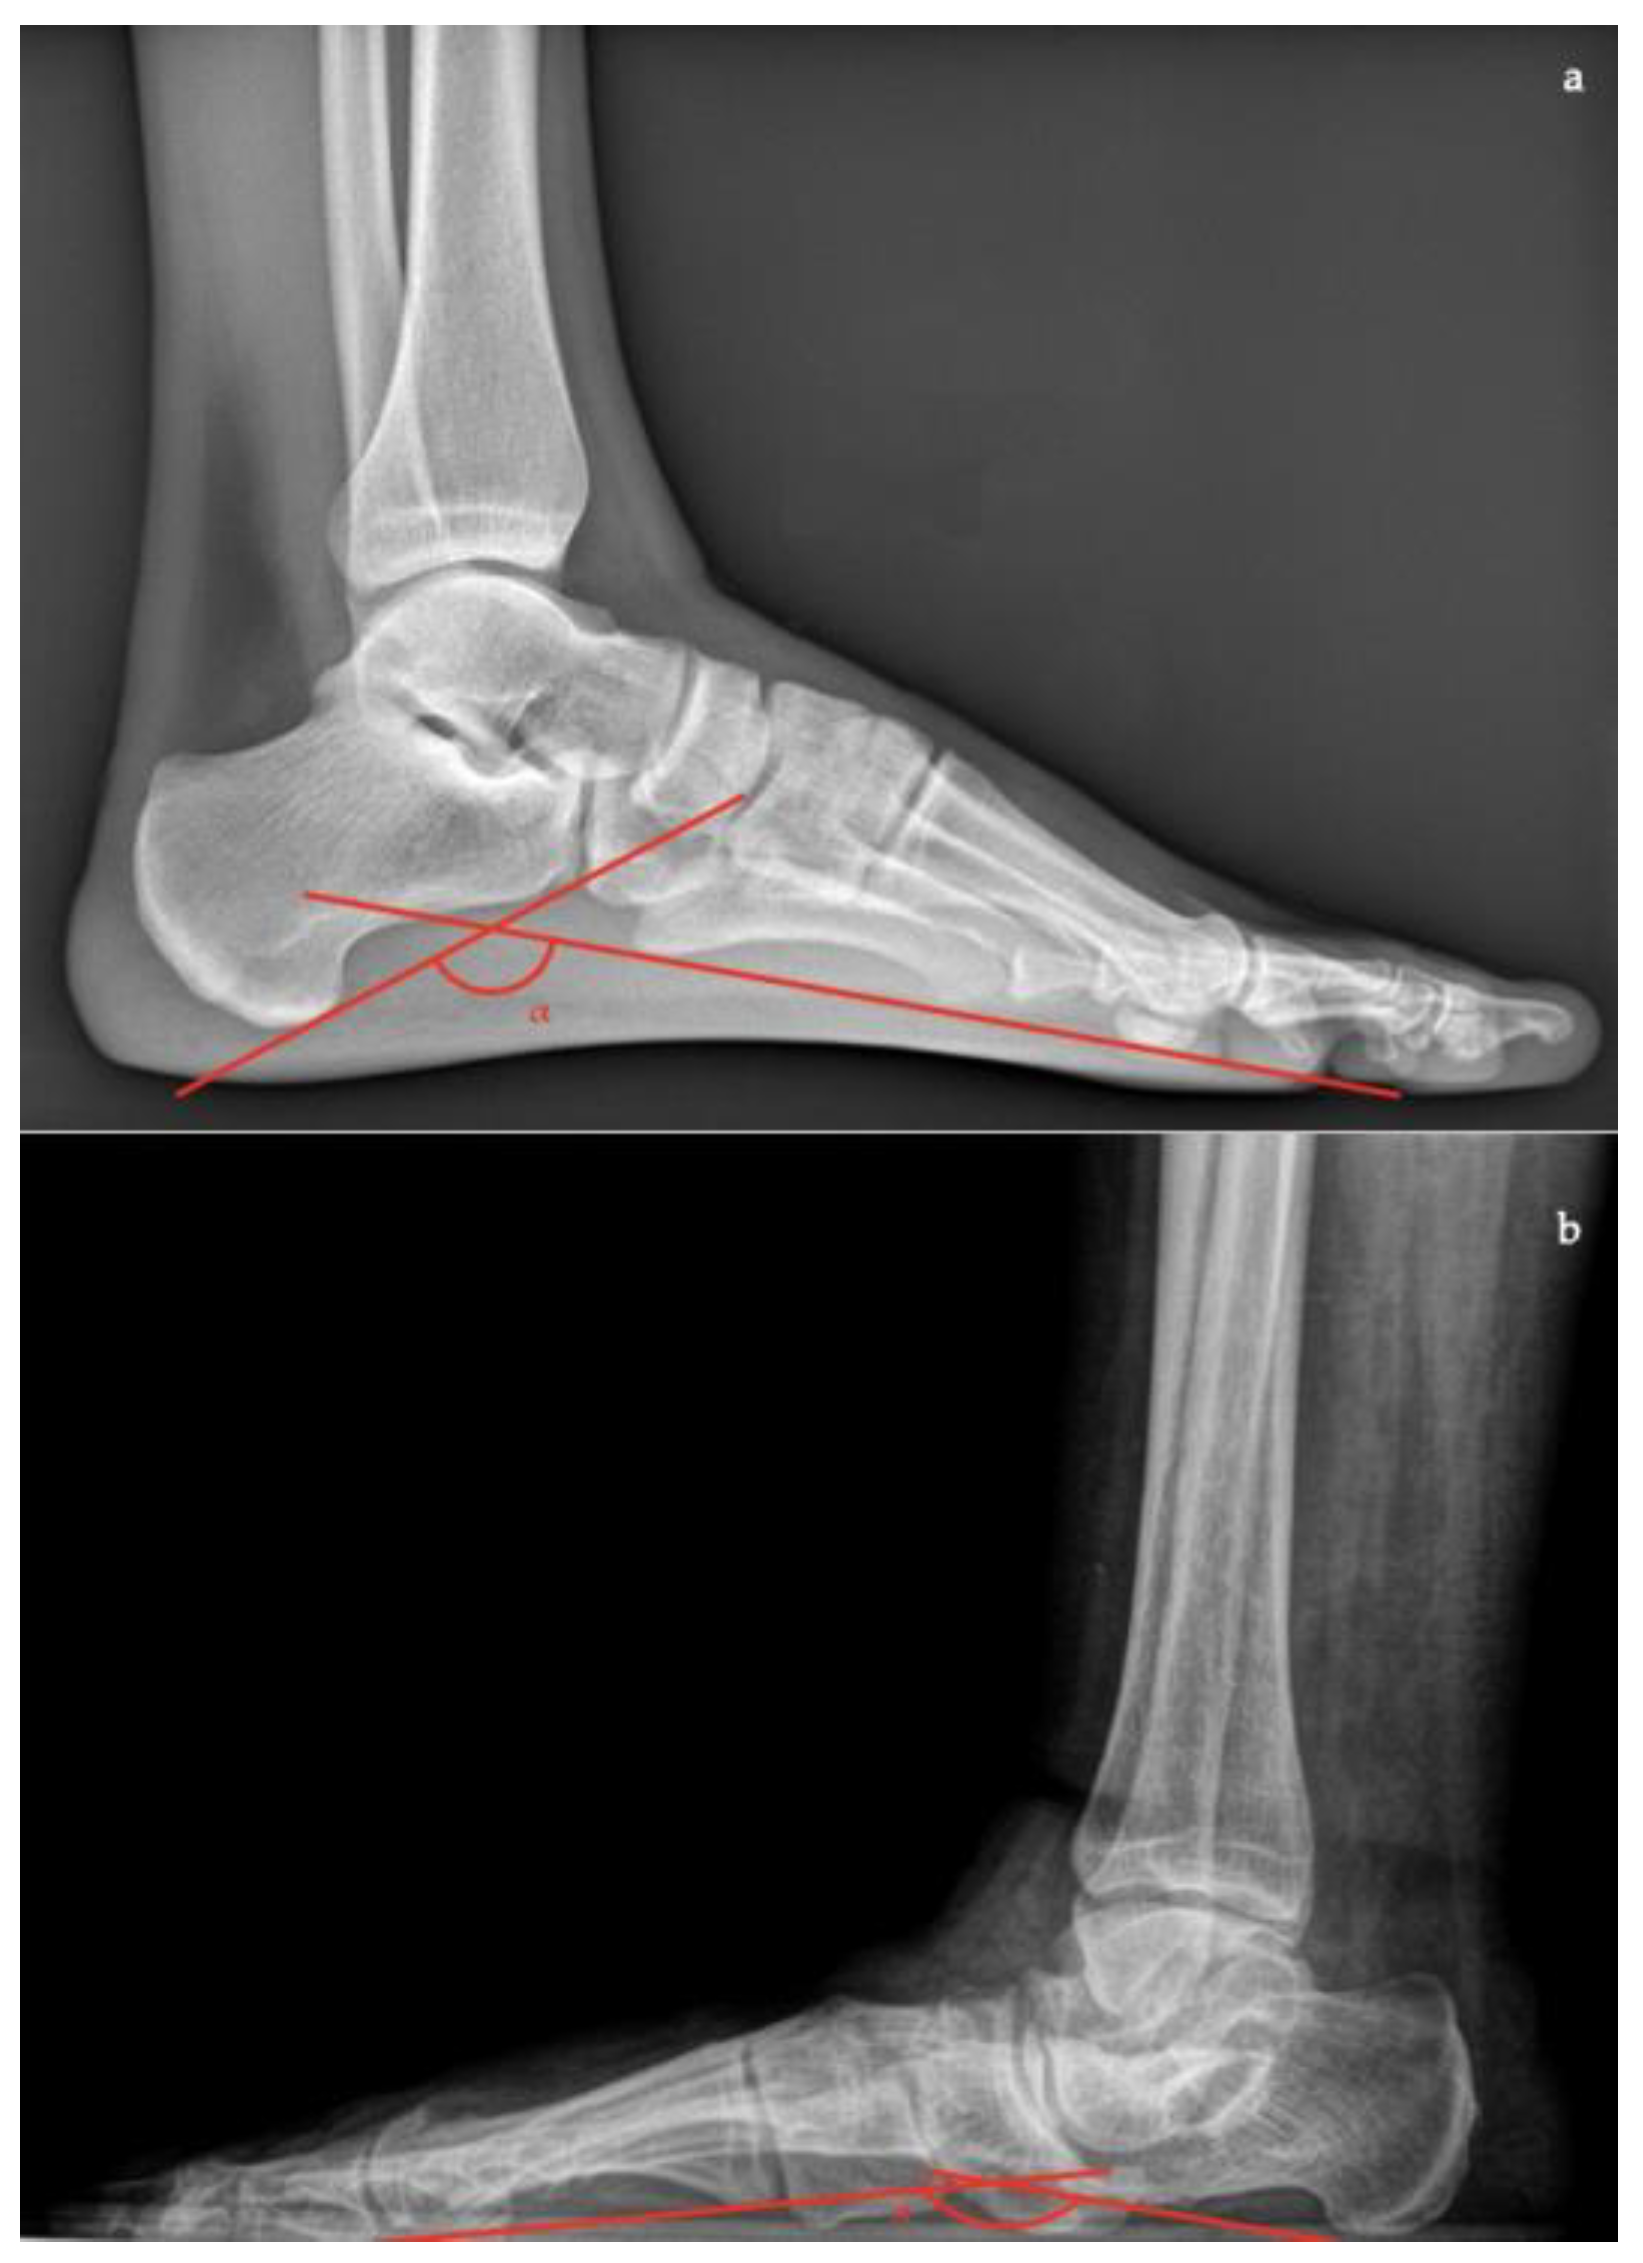
- Talocalcaneal angle is formed by the long axis of the rearfoot and the midtalar line. This angle is increased in pronated feet on both the AP and lateral views (normal <45°, flatfoot >45°) (Figure 7);
- Calcaneal-fifth metatarsal angle, defined as the angle formed between the tangent to the inferior aspect of the calcaneus and a line drawn along the inferior aspect of the base and head of the fifth metatarsal (normal <170°, flatfoot >170°) (Figure 8).
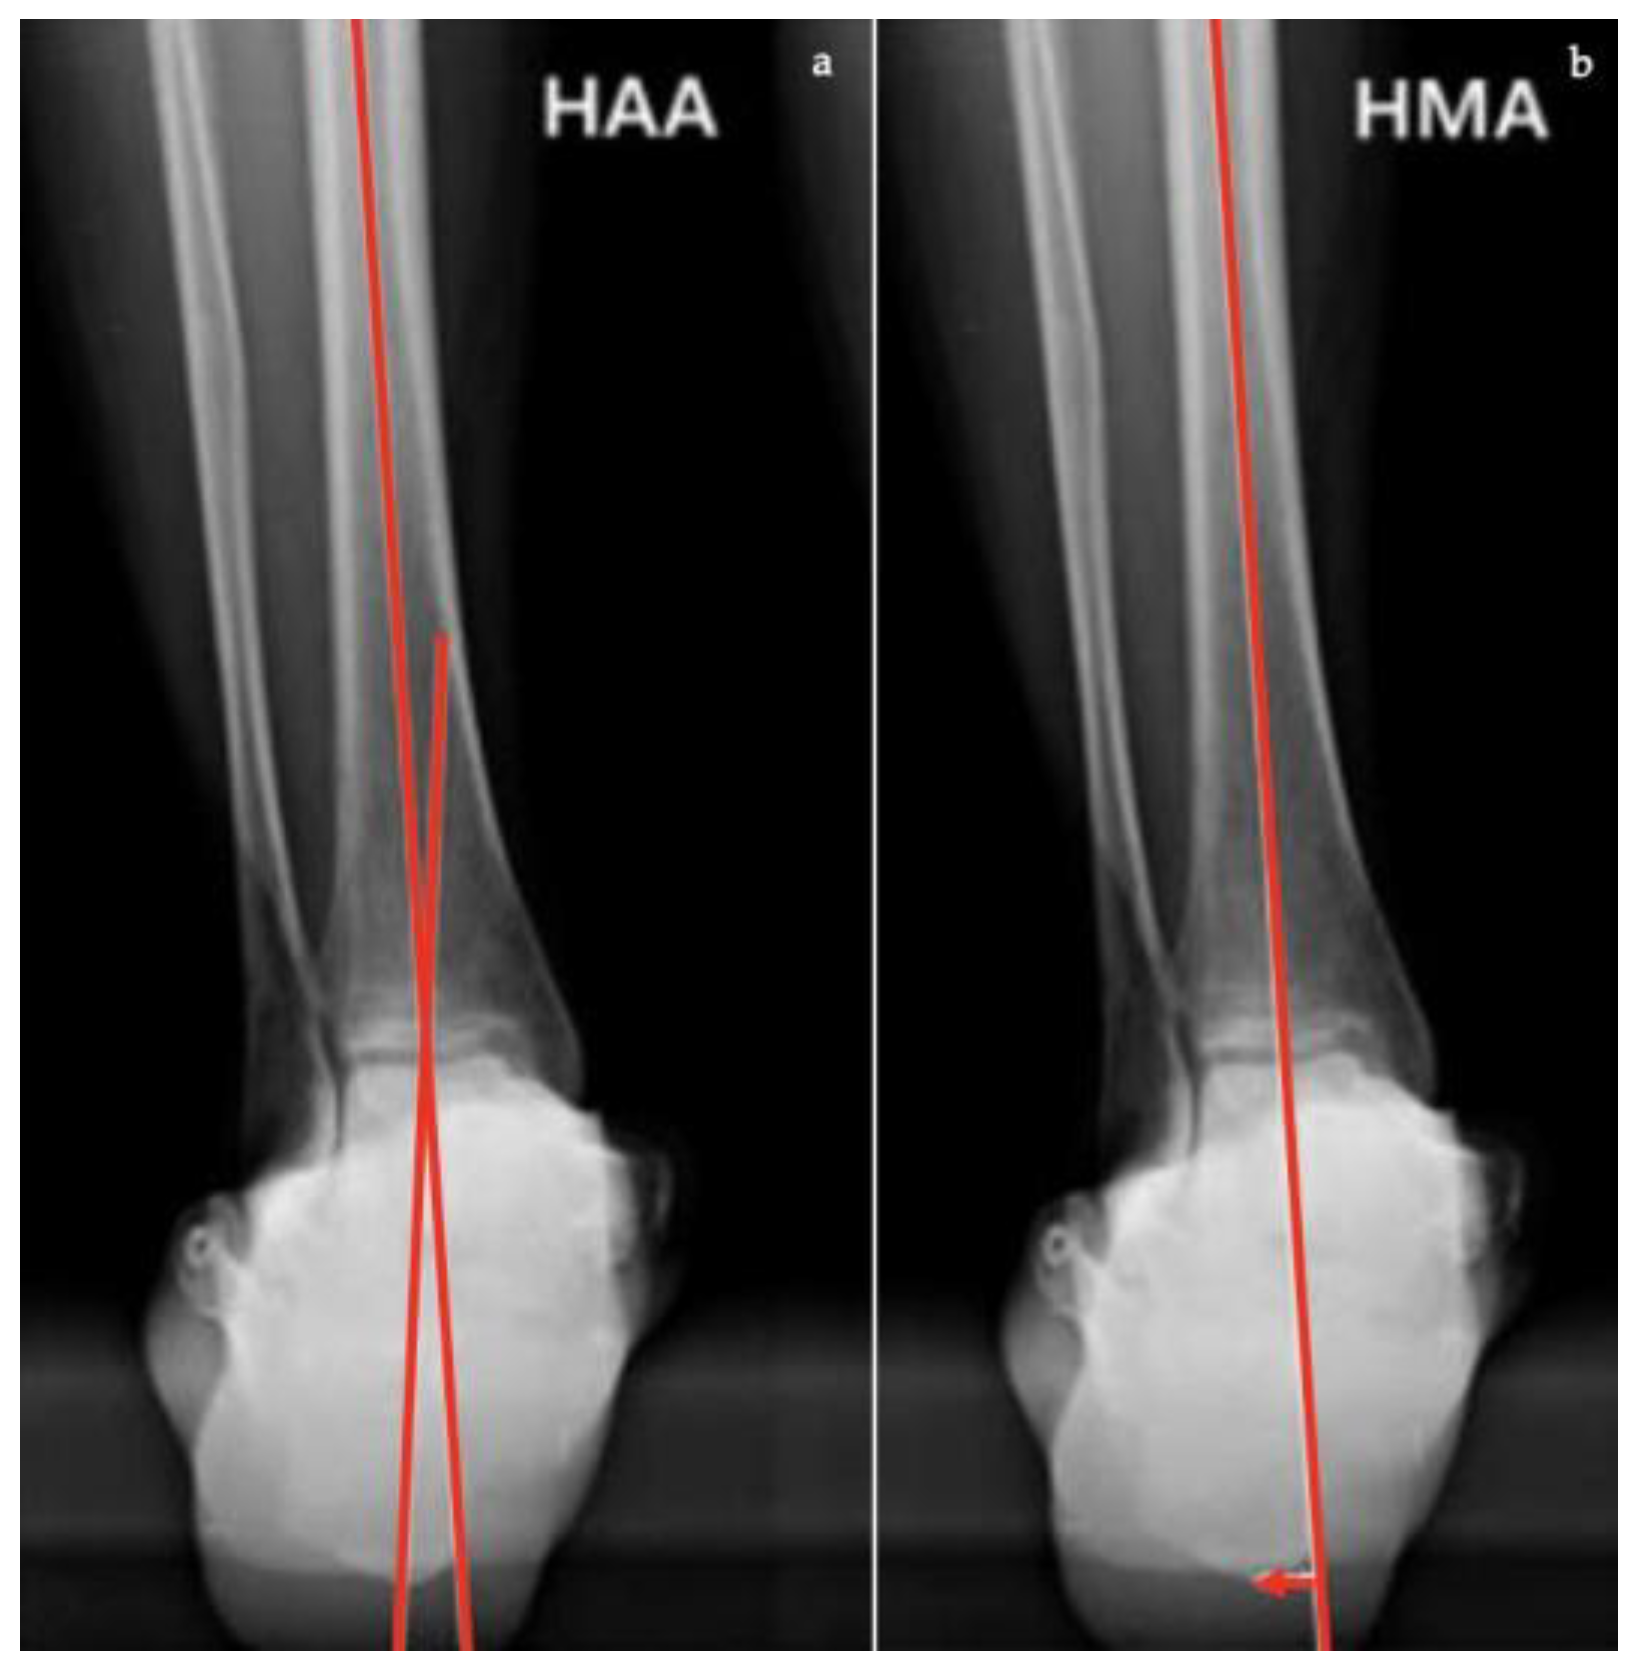
- Hindfoot moment arm, measured by the shortest distance between the midtibial axis and the most inferior portion of the calcaneus gus (normal, −3 mm to +10 [varus]; flatfoot, >+10 mm [valgus]);
- Hindfoot alignment angle, formed by the intersection of the longitudinal axis of the tibial shaft and the axis of the calcaneal tuberosity (normal, 5.6 ± 5.4°; flatfoot, 22.5 ± 4.9°) [17].
2.2. Magnetic Resonance Imaging (MRI)
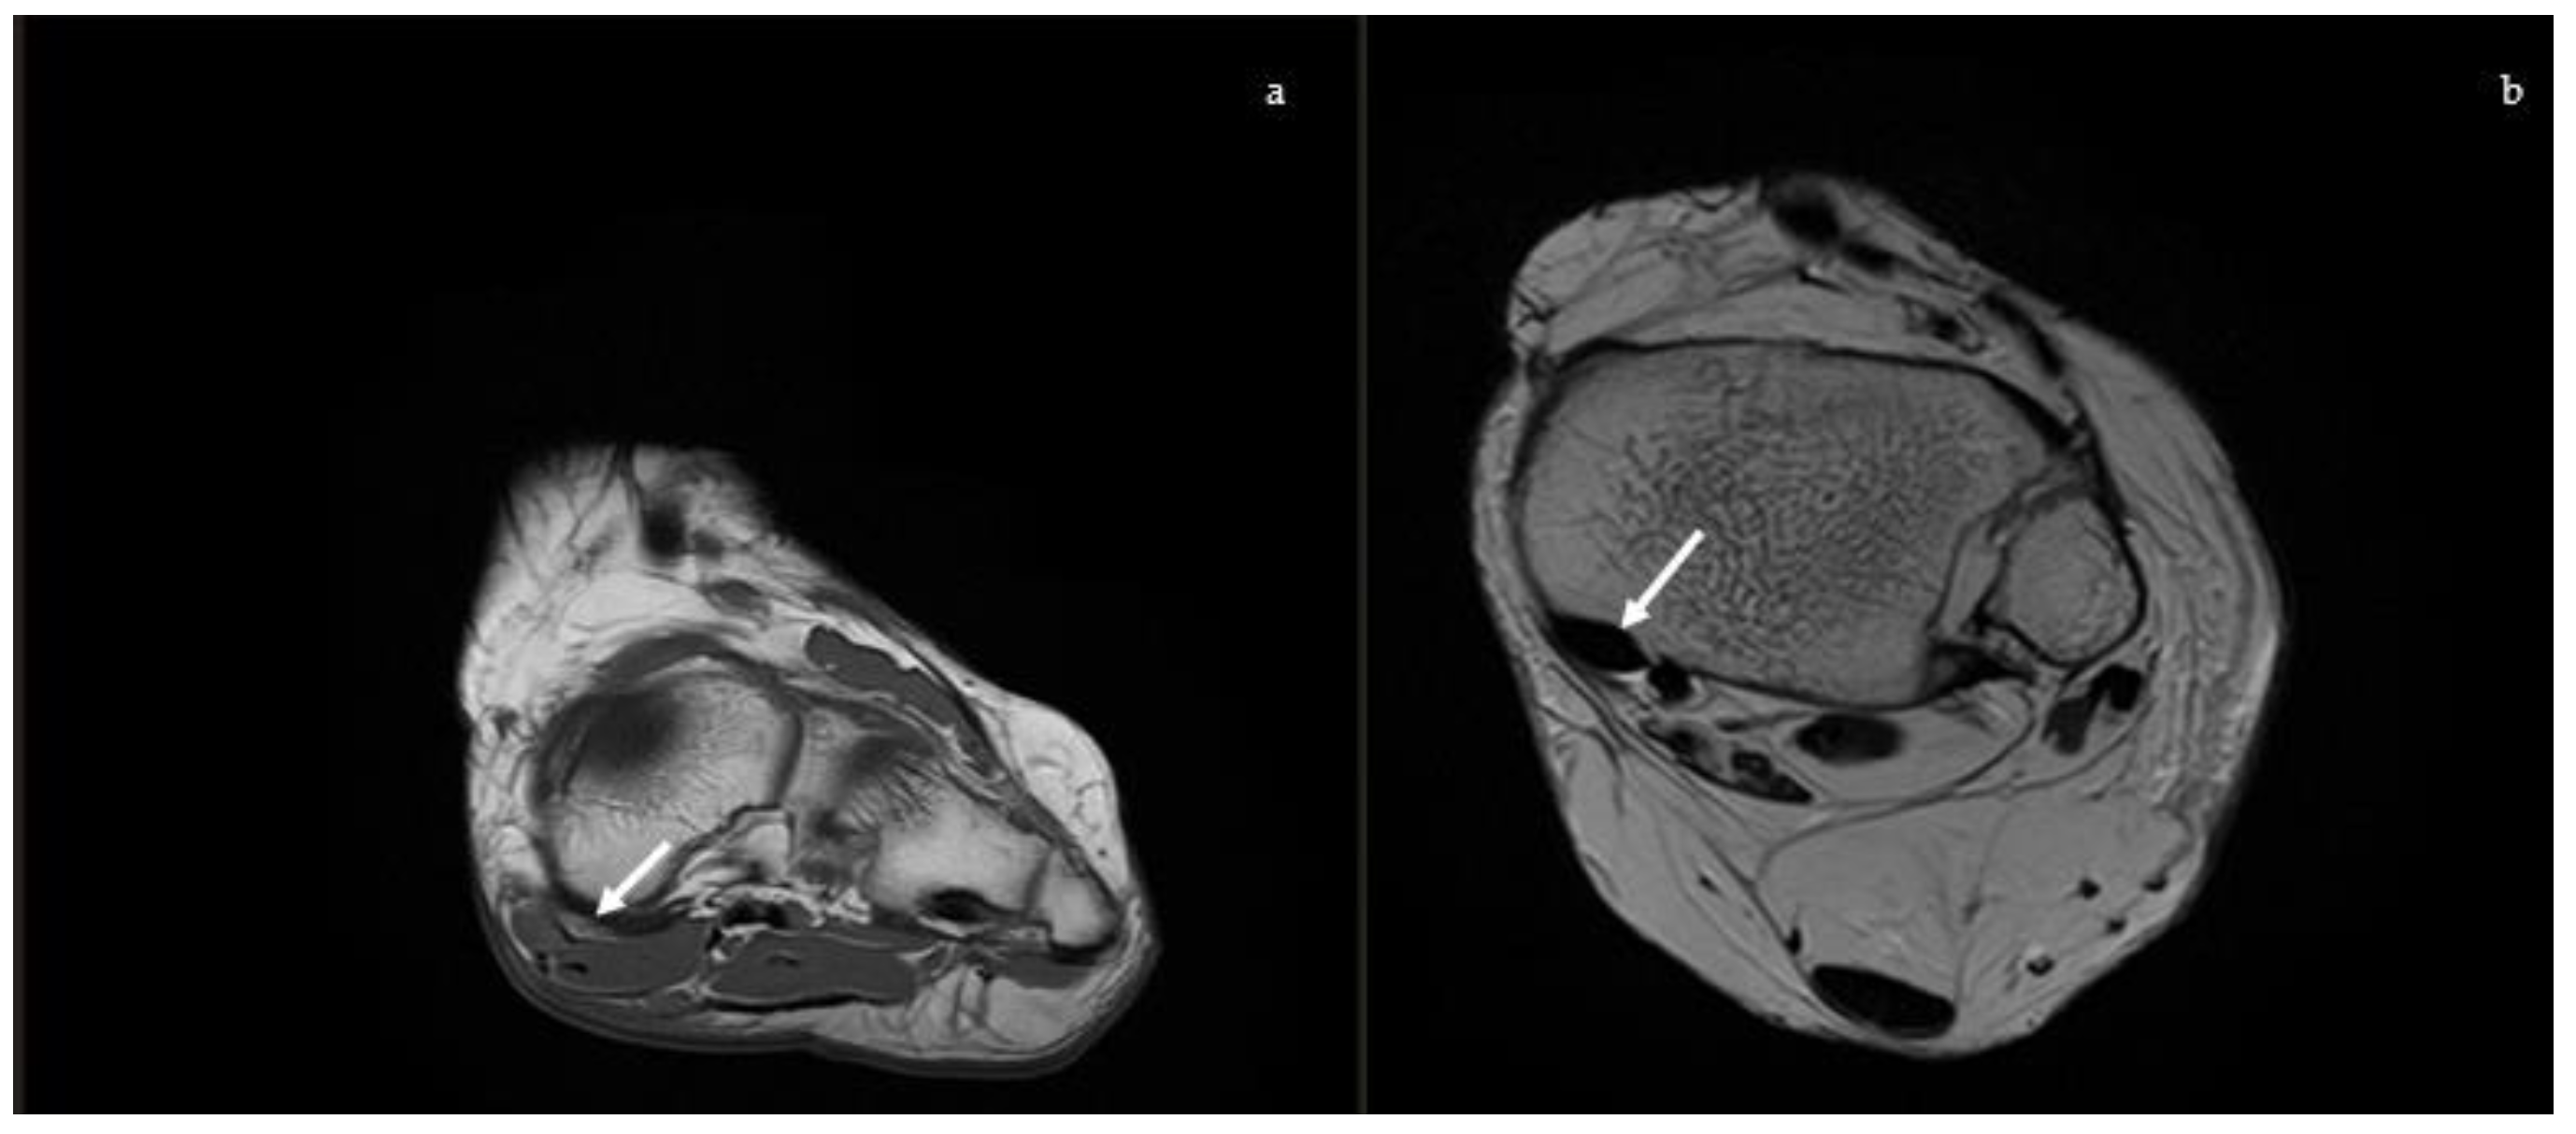
2.2.1. Posterior Tibial Tendon
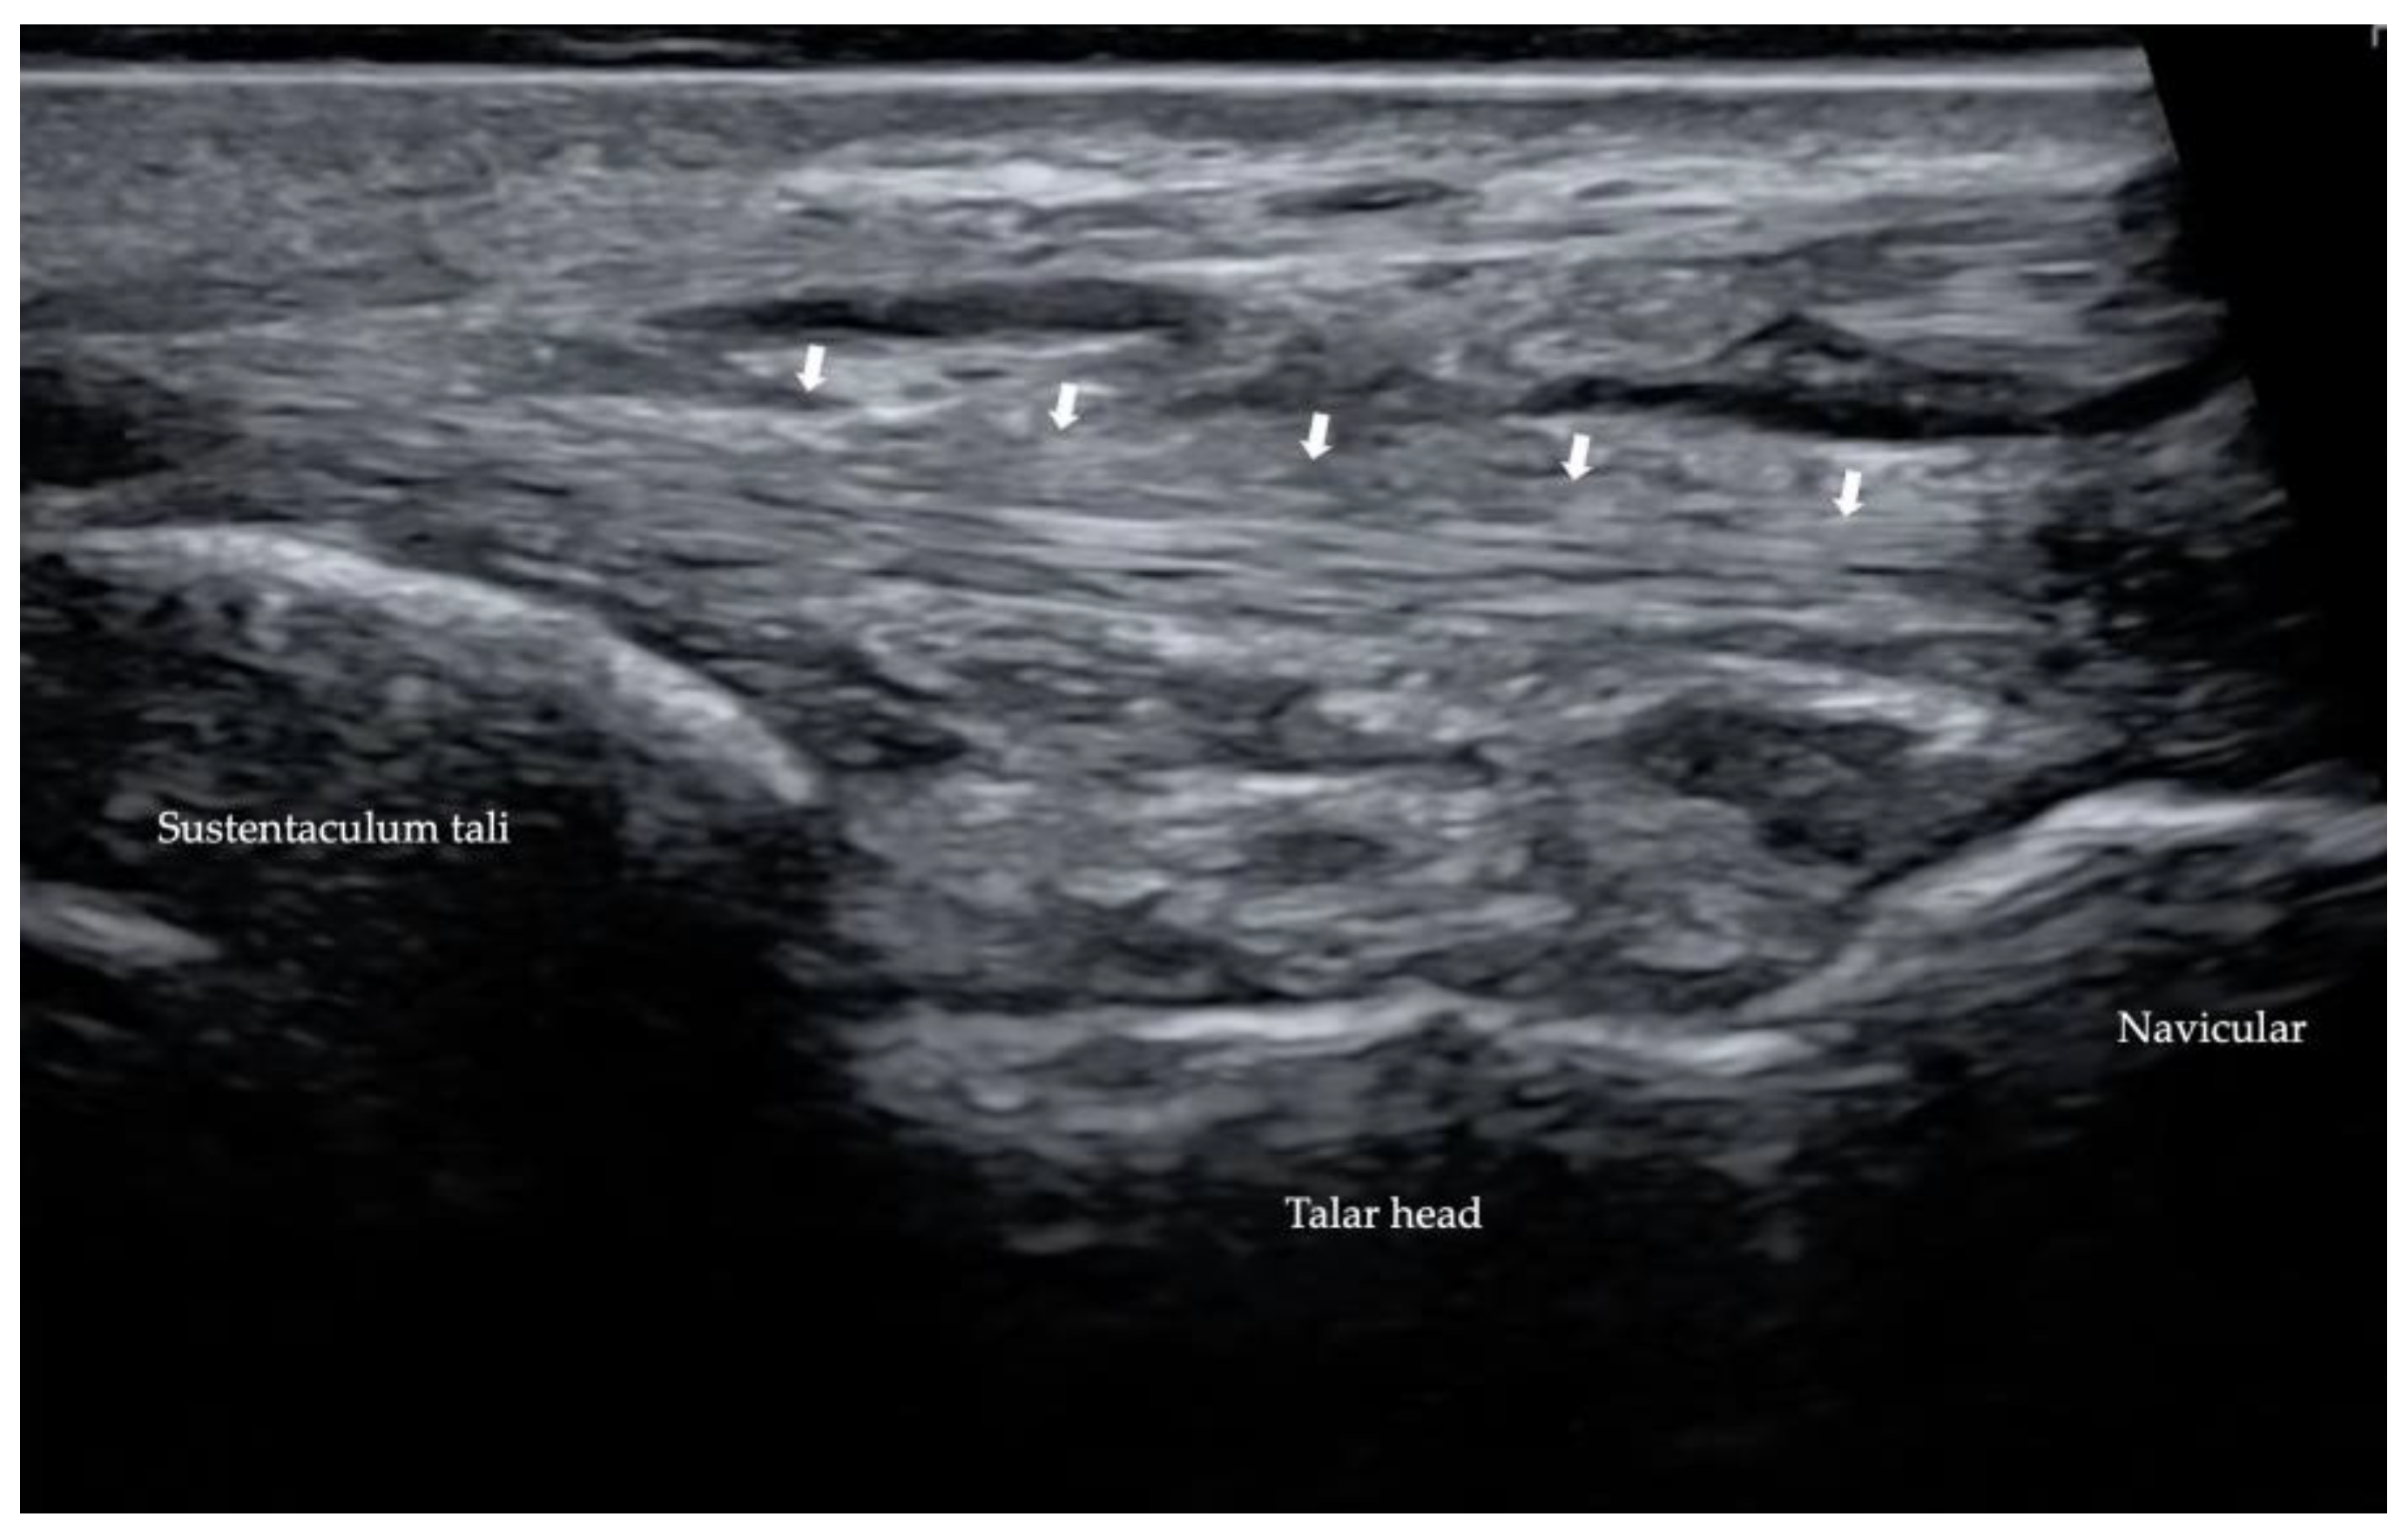
2.2.2. Spring Ligament
2.3. Ultrasound (US)
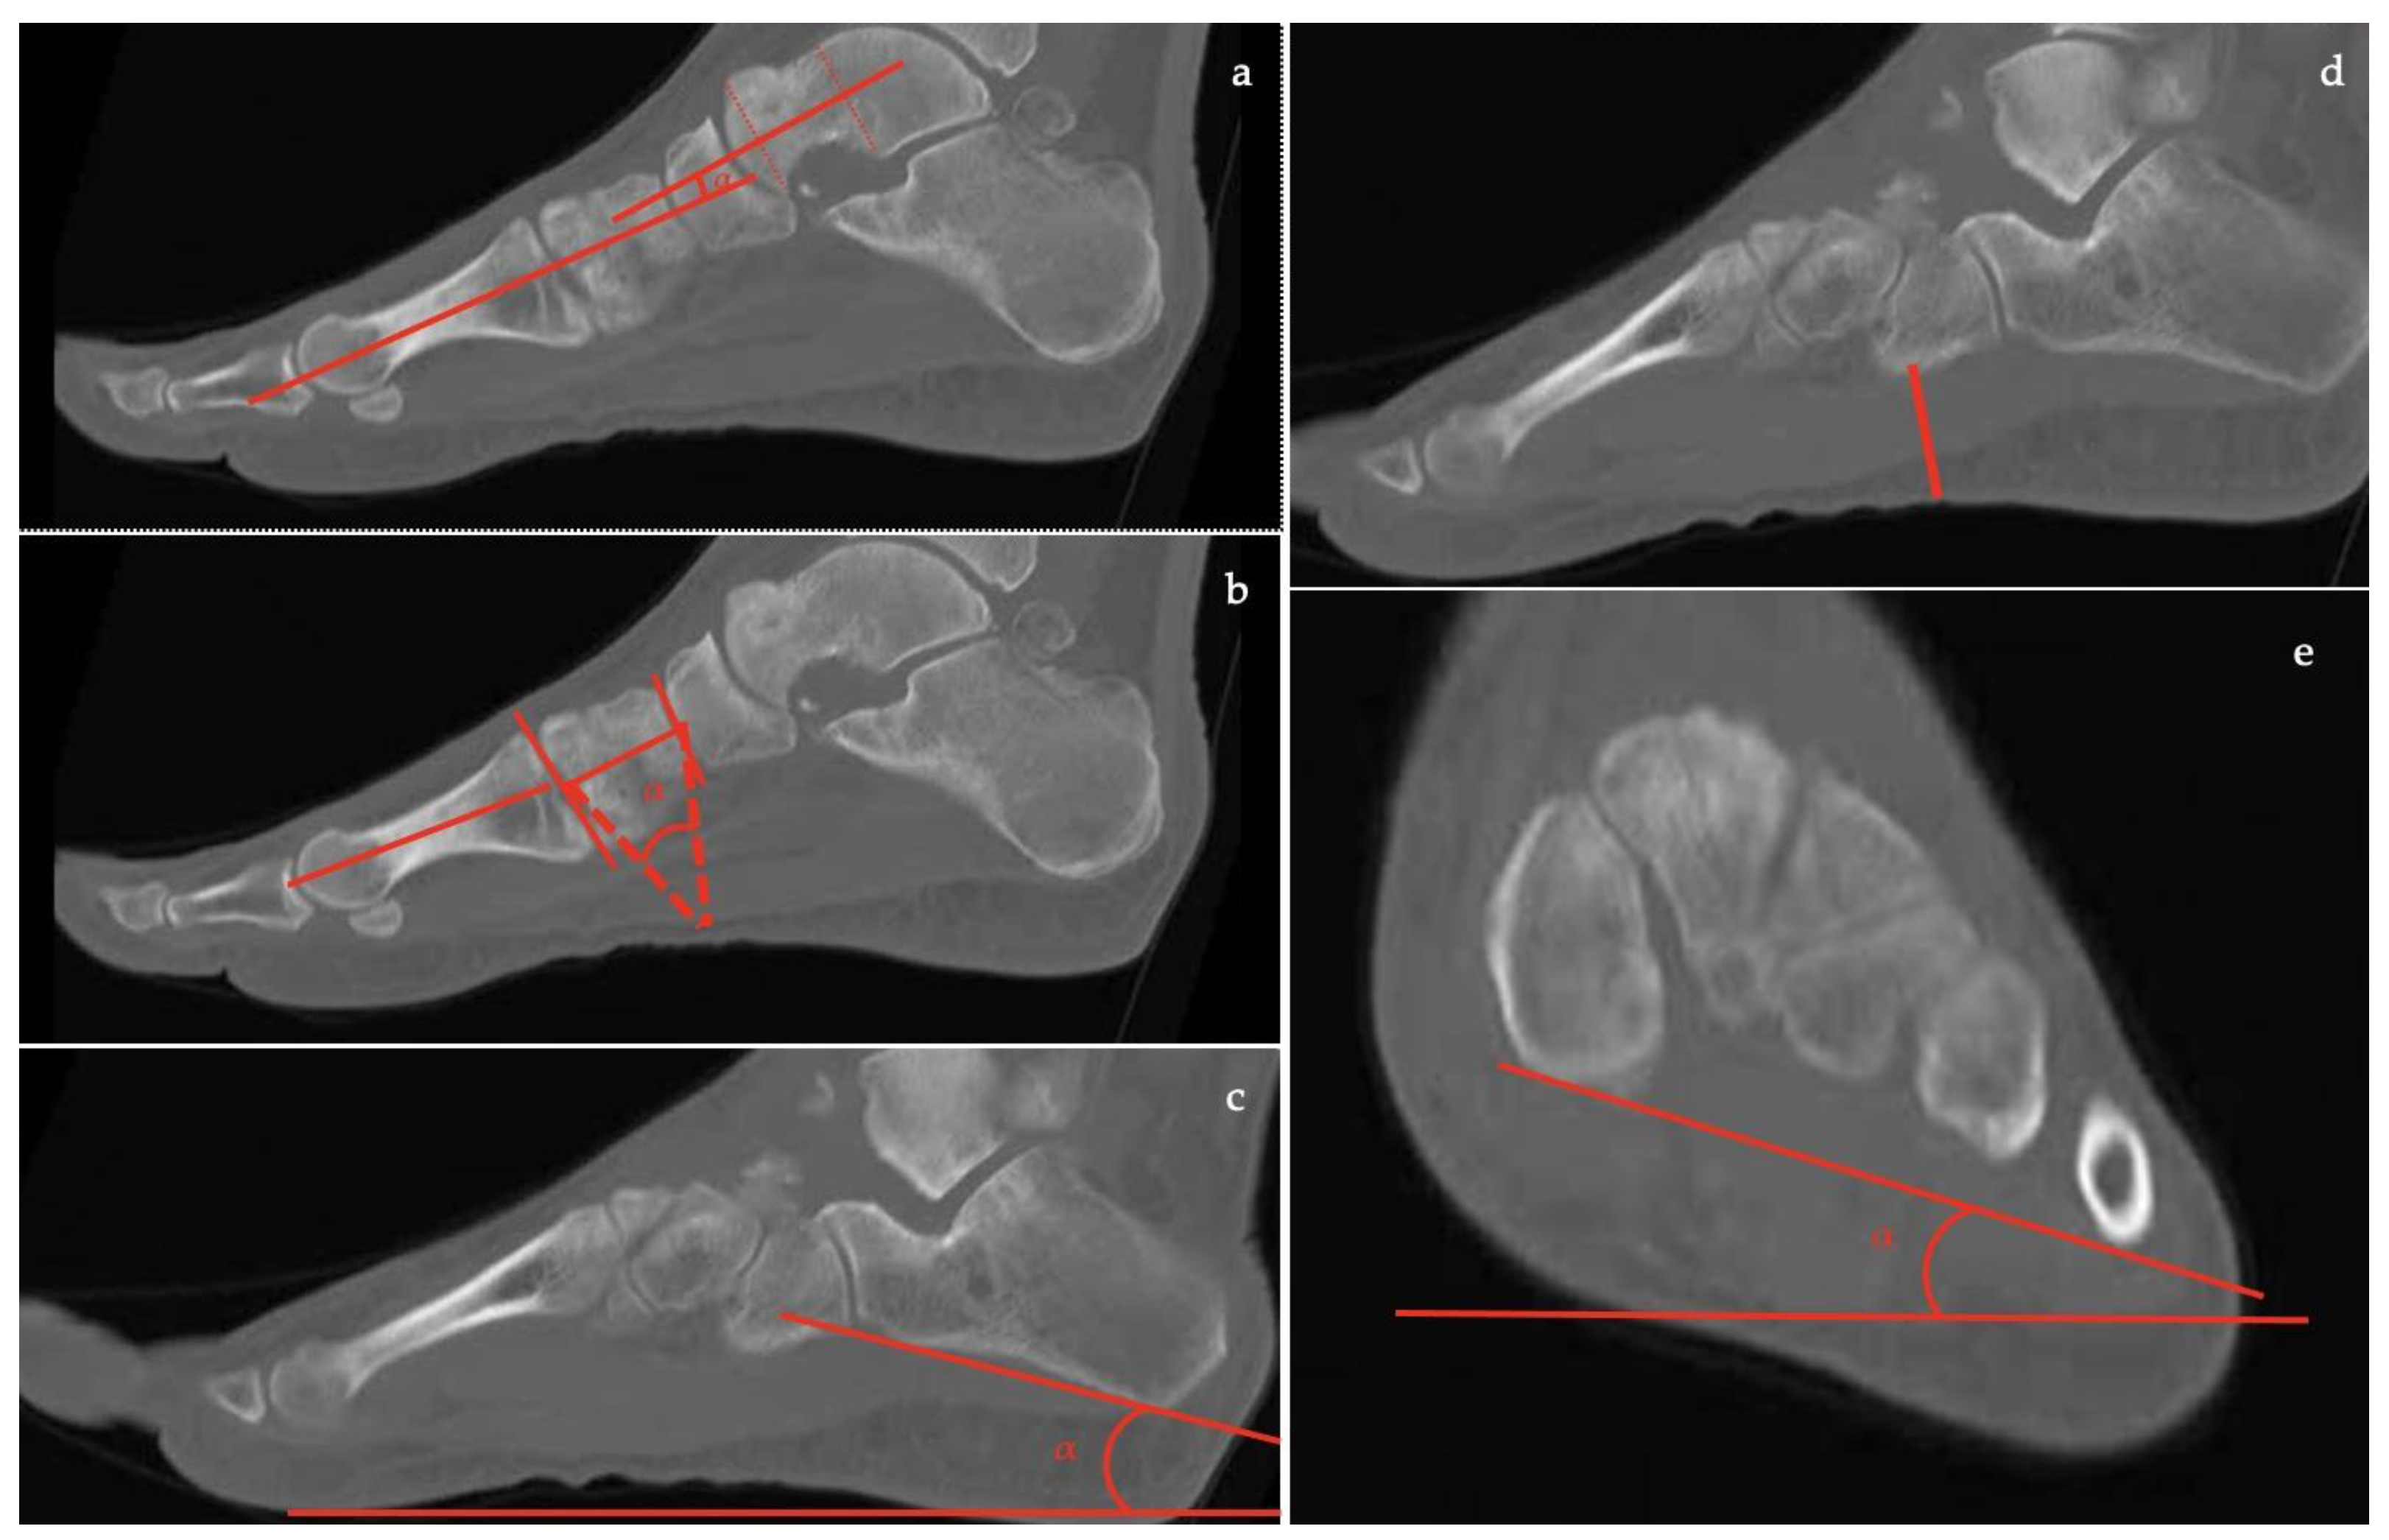
2.4. Computed Tomography (CT)
- the talar-first metatarsal angle;
- the talonavicular coverage angle.
- the forefoot arch angle;
- the navicular-to-skin distance;
- the navicular-to-floor distance;
- the medial cuneiform-to-skin distance;
- the medial cuneiform-to-floor distance;
- the calcaneofibular distance;
- the subtalar horizontal angle, which is the angle between the posterior facet of the talus and the floor measured at 25% (posterior aspect), at 50% (midpoint), and at 75% (anterior aspect) of the posterior subtalar joint length.
- the talus-first metatarsal angle;
- the navicular-to-skin distance;
- the navicular-to-floor distance;
- the cuboid-to-skin distance;
- the cuboid-to-floor distance;
- the medial cuneiform-to-skin distance;
- the medial cuneiform-to-floor distance;
- the calcaneal inclination angle.
Weightbearing CT (WBCT)
3. Discussion
4. Conclusions
Author Contributions
Funding
Institutional Review Board Statement
Informed Consent Statement
Data Availability Statement
Conflicts of Interest
References
- Auch, E.; Barbachan Mansur, N.S.; Alexandre Alves, T.; Cychosz, C.; Lintz, F.; Godoy-Santos, A.L.; Baumfeld, D.S.; de Cesar Netto, C. Distal Tibiofibular Syndesmotic Widening in Progressive Collapsing Foot Deformity. Foot Ankle Int. 2021, 42, 768–775. [Google Scholar] [CrossRef] [PubMed]
- Myerson, M.S.; Thordarson, D.B.; Johnson, J.E.; Hintermann, B.; Sangeorzan, B.J.; Deland, J.T.; Schon, L.C.; Ellis, S.J.; de Cesar Netto, C. Classification and Nomenclature: Progressive Collapsing Foot Deformity. Foot Ankle Int. 2020, 41, 1271–1276. [Google Scholar] [CrossRef]
- de Cesar Netto, C.; Myerson, M.S.; Day, J.; Ellis, S.J.; Hintermann, B.; Johnson, J.E.; Sangeorzan, B.J.; Schon, L.C.; Thordarson, D.B.; Deland, J.T. Consensus for the Use of Weightbearing CT in the Assessment of Progressive Collapsing Foot Deformity. Foot Ankle Int. 2020, 41, 1277–1282. [Google Scholar] [CrossRef] [PubMed]
- Bernasconi, A.; Ray, R. Role of Minimally Invasive Surgery in Adult Flatfoot Deformity. Foot Ankle Clin. 2020, 25, 479–491. [Google Scholar] [CrossRef] [PubMed]
- Lee, M.S.; Vanore, J.V.; Thomas, J.L.; Catanzariti, A.R.; Kogler, G.; Kravitz, S.R.; Miller, S.J.; Gassen, S.C. Diagnosis and Treatment of Adult Flatfoot. J. Foot Ankle Surg. 2005, 44, 78–113. [Google Scholar] [CrossRef] [PubMed] [Green Version]
- Toullec, E. Adult Flatfoot. Orthop. Traumatol. Surg. Res. 2015, 101, S11–S17. [Google Scholar] [CrossRef] [PubMed] [Green Version]
- Flores, D.V.; Mejía Gómez, C.; Fernández Hernando, M.; Davis, M.A.; Pathria, M.N. Adult Acquired Flatfoot Deformity: Anatomy, Biomechanics, Staging, and Imaging Findings. RadioGraphics 2019, 39, 1437–1460. [Google Scholar] [CrossRef] [PubMed] [Green Version]
- López-López, D.; Vilar-Fernández, J.; Barros-García, G.; Losa-Iglesias, M.; Palomo-López, P.; Becerro-de-Bengoa-Vallejo, R.; Calvo-Lobo, C. Foot Arch Height and Quality of Life in Adults: A Strobe Observational Study. Int. J. Environ. Res. Public Health 2018, 15, 1555. [Google Scholar] [CrossRef] [Green Version]
- Cianni, L.; Vitiello, R.; Greco, T.; Sirgiovanni, M.; Ragonesi, G.; Maccauro, G.; Perisano, C. Predictive Factors of Poor Outcome in Sanders Type III and IV Calcaneal Fractures Treated with an Open Reduction and Internal Fixation with Plate: A Medium-Term Follow-Up. J. Clin. Med. 2022, 11, 5660. [Google Scholar] [CrossRef]
- Henry, J.K.; Shakked, R.; Ellis, S.J. Adult-Acquired Flatfoot Deformity. Foot Ankle Orthop. 2019, 4, 247301141882084. [Google Scholar] [CrossRef]
- Abousayed, M.M.; Alley, M.C.; Shakked, R.; Rosenbaum, A.J. Adult-Acquired Flatfoot Deformity: Etiology, Diagnosis, and Management. JBJS Rev. 2017, 5, e7. [Google Scholar] [CrossRef] [PubMed]
- de Cesar Netto, C. Flexible Adult-Acquired Flatfoot Deformity: Comparison Between Weight Bearing and Non-Weight Bearing Measurements Using Cone Beam Computed Tomography. In Weight Bearing Cone Beam Computed Tomography (WBCT) in the Foot and Ankle; Springer International Publishing: Cham, Switzerland, 2020; pp. 181–198. ISBN 978-3-030-31948-9. [Google Scholar]
- Saltzman, C.L.; El-Khoury, G.Y. The Hindfoot Alignment View. Foot Ankle Int. 1995, 16, 572–576. [Google Scholar] [CrossRef] [PubMed]
- Lin, Y.-C.; Mhuircheartaigh, J.N.; Lamb, J.; Kung, J.W.; Yablon, C.M.; Wu, J.S. Imaging of Adult Flatfoot: Correlation of Radiographic Measurements With MRI. Am. J. Roentgenol. 2015, 204, 354–359. [Google Scholar] [CrossRef]
- Neri, T.; Barthelemy, R.; Tourné, Y. Radiologic Analysis of Hindfoot Alignment: Comparison of Méary, Long Axial, and Hindfoot Alignment Views. Orthop. Traumatol. Surg. Res. 2017, 103, 1211–1216. [Google Scholar] [CrossRef]
- Perez Boal, E.; Becerro de Bengoa Vallejo, R.; Fuentes Rodriguez, M.; Lopez Lopez, D.; Losa Iglesias, M.E. Geometry of the Proximal Phalanx of Hallux and First Metatarsal Bone to Predict Hallux Abducto Valgus: A Radiological Study. PLoS ONE 2016, 11, e0166197. [Google Scholar] [CrossRef] [Green Version]
- Cody, E.A.; Williamson, E.R.; Burket, J.C.; Deland, J.T.; Ellis, S.J. Correlation of Talar Anatomy and Subtalar Joint Alignment on Weightbearing Computed Tomography with Radiographic Flatfoot Parameters. Foot Ankle Int. 2016, 37, 874–881. [Google Scholar] [CrossRef] [PubMed]
- Sensiba, P.R.; Coffey, M.J.; Williams, N.E.; Mariscalco, M.; Laughlin, R.T. Inter- and Intraobserver Reliability in the Radiographic Evaluation of Adult Flatfoot Deformity. Foot Ankle Int. 2010, 31, 141–145. [Google Scholar] [CrossRef]
- Conti, M.S.; Garfinkel, J.H.; Ellis, S.J. Outcomes of Reconstruction of the Flexible Adult-Acquired Flatfoot Deformity. Orthop. Clin. N. Am. 2020, 51, 109–120. [Google Scholar] [CrossRef] [PubMed]
- Guyton, G.P.; Jeng, C.; Krieger, L.E.; Mann, R.A. Flexor Digitorum Longus Transfer and Medial Displacement Calcaneal Osteotomy for Posterior Tibial Tendon Dysfunction: A Middle-Term Clinical Follow-Up. Foot Ankle Int. 2001, 22, 627–632. [Google Scholar] [CrossRef]
- Sammarco, G.J.; Hockenbury, R.T. Treatment of Stage II Posterior Tibial Tendon Dysfunction with Flexor Hallucis Longus Transfer and Medial Displacement Calcaneal Osteotomy. Foot Ankle Int. 2001, 22, 305–312. [Google Scholar] [CrossRef]
- Sangeorzan, B.J.; Mosca, V.; Hansen, S.T. Effect of Calcaneal Lengthening on Relationships among the Hindfoot, Midfoot, and Forefoot. Foot Ankle 1993, 14, 136–141. [Google Scholar] [CrossRef]
- Chan, J.Y.; Greenfield, S.T.; Soukup, D.S.; Do, H.T.; Deland, J.T.; Ellis, S.J. Contribution of Lateral Column Lengthening to Correction of Forefoot Abduction in Stage IIb Adult Acquired Flatfoot Deformity Reconstruction. Foot Ankle Int. 2015, 36, 1400–1411. [Google Scholar] [CrossRef] [PubMed]
- Abousayed, M.M.; Coleman, M.M.; Wei, L.; de Cesar Netto, C.; Schon, L.C.; Guyton, G.P. Radiographic Outcomes of Cotton Osteotomy in Treatment of Adult-Acquired Flatfoot Deformity. Foot Ankle Int. 2021, 42, 1384–1390. [Google Scholar] [CrossRef]
- Yang, Z.; Liu, F.; Cui, L.; Liu, H.; Zuo, J.; Liu, L.; Li, S. Adult Rigid Flatfoot: Triple Arthrodesis and Osteotomy. Medicine 2020, 99, e18826. [Google Scholar] [CrossRef] [PubMed]
- Bernasconi, A.; Argyropoulos, M.; Patel, S.; Ghani, Y.; Cullen, N.; Singh, D.; Welck, M. Subtalar Arthroereisis as an Adjunct Procedure Improves Forefoot Abduction in Stage IIb Adult-Acquired Flatfoot Deformity. Foot Ankle Spec. 2022, 15, 209–220. [Google Scholar] [CrossRef] [PubMed]
- Polichetti, C.; Greco, T.; Inverso, M.; Maccauro, G.; Forconi, F.; Perisano, C. Retro-Malleolar Z-Plasty of Flexor Hallucis Longus Tendon in Post-Traumatic Checkrein Deformity: A Case Series and Literature Review. Medicina 2022, 58, 1072. [Google Scholar] [CrossRef]
- Perisano, C.; Greco, T.; Vitiello, R.; Maccauro, G.; Liuzza, F.; Tamburelli, F.C.; Forconi, F. Mueller-Weiss Disease: Review of the Literature. J. Biol. Regul. Homeost. Agents 2018, 32 (Suppl. S1), 157–162. [Google Scholar]
- Persaud, S.; Hentges, M.J.; Catanzariti, A.R. Occurrence of Lateral Ankle Ligament Disease with Stage 2 to 3 Adult-Acquired Flatfoot Deformity Confirmed via Magnetic Resonance Imaging: A Retrospective Study. J. Foot Ankle Surg. 2019, 58, 243–247. [Google Scholar] [CrossRef]
- Rosenberg, Z.S.; Cheung, Y.; Jahss, M.H.; Noto, A.M.; Norman, A.; Leeds, N.E. Rupture of Posterior Tibial Tendon: CT and MR Imaging with Surgical Correlation. Radiology 1988, 169, 229–235. [Google Scholar] [CrossRef]
- McCormack, A.P.; Niki, H.; Kiser, P.; Tencer, A.F.; Sangeorzan, B.J. Two Reconstructive Techniques for Flatfoot Deformity Comparing Contact Characteristics of the Hindfoot Joints. Foot Ankle Int. 1998, 19, 452–461. [Google Scholar] [CrossRef]
- Kimura, Y.; Yamashiro, T.; Saito, Y.; Kitsukawa, K.; Niki, H.; Mimura, H. MRI Findings of Spring Ligament Injury: Association with Surgical Findings and Flatfoot Deformity. Acta Radiol. Open 2020, 9, 205846012098014. [Google Scholar] [CrossRef]
- Ormsby, N.; Jackson, G.; Evans, P.; Platt, S. Imaging of the Tibionavicular Ligament, and Its Potential Role in Adult Acquired Flatfoot Deformity. Foot Ankle Int. 2018, 39, 629–635. [Google Scholar] [CrossRef]
- Sofka, C.M. Postoperative Magnetic Resonance Imaging of the Foot and Ankle. J. Magn. Reson. Imaging 2013, 37, 556–565. [Google Scholar] [CrossRef]
- Lobo, C.C.; Marín, A.G.; Sanz, D.R.; López, D.L.; López, P.P.; Morales, C.R.; Corbalán, I.S. Ultrasound Evaluation of Intrinsic Plantar Muscles and Fascia in Hallux Valgus: A Case-Control Study. Medicine 2016, 95, e5243. [Google Scholar] [CrossRef]
- Meehan, R.E.; Brage, M. Adult Acquired Flat Foot Deformity: Clinical and Radiographic Examination. Foot Ankle Clin. 2003, 8, 431–452. [Google Scholar] [CrossRef]
- de Cesar Netto, C.; Shakoor, D.; Dein, E.J.; Zhang, H.; Thawait, G.K.; Richter, M.; Ficke, J.R.; Schon, L.C.; Demehri, S.; Richter, M.; et al. Influence of Investigator Experience on Reliability of Adult Acquired Flatfoot Deformity Measurements Using Weightbearing Computed Tomography. Foot Ankle Surg. 2019, 25, 495–502. [Google Scholar] [CrossRef] [PubMed] [Green Version]
- Carrino, J.A.; Al Muhit, A.; Zbijewski, W.; Thawait, G.K.; Stayman, J.W.; Packard, N.; Senn, R.; Yang, D.; Foos, D.H.; Yorkston, J.; et al. Dedicated Cone-Beam CT System for Extremity Imaging. Radiology 2014, 270, 816–824. [Google Scholar] [CrossRef] [PubMed]
- Tuominen, E.K.J.; Kankare, J.; Koskinen, S.K.; Mattila, K.T. Weight-Bearing CT Imaging of the Lower Extremity. Am. J. Roentgenol. 2013, 200, 146–148. [Google Scholar] [CrossRef] [PubMed]
- Thawait, G.K.; Demehri, S.; AlMuhit, A.; Zbijweski, W.; Yorkston, J.; Del Grande, F.; Zikria, B.; Carrino, J.A.; Siewerdsen, J.H. Extremity Cone-Beam CT for Evaluation of Medial Tibiofemoral Osteoarthritis: Initial Experience in Imaging of the Weight-Bearing and Non-Weight-Bearing Knee. Eur. J. Radiol. 2015, 84, 2564–2570. [Google Scholar] [CrossRef] [Green Version]
- Conti, M.S.; Ellis, S.J. Weight-Bearing CT Scans in Foot and Ankle Surgery. J. Am. Acad. Orthop. Surg. 2020, 28, e595–e603. [Google Scholar] [CrossRef] [PubMed]
- Day, J.; de Cesar Netto, C.; Nishikawa, D.R.C.; Garfinkel, J.; Roney, A.; O’Malley, M.J.; Deland, J.T.; Ellis, S.J. Three-Dimensional Biometric Weightbearing CT Evaluation of the Operative Treatment of Adult-Acquired Flatfoot Deformity. Foot Ankle Int. 2020, 41, 930–936. [Google Scholar] [CrossRef]
- Dimmick, S.; Chhabra, A.; Grujic, L.; Linklater, J. Acquired Flat Foot Deformity: Postoperative Imaging. Semin. Musculoskelet. Radiol. 2012, 16, 217–232. [Google Scholar] [CrossRef] [PubMed]
- de Cesar Netto, C.; Saito, G.H.; Roney, A.; Day, J.; Greditzer, H.; Sofka, C.; Ellis, S.J.; Richter, M.; Barg, A.; Lintz, F.; et al. Combined weightbearing CT and MRI assessment of flexible progressive collapsing foot deformity. Foot Ankle Surg. 2021, 27, 884–891. [Google Scholar] [CrossRef] [PubMed]
- Kunas, G.C.; Probasco, W.; Haleem, A.M.; Burket, J.C.; Williamson, E.R.C.; Ellis, S.J. Evaluation of Peritalar Subluxation in Adult Acquired Flatfoot Deformity Using Computed Tomography and Weightbearing Multiplanar Imaging. Foot Ankle Surg. 2018, 24, 495–500. [Google Scholar] [CrossRef] [PubMed]
- Shakoor, D.; de Cesar Netto, C.; Thawait, G.K.; Ellis, S.J.; Richter, M.; Schon, L.C.; Demehri, S. Weight-Bearing Radiographs and Cone-Beam Computed Tomography Examinations in Adult Acquired Flatfoot Deformity. Foot Ankle Surg. 2021, 27, 201–206. [Google Scholar] [CrossRef] [PubMed]


Disclaimer/Publisher’s Note: The statements, opinions and data contained in all publications are solely those of the individual author(s) and contributor(s) and not of MDPI and/or the editor(s). MDPI and/or the editor(s) disclaim responsibility for any injury to people or property resulting from any ideas, methods, instructions or products referred to in the content. |
© 2023 by the authors. Licensee MDPI, Basel, Switzerland. This article is an open access article distributed under the terms and conditions of the Creative Commons Attribution (CC BY) license (https://creativecommons.org/licenses/by/4.0/).
Share and Cite
Polichetti, C.; Borruto, M.I.; Lauriero, F.; Caravelli, S.; Mosca, M.; Maccauro, G.; Greco, T.; Perisano, C. Adult Acquired Flatfoot Deformity: A Narrative Review about Imaging Findings. Diagnostics 2023, 13, 225. https://doi.org/10.3390/diagnostics13020225
Polichetti C, Borruto MI, Lauriero F, Caravelli S, Mosca M, Maccauro G, Greco T, Perisano C. Adult Acquired Flatfoot Deformity: A Narrative Review about Imaging Findings. Diagnostics. 2023; 13(2):225. https://doi.org/10.3390/diagnostics13020225
Chicago/Turabian StylePolichetti, Chiara, Maria Ilaria Borruto, Francesco Lauriero, Silvio Caravelli, Massimiliano Mosca, Giulio Maccauro, Tommaso Greco, and Carlo Perisano. 2023. "Adult Acquired Flatfoot Deformity: A Narrative Review about Imaging Findings" Diagnostics 13, no. 2: 225. https://doi.org/10.3390/diagnostics13020225