

Three-Dimensional Measurement of the Uterus on Magnetic Resonance Images: Development and Performance Analysis of an Automated Deep-Learning Tool
 , ,
, ,
Abstract
:1. Introduction
2. Material and Methods
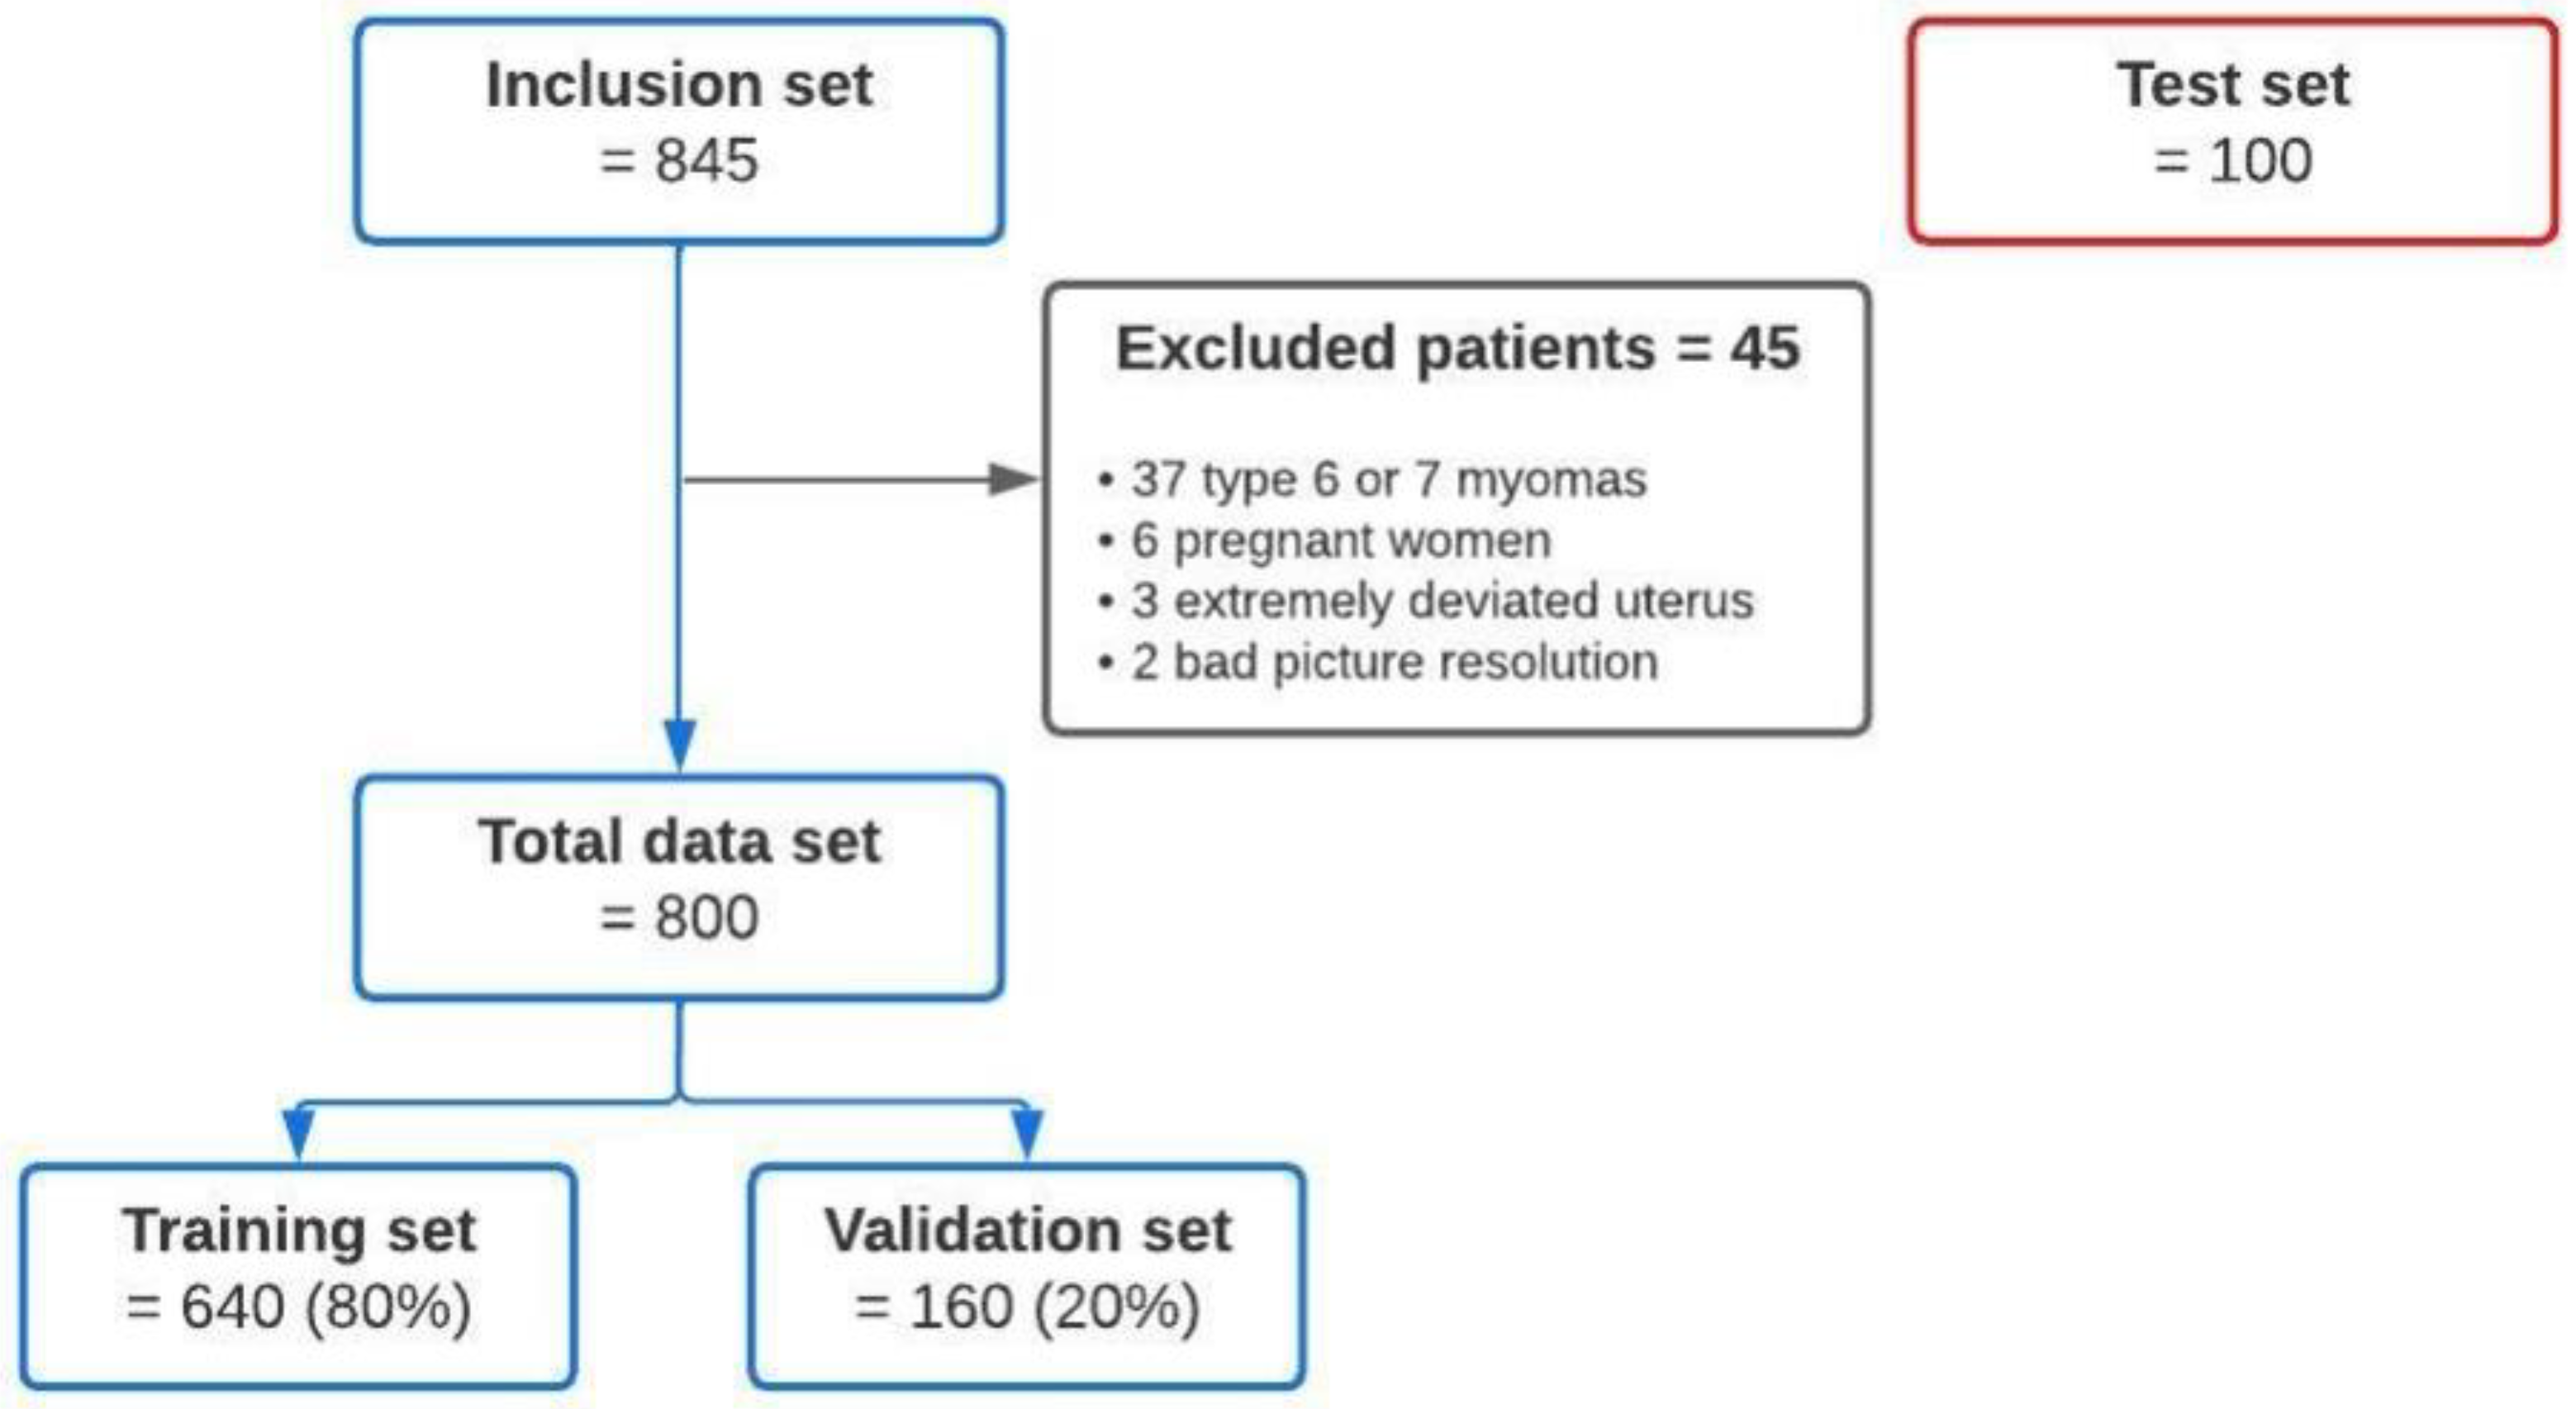
2.1. Data Acquisition
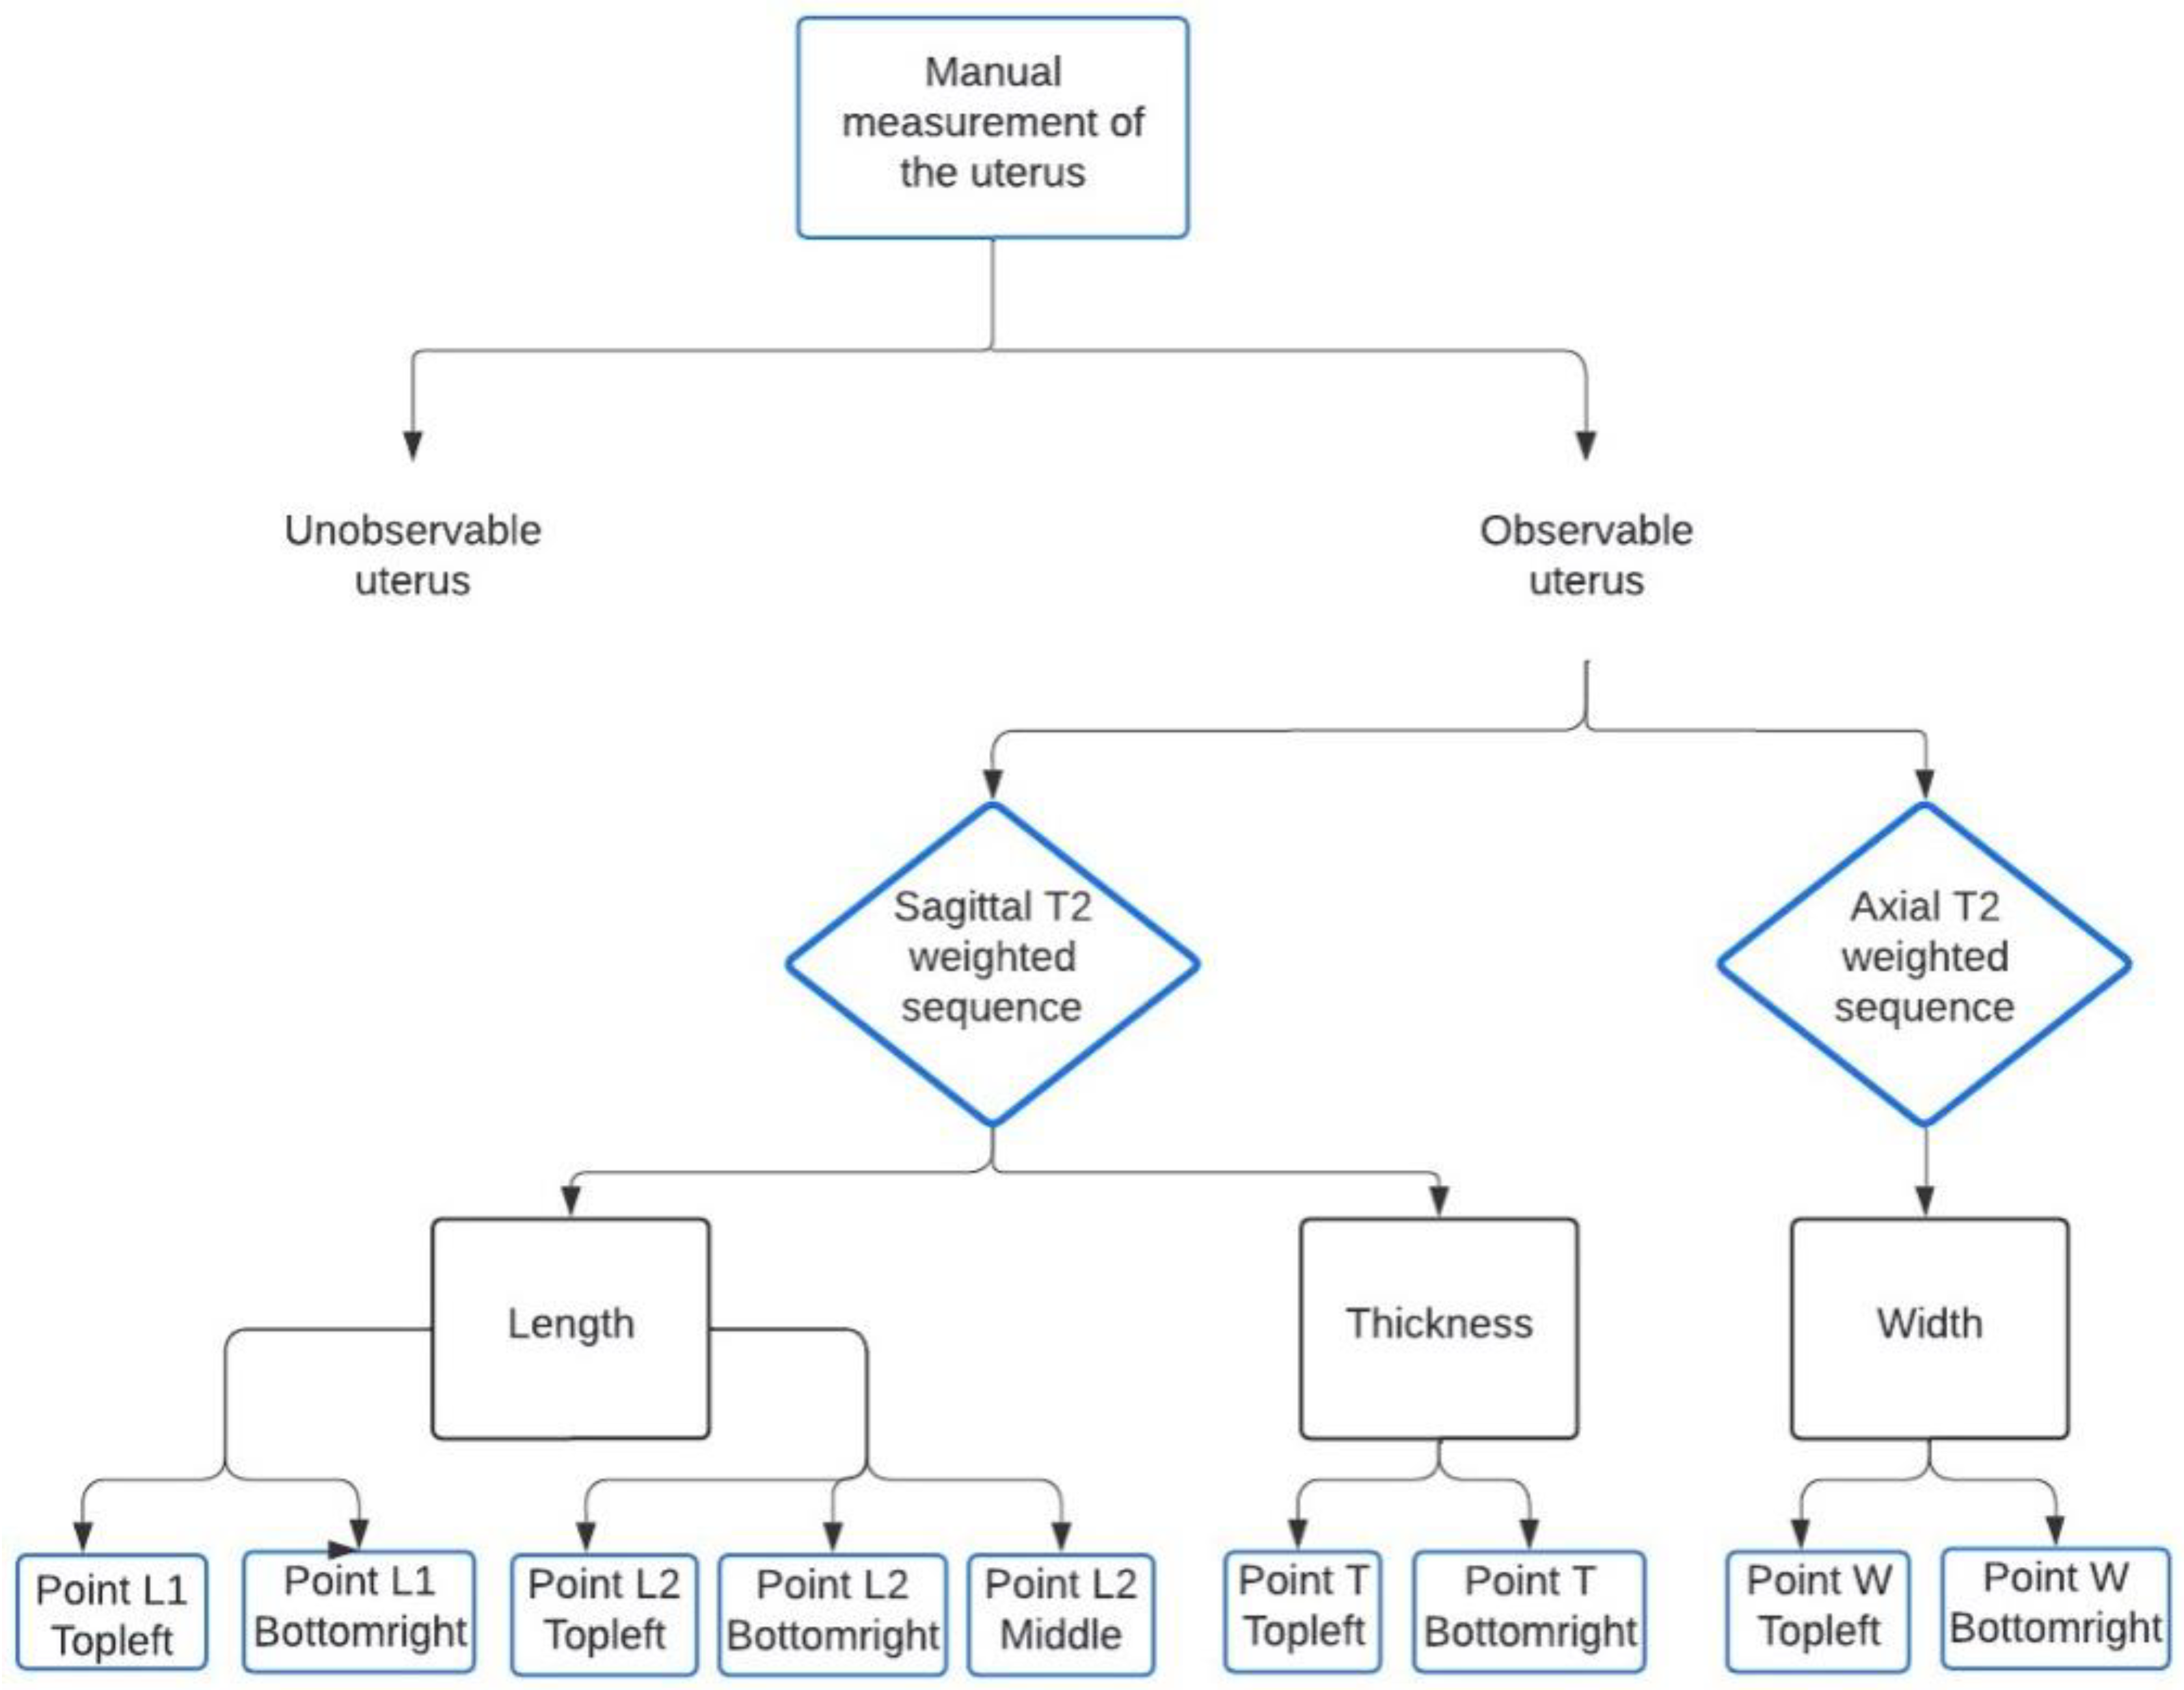
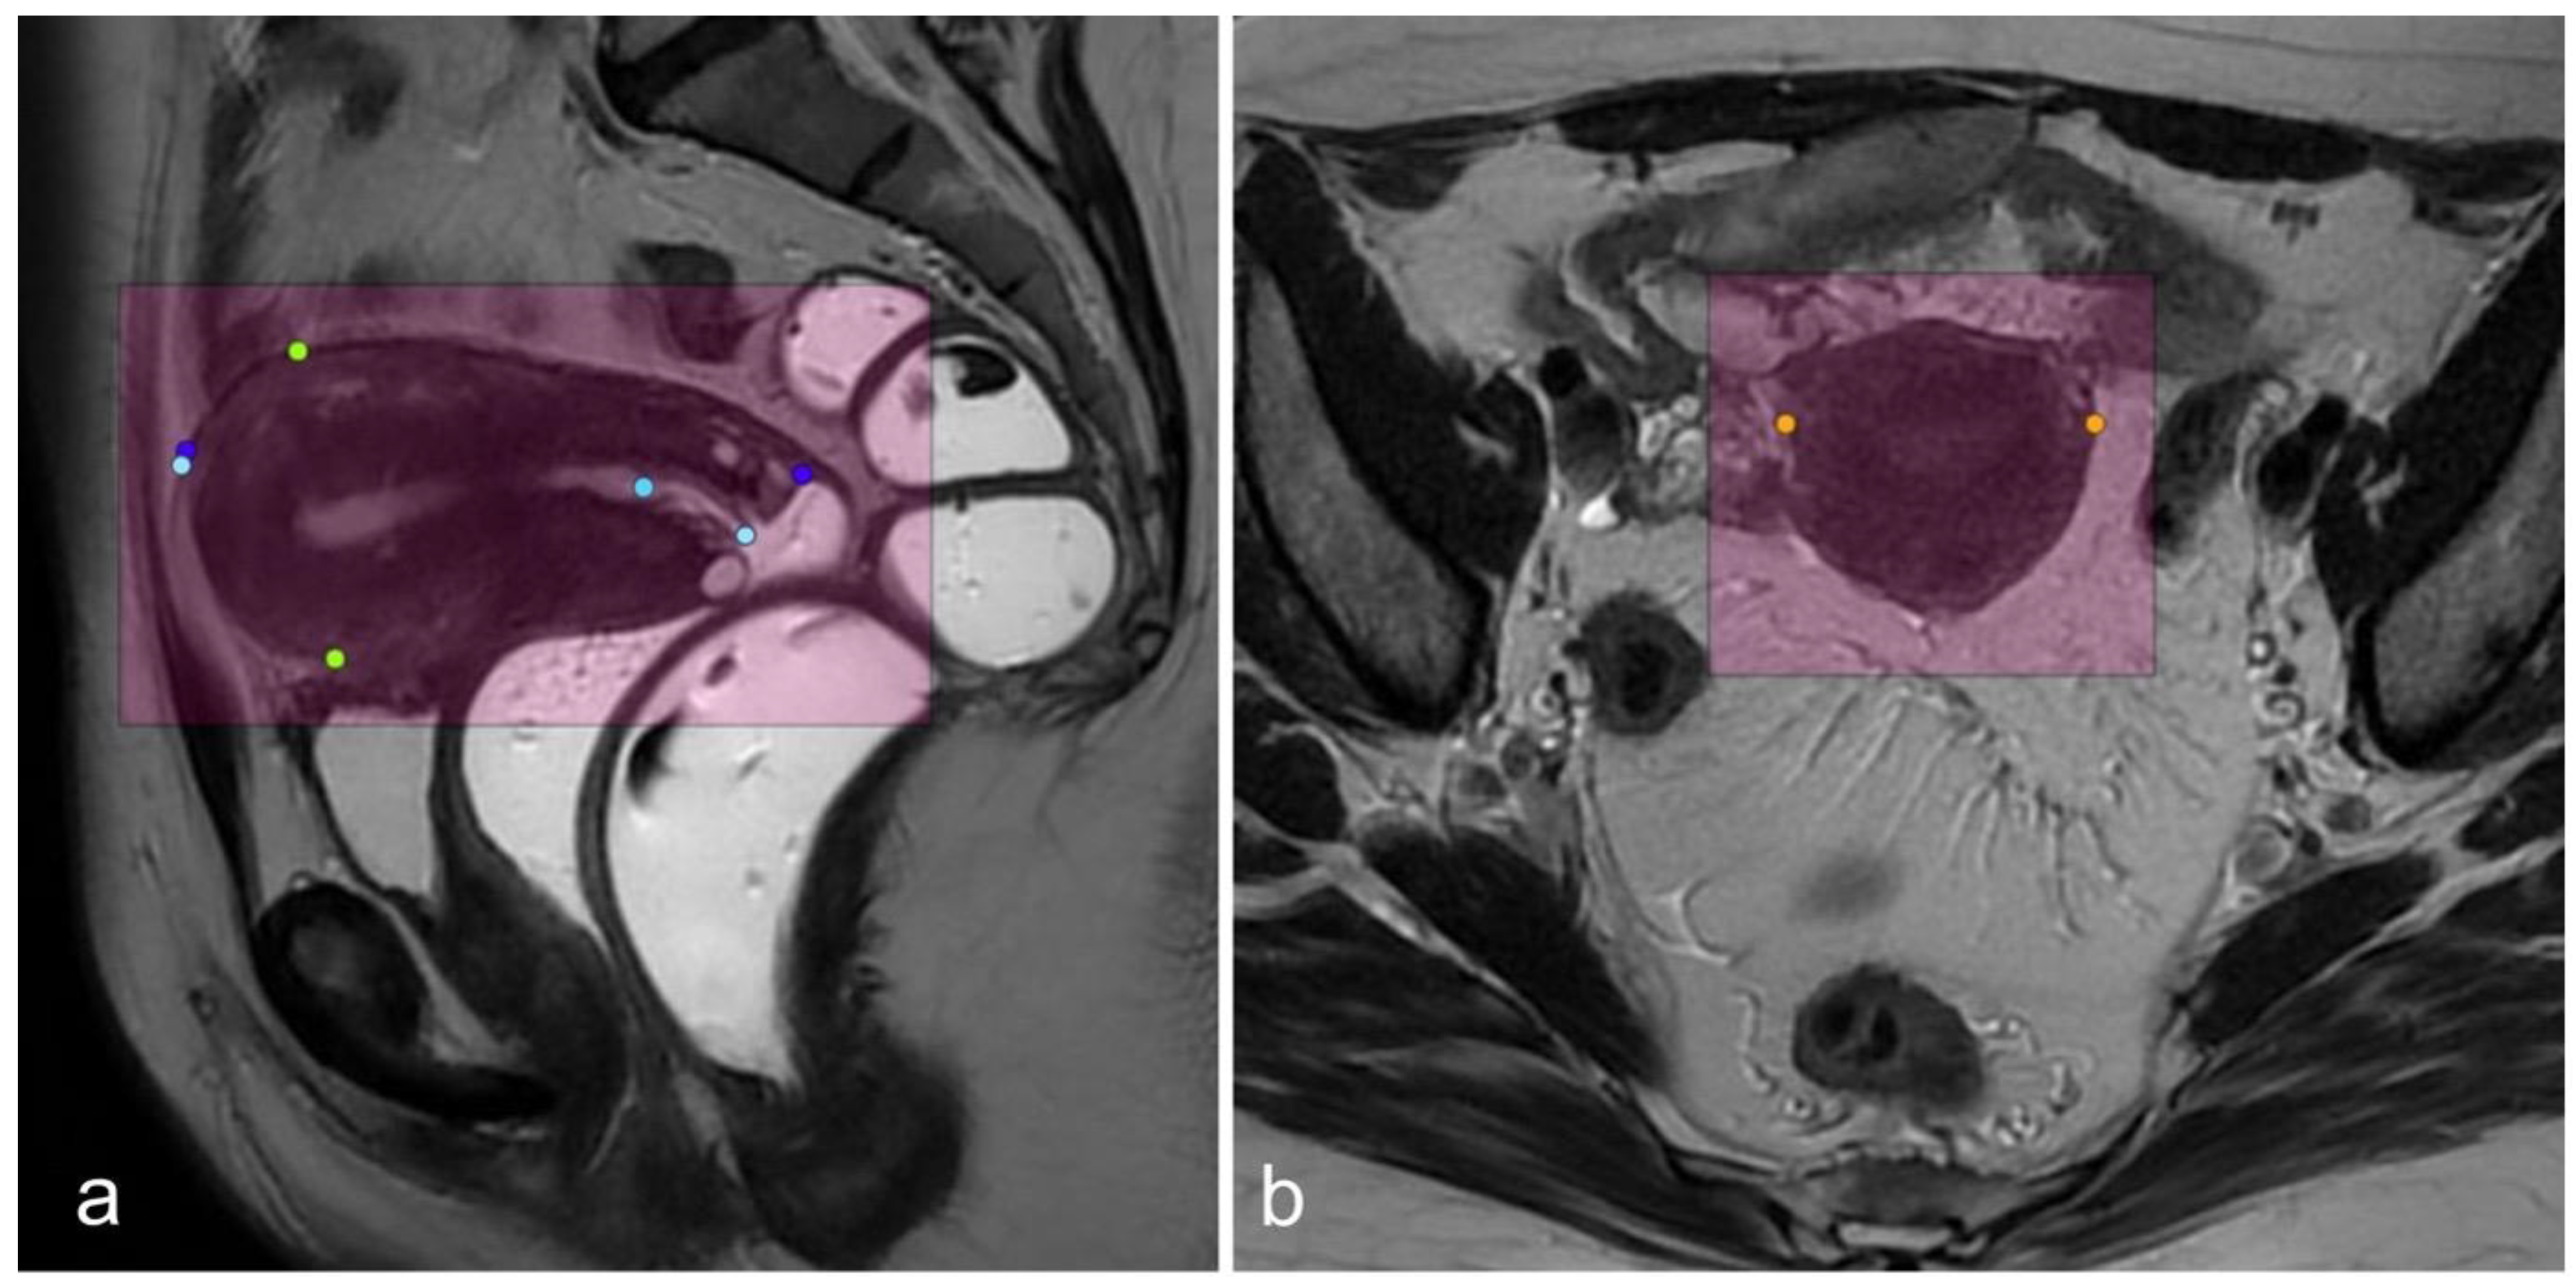
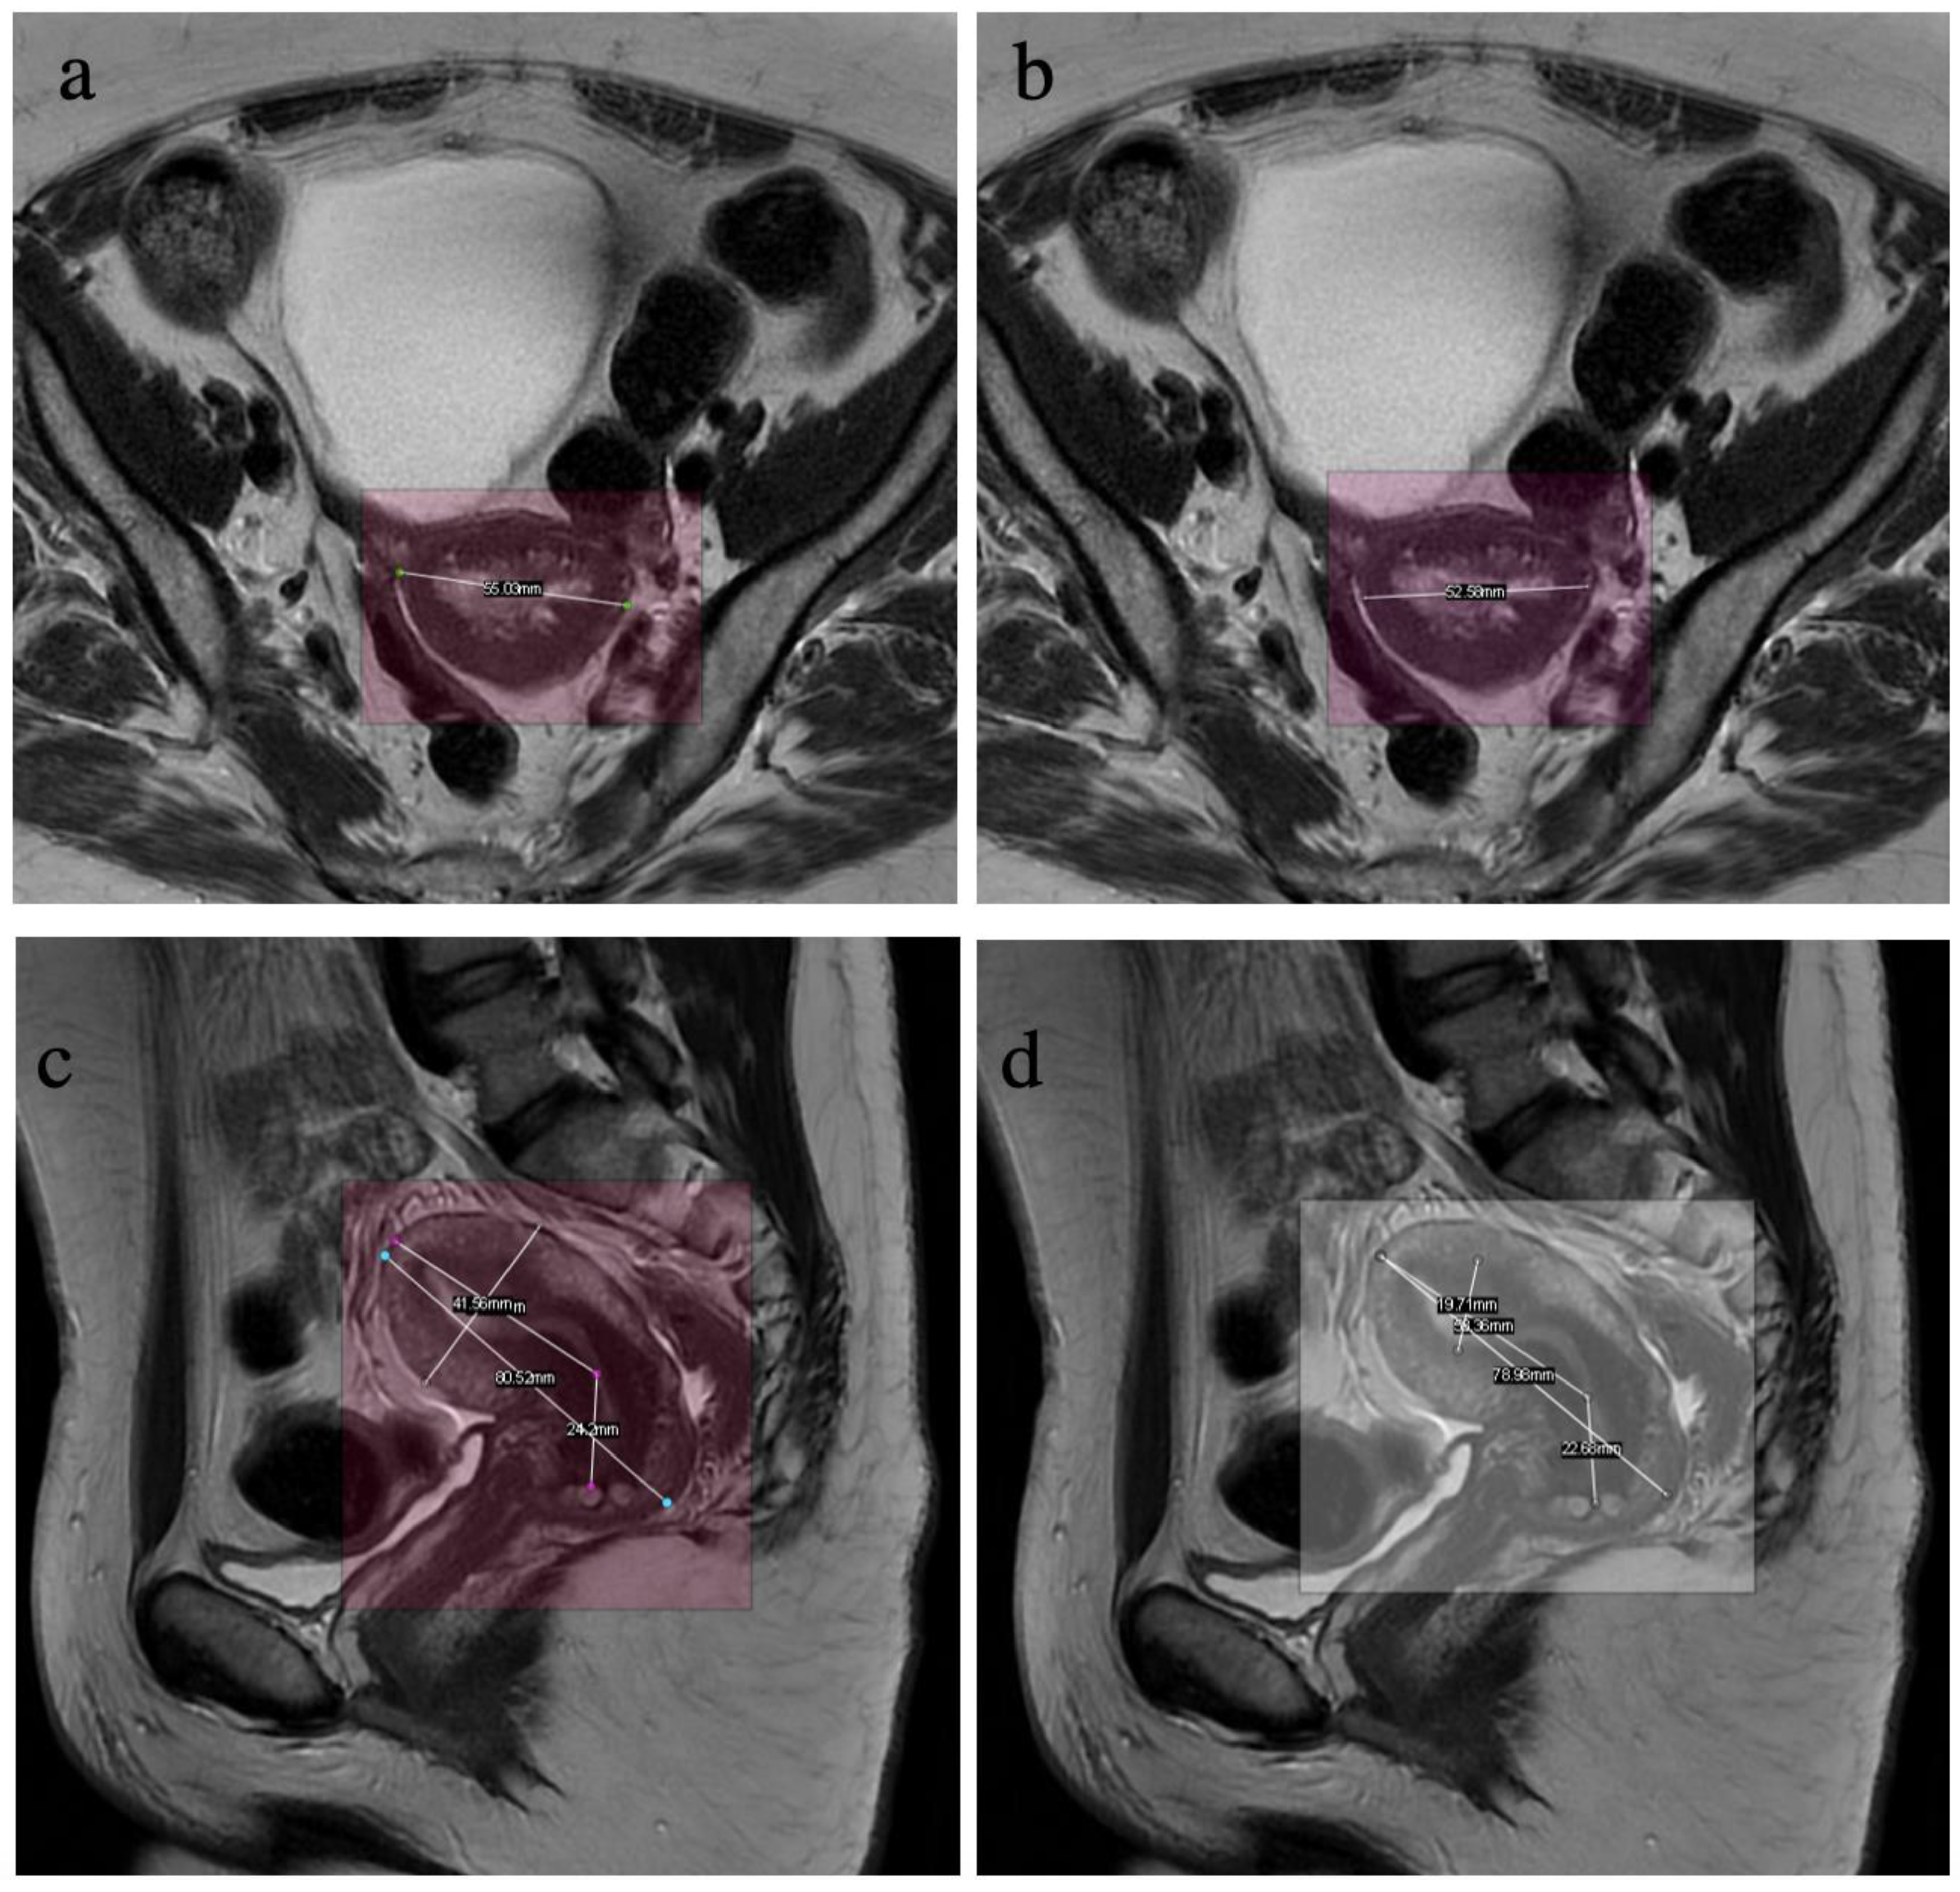
2.2. Data Labelling
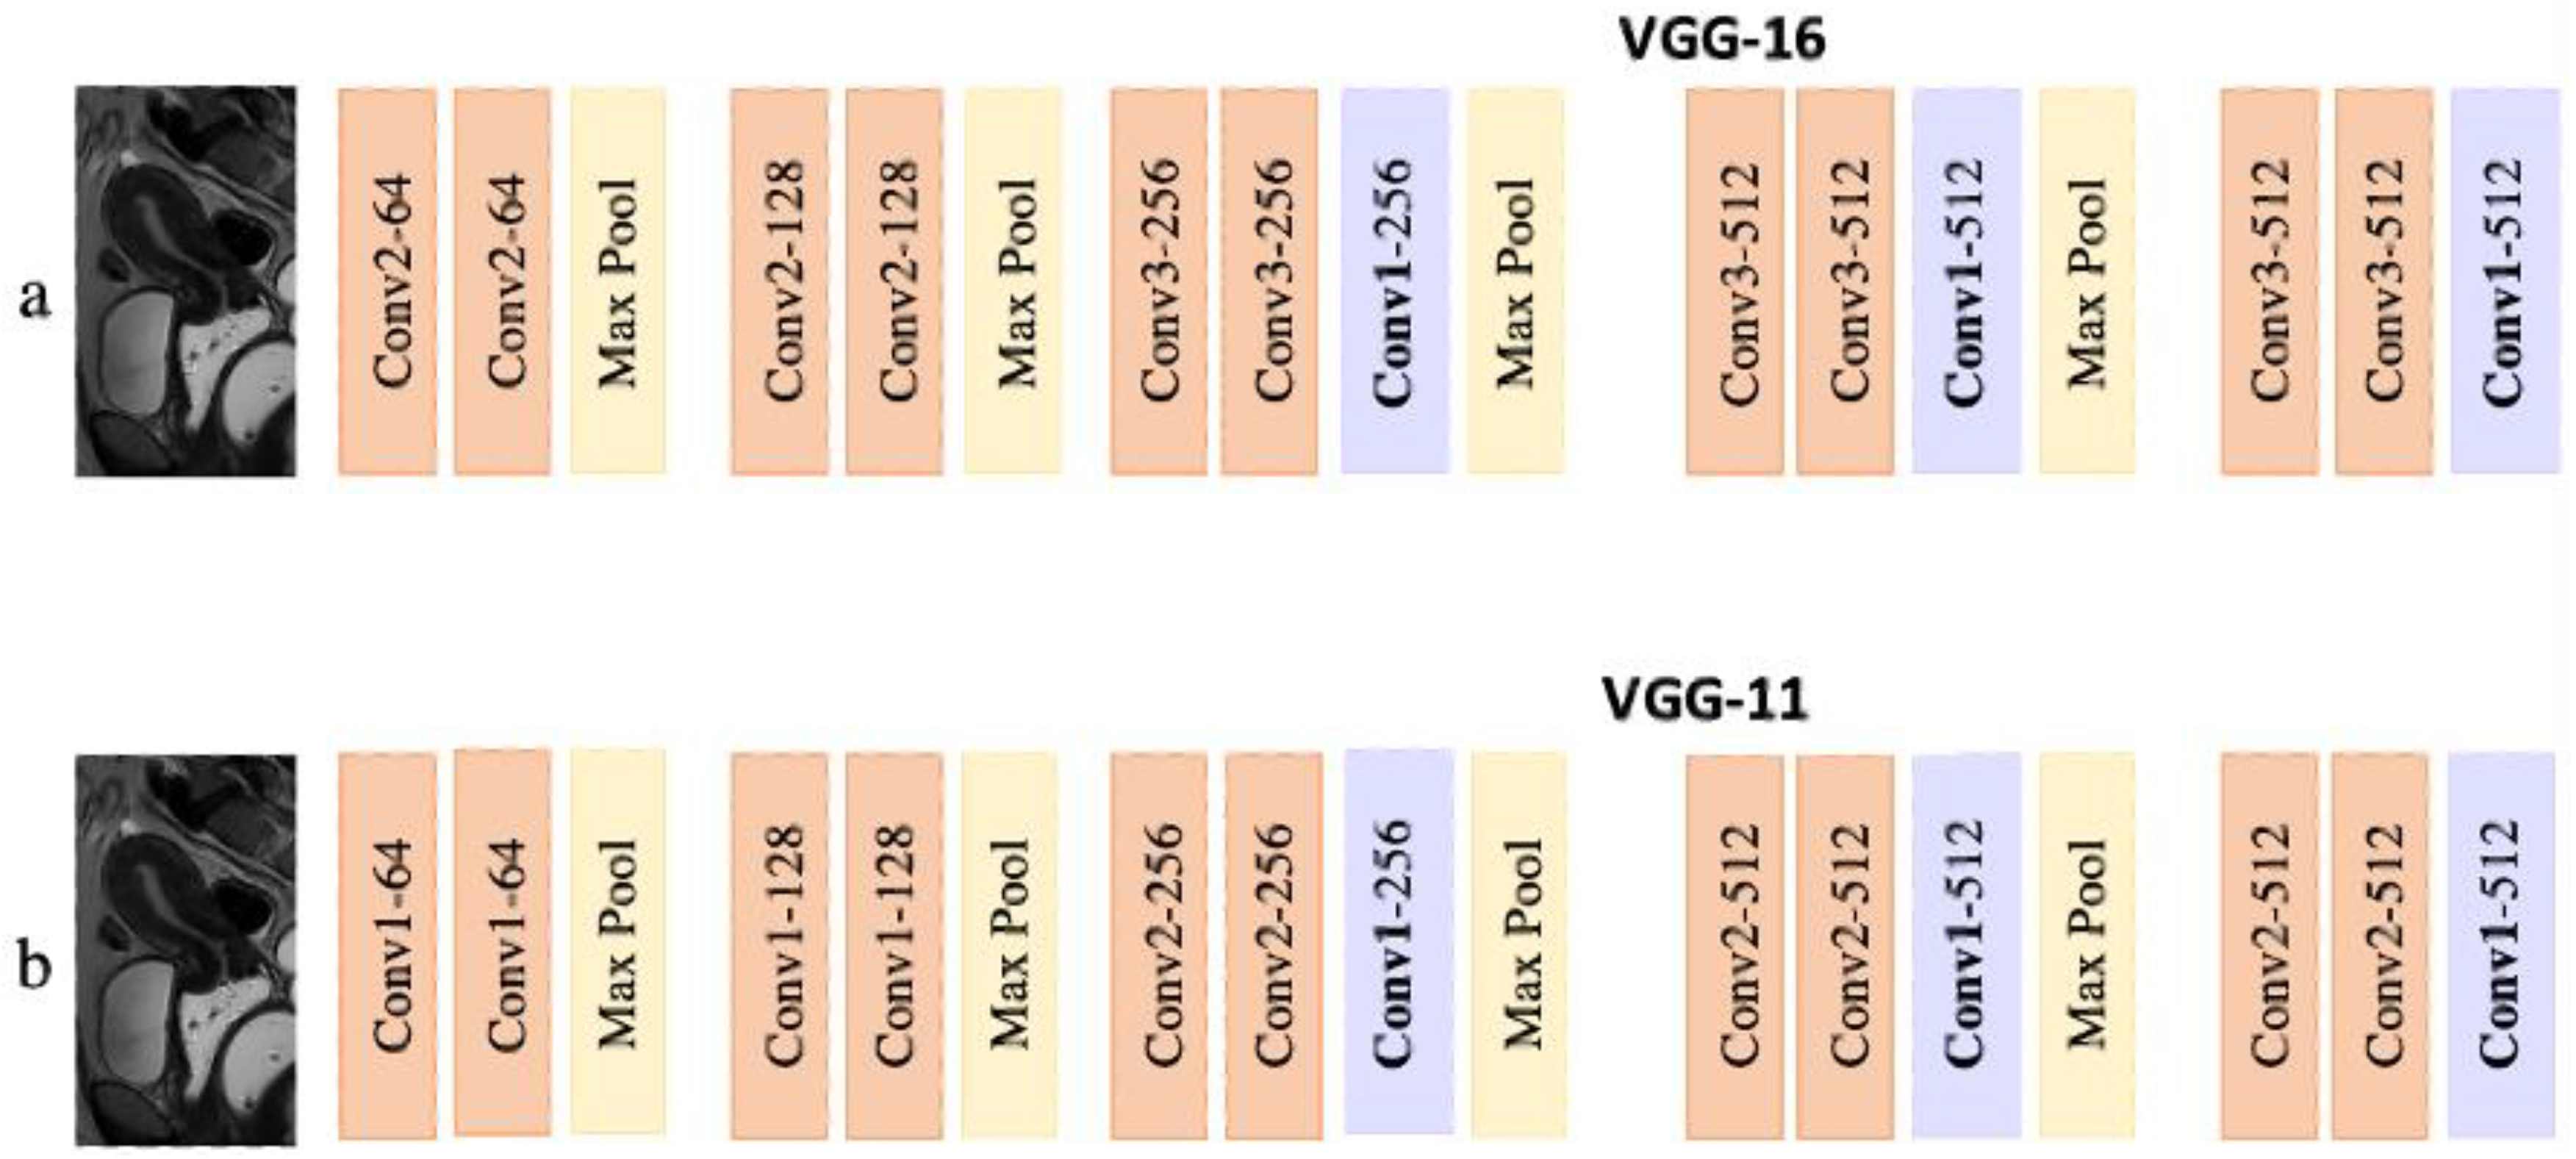
2.3. Model
- Encoder
- Decoder
2.4. Training
2.5. Statistics
2.5.1. Model Training
2.5.2. Model Testing
3. Results
3.1. Validation Performance (Initial Dataset)
3.2. Test Performance (External Dataset)
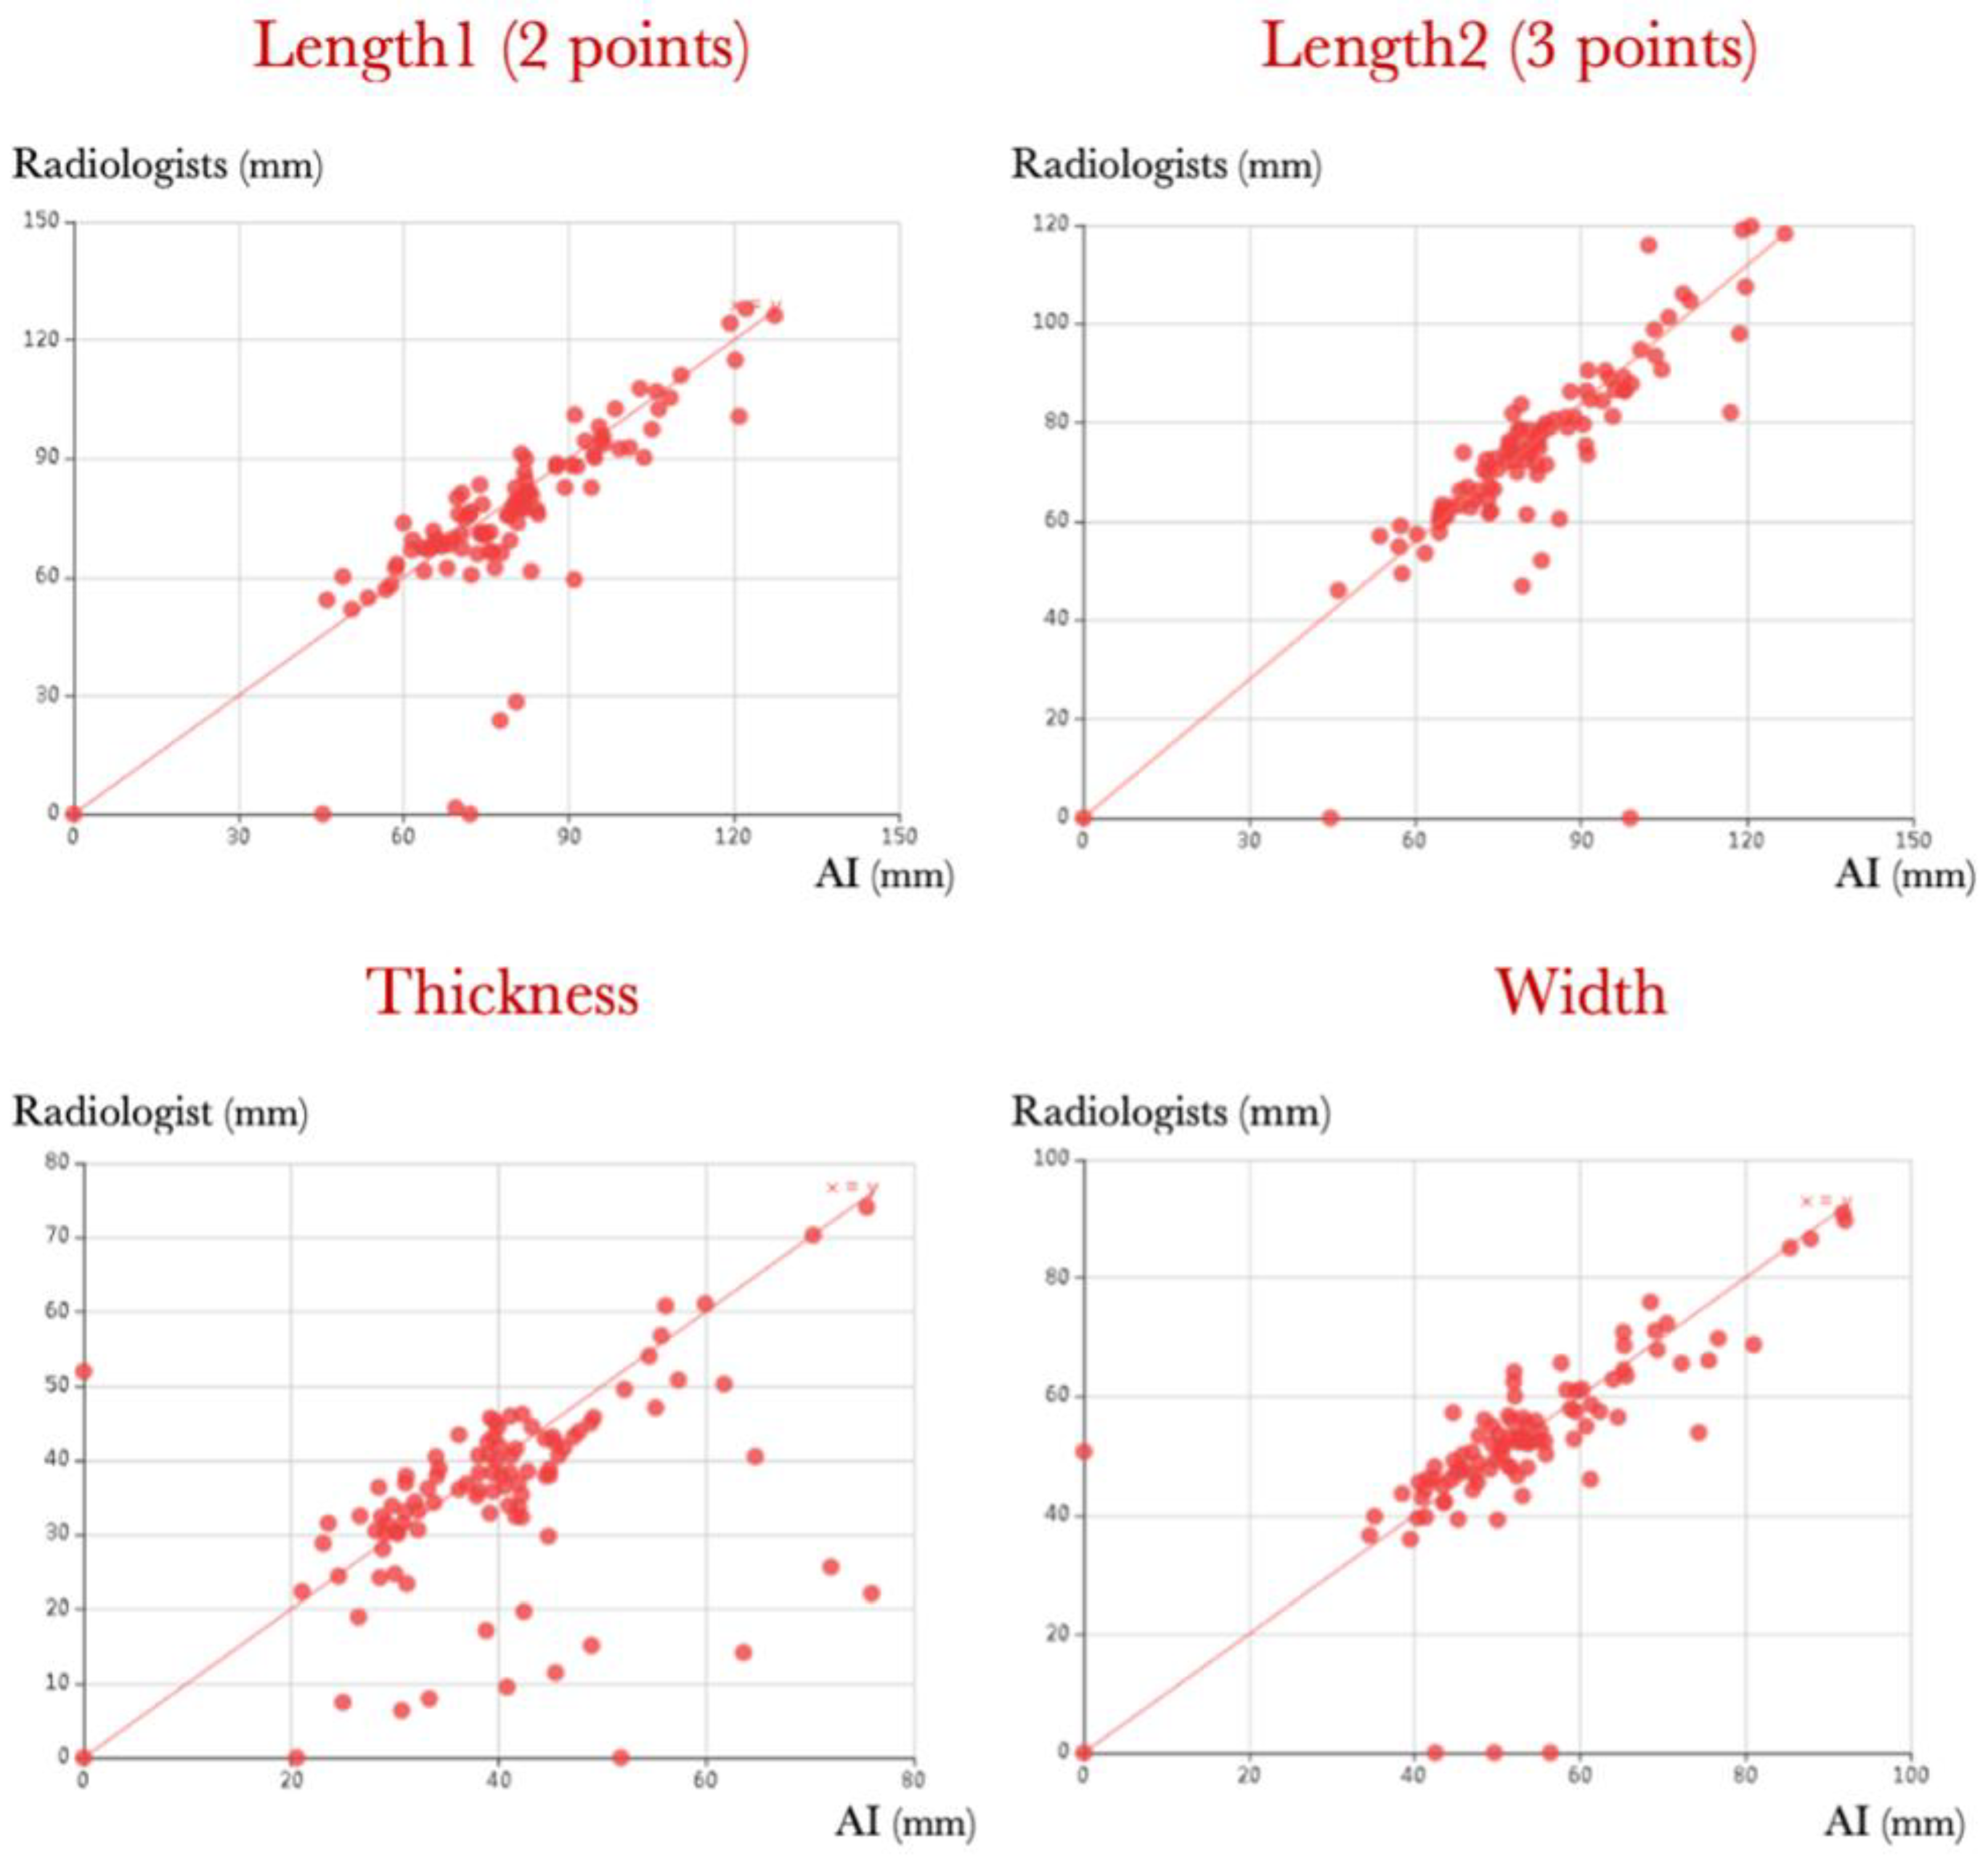
3.2.1. Correlation between Manual and Automated Measurements
3.2.2. Variability between Measurements by Radiologists
4. Discussion
5. Conclusions
Author Contributions
Funding
Institutional Review Board Statement
Informed Consent Statement
Data Availability Statement
Conflicts of Interest
Abbreviations
| AD | Average Deviation |
| AI | Artificial Intelligence |
| CNN | Convolutional Neural Network |
| DL | Deep Learning |
| DSC | Dice Similarity Coefficient |
| IoU | Intersection over Union |
| ML | Machine Learning |
| MR | Magnetic Resonance |
| OKS | Objective Key point Similarity |
| SD | Standard Deviation |
References
- Goldstuck, N. Assessment of uterine cavity size and shape: A systematic review addressing relevance to intrauterine procedures and events. Afr. J. Reprod. Health 2012, 16, 130–139. [Google Scholar]
- Bridges, N.A.; Cooke, A.; Healy, M.J.; Hindmarsh, P.C.; Brook, C.G. Growth of the uterus. Arch. Dis. Child. 1996, 75, 330–331. [Google Scholar] [CrossRef] [Green Version]
- Talarico, V.; Rodio, M.B.; Viscomi, A.; Galea, E.; Galati, M.C.; Raiola, G. The role of pelvic ultrasound for the diagnosis and management of central precocious puberty: An update. Acta Biomed. Atenei Parm. 2021, 92, e2021480. [Google Scholar]
- Trotman, G.E. Delayed puberty in the female patient. Curr. Opin. Obstet. Gynecol. 2016, 28, 366. [Google Scholar] [CrossRef]
- Adamou, H.; Amadou Magagi, I.; Oumarou Garba, S.; Habou, O. Acute intestinal obstruction due to extrinsic compression by previa myoma and ectopic pregnancy: A case report. J. Med. Case Rep. 2018, 12, 10. [Google Scholar] [CrossRef] [Green Version]
- Weisberg, E. Insertion of Intrauterine Devices. Med. J. 1980, 2, 359–362. [Google Scholar] [CrossRef]
- Chi, I.C.; Champion, C.B.; Wilkens, L.R. Cervical dilatation in interval insertion of an IUD Who requires it and does it lead to a high explulsion rate? Contraception 1987, 36, 403–415. [Google Scholar] [CrossRef] [PubMed]
- Taylor, S.M.; Romero, A.A.; Kammerer-Doak, D.N.; Qualls, C.; Rogers, R.G. Abdominal hysterectomy for the enlarged myomatous uterus compared with vaginal hysterectomy with morcellation. Am. J. Obstet. Gynecol. 2003, 189, 1579–1582. [Google Scholar] [PubMed]
- Iavazzo, C.; Salakos, N.; Bakalianou, K.; Vitoratos, N.; Vorgias, G.; Liapis, A. Thermal balloon endometrial ablation: A systematic review. Arch. Gynecol. Obstet. 2008, 277, 99–108. [Google Scholar] [CrossRef] [PubMed]
- Acsinte, O.M.; Rabischong, B.; Bourdel, N.; Canis, M.; Botchorishvili, R. Laparoscopic Promontofixation in 10 Steps. J. Minim. Invasive Gynecol. 2018, 25, 767. [Google Scholar] [CrossRef] [PubMed] [Green Version]
- Garfield, R.; Saade, G.; Buhimschi, C.; Buhimschi, I.; Shi, L.; Shi, S.; Chwalisz, K. Control and assessment of the uterus and cervix during pregnancy and labour. Hum. Reprod. Update 1998, 4, 673–695. [Google Scholar] [CrossRef] [PubMed] [Green Version]
- Kojita, Y.; Matsuo, H.; Kanda, T.; Nishio, M.; Sofue, K.; Nogami, M.; Kono, A.K.; Hori, M.; Murakami, T. Deep learning model for predicting gestational age after the first trimester using fetal MRI. Eur. Radiol. 2021, 31, 3775–3782. [Google Scholar] [PubMed]
- Egbase, P.E.; Al-Sharhan, M.; Grudzinskas, J.G. Influence of position and length of uterus on implantation and clinical pregnancy rates in IVF and embryo transfer treatment cycles. Hum. Reprod. 2000, 15, 1943–1946. [Google Scholar] [CrossRef] [Green Version]
- Ludwin, A.; Martins, W.P. Correct measurement of uterine fundal internal indentation depth and angle: An important but overlooked issue for precise diagnosis of uterine anomalies. Ultrasound Obstet. Gynecol. 2021, 58, 497–499. [Google Scholar] [CrossRef] [PubMed]
- Brouwer, C.L.; Steenbakkers, R.J.H.M.; van den Heuvel, E.; Duppen, J.C.; Navran, A.; Bijl, H.P.; Chouvalova, O.; Burlage, F.R.; Meertens, H.; Langendijk, J.A.; et al. 3D Variation in delineation of head and neck organs at risk. Radiat. Oncol. Lond. Engl. 2012, 7, 32. [Google Scholar] [CrossRef] [PubMed] [Green Version]
- Cardenas, C.E.; Yang, J.; Anderson, B.M.; Court, L.E.; Brock, K.B. Advances in Auto-Segmentation. Semin. Radiat. Oncol. 2019, 29, 185–197. [Google Scholar] [CrossRef]
- Kalantar, R.; Lin, G.; Winfield, J.M.; Messiou, C.; Lalondrelle, S.; Blackledge, M.D.; Koh, D.-M. Automatic Segmentation of Pelvic Cancers Using Deep Learning: State-of-the-Art Approaches and Challenges. Diagnostics 2021, 11, 1964. [Google Scholar] [CrossRef]
- Hosny, A.; Parmar, C.; Quackenbush, J.; Schwartz, L.H.; Aerts, H.J.W.L. Artificial intelligence in radiology. Nat. Rev. Cancer 2018, 18, 500–510. [Google Scholar] [CrossRef]
- Han, S.; Hwang, S.I.; Lee, H.J. The Classification of Renal Cancer in 3-Phase CT Images Using a Deep Learning Method. J. Digit. Imaging 2019, 32, 638–643. [Google Scholar] [CrossRef] [Green Version]
- Van Gastel, M.D.A.; Edwards, M.E.; Torres, V.E.; Erickson, B.J.; Gansevoort, R.T.; Kline, T.L. Automatic Measurement of Kidney and Liver Volumes from MR Images of Patients Affected by Autosomal Dominant Polycystic Kidney Disease. J. Am. Soc. Nephrol. JASN 2019, 30, 1514–1522. [Google Scholar] [CrossRef]
- Sforazzini, F.; Salome, P.; Moustafa, M.; Zhou, C.; Schwager, C.; Rein, K.; Bougatf, N.; Kudak, A.; Woodruff, H.; Dubois, L.; et al. Deep Learning–based Automatic Lung Segmentation on Multiresolution CT Scans from Healthy and Fibrotic Lungs in Mice. Radiol. Artif. Intell. 2022, 4, e210095. [Google Scholar] [CrossRef] [PubMed]
- Van Assen, M.; Muscogiuri, G.; Caruso, D.; Lee, S.J.; Laghi, A.; De Cecco, C.N. Artificial intelligence in cardiac radiology. Radiol. Med. (Torino) 2020, 125, 1186–1199. [Google Scholar] [CrossRef]
- Theis, M.; Tonguc, T.; Savchenko, O.; Nowak, S.; Block, W.; Recker, F.; Essler, M.; Mustea, A.; Attenberger, U.; Marinova, M.; et al. Deep learning enables automated MRI-based estimation of uterine volume also in patients with uterine fibroids undergoing high-intensity focused ultrasound therapy. Insights Imaging 2023, 14, 1. [Google Scholar] [CrossRef]
- Tsuboyama, T.; Onishi, H.; Nakamoto, A.; Ogawa, K.; Koyama, Y.; Tarewaki, H.; Tomiyama, N. Impact of Deep Learning Reconstruction Combined with a Sharpening Filter on Single-Shot Fast Spin-Echo T2-Weighted Magnetic Resonance Imaging of the Uterus. Investig. Radiol. 2022, 57, 379–386. [Google Scholar] [CrossRef] [PubMed]
- Kurata, Y.; Nishio, M.; Kido, A.; Fujimoto, K.; Yakami, M.; Isoda, H.; Togashi, K. Automatic segmentation of the uterus on MRI using a convolutional neural network. Comput. Biol. Med. 2019, 114, 103438. [Google Scholar] [CrossRef]
- Bhandary, S.; Kuhn, D.; Babaiee, Z.; Fechter, T.; Benndorf, M.; Zamboglou, C.; Grosu, R. Investigation and benchmarking of U-Nets on prostate segmentation tasks. Comput. Med. Imaging Graph. 2023, 107, 102241. [Google Scholar] [CrossRef] [PubMed]
- Thimansson, E.; Bengtsson, J.; Baubeta, E.; Engman, J.; Flondell-Sité, D.; Bjartell, A.; Zackrisson, S. Deep learning algorithm performs similarly to radiologists in the assessment of prostate volume on MRI. Eur. Radiol. 2023, 33, 2519–2528. [Google Scholar] [CrossRef] [PubMed]
- Ushinsky, A.; Bardis, M.; Glavis-Bloom, J.; Uchio, E.; Chantaduly, C.; Nguyentat, M.; Houshyar, R. A 3D-2D Hybrid U-Net Convolutional Neural Network Approach to Prostate Organ Segmentation of Multiparametric MRI. Am. J. Roentgenol. 2021, 216, 111–116. [Google Scholar] [CrossRef]
- Krithika alias AnbuDevi, M.; Suganthi, K. Review of Semantic Segmentation of Medical Images Using Modified Architectures of UNET. Diagnostics 2022, 12, 3064. [Google Scholar] [CrossRef]
- Gifford, R.; Jhawar, S.R.; Krening, S. Deep Learning Architecture to Improve Edge Accuracy of Auto-Contouring for Head and Neck Radiotherapy. Diagnostics 2023, 13, 2159. [Google Scholar] [CrossRef]


| MRI | General Electric 1.5 T, SIGNA Artist, 2021 | General Electric 1.5 T, SIGNA Artist, 2020 | General Electric 3 T, SIGNA Premier, 2019 | ||||
|---|---|---|---|---|---|---|---|
| Parameters | |||||||
| Plane | Sagittal | Axial | Sagittal | Axial | Sagittal | Axial | |
| TE (ms) | 100–120 | 100–120 | 115–120 | ||||
| TR (ms) | 5000–1100 | 4000–10,000 | 4000–13,000 | ||||
| Number of excitations (Nex) | 2 | 2 | 1.5 | 2 | |||
| Field of view (mm) | (393 × 260)– (408 × 220) | 363 × 240 | 393 × 260 | (360–240)– (410 × 270) | 332 × 220 | ||
| Frequency (Hz) | 41.67 | 41.67 | 50 | ||||
| Slice thickness (mm) | 3.5–4.0 | 3.5–4.0 | 3.0–3.5 | ||||
| Interslice gap (mm) | 3.5 | 3.5 | 0.5–3.0 | ||||
| Training and Validation Set (n = 800) | Test Set (n = 100) | |
|---|---|---|
| Age (mediane (interquartiles)) | 45 (33–58) | 47 (34–56) |
| Gel vaginal markup | ||
| No | 436 (65%) | 60 (60%) |
| Yes | 364 (45%) | 40 (40%) |
| Uterus position | ||
| Anteflexed | 704 (88%) | 93 (93%) |
| Retroflexed | 96 (12%) | 7 (7%) |
| MRI without pelvic pathology | 177 (22%) | 26 (26%) |
| Subperitoneal endometriosis | 123 (15%) | 13 (13%) |
| Adenomyosis | 116 (14%) | 12 (12%) |
| Myomas (FIGO 0—V) | 124 (15%) | 19 (19%) |
| Cervical cancer | 23 (3%) | 2 (2%) |
| Endometrial pathology | 75 (9%) | 10 (10%) |
| Ovarian pathology | 165 (21%) | 16 (16%) |
| Hysterectomy | 50 (6%) | - |
| Uterine malformation | 7 (0.9%) | 1 (1%) |
| Other (static disorder, no-gynaecological pathology…) | 82 (10%) | 13 (13%) |
| Key Point | Length2 Top left (L1) | Length2 Bottom right (L2) | Length2 Middle (L3) | Length1 Top left (L4) | Length2 Bottom right (L5) | Width Top left (W1) | Width Bottom right (W2) | Thickness Top left (T1) | Thickness Bottom right (T2) | Average (av) |
|---|---|---|---|---|---|---|---|---|---|---|
| OKS | 0.92 | 0.90 | 0.94 | 0.90 | 0.90 | 0.94 | 0.93 | 0.92 | 0.93 | 0.92 |
| Key point | Length2 Top left (L1) | Length2 Bottom right (L2) | Length2 Middle (L3) | Length1 Top left (L4) | Length1 Bottom right (L5) |
| GR | 0.96 | 0.96 | 0.98 | 0.95 | 0.95 |
| ED | 0.97 | 0.97 | 0.98 | 0.96 | 0.95 |
| LD | 0.96 | 0.96 | 0.97 | 0.97 | 0.96 |
| BH | 096 | 0.96 | 0.97 | 0.96 | 0.95 |
| AI | 0.95 | 0.95 | 0.97 | 0.96 | 0.95 |
| Key point | Width Top left (W1) | Width Bottom right (W2) | Thickness Top left (T1) | Thickness Bottom right (T2) | Average (av) |
| GR | 0.99 | 0.98 | 0.94 | 0.94 | 0.96 |
| ED | 0.99 | 0.98 | 0.95 | 0.95 | 0.97 |
| LD | 0.99 | 0.98 | 0.95 | 0.95 | 0.97 |
| BH | 0.98 | 0.97 | 0.95 | 0.95 | 0.96 |
| AI | 0.97 | 0.98 | 0.95 | 0.94 | 0.96 |
| Minimum (mm) | Maximum (mm) | Median (mm) | Average (mm) | Standard Deviation (SD) | ||||||
|---|---|---|---|---|---|---|---|---|---|---|
| Ground Truth | AI | Ground Truth | AI | Ground Truth | AI | Ground Truth | AI | Ground Truth | AI | |
| Length 1 (2 points) | 44.73 | 1.59 | 123.19 | 127.94 | 76.46 | 76.93 | 79.95 | 78.09 | 17.13 | 19.28 |
| Length 2 (3 points) | 42.14 | 46.04 | 123.96 | 119.75 | 77.23 | 74.69 | 79.43 | 76.19 | 16.43 | 15.46 |
| Thickness | 19.78 | 6.3 | 73.56 | 74.08 | 39.23 | 36.90 | 39.89 | 36.23 | 11.13 | 11.95 |
| Width | 32.16 | 35.95 | 93.65 | 90.98 | 52.72 | 52.58 | 54.42 | 54.60 | 12.35 | 11.06 |
| Measures | Length2 | Length2 | Width | Thickness |
|---|---|---|---|---|
| EP | 2.11 | 1.37 | 0.97 | 0.93 |
| LD | 2.12 | 1.2 | 1.12 | 0.92 |
| BH | 2.23 | 1.42 | 1.31 | 1.08 |
| GR | 2.36 | 1.11 | 1.15 | 0.8 |
| Average | 2.2 | 1.27 | 1.14 | 0.93 |
Disclaimer/Publisher’s Note: The statements, opinions and data contained in all publications are solely those of the individual author(s) and contributor(s) and not of MDPI and/or the editor(s). MDPI and/or the editor(s) disclaim responsibility for any injury to people or property resulting from any ideas, methods, instructions or products referred to in the content. |
© 2023 by the authors. Licensee MDPI, Basel, Switzerland. This article is an open access article distributed under the terms and conditions of the Creative Commons Attribution (CC BY) license (https://creativecommons.org/licenses/by/4.0/).
Share and Cite
Mulliez, D.; Poncelet, E.; Ferret, L.; Hoeffel, C.; Hamet, B.; Dang, L.A.; Laurent, N.; Ramette, G. Three-Dimensional Measurement of the Uterus on Magnetic Resonance Images: Development and Performance Analysis of an Automated Deep-Learning Tool. Diagnostics 2023, 13, 2662. https://doi.org/10.3390/diagnostics13162662
Mulliez D, Poncelet E, Ferret L, Hoeffel C, Hamet B, Dang LA, Laurent N, Ramette G. Three-Dimensional Measurement of the Uterus on Magnetic Resonance Images: Development and Performance Analysis of an Automated Deep-Learning Tool. Diagnostics. 2023; 13(16):2662. https://doi.org/10.3390/diagnostics13162662
Chicago/Turabian StyleMulliez, Daphné, Edouard Poncelet, Laurie Ferret, Christine Hoeffel, Blandine Hamet, Lan Anh Dang, Nicolas Laurent, and Guillaume Ramette. 2023. "Three-Dimensional Measurement of the Uterus on Magnetic Resonance Images: Development and Performance Analysis of an Automated Deep-Learning Tool" Diagnostics 13, no. 16: 2662. https://doi.org/10.3390/diagnostics13162662