
The Application of Deep Learning for the Segmentation and Classification of Coronary Arteries


Abstract
:1. Introduction
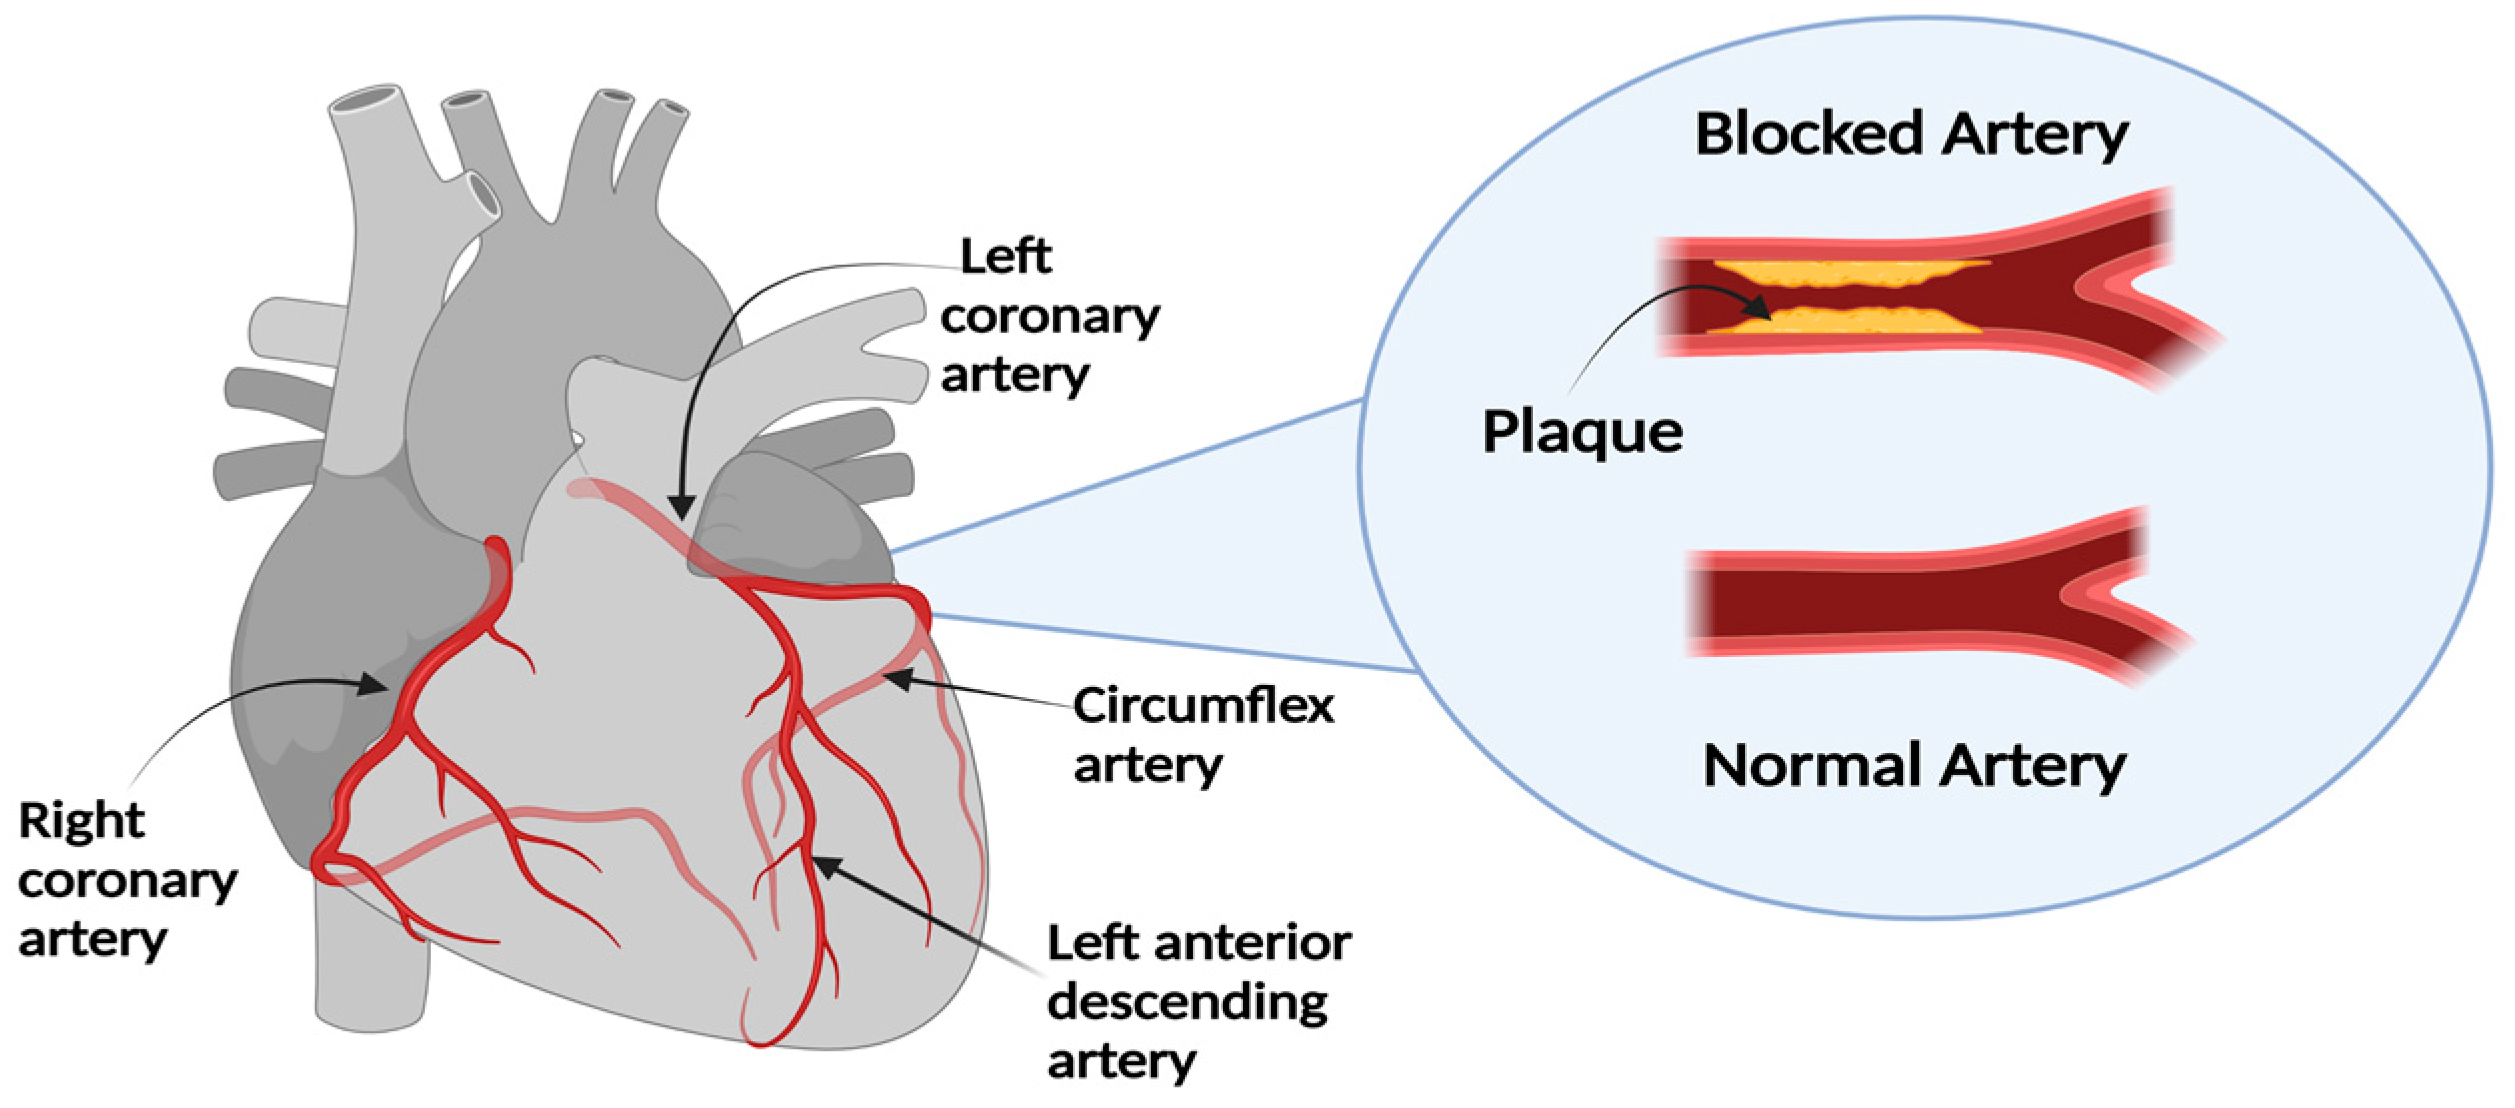
1.1. Diagnosis and Treatment of CAD
1.2. Challenges
1.3. Contribution
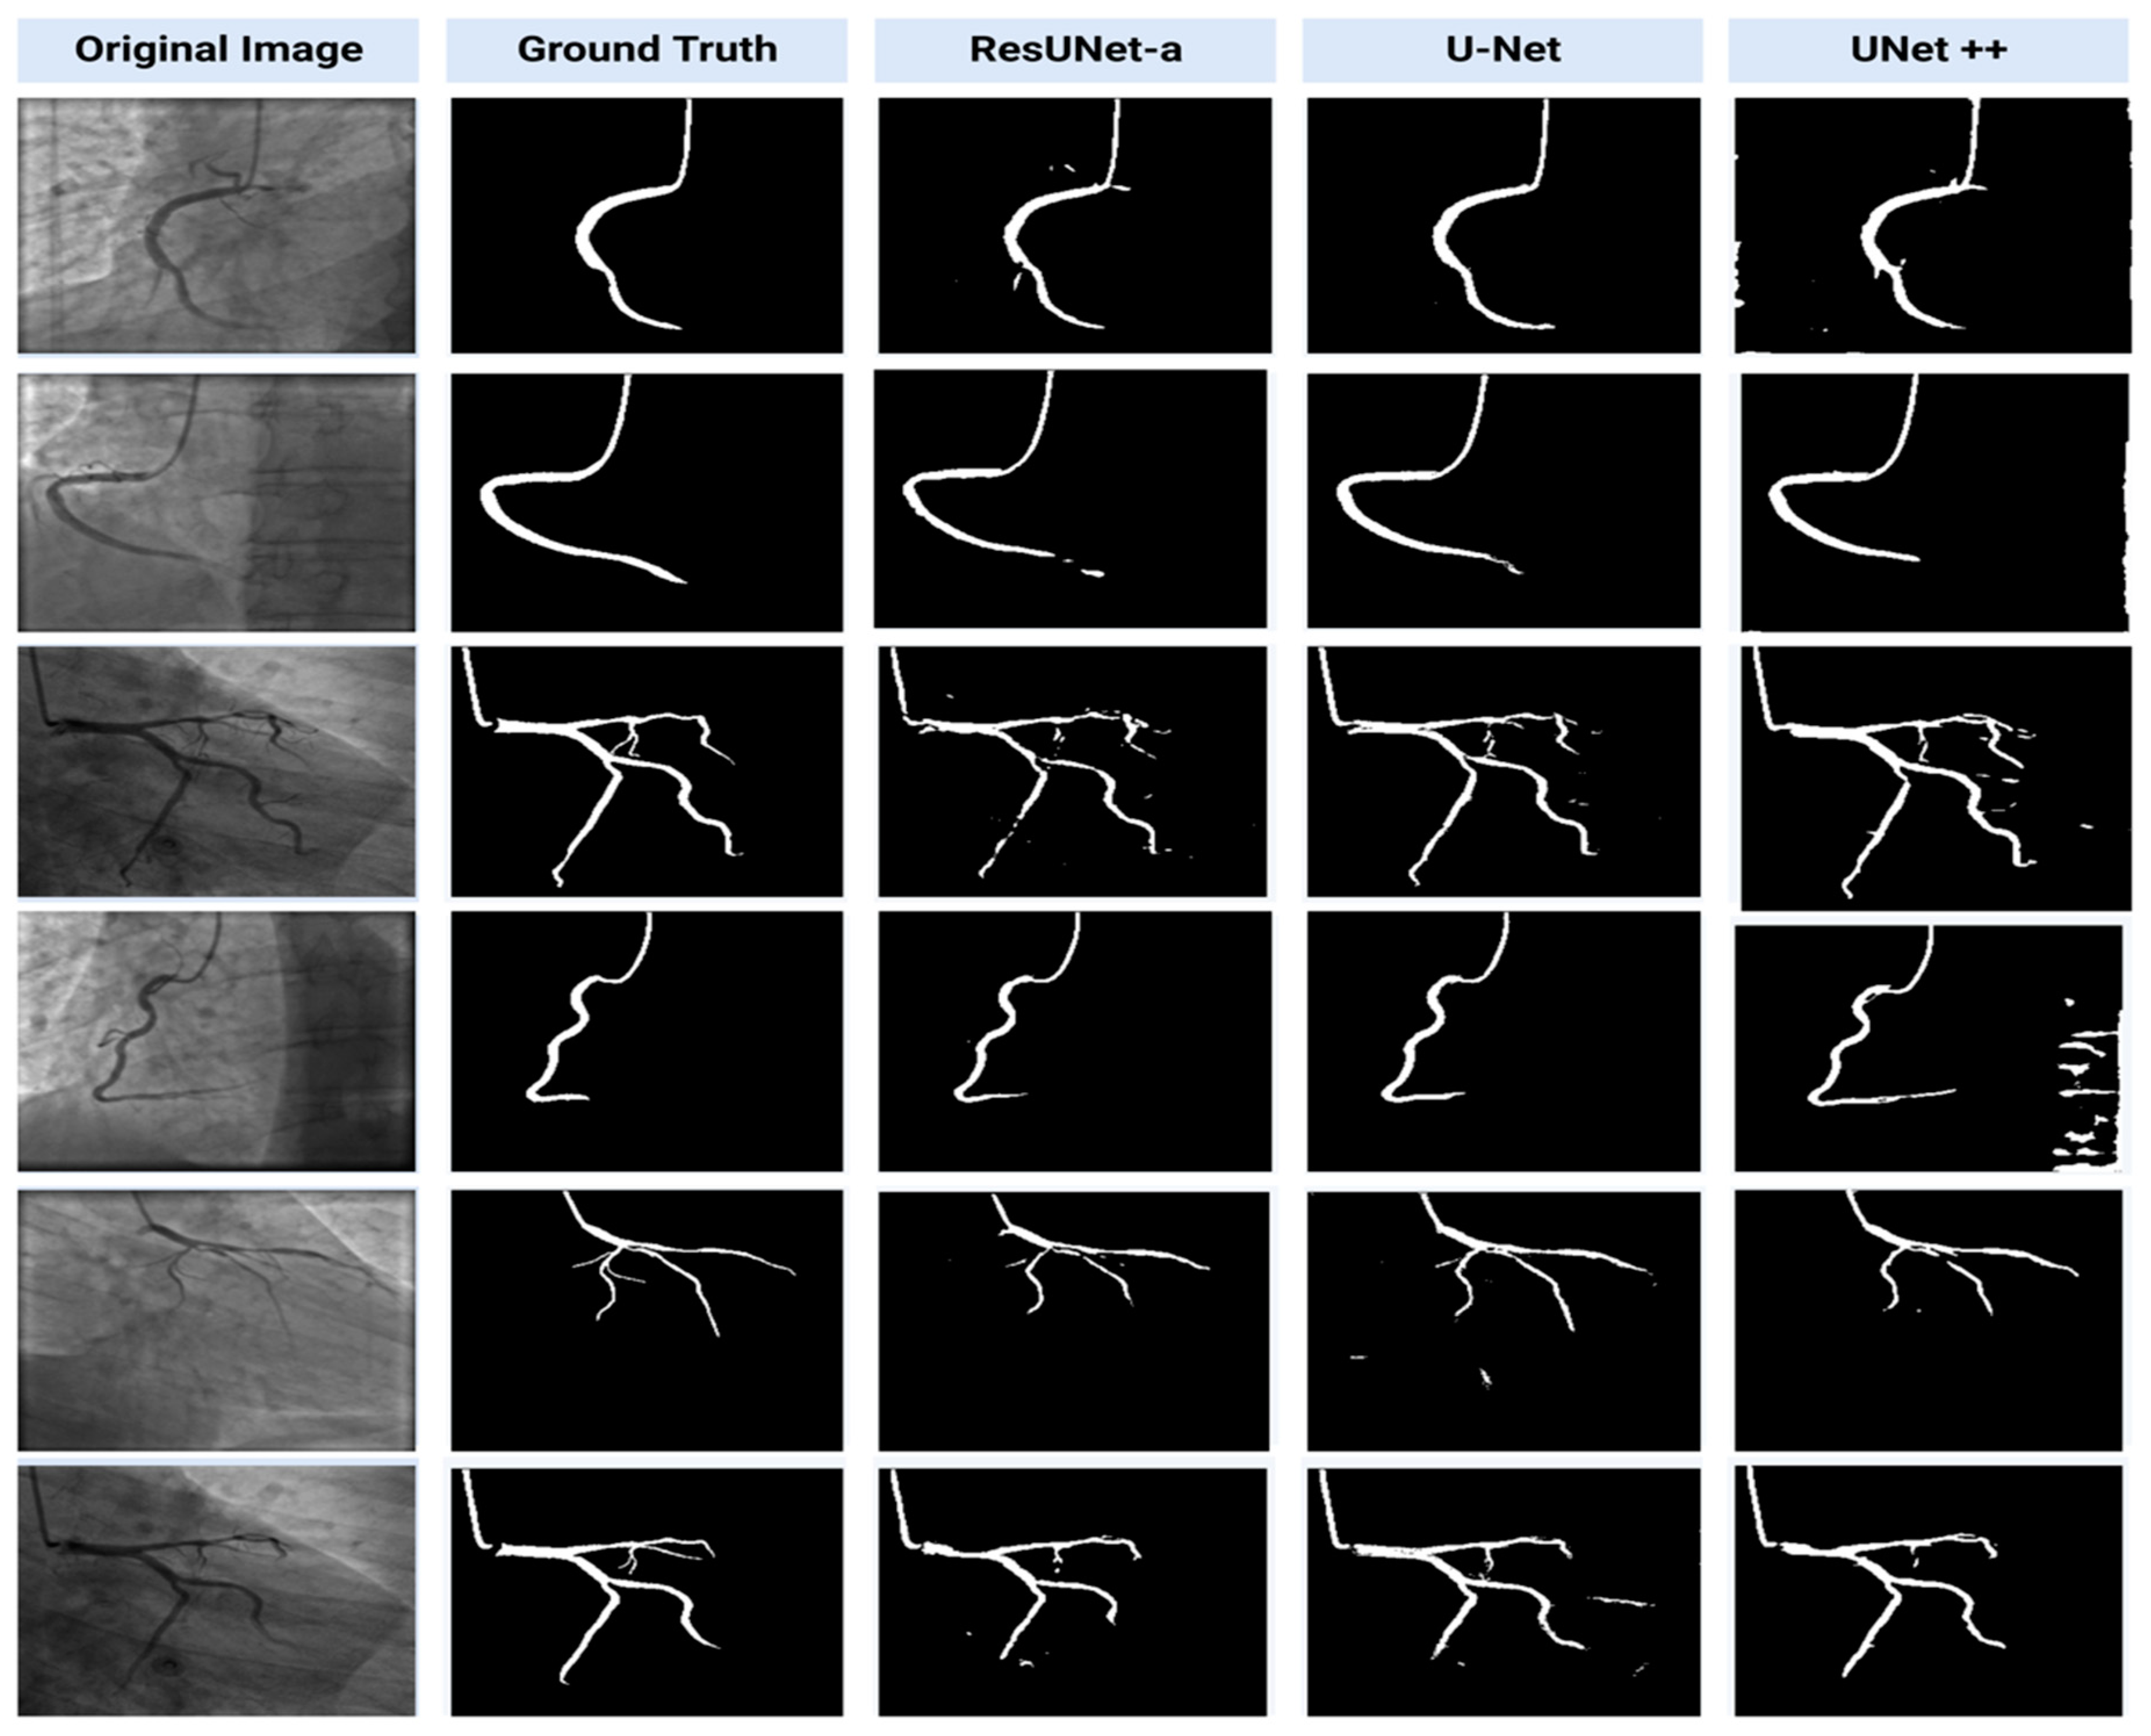
- The application of UNet, Unet++ and ResUNet-a for the automatic segmentation of coronary angiograms.
- Comparison of model’s performances for both segmentation and classification tasks.
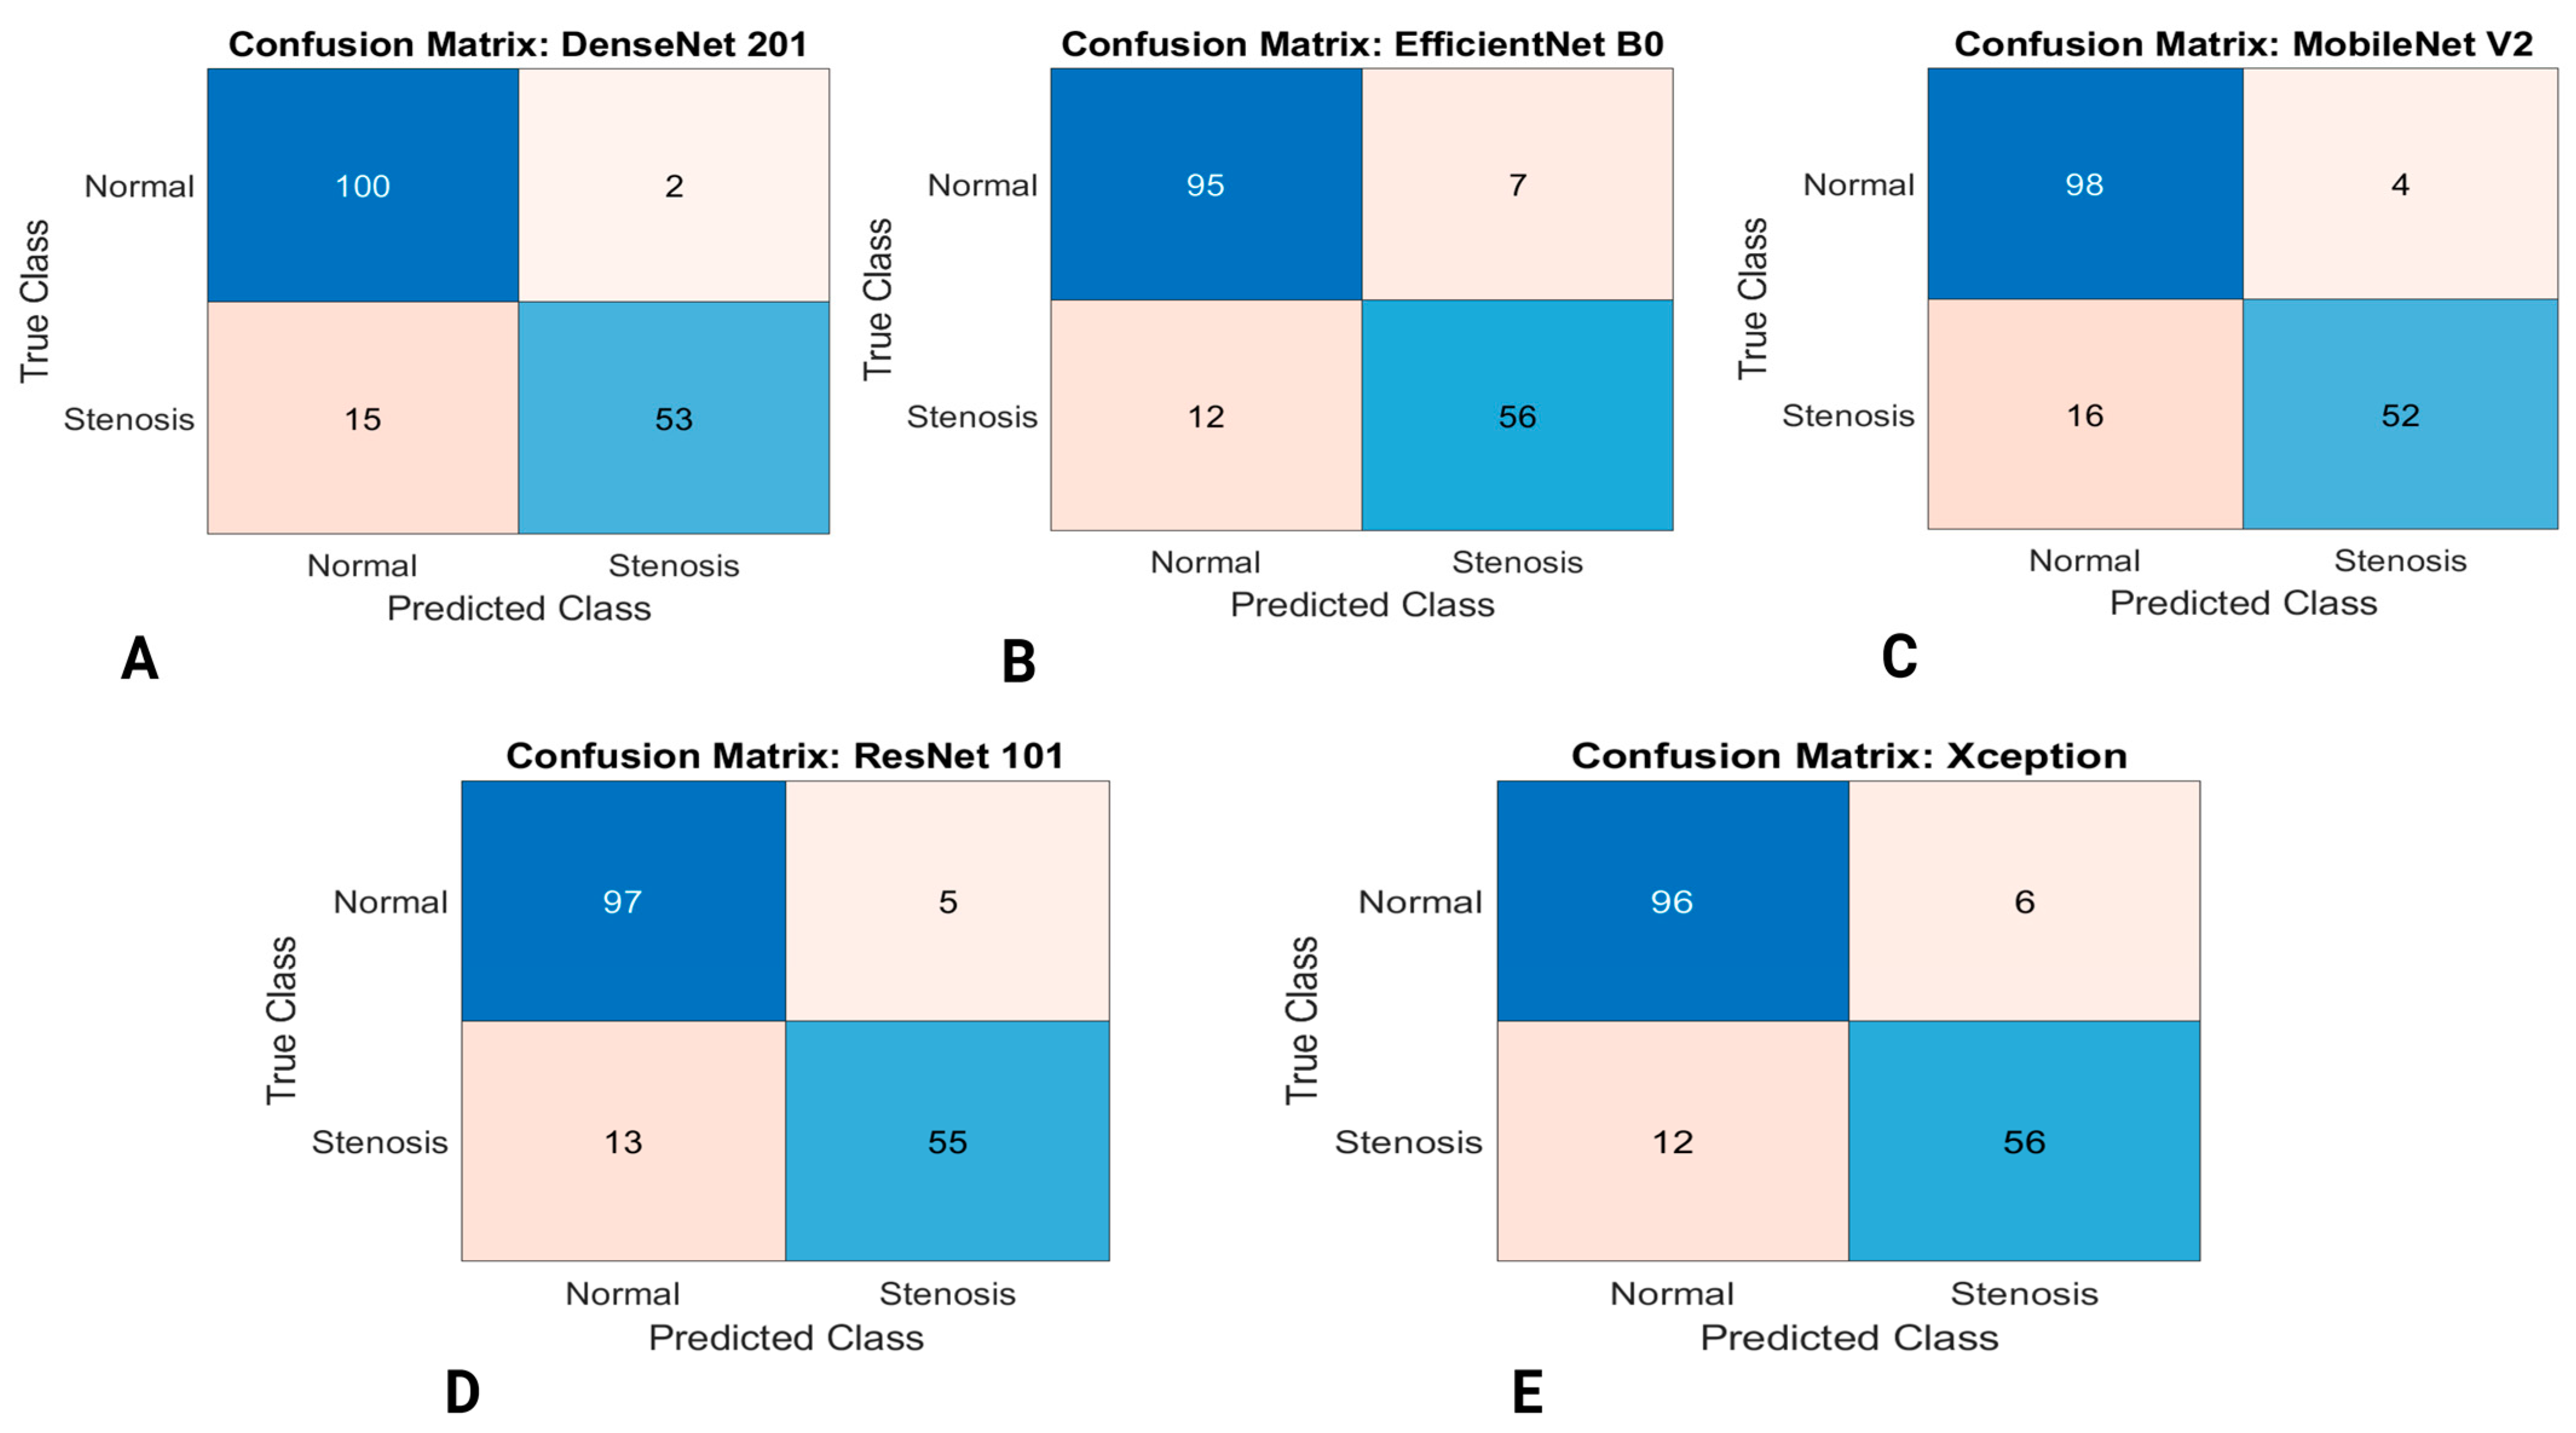
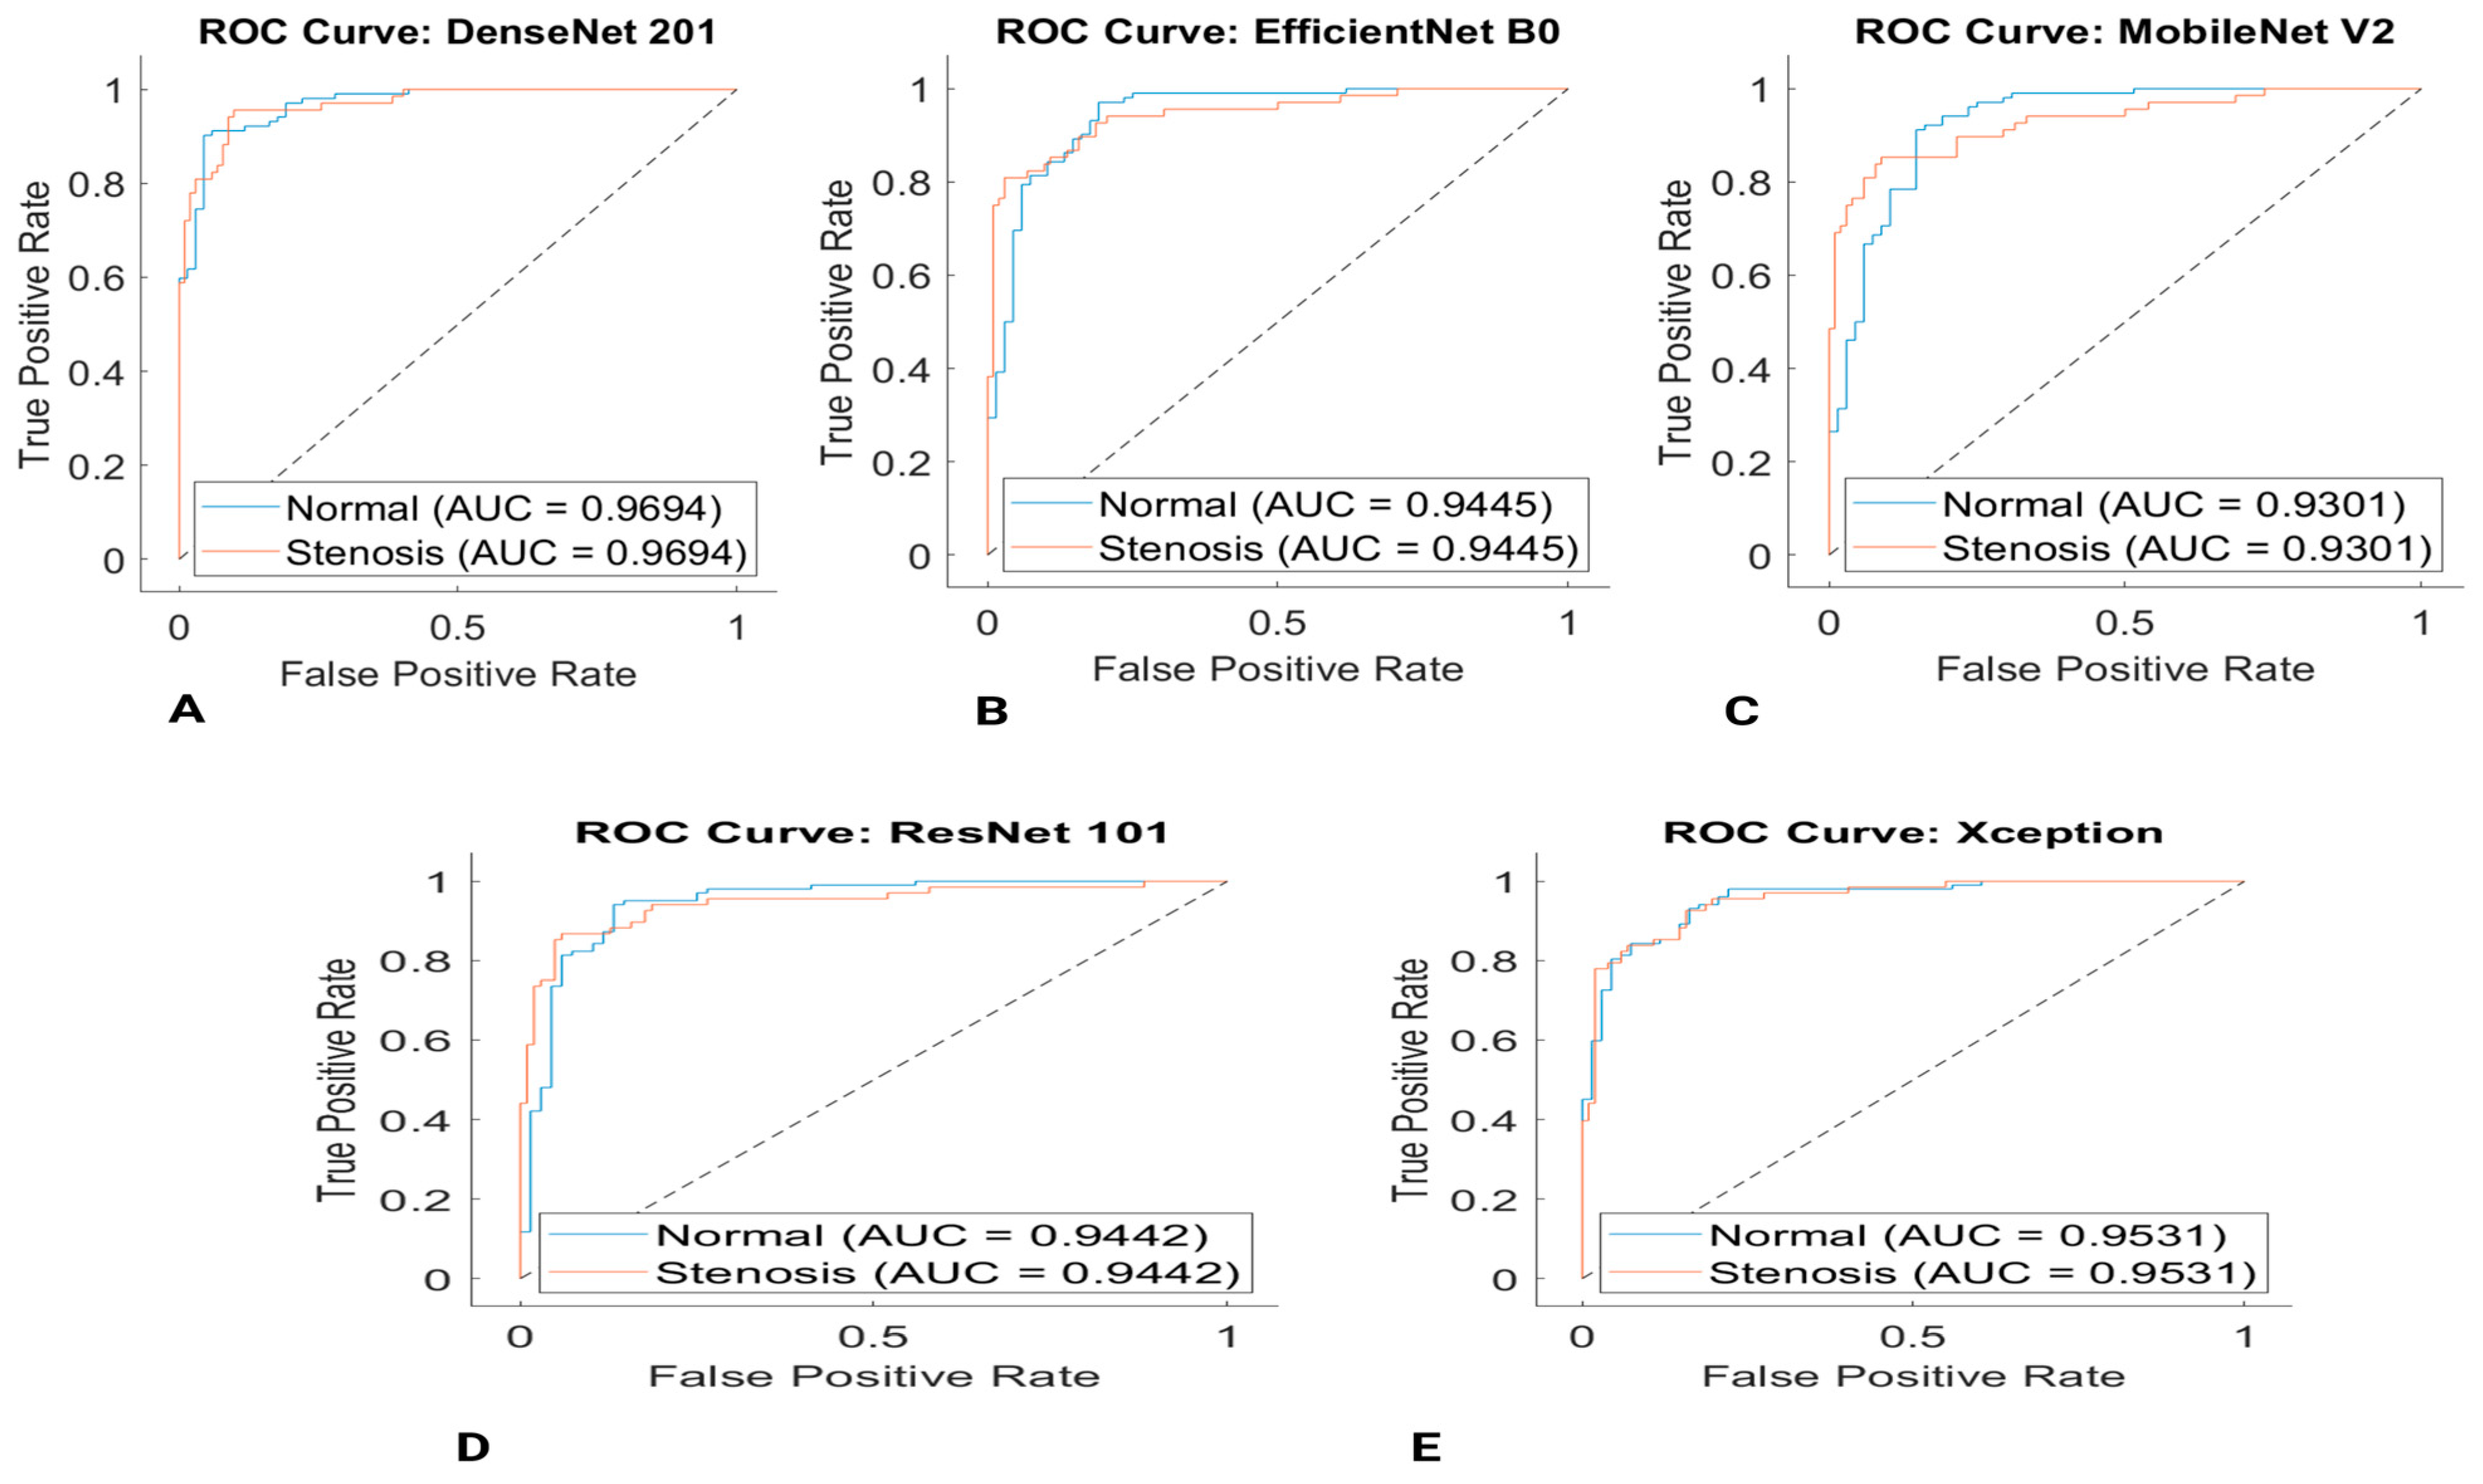
- One of the major contributions of this study is the application of DL-based transferred learning using several pretrained models (EfficientNet-B0, DenseNet201, Mobilenet-v2, ResNet101 and Xception) for the classification of coronary angiograms.
- Comparison between the performance of models trained on the coronary artery small datasets can aid cardiologists in the selection of the best-performing model and also aid them in making appropriate decision-making.
- Another contribution of this study is the use of raw/unaltered data that are obtained from real patients by the cardiology department of Near East University Hospital, instead of using a dataset curated from an online repository system. We have noticed that a significant number of images available from online repository systems have been altered (i.e., cropped, rotated, and enlarged) to aid the segmentation and classification performance of coronary arteries. However, this is not the case in clinical applications.
- Performance evaluation of models based on accuracy, sensitivity, specificity, precision, Dice Score (F1 Score), Jaccard Index and Matthews correlation coefficient (MCC), negative predictive value (NPV), Cohen’s kappa, Area Under Curve (AUC) and Receiver Operating Characteristic (ROC) curve.
1.4. Related Work
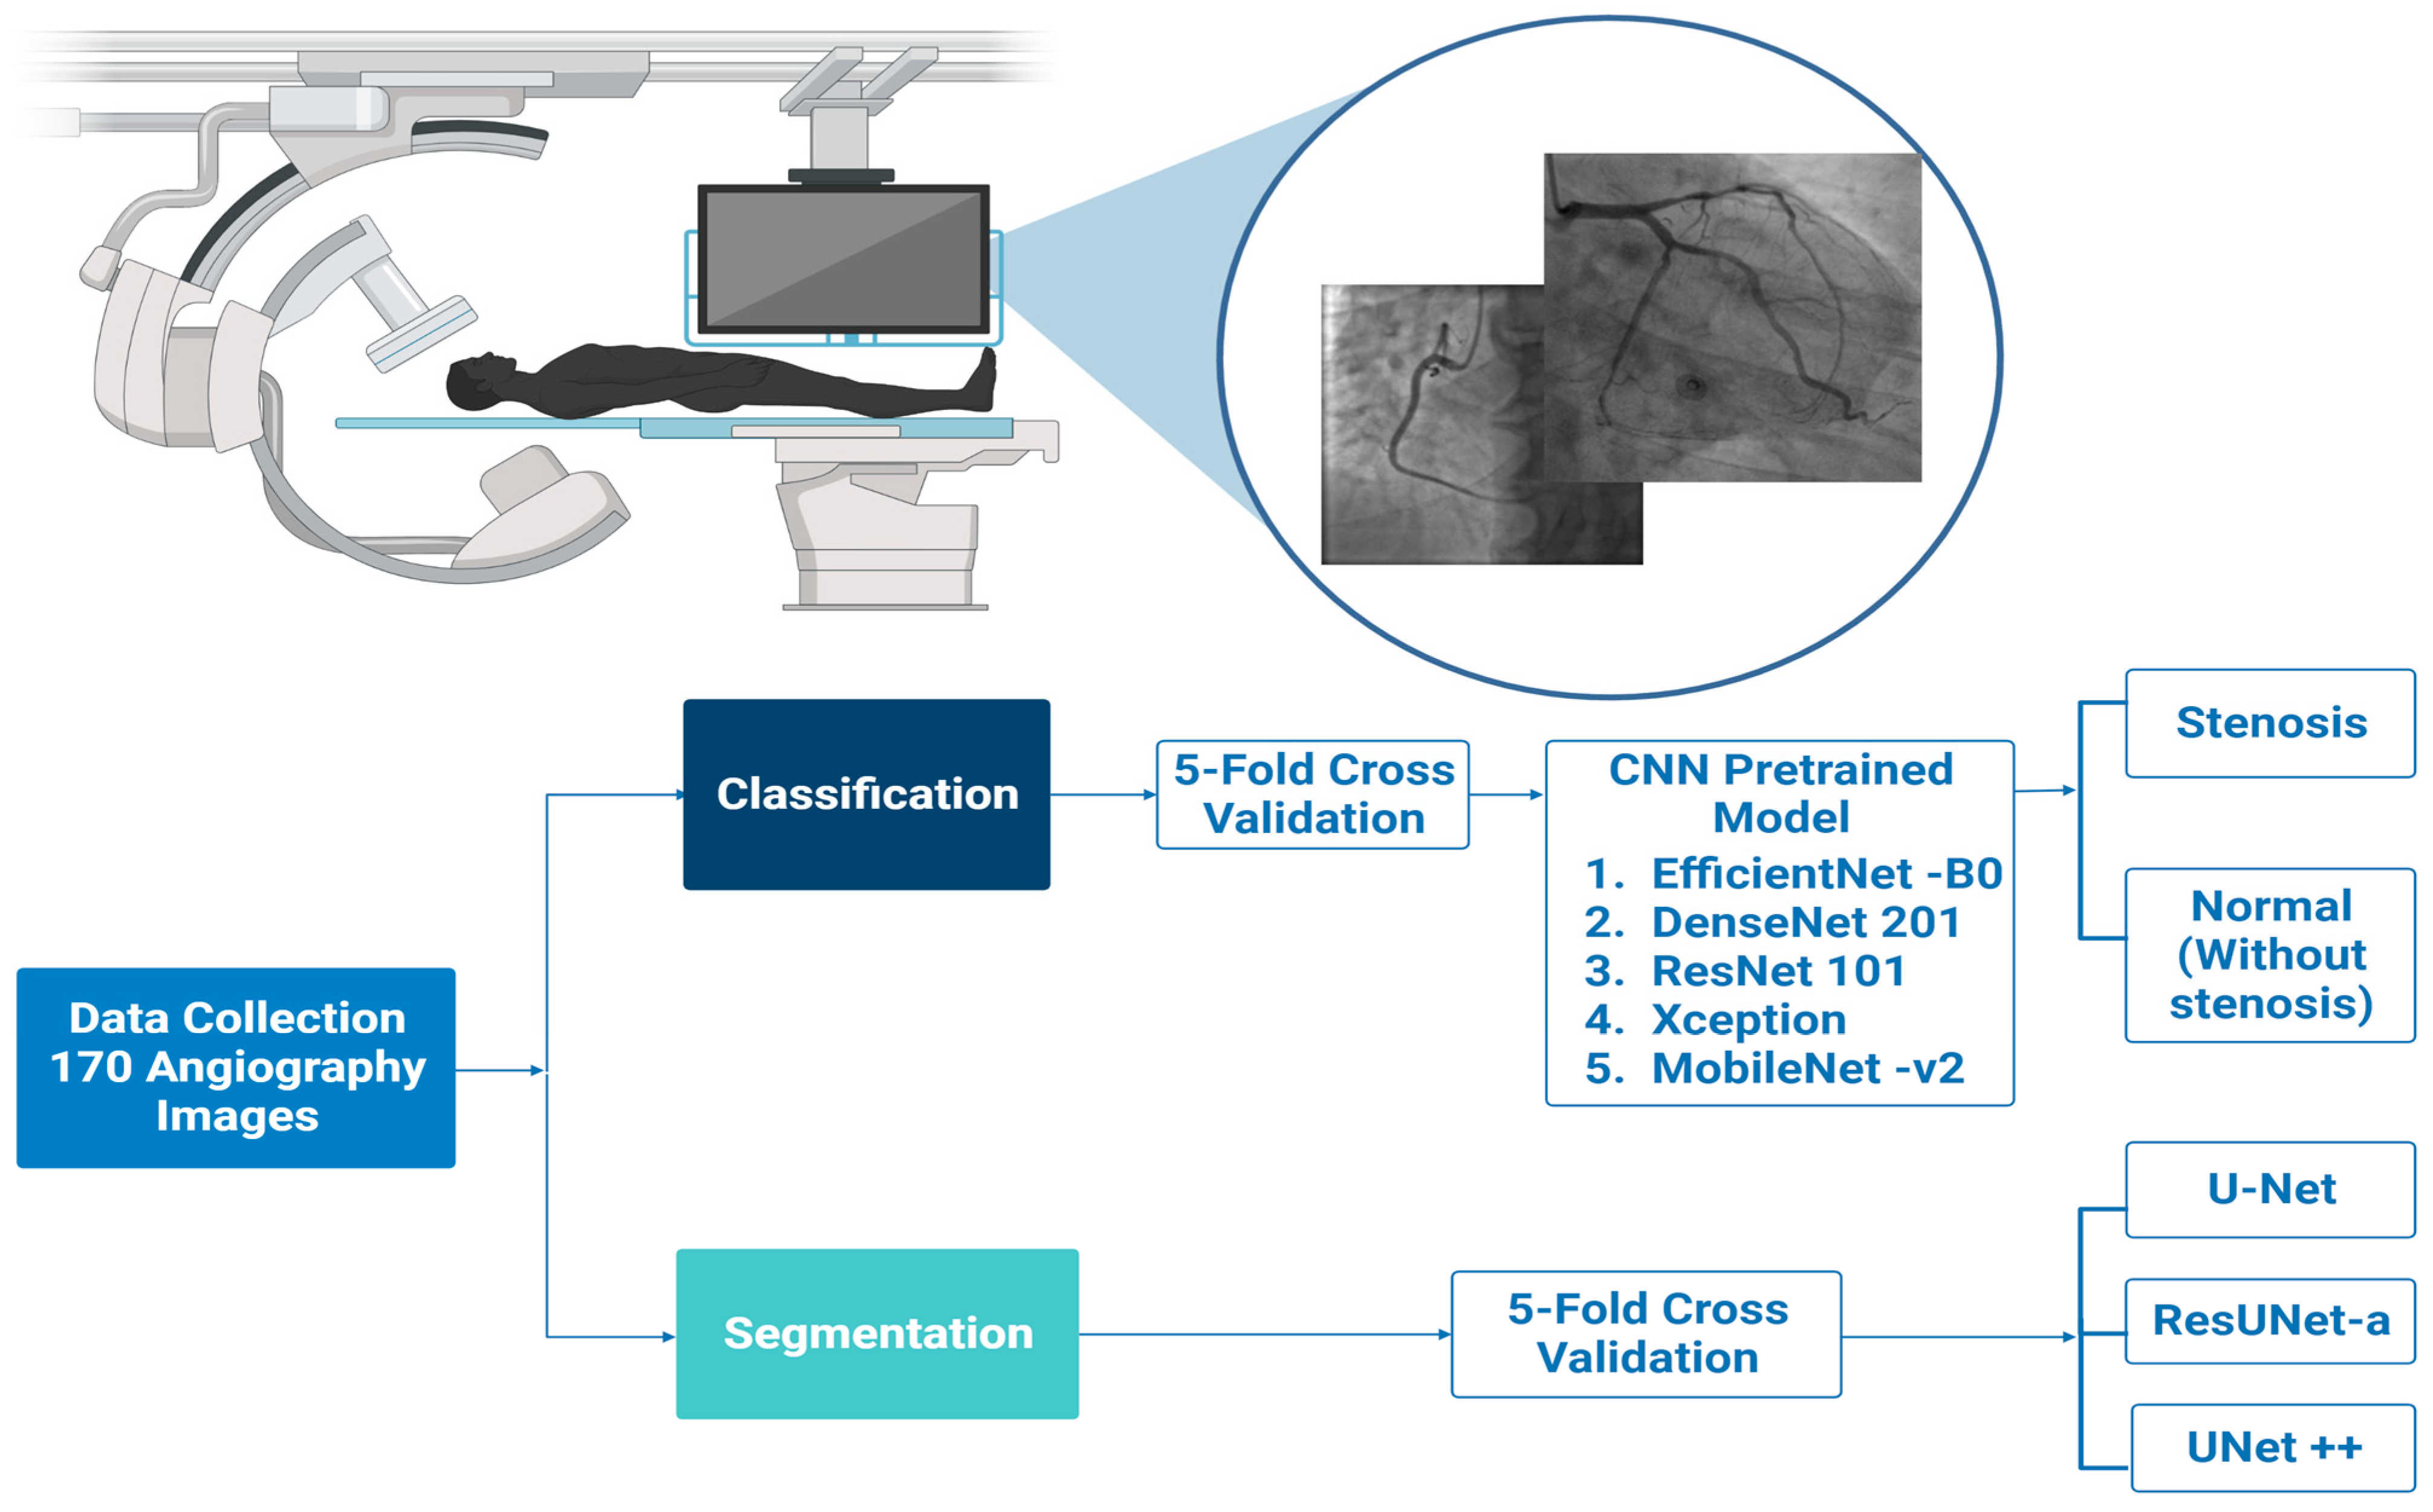
2. Methodology
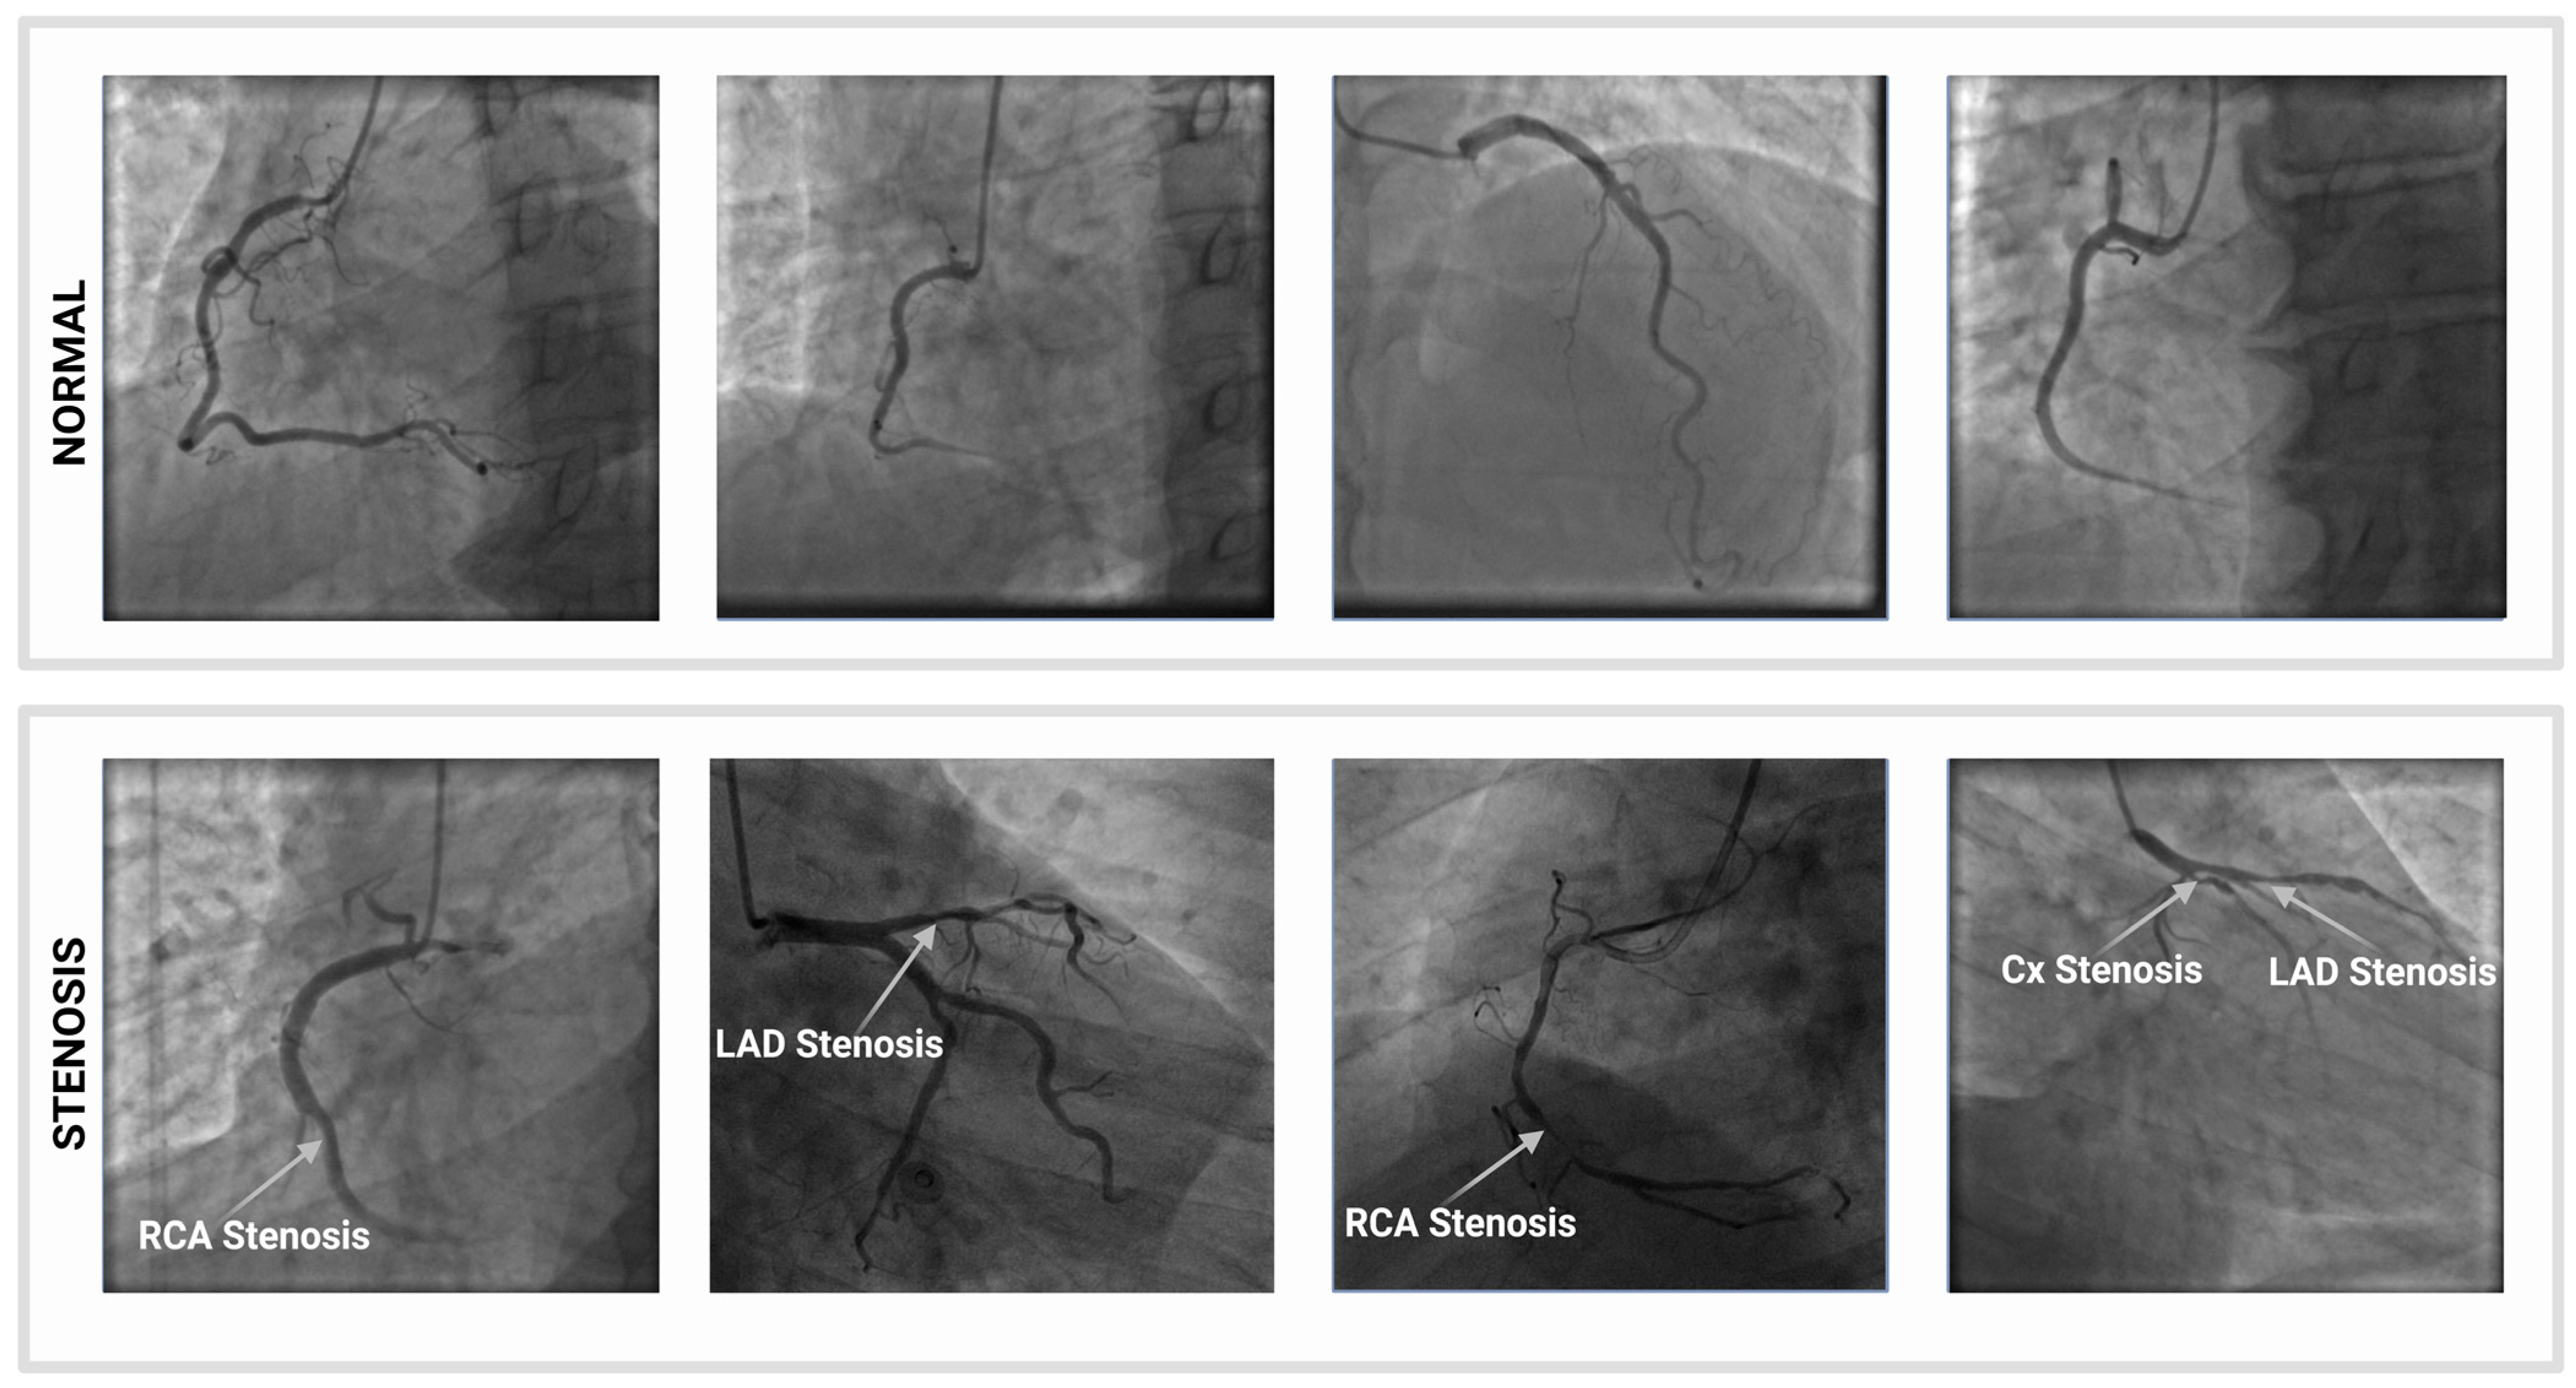
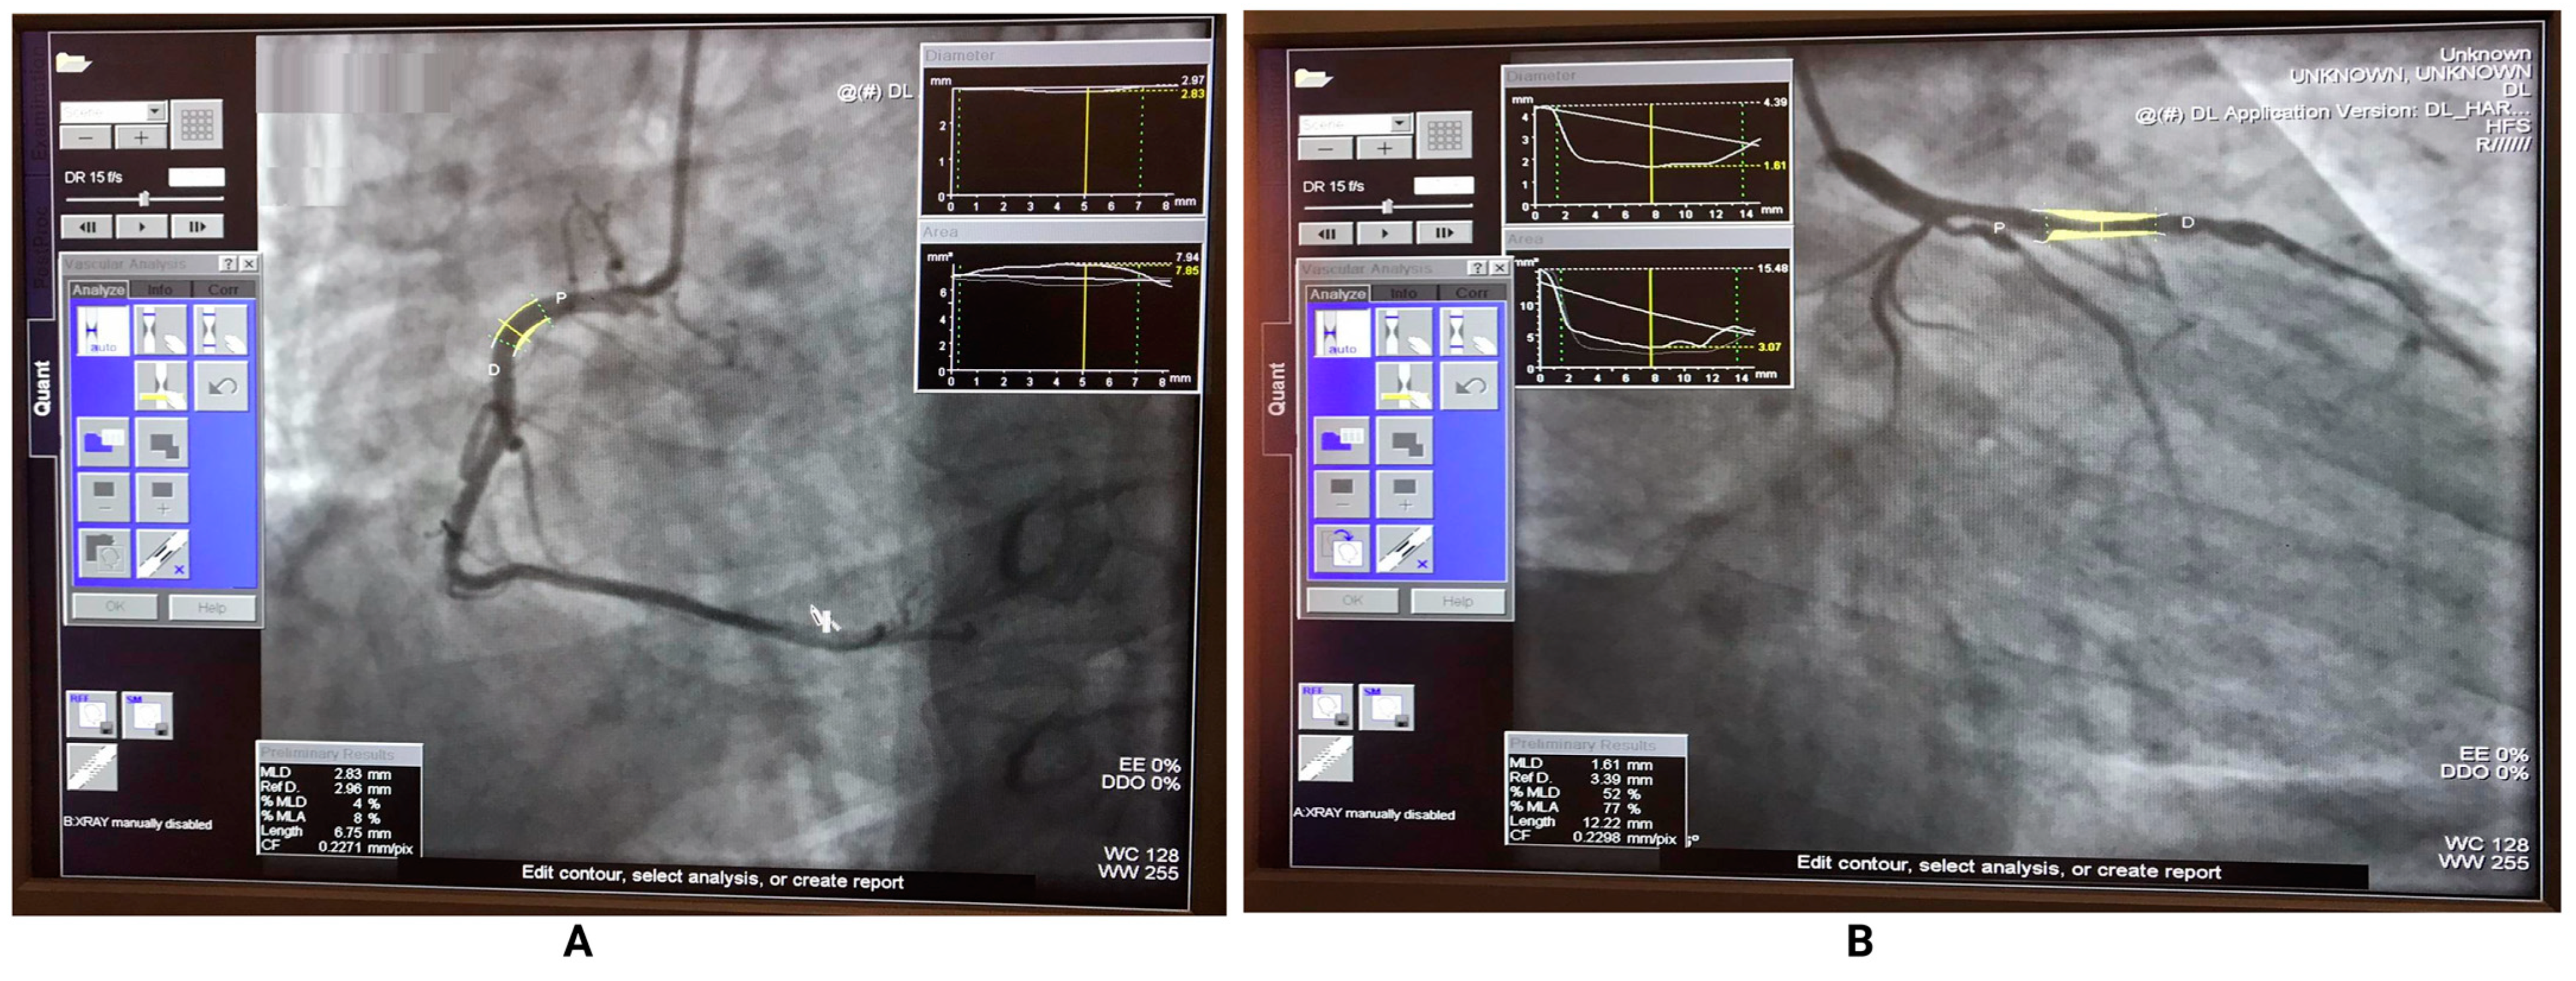
2.1. Dataset Description
2.2. Image Pre-Processing
2.3. Cross Validation
2.4. Segmentation
2.4.1. U-Net
2.4.2. Deep Residual U-Net (ResUNet)
2.4.3. UNet++
2.5. Classification
2.5.1. DenseNet
2.5.2. EfficientNet
2.5.3. MobileNet
2.5.4. ResNet
2.5.5. Inception
2.6. Experimental Design
2.7. Performance Metrics and Confusion Matrix
3. Experimental Results
3.1. Segmentation Results
3.2. Classification Results
4. Discussion
4.1. Limitations and Clinical Implications
4.2. Comparison of Segmentation Models Performance
4.3. Comparison of Classification Models Performance
5. Conclusions
Author Contributions
Funding
Institutional Review Board Statement
Informed Consent Statement
Data Availability Statement
Conflicts of Interest
References
- Malakar, A.K.; Choudhury, D.; Halder, B.; Paul, P.; Uddin, A.; Chakraborty, S. A Review on Coronary Artery Disease, Its Risk Factors, and Therapeutics. J. Cell. Physiol. 2019, 234, 16812–16823. [Google Scholar] [CrossRef] [PubMed]
- Pandey, R.; Kumar, M.; Majdoubi, J.; Rahimi-Gorji, M.; Srivastav, V.K. A Review Study on Blood in Human Coronary Artery: Numerical Approach. Comput. Methods Programs Biomed. 2020, 187, 105243. [Google Scholar] [CrossRef] [PubMed]
- Bit, A.; Suri, J.S.; Ranjani, A. Anatomy and physiology of blood vessels. In Flow Dynamics and Tissue Engineering of Blood Vessels; IOP Publishing Ltd: Bristol, UK, 2020. [Google Scholar] [CrossRef]
- Taki, A.; Kermani, A.; Ranjbarnavazi, S.M.; Pourmodheji, A. Overview of different medical imaging techniques for the identification of coronary atherosclerotic plaques. In Computing and Visualization for Intravascular Imaging and Computer-Assisted Stenting; Academic Press: Cambridge, MA, USA, 2017; pp. 79–106. [Google Scholar] [CrossRef]
- Sayadi, M.; Varadarajan, V.; Sadoughi, F.; Chopannejad, S.; Langarizadeh, M. A Machine Learning Model for Detection of Coronary Artery Disease Using Noninvasive Clinical Parameters. Life 2022, 12, 1933. [Google Scholar] [CrossRef]
- Wang, L.; Liang, D.; Yin, X.; Qiu, J.; Yang, Z.; Xing, J.; Dong, J.; Ma, Z. Coronary Artery Segmentation in Angiographic Videos Utilizing Spatial-Temporal Information. BMC Med. Imaging 2020, 20, 110. [Google Scholar] [CrossRef] [PubMed]
- Bertolone, D.T.; Gallinoro, E.; Esposito, G.; Paolisso, P.; Bermpeis, K.; De Colle, C.; Fabbricatore, D.; Mileva, N.; Valeriano, C.; Munhoz, D.; et al. Contemporary Management of Stable Coronary Artery Disease. High Blood Press. Cardiovasc. Prev. 2022, 29, 207–219. [Google Scholar] [CrossRef]
- Liu, Y.; Zhang, X.; Wan, W.; Liu, S.; Liu, Y.; Liu, H.; Zeng, X.; Zhang, Q. Two New Stenosis Detection Methods of Coronary Angiograms. IJCARS 2022, 17, 521–530. [Google Scholar] [CrossRef]
- Hashemi, J.; Rai, S.; Ghafghazi, S.; Berson, R.E. Blood Residence Time to Assess Significance of Coronary Artery Stenosis. Sci. Rep. 2020, 10, 11658. [Google Scholar] [CrossRef]
- Barriada, R.G.; Masip, D. An Overview of Deep-Learning-Based Methods for Cardiovascular Risk Assessment with Retinal Images. Diagnostics 2022, 13, 68. [Google Scholar] [CrossRef]
- Moorthy, J.; Gandhi, U.D. A Survey on Medical Image Segmentation Based on Deep Learning Techniques. BDCC 2022, 6, 117. [Google Scholar] [CrossRef]
- Balaji, K.; Lavanya, K. Medical image analysis with deep neural networks. In Deep Learning and Parallel Computing Environment for Bioengineering Systems; Academic Press: Cambridge, MA, USA, 2019; pp. 75–97. [Google Scholar] [CrossRef]
- Han, X.; Zhang, Z.; Ding, N.; Gu, Y.; Liu, X.; Huo, Y.; Qiu, J.; Yao, Y.; Zhang, A.; Zhang, L.; et al. Pre-Trained Models: Past, Present and Future. AI Open 2021, 2, 225–250. [Google Scholar] [CrossRef]
- Cervantes-Sanchez, F.; Cruz-Aceves, I.; Hernandez-Aguirre, A.; Hernandez-Gonzalez, M.A.; Solorio-Meza, S.E. Automatic Segmentation of Coronary Arteries in X-Ray Angiograms Using Multiscale Analysis and Artificial Neural Networks. Appl. Sci. 2019, 9, 5507. [Google Scholar] [CrossRef] [Green Version]
- Nwogu, I.; Lorigo, L. Fast temporal tracking and 3D reconstruction of a single coronary vessel. In Proceedings of the 2007 IEEE International Conference on Image Processing, San Antonio, TX, USA, 16 September–19 October 2019; Volume 5, p. V-537. [Google Scholar]
- Kerkeni, A.; Benabdallah, A.; Manzanera, A.; Bedoui, M.H. A Coronary Artery Segmentation Method Based on Multiscale Analysis and Region Growing. CMIG 2016, 48, 49–61. [Google Scholar] [CrossRef] [Green Version]
- Jiang, Y.; Zhang, H.; Tan, N.; Chen, L. Automatic Retinal Blood Vessel Segmentation Based on Fully Convolutional Neural Networks. Symmetry 2019, 11, 1112. [Google Scholar] [CrossRef] [Green Version]
- Yang, S.; Kweon, J.; Roh, J.-H.; Lee, J.-H.; Kang, H.; Park, L.-J.; Kim, D.J.; Yang, H.; Hur, J.; Kang, D.-Y.; et al. Deep Learning Segmentation of Major Vessels in X-Ray Coronary Angiography. Sci. Rep. 2019, 9, 16897. [Google Scholar] [CrossRef] [PubMed] [Green Version]
- Iyer, K.; Najarian, C.P.; Fattah, A.A.; Arthurs, C.J.; Soroushmehr, S.M.R.; Subban, V.; Sankardas, M.A.; Nadakuditi, R.R.; Nallamothu, B.K.; Figueroa, C.A. AngioNet: A Convolutional Neural Network for Vessel Segmentation in X-Ray Angiography. Sci. Rep. 2021, 11, 18066. [Google Scholar] [CrossRef]
- Zhu, X.; Cheng, Z.; Wang, S.; Chen, X.; Lu, G. Coronary Angiography Image Segmentation Based on PSPNet. Comput. Methods Programs Biomed. 2021, 200, 105897. [Google Scholar] [CrossRef]
- Jiang, Z.; Ou, C.; Qian, Y.; Rehan, R.; Yong, A. Coronary Vessel Segmentation Using Multiresolution and Multiscale Deep Learning. IMU 2021, 24, 100602. [Google Scholar] [CrossRef]
- Badrinarayanan, V.; Kendall, A.; Cipolla, R. SegNet: A Deep Convolutional Encoder-Decoder Architecture for Image Segmentation. IEEE Trans. Pattern Anal. Mach. Intell. 2017, 39, 2481–2495. [Google Scholar] [CrossRef]
- Saood, A.; Hatem, I. COVID-19 Lung CT Image Segmentation Using Deep Learning Methods: U-Net versus SegNet. BMC Med. Imaging 2021, 21, 19. [Google Scholar] [CrossRef]
- Zhao, C.; Bober, R.; Tang, H.; Tang, J.; Dong, M.; Zhang, C.; He, Z.; Esposito, M.; Xu, Z.; Zhou, W. Semantic Segmentation to Extract Coronary Arteries in Invasive Coronary Angiograms. J. Adv. Appl. Comput. Math. 2022, 9, 76–85. [Google Scholar] [CrossRef]
- Tran, S.-T.; Cheng, C.-H.; Nguyen, T.-T.; Le, M.-H.; Liu, D.-G. TMD-Unet: Triple-Unet with Multi-Scale Input Features and Dense Skip Connection for Medical Image Segmentation. Healthcare 2021, 9, 54. [Google Scholar] [CrossRef]
- Zunair, H.; Ben Hamza, A. Sharp U-Net: Depthwise Convolutional Network for Biomedical Image Segmentation. Comput. Biol. Med. 2021, 136, 104699. [Google Scholar] [CrossRef] [PubMed]
- Cai, L.; Gao, J.; Zhao, D. A Review of the Application of Deep Learning in Medical Image Classification and Segmentation. Ann. Transl. Med. 2020, 8, 713. [Google Scholar] [CrossRef] [PubMed]
- Semenoglou, A.-A.; Spiliotis, E.; Assimakopoulos, V. Image-Based Time Series Forecasting: A Deep Convolutional Neural Network Approach. Neural Netw. 2023, 157, 39–53. [Google Scholar] [CrossRef] [PubMed]
- Wang, J.; Liu, Q.; Xie, H.; Yang, Z.; Zhou, H. Boosted EfficientNet: Detection of Lymph Node Metastases in Breast Cancer Using Convolutional Neural Networks. Cancers 2021, 13, 661. [Google Scholar] [CrossRef]
- Antczak, K.; Liberadzki, Ł. Stenosis Detection with Deep Convolutional Neural Networks. MATEC Web Conf. 2018, 210, 04001. [Google Scholar] [CrossRef] [Green Version]
- Gil-Rios, M.-A.; Guryev, I.V.; Cruz-Aceves, I.; Avina-Cervantes, J.G.; Hernandez-Gonzalez, M.A.; Solorio-Meza, S.E.; Lopez-Hernandez, J.M. Automatic Feature Selection for Stenosis Detection in X-Ray Coronary Angiograms. Mathematics 2021, 9, 2471. [Google Scholar] [CrossRef]
- Ovalle-Magallanes, E.; Avina-Cervantes, J.G.; Cruz-Aceves, I.; Ruiz-Pinales, J. Transfer Learning for Stenosis Detection in X-Ray Coronary Angiography. Mathematics 2020, 8, 1510. [Google Scholar] [CrossRef]
- Lee, J.O.; Park, E.-A.; Park, D.; Lee, W. Deep Learning-Based Automated Quantification of Coronary Artery Calcification for Contrast-Enhanced Coronary Computed Tomographic Angiography. J. Cardiovasc. Dev. Dis. 2023, 10, 143. [Google Scholar] [CrossRef]
- Jamil, S.; Roy, A.M. An Efficient and Robust Phonocardiography (PCG)-Based Valvular Heart Diseases (VHD) Detection Framework Using Vision Transformer (ViT). Comput. Biol. Med. 2023, 158, 106734. [Google Scholar] [CrossRef]
- Liu, X.; Wang, X.; Chen, D.; Zhang, H. Automatic Quantitative Coronary Analysis Based on Deep Learning. Appl. Sci. 2023, 13, 2975. [Google Scholar] [CrossRef]
- Suzuki, N.; Asano, T.; Nakazawa, G.; Aoki, J.; Tanabe, K.; Hibi, K.; Ikari, Y.; Kozuma, K. Clinical Expert Consensus Document on Quantitative Coronary Angiography from the Japanese Association of Cardiovascular Intervention and Therapeutics. Cardiovasc. Interv. Ther. 2020, 35, 105–116. [Google Scholar] [CrossRef] [Green Version]
- Cury, R.C.; Leipsic, J.; Abbara, S.; Achenbach, S.; Berman, D.; Bittencourt, M.; Budoff, M.; Chinnaiyan, K.; Choi, A.D.; Ghoshhajra, B.; et al. CAD-RADSTM 2.0—2022 Coronary Artery Disease-Reporting and Data System. JACC Cardiovasc. Imaging 2022, 15, 1974–2001. [Google Scholar] [CrossRef]
- Fan, C.; Hauser, H. Fast and Accurate CNN-Based Brushing in Scatterplots. Comput. Graph. Forum 2018, 37, 111–120. [Google Scholar] [CrossRef]
- Anguita, D.; Ghelardoni, L.; Ghio, A.; Oneto, L.; Ridella, S. The’K’in K-fold Cross Validation. In Proceedings of the 31th European Symposium on Artificial Neural Networks, Computational Intelligence and Machine Learning, Bruges, Belgium, 25–27 April 2017; pp. 441–446. [Google Scholar]
- Ronneberger, O.; Fischer, P.; Brox, T. U-Net: Convolutional Networks for Biomedical Image Segmentation. In Lecture Notes in Computer Science, Proceedings of the Medical Image Computing and Computer-Assisted Intervention—MICCAI 2015, Munich, Germany, 5–9 October 2015; Springer: Cham, Switzerland, 2015; pp. 234–241. [Google Scholar] [CrossRef] [Green Version]
- Siddique, N.; Paheding, S.; Elkin, C.P.; Devabhaktuni, V. U-Net and Its Variants for Medical Image Segmentation: A Review of Theory and Applications. IEEE Access 2021, 9, 82031–82057. [Google Scholar] [CrossRef]
- Ashraf, H.; Waris, A.; Ghafoor, M.F.; Gilani, S.O.; Niazi, I.K. Melanoma Segmentation Using Deep Learning with Test-Time Augmentations and Conditional Random Fields. Sci. Rep. 2022, 12, 3948. [Google Scholar] [CrossRef] [PubMed]
- Diakogiannis, F.I.; Waldner, F.; Caccetta, P.; Wu, C. ResUNet-a: A Deep Learning Framework for Semantic Segmentation of Remotely Sensed Data. ISPRS J. Photogramm. Remote Sens. 2020, 162, 94–114. [Google Scholar] [CrossRef] [Green Version]
- Zhou, Z.; Siddiquee, M.; Tajbakhsh, N.; Liang, J. UNet++: A Nested U-Net Architecture for Medical Image Segmentation. In Deep Learning in Medical Image Analysis and Multimodal Learning for Clinical Decision Support; Springer: Cham, Switzerland, 2018; pp. 3–11. [Google Scholar]
- ImageNet. Available online: https://www.image-net.org/update-mar-11-2021.php (accessed on 15 April 2023).
- Russakovsky, O.; Deng, J.; Su, H.; Krause, J.; Satheesh, S.; Ma, S.; Huang, Z.; Karpathy, A.; Khosla, A.; Bernstein, M.; et al. ImageNet Large Scale Visual Recognition Challenge. Int. J. Comput. Vis. 2015, 115, 211–252. [Google Scholar] [CrossRef] [Green Version]
- Yang, Y.; Zhang, L.; Du, M.; Bo, J.; Liu, H.; Ren, L.; Li, X.; Deen, M.J. A Comparative Analysis of Eleven Neural Networks Architectures for Small Datasets of Lung Images of COVID-19 Patients toward Improved Clinical Decisions. Comput. Biol. Med. 2021, 139, 104887. [Google Scholar] [CrossRef]
- Rahman, T.; Chowdhury, M.E.H.; Khandakar, A.; Islam, K.R.; Islam, K.F.; Mahbub, Z.B.; Kadir, M.A.; Kashem, S. Transfer Learning with Deep Convolutional Neural Network (CNN) for Pneumonia Detection Using Chest X-Ray. Appl. Sci. 2020, 10, 3233. [Google Scholar] [CrossRef]
- Almuayqil, S.N.; Abd El-Ghany, S.; Elmogy, M. Computer-Aided Diagnosis for Early Signs of Skin Diseases Using Multi Types Feature Fusion Based on a Hybrid Deep Learning Model. Electronics 2022, 11, 4009. [Google Scholar] [CrossRef]
- Tan, M.; Le, Q. EfficientNet: Rethinking model scaling for convolutional neural networks. In Proceedings of the International Conference on Machine Learning, Long Beach, CA, USA, 9–15 June 2019. [Google Scholar]
- Putra, T.A.; Rufaida, S.I.; Leu, J.-S. Enhanced Skin Condition Prediction Through Machine Learning Using Dynamic Training and Testing Augmentation. IEEE Access 2020, 8, 40536–40546. [Google Scholar] [CrossRef]
- Gorji, H.T.; Shahabi, S.M.; Sharma, A.; Tande, L.Q.; Husarik, K.; Qin, J.; Chan, D.E.; Baek, I.; Kim, M.S.; MacKinnon, N.; et al. Combining Deep Learning and Fluorescence Imaging to Automatically Identify Fecal Contamination on Meat Carcasses. Sci. Rep. 2022, 12, 2392. [Google Scholar] [CrossRef]
- Seidaliyeva, U.; Akhmetov, D.; Ilipbayeva, L.; Matson, E.T. Real-Time and Accurate Drone Detection in a Video with a Static Background. Sensors 2020, 20, 3856. [Google Scholar] [CrossRef] [PubMed]
- Sandler, M.; Howard, A.; Zhu, M.; Zhmoginov, A.; Chen, L.C. Mobilenetv2: Inverted residuals and linear bottlenecks. In Proceedings of the IEEE Conference on Computer Vision and Pattern Recognition, Salt Lake City, UT, USA, 18–23 June 2018; pp. 4510–4520. [Google Scholar]
- Ichim, L.; Popescu, D. Melanoma Detection Using an Objective System Based on Multiple Connected Neural Networks. IEEE Access 2020, 8, 179189–179202. [Google Scholar] [CrossRef]
- Ardakani, A.A.; Kanafi, A.R.; Acharya, U.R.; Khadem, N.; Mohammadi, A. Application of Deep Learning Technique to Manage COVID-19 in Routine Clinical Practice Using CT Images: Results of 10 Convolutional Neural Networks. Comput. Biol. Med. 2020, 121, 103795. [Google Scholar] [CrossRef] [PubMed]
- Li, F.; Yan, L.; Wang, Y.; Shi, J.; Chen, H.; Zhang, X.; Jiang, M.; Wu, Z.; Zhou, K. Deep Learning-Based Automated Detection of Glaucomatous Optic Neuropathy on Color Fundus Photographs. Graefe’s Arch. Clin. Exp. Ophthalmol. 2020, 258, 851–867. [Google Scholar] [CrossRef]
- Liu, Y.; Zhang, L.; Hao, Z.; Yang, Z.; Wang, S.; Zhou, X.; Chang, Q. An Xception Model Based on Residual Attention Mechanism for the Classification of Benign and Malignant Gastric Ulcers. Sci. Rep. 2022, 12, 15365. [Google Scholar] [CrossRef]
- Chollet, F. Xception: Deep learning with depthwise separable convolutions. In Proceedings of the IEEE Conference On Computer Vision And Pattern Recognition, Honolulu, HI, USA, 21–26 July 2017; pp. 1251–1258. [Google Scholar]
- Al-antari, M.A.; Al-masni, M.A.; Choi, M.-T.; Han, S.-M.; Kim, T.-S. A Fully Integrated Computer-Aided Diagnosis System for Digital X-Ray Mammograms via Deep Learning Detection, Segmentation, and Classification. Int. J. Med. Inform. 2018, 117, 44–54. [Google Scholar] [CrossRef] [PubMed]
- Nai, Y.-H.; Teo, B.W.; Tan, N.L.; O’Doherty, S.; Stephenson, M.C.; Thian, Y.L.; Chiong, E.; Reilhac, A. Comparison of Metrics for the Evaluation of Medical Segmentations Using Prostate MRI Dataset. Comput. Biol. Med. 2021, 134, 104497. [Google Scholar] [CrossRef] [PubMed]
- Tohka, J.; van Gils, M. Evaluation of Machine Learning Algorithms for Health and Wellness Applications: A Tutorial. Comput. Biol. Med. 2021, 132, 104324. [Google Scholar] [CrossRef] [PubMed]
- Baskaran, L.; Al’Aref, S.J.; Maliakal, G.; Lee, B.C.; Xu, Z.; Choi, J.W.; Lee, S.-E.; Sung, J.M.; Lin, F.Y.; Dunham, S.; et al. Automatic Segmentation of Multiple Cardiovascular Structures from Cardiac Computed Tomography Angiography Images Using Deep Learning. PLoS ONE 2020, 15, e0232573. [Google Scholar] [CrossRef] [PubMed]
- Rizwan, I.; Haque, I.; Neubert, J. Deep Learning Approaches to Biomedical Image Segmentation. IMU 2020, 18, 100297. [Google Scholar] [CrossRef]
- Chicco, D.; Warrens, M.J.; Jurman, G. The Matthews Correlation Coefficient (MCC) Is More Informative Than Cohen’s Kappa and Brier Score in Binary Classification Assessment. IEEE Access 2021, 9, 78368–78381. [Google Scholar] [CrossRef]
- Sammut, C.; Webb, G.I. Encyclopedia of Machine Learning and Data Mining; Springer: Berlin/Heidelberg, Germany, 2017. [Google Scholar] [CrossRef]
- Zhu, W.; Zeng, N.; Wang, N. Sensitivity, specificity, accuracy, associated confidence interval and ROC analysis with practical SAS implementations. In Proceedings of the NESUG Proceedings: Health Care and Life Sciences, Baltimore, MD, USA, 14–17 November 2010; Volume 19, p. 67. [Google Scholar]
- Rashed, B.M.; Popescu, N. Performance Investigation for Medical Image Evaluation and Diagnosis Using Machine-Learning and Deep-Learning Techniques. Computation 2023, 11, 63. [Google Scholar] [CrossRef]
- Hicks, S.A.; Strümke, I.; Thambawita, V.; Hammou, M.; Riegler, M.A.; Halvorsen, P.; Parasa, S. On Evaluation Metrics for Medical Applications of Artificial Intelligence. Sci. Rep. 2022, 12, 5979. [Google Scholar] [CrossRef]
- Wang, J.; Yang, Y.; Xia, B. A Simplified Cohen’s Kappa for Use in Binary Classification Data Annotation Tasks. IEEE Access 2019, 7, 164386–164397. [Google Scholar] [CrossRef]
- Rodríguez-Hernández, M.M.; Pruneda, R.E.; Rodríguez-Díaz, J.M. Statistical Analysis of the Evolutive Effects of Language Development in the Resolution of Mathematical Problems in Primary School Education. Mathematics 2021, 9, 1081. [Google Scholar] [CrossRef]
- Shamila Ebenezer, A.; Deepa Kanmani, S.; Sivakumar, M.; Jeba Priya, S. Effect of Image Transformation on EfficientNet Model for COVID-19 CT Image Classification. Mater. Today Proc. 2022, 51, 2512–2519. [Google Scholar] [CrossRef]
- Fan, Y.-J.; Tzeng, I.-S.; Huang, Y.-S.; Hsu, Y.-Y.; Wei, B.-C.; Hung, S.-T.; Cheng, Y.-L. Machine Learning: Using Xception, a Deep Convolutional Neural Network Architecture, to Implement Pectus Excavatum Diagnostic Tool from Frontal-View Chest X-Rays. Biomedicines 2023, 11, 760. [Google Scholar] [CrossRef] [PubMed]
- Irkham, I.; Ibrahim, A.U.; Nwekwo, C.W.; Al-Turjman, F.; Hartati, Y.W. Current Technologies for Detection of COVID-19: Biosensors, Artificial Intelligence and Internet of Medical Things (IoMT). Sensors 2022, 23, 426. [Google Scholar] [CrossRef] [PubMed]
- Kora, P.; Ooi, C.P.; Faust, O.; Raghavendra, U.; Gudigar, A.; Chan, W.Y.; Meenakshi, K.; Swaraja, K.; Plawiak, P.; Acharya, U.R. Transfer learning techniques for medical image analysis: A review. Biocybern. Biomed. Eng. 2021, 42, 79–107. [Google Scholar] [CrossRef]
- Bertels, J.; Eelbode, T.; Berman, M.; Vandermeulen, D.; Maes, F.; Bisschops, R.; Blaschko, M.B. Optimizing the dice score and jaccard index for medical image segmentation: Theory and practice. In Lecture Notes in Computer Science, Proceedings of the Medical Image Computing and Computer Assisted Intervention—MICCAI 2019 Shenzhen, China, 13–17 October 2019; Springer: Cham, Switzerland, 2019; pp. 92–100. [Google Scholar] [CrossRef] [Green Version]


| Reference | Image Acquisition | No. of Images | Method | Results |
|---|---|---|---|---|
| [14] | Cardiology Department of the Mexican Social Security Institute | 130 coronary angiograms | Multiscale versions of the Gaussian filter and Gabor filter | ACC: 0.9698, Sens: 0.6364, Spec: 0.9880, PPV: 0.7434, Dice coefficient: 0.6857 |
| [16] | Department of The University Hospital Fattouma Bourguiba, Monastir, Tunisia | 50 coronary angiograms | Sato filter, Vessel enhancing diffusion filter, and Frangi filter Multiscale region growing | Mean precision: 82%, First dataset of Dice coefficient: 80 ± 5%, second dataset of Dice coefficient: 70 ± 5% |
| [18] | Asan Medical Center (Internal) Chungnam National University Hospital (External) | Internal:3302 coronary angiograms, External:181 coronary angiograms | U-Net, ResNet101, DenseNet121, InceptionResNet-v2 | Average F1 score: 0.917, and 93.7% of the image |
| [19] | University of Michigan Hospital | 462 coronary angiograms | Convolutional neural network, AngioNet | Dice score: 0.864, pixel accuracy (PA):0.983, Sens: 0.918, Spec: 0.987 |
| [20] | Fuwai Central China Cardiovascular Hospital | 109 patient’s Coronary angiogram | Threshold segmentation, Region-based segmentation, PSPNet with TL | ACC: 0.957 Sens: 0.865 Spec:0.949 |
| [21] | Public Database | 134 Coronary angiograms | CLAHE, Multiresolution strategy and multiscale strategy with U-Net | ACC: 0.9765 Sens: 0.7978 Spec: 0.9885 PPV: 0.8137 Dice coefficient: 0.7905 |
| [31] | Mexican Social Security Institute (First dataset), Antczak and Liberadzki dataset (second dataset) | First dataset: 180 coronary angiograms (500 patches) Second dataset: 250 coronary angiograms | SVM-based classifier, UDMA | First database ACC: 0.89 and Jaccard Index: 0.80, and the second database, ACC: 0.88 Jaccard Index. 0.79 |
| [32] | Antczak and Liberadzki dataset (public) | 10,000 synthetic images and 250 real coronary angiograms images | Pretrained (VGG16, ResNet50, and Inception-v3 with Transfer Learning | ACC: 0.95, Precis: 0.93, Sens: 0.98, Spec: 0.92, and F1 score: 0.95 |
| Folds | Accuracy | Sensitivity | Specificity | Precision | Dice Score | Jaccard Index | MCC |
|---|---|---|---|---|---|---|---|
| Fold1 | 0.9929 | 0.8477 | 0.9970 | 0.8809 | 0.8611 | 0.7628 | 0.8591 |
| Fold2 | 0.9905 | 0.8355 | 0.9960 | 0.8628 | 0.8429 | 0.7390 | 0.8413 |
| Fold3 | 0.9917 | 0.8946 | 0.9942 | 0.8006 | 0.8416 | 0.7446 | 0.8405 |
| Fold4 | 0.9926 | 0.8397 | 0.9968 | 0.8697 | 0.8521 | 0.7542 | 0.8497 |
| Fold5 | 0.9911 | 0.8822 | 0.9942 | 0.7976 | 0.8360 | 0.7266 | 0.8335 |
| Average | 0.9918 | 0.8599 | 0.9957 | 0.8423 | 0.8467 | 0.7454 | 0.8448 |
| Folds | Accuracy | Sensitivity | Specificity | Precision | Dice Score | Jaccard Index | MCC |
|---|---|---|---|---|---|---|---|
| Fold1 | 0.9926 | 0.8224 | 0.9975 | 0.8925 | 0.8534 | 0.7508 | 0.8518 |
| Fold2 | 0.9892 | 0.7728 | 0.9966 | 0.8760 | 0.8129 | 0.6964 | 0.8134 |
| Fold3 | 0.9914 | 0.8133 | 0.9960 | 0.8407 | 0.8238 | 0.7178 | 0.8211 |
| Fold4 | 0.9923 | 0.8394 | 0.9966 | 0.8615 | 0.8462 | 0.7452 | 0.8445 |
| Fold5 | 0.9921 | 0.8029 | 0.9974 | 0.8872 | 0.8379 | 0.7324 | 0.8376 |
| Average | 0.9915 | 0.8101 | 0.9968 | 0.8716 | 0.8348 | 0.7285 | 0.8337 |
| Folds | Accuracy | Sensitivity | Specificity | Precision | Dice Score | Jaccard Index | MCC |
|---|---|---|---|---|---|---|---|
| Fold1 | 0.9878 | 0.9128 | 0.9900 | 0.7092 | 0.7945 | 0.6673 | 0.7969 |
| Fold2 | 0.9872 | 0.8673 | 0.9915 | 0.7456 | 0.7932 | 0.6637 | 0.7935 |
| Fold3 | 0.9879 | 0.8937 | 0.9904 | 0.7291 | 0.7919 | 0.6779 | 0.7959 |
| Fold4 | 0.9907 | 0.9046 | 0.9932 | 0.7709 | 0.8292 | 0.7176 | 0.8288 |
| Fold5 | 0.9867 | 0.9086 | 0.9890 | 0.6825 | 0.7742 | 0.6435 | 0.7786 |
| Average | 0.9881 | 0.8974 | 0.9908 | 0.7274 | 0.7966 | 0.6740 | 0.7988 |
| Folds | Accuracy | Sensitivity | Specificity | PPV | NPV | F1 Score | MCC | Cohen’s Kappa |
|---|---|---|---|---|---|---|---|---|
| Fold1 | 0.9412 | 0.8889 | 1 | 1 | 0.8889 | 0.9412 | 0.8889 | 0.8826 |
| Fold2 | 0.8824 | 0.6923 | 1 | 1 | 0.8400 | 0.8182 | 0.7626 | 0.7354 |
| Fold3 | 0.8529 | 0.7000 | 0.9167 | 0.7778 | 0.8800 | 0.7368 | 0.6369 | 0.6352 |
| Fold4 | 0.9412 | 0.8182 | 1 | 1 | 0.9200 | 0.9000 | 0.8676 | 0.8589 |
| Fold5 | 0.8824 | 0.7500 | 1 | 1 | 0.8182 | 0.8571 | 0.7834 | 0.7606 |
| Average | 0.9000 | 0.7699 | 0.9833 | 0.9556 | 0.8694 | 0.8507 | 0.7879 | 0.7746 |
| Folds | Accuracy | Sensitivity | Specificity | PPV | NPV | F1 Score | MCC | Cohen’s Kappa |
|---|---|---|---|---|---|---|---|---|
| Fold1 | 1 | 1 | 1 | 1 | 1 | 1 | 1 | 1 |
| Fold2 | 0.8529 | 0.6154 | 1 | 1 | 0.8077 | 0.7619 | 0.7050 | 0.6640 |
| Fold3 | 0.8824 | 0.8000 | 0.9167 | 0.8000 | 0.9167 | 0.8000 | 0.7167 | 0.7167 |
| Fold4 | 0.7941 | 0.8182 | 0.7826 | 0.6429 | 0.9000 | 0.7200 | 0.5711 | 0.5609 |
| Fold5 | 0.9118 | 0.8125 | 1 | 1 | 0.8571 | 0.8966 | 0.8345 | 0.8211 |
| Average | 0.8882 | 0.8092 | 0.9399 | 0.8889 | 0.8963 | 0.8357 | 0.7655 | 0.7525 |
| Folds | Accuracy | Sensitivity | Specificity | PPV | NPV | F1 Score | MCC | Cohen’s Kappa |
|---|---|---|---|---|---|---|---|---|
| Fold1 | 0.9118 | 0.8333 | 1 | 1 | 0.8421 | 0.9091 | 0.8377 | 0.8247 |
| Fold2 | 0.8824 | 0.6923 | 1 | 1 | 0.8400 | 0.8182 | 0.7626 | 0.7354 |
| Fold3 | 0.8824 | 0.8000 | 0.9167 | 0.8000 | 0.9167 | 0.8000 | 0.7167 | 0.7167 |
| Fold4 | 0.9118 | 0.8182 | 0.9565 | 0.9000 | 0.9167 | 0.8571 | 0.7954 | 0.7935 |
| Fold5 | 0.8235 | 0.6875 | 0.9444 | 0.9167 | 0.7727 | 0.7857 | 0.6600 | 0.6408 |
| Average | 0.8824 | 0.7663 | 0.9635 | 0.9233 | 0.8576 | 0.8340 | 0.7545 | 0.7422 |
| Folds | Accuracy | Sensitivity | Specificity | PPV | NPV | F1 Score | MCC | Cohen’s Kappa |
|---|---|---|---|---|---|---|---|---|
| Fold1 | 0.9706 | 0.9444 | 1 | 1 | 0.9412 | 0.9714 | 0.9428 | 0.9412 |
| Fold2 | 0.8824 | 0.7692 | 0.9524 | 0.9091 | 0.8696 | 0.8333 | 0.7496 | 0.7434 |
| Fold3 | 0.8529 | 0.7000 | 0.9167 | 0.7778 | 0.88000 | 0.7368 | 0.6369 | 0.6352 |
| Fold4 | 0.9412 | 0.9091 | 0.9565 | 0.9091 | 0.9565 | 0.9091 | 0.8656 | 0.8656 |
| Fold5 | 0.8235 | 0.6875 | 0.9444 | 0.9167 | 0.7727 | 0.7857 | 0.6600 | 0.6408 |
| Average | 0.8941 | 0.8021 | 0.9540 | 0.9025 | 0.8840 | 0.8473 | 0.7710 | 0.7652 |
| Folds | Accuracy | Sensitivity | Specificity | PPV | NPV | F1 Score | MCC | Cohen’s Kappa |
|---|---|---|---|---|---|---|---|---|
| Fold1 | 0.9412 | 0.8889 | 1 | 1 | 0.8889 | 0.9412 | 0.8889 | 0.8828 |
| Fold2 | 0.8824 | 0.6923 | 1 | 1 | 0.8400 | 0.8182 | 0.7626 | 0.7354 |
| Fold3 | 0.7941 | 0.8000 | 0.7917 | 0.6154 | 0.9048 | 0.6957 | 0.5548 | 0.5441 |
| Fold4 | 0.9706 | 0.9091 | 1 | 1 | 0.9583 | 0.9524 | 0.9334 | 0.9312 |
| Fold5 | 0.8824 | 0.8125 | 0.9444 | 0.9286 | 0.8500 | 0.8667 | 0.7677 | 0.7622 |
| Average | 0.8941 | 0.8206 | 0.9472 | 0.9088 | 0.8884 | 0.8548 | 0.7815 | 0.7711 |
| Models | Accuracy | Sensitivity | Specificity | Precision | Dice Score | Jaccard Index | MCC |
|---|---|---|---|---|---|---|---|
| U-Net | 0.9918 | 0.8599 | 0.9957 | 0.8423 | 0.8467 | 0.7454 | 0.8448 |
| ResUnet-a | 0.9915 | 0.8101 | 0.9968 | 0.8716 | 0.8348 | 0.7285 | 0.8337 |
| UNet++ | 0.9881 | 0.8974 | 0.9908 | 0.7274 | 0.7966 | 0.6740 | 0.7988 |
| Task | Models | Accuracy | Sensitivity | Specificity | PPV | NPV | F1 Score | MCC | Cohen’s Kappa |
|---|---|---|---|---|---|---|---|---|---|
| Normal and Stenosis | Densenet201 | 0.9000 | 0.7699 | 0.9833 | 0.9556 | 0.8694 | 0.8507 | 0.7879 | 0.7746 |
| EfficientNet-B0 | 0.8882 | 0.8092 | 0.9399 | 0.8889 | 0.8963 | 0.8357 | 0.7655 | 0.7525 | |
| MobileNet-v2 | 0.8824 | 0.7663 | 0.9635 | 0.9233 | 0.8576 | 0.8340 | 0.7545 | 0.7422 | |
| ResNet101 | 0.8941 | 0.8021 | 0.9540 | 0.9025 | 0.8840 | 0.8473 | 0.7710 | 0.7652 | |
| Xception | 0.8941 | 0.8206 | 0.9472 | 0.9088 | 0.8884 | 0.8548 | 0.7815 | 0.7711 |
Disclaimer/Publisher’s Note: The statements, opinions and data contained in all publications are solely those of the individual author(s) and contributor(s) and not of MDPI and/or the editor(s). MDPI and/or the editor(s) disclaim responsibility for any injury to people or property resulting from any ideas, methods, instructions or products referred to in the content. |
© 2023 by the authors. Licensee MDPI, Basel, Switzerland. This article is an open access article distributed under the terms and conditions of the Creative Commons Attribution (CC BY) license (https://creativecommons.org/licenses/by/4.0/).
Share and Cite
Kaba, Ş.; Haci, H.; Isin, A.; Ilhan, A.; Conkbayir, C. The Application of Deep Learning for the Segmentation and Classification of Coronary Arteries. Diagnostics 2023, 13, 2274. https://doi.org/10.3390/diagnostics13132274
Kaba Ş, Haci H, Isin A, Ilhan A, Conkbayir C. The Application of Deep Learning for the Segmentation and Classification of Coronary Arteries. Diagnostics. 2023; 13(13):2274. https://doi.org/10.3390/diagnostics13132274
Chicago/Turabian StyleKaba, Şerife, Huseyin Haci, Ali Isin, Ahmet Ilhan, and Cenk Conkbayir. 2023. "The Application of Deep Learning for the Segmentation and Classification of Coronary Arteries" Diagnostics 13, no. 13: 2274. https://doi.org/10.3390/diagnostics13132274