

A Combined Method for Diabetes Mellitus Diagnosis Using Deep Learning, Singular Value Decomposition, and Self-Organizing Map Approaches

 ,
,
Abstract
:1. Introduction
2. Literature Review
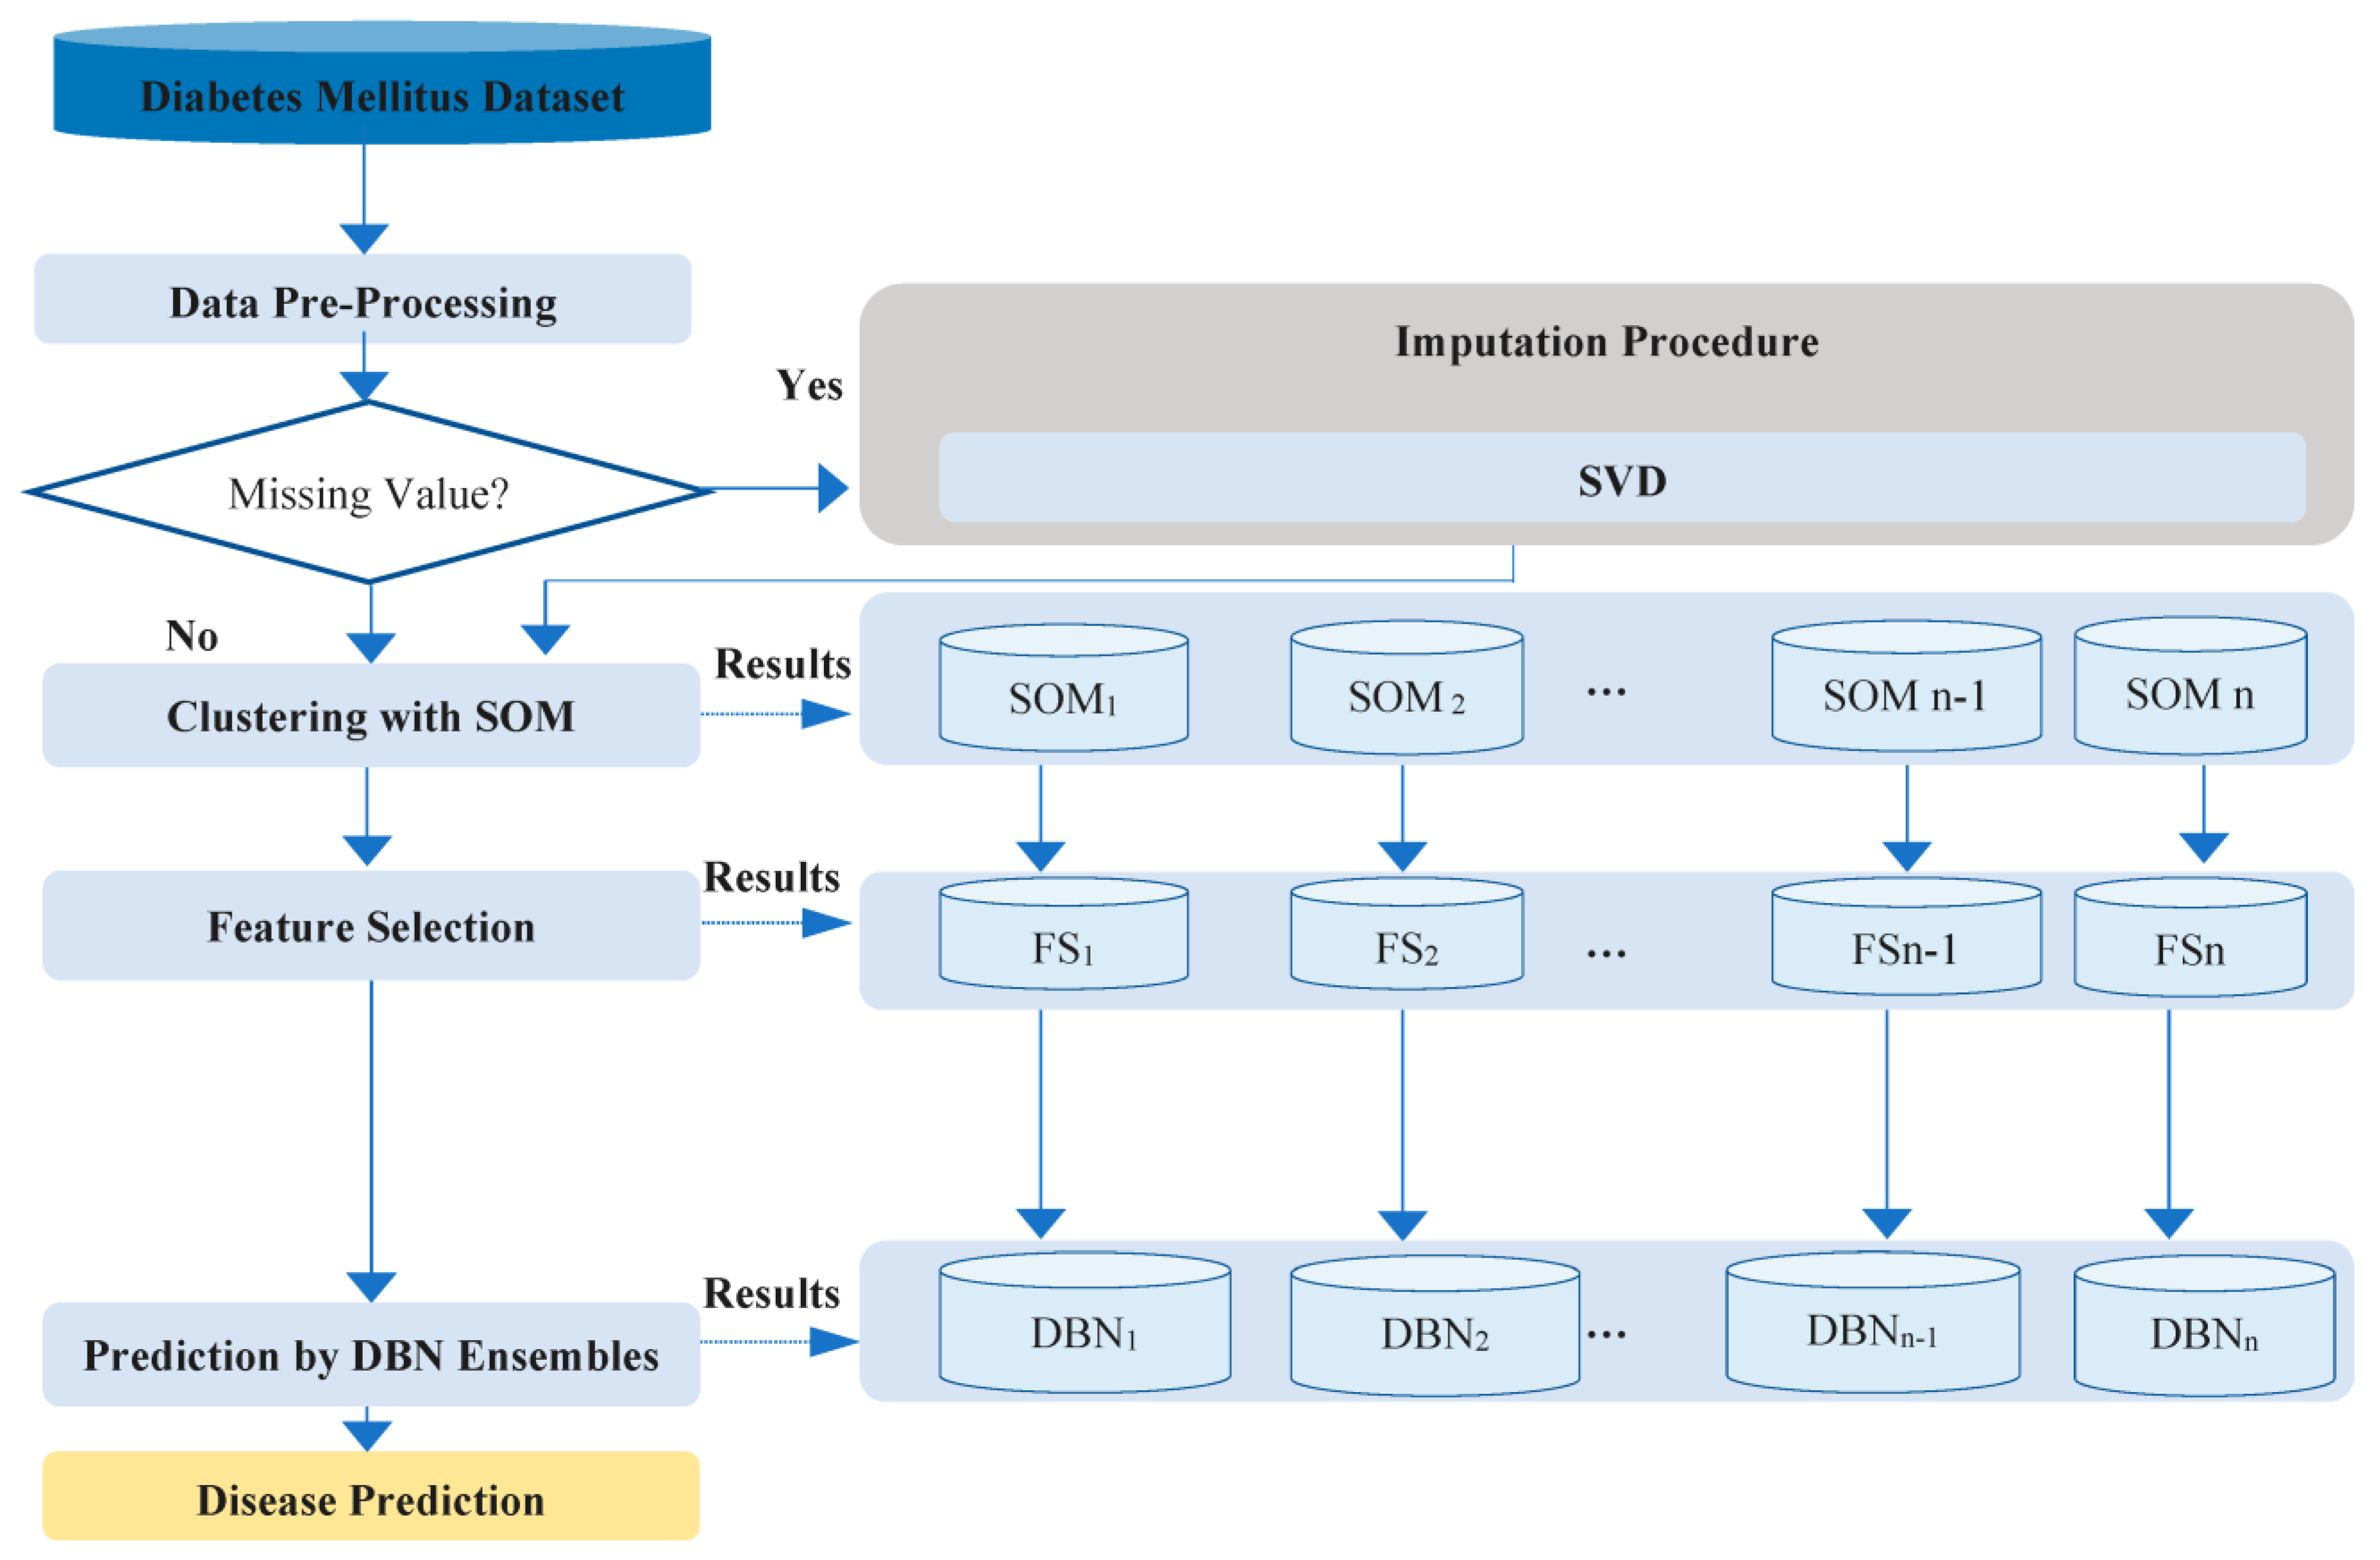
3. Methods
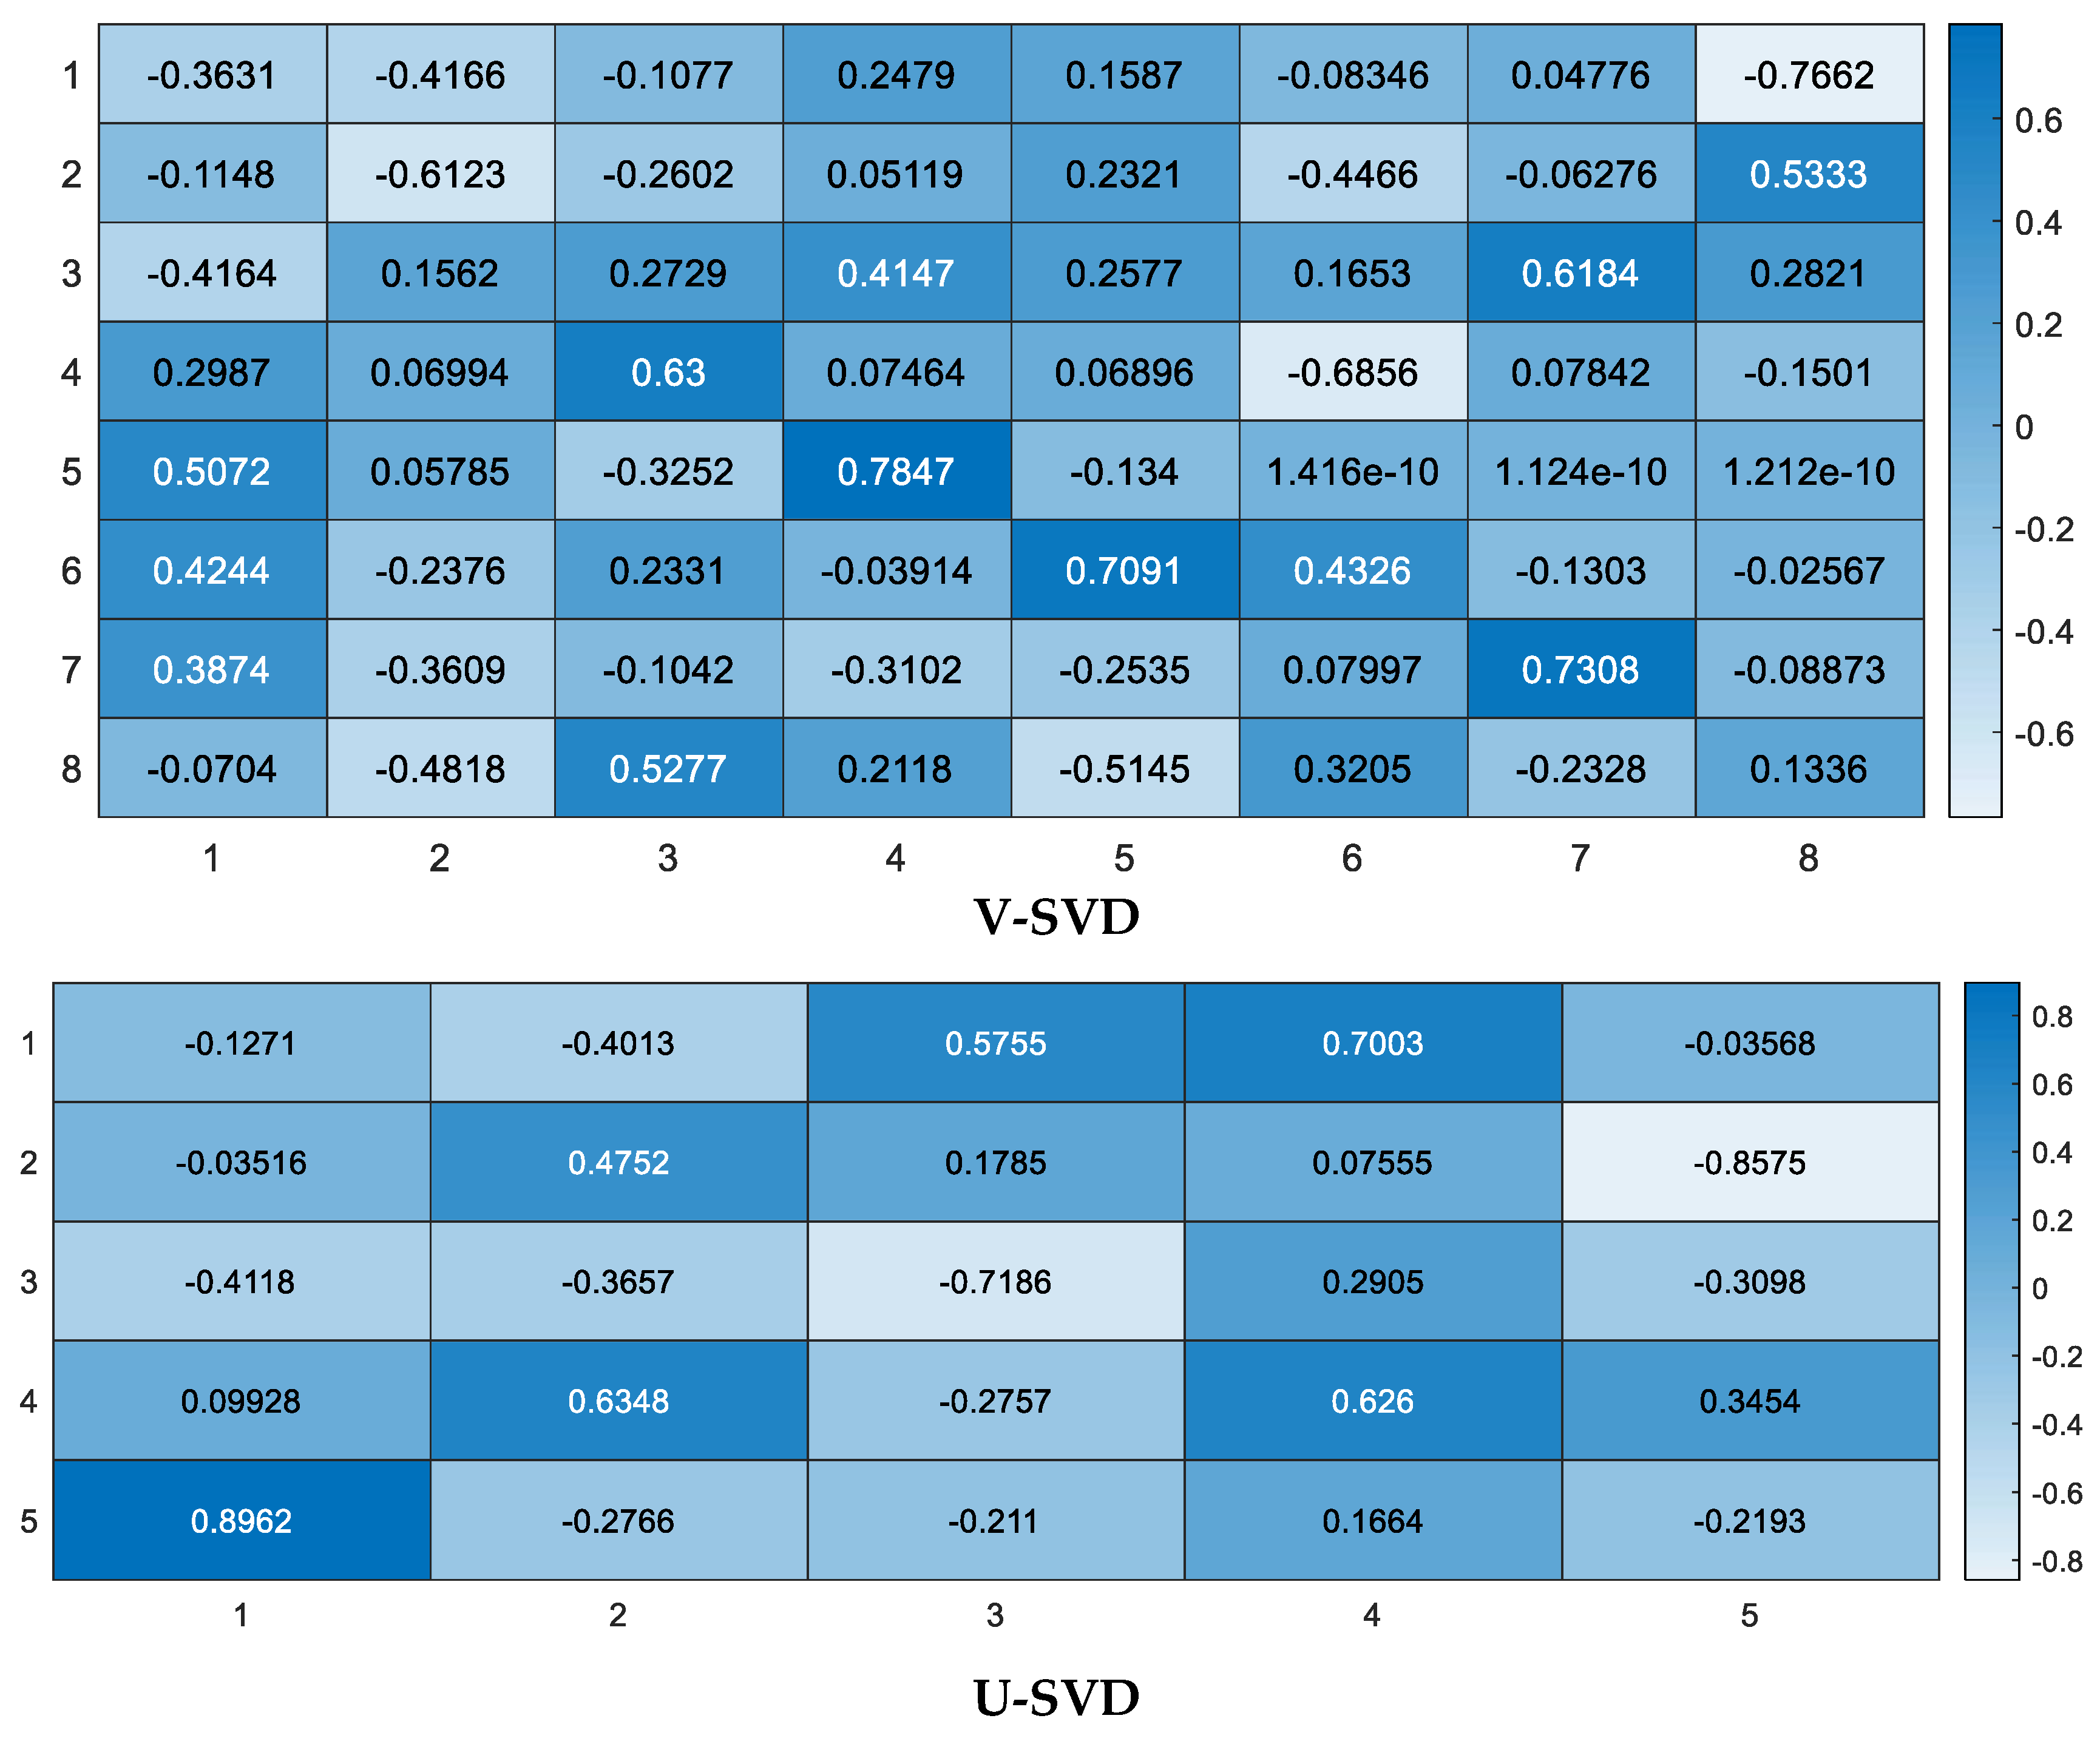
3.1. SVD
| Algorithm 1: Missing value prediction by SVD. |
| →Converting data to the dense matrix
. →Normalization using , where is the average value and indicate the SD for . → SVD technique on Z is applied. → is computed for approximation of Z. → Missing value is calculated using . |
3.2. SOM
3.3. DBN Technique
3.4. Featured Selection by STEPDISC
4. Dataset
5. Results and Methods Comparison
6. Discussion
7. Conclusions
Author Contributions
Funding
Institutional Review Board Statement
Informed Consent Statement
Data Availability Statement
Conflicts of Interest
Appendix A

| Abbreviation | Description |
|---|---|
| ACC | Accuracy |
| ANN | Artificial Neural Network |
| ACO | Ant Colony Optimization |
| ANFIS | Adaptive Network Based Fuzzy Inference System |
| AIS | Artificial immune systems |
| CGM | Continuous Glucose Monitoring |
| BMI | Body Mass Index |
| CM | Confusion Matrix |
| CNN | Convolutional Neural Network |
| CNN-LSTM | Convolutional Neural Network Long Short-term Memory |
| Conv-LSTM | Convolutional Long Short-term Memory |
| DBN | Deep Belief Network |
| DD | Diabetes Disease |
| DDA | Diabetic Data Acquisition |
| DDC | Diabetic Data Classification |
| DIM | Diabetes Infection Measure |
| DM | Diabetes Mellitus |
| DME | Diabetic Mining and Extraction |
| DPDM | Diabetic Prediction and Decision Making |
| DT | Decision Trees |
| SD | Standard Deviation |
| FF | Farthest First |
| FNN | Fuzzy Neural Network |
| GC | Gaussian Classification |
| GDA | Discriminant Analysis |
| GP | Genetic Programming |
| GP-CPS | GP with comparative partner selection |
| IGT | Impaired Glucose Tolerance |
| K-NN | K-Nearest Neighbor |
| KAIMRCD | King Abdullah International Research Centre Diabetes |
| LDA–MWSVM | Morlet Wavelet Support Vector Machine Classifier |
| LDA | Linear Discriminant Analysis |
| LM | Levenberg–Marquardt |
| LoDI | Level of Diabetic Infection |
| LS-SVM | Least Squares Support Vector Machine |
| ML | Machine Learning |
| ML | Machine Learning |
| ML | Expectation Maximization, |
| MLNN | Multilayer Neural Network |
| NB | Naive Bayes |
| NN | Neural Network |
| NPV | Negative Predictive Value |
| PCA | Principle Component Analysis |
| PID | Pima Indian Diabetes |
| PK-SVM | Polynomial Kernel-Support Vector Machine |
| PNN | Probabilistic Neural Network |
| PPV | Positive Predictive Value |
| PR | Precision |
| ROC | Receiver Operating Characteristic |
| REC | Recall |
| RBFNN | Radial Basis Function Neural Networks |
| RNN | Recurrent Neural Network |
| SE | Sensitivity |
| SMO | Sequential Minimal Optimization |
| SOM | Self-Organizing Map |
| SP | Specificity |
| SVM | Support Vector Machine |
| SW-FFANN | Small-World Feed Forward Artificial Neural Network |
| TP-DL | Temporal Predictive Deep Learning |
| T2D | Type 2 Diabetes |
| T-LSTM | Traditional Long Short-term Memory |
| UbD | Urine-based Diabetes |
References
- Mukherjee, S.; Decina, P.; Bocola, V.; Saraceni, F.; Scapicchio, P. Diabetes mellitus in schizophrenic patients. Compr. Psychiatry 1996, 37, 68–73. [Google Scholar] [CrossRef]
- Tabish, S.A. Is diabetes becoming the biggest epidemic of the twenty-first century? Int. J. Health Sci. 2007, 1, V. [Google Scholar]
- Stewart, K.J.; Dobrosielski, D.A. Exercise, Adiposity, and Regional Fat Distribution. In Diabetes and Exercise; Springer: Berlin/Heidelberg, Germany, 2018; pp. 151–163. [Google Scholar]
- Pickup, J. Developing glucose sensors for in vivo use. Trends Biotechnol. 1993, 11, 285–291. [Google Scholar] [CrossRef] [PubMed]
- Ali, S.F.; Padhi, R. Optimal blood glucose regulation of diabetic patients using single network adaptive critics. Optim. Control. Appl. Methods 2011, 32, 196–214. [Google Scholar] [CrossRef]
- Newton, C.A.; Raskin, P. Diabetic ketoacidosis in type 1 and type 2 diabetes mellitus: Clinical and biochemical differences. Arch. Intern. Med. 2004, 164, 1925–1931. [Google Scholar] [CrossRef] [PubMed]
- Thunander, M.; Petersson, C.; Jonzon, K.; Fornander, J.; Ossiansson, B.; Torn, C.; Edvardsson, S.; Landin-Olsson, M. Incidence of type 1 and type 2 diabetes in adults and children in Kronoberg, Sweden. Diabetes Res. Clin. Pract. 2008, 82, 247–255. [Google Scholar] [CrossRef]
- Schäffler, A.; Büchler, C.; Müller-Ladner, U.; Herfarth, H.; Ehling, A.; Paul, G.; Schölmerich, J.; Zietz, B. Identification of variables influencing resistin serum levels in patients with type 1 and type 2 diabetes mellitus. Horm. Metab. Res. 2004, 36, 702–707. [Google Scholar] [CrossRef]
- Nayak, S.R.; Nayak, D.R.; Sinha, U.; Arora, V.; Pachori, R.B. Application of deep learning techniques for detection of COVID-19 cases using chest X-ray images: A comprehensive study. Biomed. Signal Process. Control. 2021, 64, 102365. [Google Scholar] [CrossRef]
- Alkady, W.; ElBahnasy, K.; Leiva, V.; Gad, W. Classifying COVID-19 based on amino acids encoding with machine learning algorithms. Chemom. Intell. Lab. Syst. 2022, 224, 104535. [Google Scholar] [CrossRef]
- Ahmadi, H.; Gholamzadeh, M.; Shahmoradi, L.; Nilashi, M.; Rashvand, P. Diseases diagnosis using fuzzy logic methods: A systematic and meta-analysis review. Comput. Methods Programs Biomed. 2018, 161, 145–172. [Google Scholar] [CrossRef]
- Arji, G.; Ahmadi, H.; Nilashi, M.; Rashid, T.A.; Ahmed, O.H.; Aljojo, N.; Zainol, A. Fuzzy logic approach for infectious disease diagnosis: A methodical evaluation, literature and classification. Biocybern. Biomed. Eng. 2019, 39, 937–955. [Google Scholar] [CrossRef] [PubMed]
- Ghane, M.; Ang, M.C.; Nilashi, M.; Sorooshian, S. Enhanced decision tree induction using evolutionary techniques for Parkinson’s disease classification. Biocybern. Biomed. Eng. 2022, 42, 902–920. [Google Scholar] [CrossRef]
- Nilashi, M.; Abumalloh, R.A.; Minaei-Bidgoli, B.; Samad, S.; Yousoof Ismail, M.; Alhargan, A.; Abdu Zogaan, W. Predicting parkinson’s disease progression: Evaluation of ensemble methods in machine learning. J. Healthc. Eng. 2022, 2022, 2793361. [Google Scholar] [CrossRef] [PubMed]
- Nilashi, M.; Abumalloh, R.A.; Yusuf, S.Y.M.; Thi, H.H.; Alsulami, M.; Abosaq, H.; Alyami, S.; Alghamdi, A. Early diagnosis of Parkinson’s disease: A combined method using deep learning and neuro-fuzzy techniques. Comput. Biol. Chem. 2023, 102, 107788. [Google Scholar] [CrossRef] [PubMed]
- Nilashi, M.; Ahmadi, H.; Shahmoradi, L.; Ibrahim, O.; Akbari, E. A predictive method for hepatitis disease diagnosis using ensembles of neuro-fuzzy technique. J. Infect. Public Health 2019, 12, 13–20. [Google Scholar] [CrossRef]
- Nilashi, M.; Ahmadi, H.; Sheikhtaheri, A.; Naemi, R.; Alotaibi, R.; Alarood, A.A.; Munshi, A.; Rashid, T.A.; Zhao, J. Remote tracking of Parkinson’s disease progression using ensembles of deep belief network and self-organizing map. Expert Syst. Appl. 2020, 159, 113562. [Google Scholar] [CrossRef]
- Nilashi, M.; bin Ibrahim, O.; Ahmadi, H.; Shahmoradi, L. An analytical method for diseases prediction using machine learning techniques. Comput. Chem. Eng. 2017, 106, 212–223. [Google Scholar] [CrossRef]
- Nilashi, M.; Bin Ibrahim, O.; Mardani, A.; Ahani, A.; Jusoh, A. A soft computing approach for diabetes disease classification. Health Inform. J. 2018, 24, 379–393. [Google Scholar] [CrossRef]
- Nilashi, M.; Ibrahim, O.; Samad, S.; Ahmadi, H.; Shahmoradi, L.; Akbari, E. An analytical method for measuring the Parkinson’s disease progression: A case on a Parkinson’s telemonitoring dataset. Measurement 2019, 136, 545–557. [Google Scholar] [CrossRef]
- Kononenko, I. Machine learning for medical diagnosis: History, state of the art and perspective. Artif. Intell. Med. 2001, 23, 89–109. [Google Scholar] [CrossRef]
- Palaniappan, R.; Sundaraj, K.; Ahamed, N.U. Machine learning in lung sound analysis: A systematic review. Biocybern. Biomed. Eng. 2013, 33, 129–135. [Google Scholar] [CrossRef]
- Bhatia, M.; Kaur, S.; Sood, S.K.; Behal, V. Internet of things-inspired healthcare system for urine-based diabetes prediction. Artif. Intell. Med. 2020, 107, 101913. [Google Scholar] [CrossRef] [PubMed]
- Rahman, M.; Islam, D.; Mukti, R.J.; Saha, I. A deep learning approach based on convolutional LSTM for detecting diabetes. Comput. Biol. Chem. 2020, 88, 107329. [Google Scholar] [CrossRef]
- Zhang, K.; Chai, Y.; Yang, S.X. Self-organizing feature map for cluster analysis in multi-disease diagnosis. Expert Syst. Appl. 2010, 37, 6359–6367. [Google Scholar] [CrossRef]
- Chen, M.C.; Chen, L.S.; Hsu, C.C.; Zeng, W.R. An information granulation based data mining approach for classifying imbalanced data. Inf. Sci. 2008, 178, 3214–3227. [Google Scholar] [CrossRef]
- Lai, Q.; Zhou, B.; Cui, Z.; An, X.; Zhu, L.; Cao, Z.; Liu, S.; Yu, B. Development of a metabolite-based deep learning algorithm for clinical precise diagnosis of the progression of diabetic kidney disease. Biomed. Signal Process. Control. 2023, 83, 104625. [Google Scholar] [CrossRef]
- Kannadasan, K.; Edla, D.R.; Kuppili, V. Type 2 diabetes data classification using stacked autoencoders in deep neural networks. Clin. Epidemiol. Glob. Health 2019, 7, 530–535. [Google Scholar] [CrossRef]
- Hayashi, Y.; Yukita, S. Rule extraction using Recursive-Rule extraction algorithm with J48graft combined with sampling selection techniques for the diagnosis of type 2 diabetes mellitus in the Pima Indian dataset. Inform. Med. Unlocked 2016, 2, 92–104. [Google Scholar] [CrossRef]
- Sisodia, D.; Sisodia, D.S. Prediction of diabetes using classification algorithms. Procedia Comput. Sci. 2018, 132, 1578–1585. [Google Scholar] [CrossRef]
- Nilashi, M.; Ibrahim, O.; Dalvi, M.; Ahmadi, H.; Shahmoradi, L. Accuracy improvement for diabetes disease classification: A case on a public medical dataset. Fuzzy Inf. Eng. 2017, 9, 345–357. [Google Scholar] [CrossRef]
- Amin, J.; Sharif, M.; Yasmin, M. A review on recent developments for detection of diabetic retinopathy. Scientifica 2016, 2016, 6838976. [Google Scholar] [CrossRef]
- Polat, K.; Güneş, S.; Arslan, A. A cascade learning system for classification of diabetes disease: Generalized discriminant analysis and least square support vector machine. Expert Syst. Appl. 2008, 34, 482–487. [Google Scholar] [CrossRef]
- Aslam, M.W.; Zhu, Z.; Nandi, A.K. Feature generation using genetic programming with comparative partner selection for diabetes classification. Expert Syst. Appl. 2013, 40, 5402–5412. [Google Scholar] [CrossRef]
- Kahramanli, H.; Allahverdi, N. Design of a hybrid system for the diabetes and heart diseases. Expert Syst. Appl. 2008, 35, 82–89. [Google Scholar] [CrossRef]
- Erkaymaz, O.; Ozer, M. Impact of small-world network topology on the conventional artificial neural network for the diagnosis of diabetes. Chaos Solitons Fractals 2016, 83, 178–185. [Google Scholar] [CrossRef]
- Ganji, M.F.; Abadeh, M.S. A fuzzy classification system based on Ant Colony Optimization for diabetes disease diagnosis. Expert Syst. Appl. 2011, 38, 14650–14659. [Google Scholar] [CrossRef]
- Dogantekin, E.; Dogantekin, A.; Avci, D.; Avci, L. An intelligent diagnosis system for diabetes on linear discriminant analysis and adaptive network based fuzzy inference system: LDA-ANFIS. Digit. Signal Process. 2010, 20, 1248–1255. [Google Scholar] [CrossRef]
- Temurtas, H.; Yumusak, N.; Temurtas, F. A comparative study on diabetes disease diagnosis using neural networks. Expert Syst. Appl. 2009, 36, 8610–8615. [Google Scholar] [CrossRef]
- Polat, K.; Güneş, S. An expert system approach based on principal component analysis and adaptive neuro-fuzzy inference system to diagnosis of diabetes disease. Digit. Signal Process. 2007, 17, 702–710. [Google Scholar] [CrossRef]
- Çalişir, D.; Doğantekin, E. An automatic diabetes diagnosis system based on LDA-Wavelet Support Vector Machine Classifier. Expert Syst. Appl. 2011, 38, 8311–8315. [Google Scholar] [CrossRef]
- Kayaer, K.; Yildirim, T. Medical diagnosis on Pima Indian diabetes using general regression neural networks. In Proceedings of the International Conference on Artificial Neural Networks and Neural Information Processing (ICANN/ICONIP), Istanbul, Turkey, 26–29 June 2003. [Google Scholar]
- Edla, D.R.; Cheruku, R. Diabetes-finder: A bat optimized classification system for type-2 diabetes. Procedia Comput. Sci. 2017, 115, 235–242. [Google Scholar] [CrossRef]
- Cheruku, R.; Edla, D.R.; Kuppili, V. Diabetes classification using radial basis function network by combining cluster validity index and bat optimization with novel fitness function. Int. J. Comput. Intell. Syst. 2017, 10, 247–265. [Google Scholar] [CrossRef]
- Cruz, D.P.F.; Maia, R.D.; da Silva, L.A.; de Castro, L.N. BeeRBF: A bee-inspired data clustering approach to design RBF neural network classifiers. Neurocomputing 2016, 172, 427–437. [Google Scholar] [CrossRef]
- Khan, N.; Gaurav, D.; Kandl, T. Performance evaluation of Levenberg-Marquardt technique in error reduction for diabetes condition classification. Procedia Comput. Sci. 2013, 18, 2629–2637. [Google Scholar] [CrossRef]
- Maniruzzaman, M.; Kumar, N.; Abedin, M.M.; Islam, M.S.; Suri, H.S.; El-Baz, A.S.; Suri, J.S. Comparative approaches for classification of diabetes mellitus data: Machine learning paradigm. Comput. Methods Programs Biomed. 2017, 152, 23–34. [Google Scholar] [CrossRef]
- Bozkurt, M.R.; Yurtay, N.; Yilmaz, Z.; Sertkaya, C. Comparison of different methods for determining diabetes. Turk. J. Electr. Eng. Comput. Sci. 2014, 22, 1044–1055. [Google Scholar] [CrossRef]
- Kumari, V.A.; Chitra, R. Classification of diabetes disease using support vector machine. Int. J. Eng. Res. Appl. 2013, 3, 1797–1801. [Google Scholar]
- Alhassan, Z.; McGough, A.S.; Alshammari, R.; Daghstani, T.; Budgen, D.; Al Moubayed, N. Type-2 diabetes mellitus diagnosis from time series clinical data using deep learning models. In International Conference on Artificial Neural Networks; Springer: Berlin/Heidelberg, Germany, 2018. [Google Scholar]
- Longato, E.; Acciaroli, G.; Facchinetti, A.; Hakaste, L.; Tuomi, T.; Maran, A.; Sparacino, G. Glycaemic variability-based classification of impaired glucose tolerance vs. type 2 diabetes using continuous glucose monitoring data. Comput. Biol. Med. 2018, 96, 141–146. [Google Scholar] [CrossRef]
- Devi, R.D.H.; Bai, A.; Nagarajan, N. A novel hybrid approach for diagnosing diabetes mellitus using farthest first and support vector machine algorithms. Obes. Med. 2020, 17, 100152. [Google Scholar] [CrossRef]
- Kohonen, T. Self-Organizing Maps; Springer Science & Business Media: Berlin/Heidelberg, Germany, 2012; Volume 30. [Google Scholar]
- Kohonen, T. Exploration of very large databases by self-organizing maps. In Proceedings of the International Conference on Neural Networks (Icnn’97), Houston, TX, USA, 9–12 June 1997; IEEE: Piscataway, NJ, USA, 1997. [Google Scholar]
- Ahani, A.; Nilashi, M.; Yadegaridehkordi, E.; Sanzogni, L.; Tarik, A.R.; Knox, K.; Samad, S.; Ibrahim, O. Revealing customers’ satisfaction and preferences through online review analysis: The case of Canary Islands hotels. J. Retail. Consum. Serv. 2019, 51, 331–343. [Google Scholar] [CrossRef]
- Ahani, A.; Nilashi, M.; Ibrahim, O.; Sanzogni, L.; Weaven, S. Market segmentation and travel choice prediction in Spa hotels through TripAdvisor’s online reviews. Int. J. Hosp. Manag. 2019, 80, 52–77. [Google Scholar] [CrossRef]
- Ahmadi, N.; Nilashi, M.; Minaei-Bidgoli, B.; Farooque, M.; Samad, S.; Aljehane, N.O.; Zogaan, W.A.; Ahmadi, H. Eye State Identification Utilizing EEG Signals: A Combined Method Using Self-Organizing Map and Deep Belief Network. Sci. Program. 2022, 2022, 4439189. [Google Scholar] [CrossRef]
- Nilashi, M.; Abumalloh, R.A.; Samad, S.; Minaei-Bidgoli, B.; Thi, H.H.; Alghamdi, O.A.; Ismail, M.Y.; Ahmadi, H. The impact of multi-criteria ratings in social networking sites on the performance of online recommendation agents. Telemat. Inform. 2023, 76, 101919. [Google Scholar] [CrossRef]
- Nilashi, M.; Abumalloh, R.A.; Zibarzani, M.; Samad, S.; Zogaan, W.A.; Ismail, M.Y.; Mohd, S.; Akib, N.A.M. What Factors Influence Students Satisfaction in Massive Open Online Courses? Findings from User-Generated Content Using Educational Data Mining. Educ. Inf. Technol. 2022, 27, 9401–9435. [Google Scholar] [CrossRef]
- Nilashi, M.; Fallahpour, A.; Wong, K.Y.; Ghabban, F. Customer satisfaction analysis and preference prediction in historic sites through electronic word of mouth. Neural Comput. Appl. 2022, 34, 13867–13881. [Google Scholar] [CrossRef]
- Nilashi, M.; Minaei-Bidgoli, B.; Alghamdi, A.; Alrizq, M.; Alghamdi, O.; Nayer, F.K.; Aljehane, N.O.; Khosravi, A.; Mohd, S. Knowledge discovery for course choice decision in Massive Open Online Courses using machine learning approaches. Expert Syst. Appl. 2022, 199, 117092. [Google Scholar] [CrossRef]
- Mangiameli, P.; Chen, S.K.; West, D. A comparison of SOM neural network and hierarchical clustering methods. Eur. J. Oper. Res. 1996, 93, 402–417. [Google Scholar] [CrossRef]
- Vesanto, J.; Himberg, J.; Alhoniemi, E.; Parhankangas, J. Self-organizing map in Matlab: The SOM Toolbox. In Proceedings of the Matlab DSP Conference, Tampere, Finland, 16–17 November 1999. [Google Scholar]
- Hinton, G.E.; Osindero, S.; Teh, Y.-W. A fast learning algorithm for deep belief nets. Neural Comput. 2006, 18, 1527–1554. [Google Scholar] [CrossRef]
- Samui, S.; Chakrabarti, I.; Ghosh, S.K. Time–frequency masking based supervised speech enhancement framework using fuzzy deep belief network. Appl. Soft Comput. 2019, 74, 583–602. [Google Scholar] [CrossRef]
- Erhan, D.; Courville, A.; Bengio, Y.; Vincent, P. Why does unsupervised pre-training help deep learning? In Proceedings of the Thirteenth International Conference on Artificial Intelligence and Statistics, Sardinia, Italy, 13–15 May 2010.
- Chicati, M.L.; Nanni, M.R.; Cezar, E.; de Oliveira, R.B.; Chicati, M.S. Spectral classification of soils: A case study of Brazilian flooded soils. Remote Sens. Appl. Soc. Environ. 2017, 6, 39–45. [Google Scholar] [CrossRef]
- Baltzakis, H.; Papamarkos, N. A new signature verification technique based on a two-stage neural network classifier. Eng. Appl. Artif. Intell. 2001, 14, 95–103. [Google Scholar] [CrossRef]
- Sekhar, C.C.; Yegnanarayana, B. Neural network models for spotting stop consonant-vowel (SCV) segments in continuous speech. In Proceedings of the International Conference on Neural Networks (ICNN’96), Washington, DC, USA, 3–6 June 1996; IEEE: Piscataway, NJ, USA, 1996. [Google Scholar]
- Jou, I.-C.; Hu, M.-S.; Juang, Y.-T. Mandarin syllables recognition based on one class one net neural network with modified selective update algorithm. In Proceedings of the 1992 IEEE International Workshop on Intelligent Signal Processing and Communication Systems (1992), San Francisco, CA, USA, 23–26 March 1992; pp. 577–591. [Google Scholar]
- Zimmet, P.Z.; Magliano, D.J.; Herman, W.H.; Shaw, J.E. Diabetes: A 21st century challenge. Lancet Diabetes Endocrinol. 2014, 2, 56–64. [Google Scholar] [CrossRef] [PubMed]
- Hasslacher, C.H.; Ritz, E.; Wahl, P.; Michael, C. Similar risks of nephropathy in patients with type I or type II diabetes mellitus. Nephrol. Dial. Transplant. 1989, 4, 859–863. [Google Scholar] [CrossRef]
- Schwartz, W.B. Medicine and the computer: The promise and problems of change. In Use and Impact of Computers in Clinical Medicine; Springer: Berlin/Heidelberg, Germany, 1970; pp. 321–335. [Google Scholar]
- Shamir, R.R.; Dolber, T.; Noecker, A.M.; Walter, B.L.; McIntyre, C.C. Machine learning approach to optimizing combined stimulation and medication therapies for Parkinson’s disease. Brain Stimul. 2015, 8, 1025–1032. [Google Scholar] [CrossRef]
- Sundaram, M.; Smith, M.J.; Revicki, D.A.; Elswick, B.; Miller, L.A. Rasch analysis informed the development of a classification system for a diabetes-specific preference-based measure of health. J. Clin. Epidemiol. 2009, 62, 845–856. [Google Scholar] [CrossRef] [PubMed]
- Juniper, E.F.; Guyatt, G.H.; Jaeschke, R. How to develop and validate a new health-related quality of life instrument. In Quality of Life and Pharmacoeconomics in Clinical Trials, 2nd ed.; Spilker, B., Ed.; Lippincott-Raven Publishers: Philadelphia, PA, USA, 1996; pp. 49–56. [Google Scholar]
- Hamburg, B.A.; Inoff, G.E. Relationships between behavioral factors and diabetic control in children and adolescents: A camp study. Psychosom. Med. 1982, 44, 321–339. [Google Scholar] [CrossRef]
- Hruschka, E.R.; Ebecken, N.F. Extracting rules from multilayer perceptrons in classification problems: A clustering-based approach. Neurocomputing 2006, 70, 384–397. [Google Scholar] [CrossRef]
- Chen, C.-H. A hybrid intelligent model of analyzing clinical breast cancer data using clustering techniques with feature selection. Appl. Soft Comput. 2014, 20, 4–14. [Google Scholar] [CrossRef]
- Polat, K. Classification of Parkinson’s disease using feature weighting method on the basis of fuzzy C-means clustering. Int. J. Syst. Sci. 2012, 43, 597–609. [Google Scholar] [CrossRef]
- Faust, O.; Hagiwara, Y.; Hong, T.J.; Lih, O.S.; Acharya, U.R. Deep learning for healthcare applications based on physiological signals: A review. Comput. Methods Programs Biomed. 2018, 161, 1–13. [Google Scholar] [CrossRef]
- Pham, T.; Tran, T.; Phung, D.; Venkatesh, S. Predicting healthcare trajectories from medical records: A deep learning approach. J. Biomed. Inform. 2017, 69, 218–229. [Google Scholar] [CrossRef]
- Esteva, A.; Robicquet, A.; Ramsundar, B.; Kuleshov, V.; DePristo, M.; Chou, K.; Cui, C.; Corrado, G.; Thrun, S.; Dean, J. A guide to deep learning in healthcare. Nat. Med. 2019, 25, 24–29. [Google Scholar] [CrossRef]
- Liu, X.Q.; Li, B.X.; Zeng, G.R.; Liu, Q.Y.; Ai, D.M. Prediction of long non-coding RNAs based on deep learning. Genes 2019, 10, 273. [Google Scholar] [CrossRef]
- Miotto, R.; Wang, F.; Wang, S.; Jiang, X.; Dudley, J.T. Deep learning for healthcare: Review, opportunities and challenges. Brief. Bioinform. 2018, 19, 1236–1246. [Google Scholar] [CrossRef]


| SN | Attributes | Descriptions | Attributes Type | Mean ± SD |
|---|---|---|---|---|
| 1 | Pregnant | Number of times pregnant | Continuous | 3.84 ± 3.36 |
| 2 | Glucose | Plasma glucose (2 h) | Continuous | 121.67 ± 30.46 |
| 3 | Pressure | Diastolic blood pressure (mm Hg) | Continuous | 72.38 ± 12.10 |
| 4 | Triceps | Triceps skin fold thickness (mm) | Continuous | 29.08 ± 8.89 |
| 5 | Insulin | Two hours serum-insulin (μ U/mL) | Continuous | 141.76 ± 89.10 |
| 6 | Mass | Body mass index (weight in kg/(height in m)2) | Continuous | 32.43 ± 6.88 |
| 7 | Pedigree | Diabetes pedigree function | Continuous | 0.47 ± 0.33 |
| 8 | Age | Age (years) | Continuous | 33.24 ± 11.76 |
| 9 | Class | Diabetic (500) vs. Control (268) | Categorical | - |
| Method | Reference | Accuracy |
|---|---|---|
| General Regression Neural Network | [42] | 80.21% |
| GDA-LSSVM | [33] | 79.16% |
| MWSVM | [41] | 89.74% |
| SW-FFANN | [36] | 91.66% |
| SOM + SVM | This study | 90.73% |
| SOM + LDA | This study | 91.83% |
| SOM + NN | This study | 84.62% |
| SOM + DBN Ensembles | This study | 98.32% |
Disclaimer/Publisher’s Note: The statements, opinions and data contained in all publications are solely those of the individual author(s) and contributor(s) and not of MDPI and/or the editor(s). MDPI and/or the editor(s) disclaim responsibility for any injury to people or property resulting from any ideas, methods, instructions or products referred to in the content. |
© 2023 by the authors. Licensee MDPI, Basel, Switzerland. This article is an open access article distributed under the terms and conditions of the Creative Commons Attribution (CC BY) license (https://creativecommons.org/licenses/by/4.0/).
Share and Cite
Nilashi, M.; Abumalloh, R.A.; Alyami, S.; Alghamdi, A.; Alrizq, M. A Combined Method for Diabetes Mellitus Diagnosis Using Deep Learning, Singular Value Decomposition, and Self-Organizing Map Approaches. Diagnostics 2023, 13, 1821. https://doi.org/10.3390/diagnostics13101821
Nilashi M, Abumalloh RA, Alyami S, Alghamdi A, Alrizq M. A Combined Method for Diabetes Mellitus Diagnosis Using Deep Learning, Singular Value Decomposition, and Self-Organizing Map Approaches. Diagnostics. 2023; 13(10):1821. https://doi.org/10.3390/diagnostics13101821
Chicago/Turabian StyleNilashi, Mehrbakhsh, Rabab Ali Abumalloh, Sultan Alyami, Abdullah Alghamdi, and Mesfer Alrizq. 2023. "A Combined Method for Diabetes Mellitus Diagnosis Using Deep Learning, Singular Value Decomposition, and Self-Organizing Map Approaches" Diagnostics 13, no. 10: 1821. https://doi.org/10.3390/diagnostics13101821