
A Novel Deep Learning-Based Classification Framework for COVID-19 Assisted with Weighted Average Ensemble Modeling
 , ,
, ,  and
and
Abstract
:1. Introduction
- Three CNN models, including ResNet50V2, were trained with a large amount of medical images. Both binary and multiclass classification systems were developed with better preprocessing and classification techniques. Hyperparameter tuning ensures the models’ efficiency, and each model offers promising results.
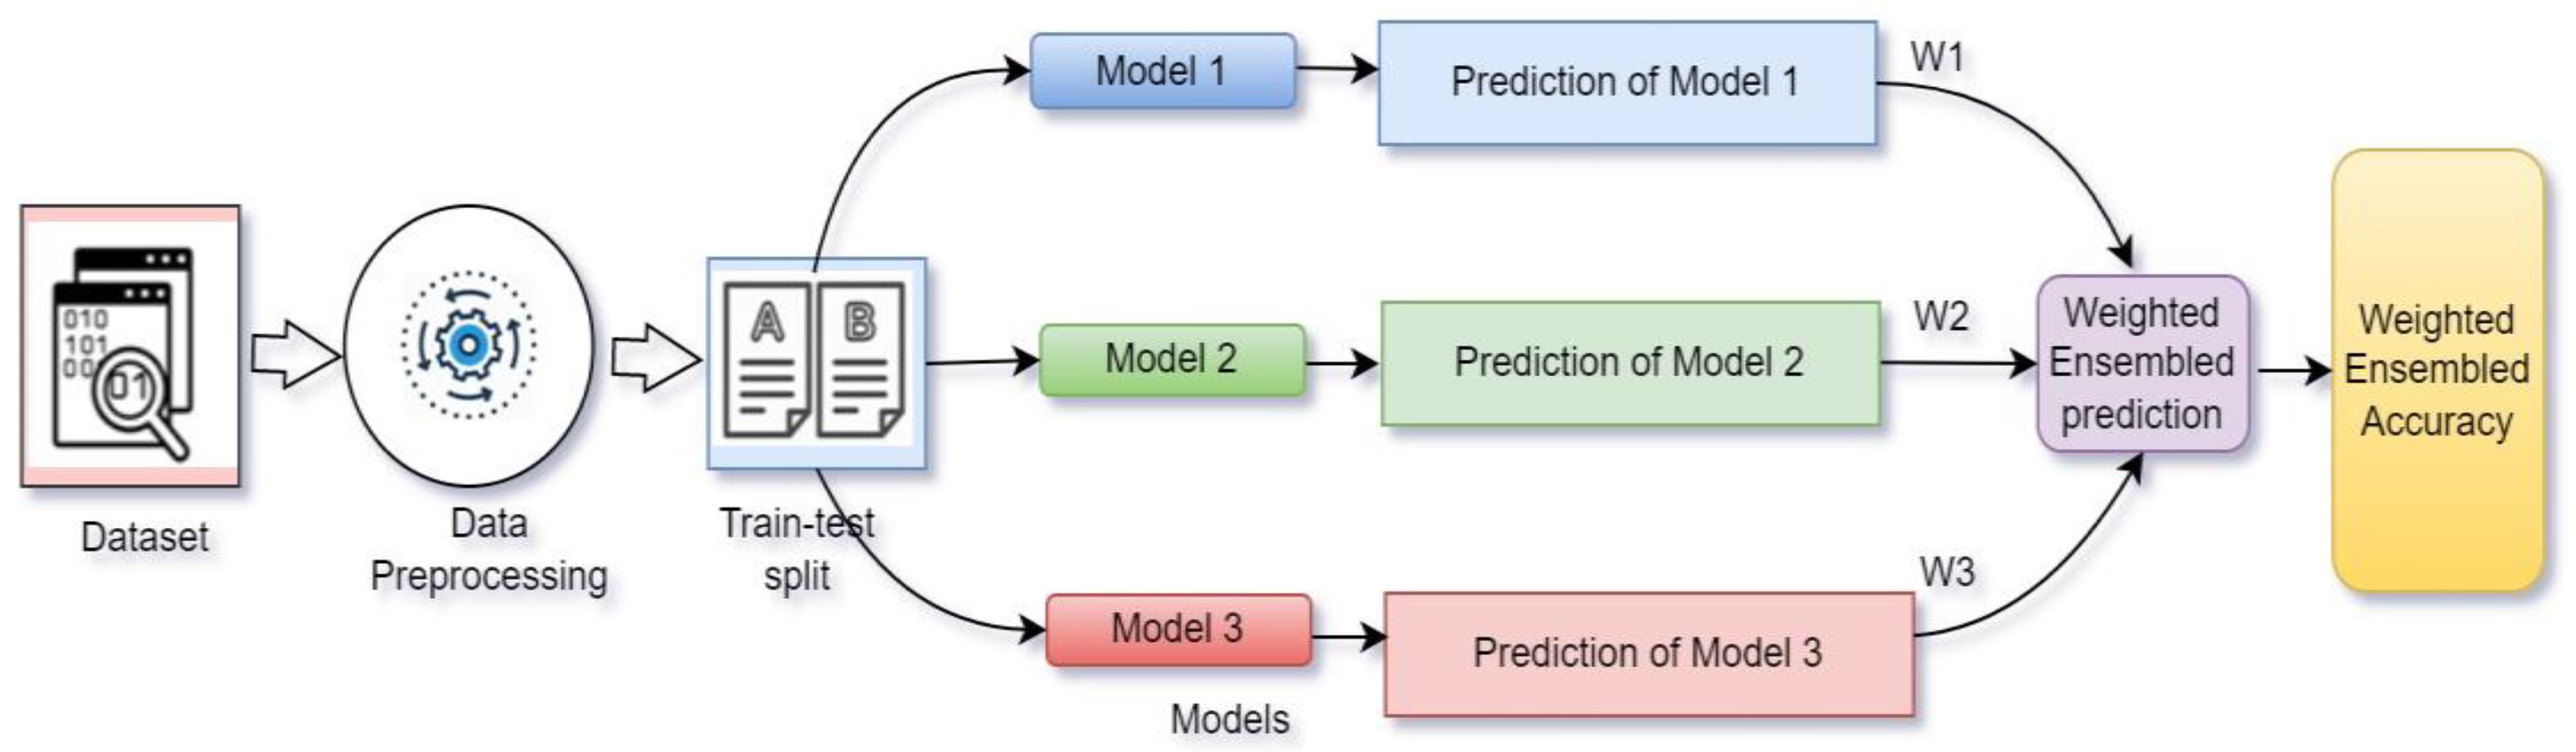
- The weighted average ensemble technique was implemented, where pretrained models were combined and weights were assigned according to the priority of the models. The proposed ensembled technique ensures higher accuracy than when using a single model.
- Experimental evaluations were performed and presented to support the work with proper justification. The performance of the proposed system was compared with state-of-the-art methods, and the proposed work comes up with better results and improved performance.
2. Related Work
3. Methodology
3.1. Problem Definition
3.2. Dataset Description
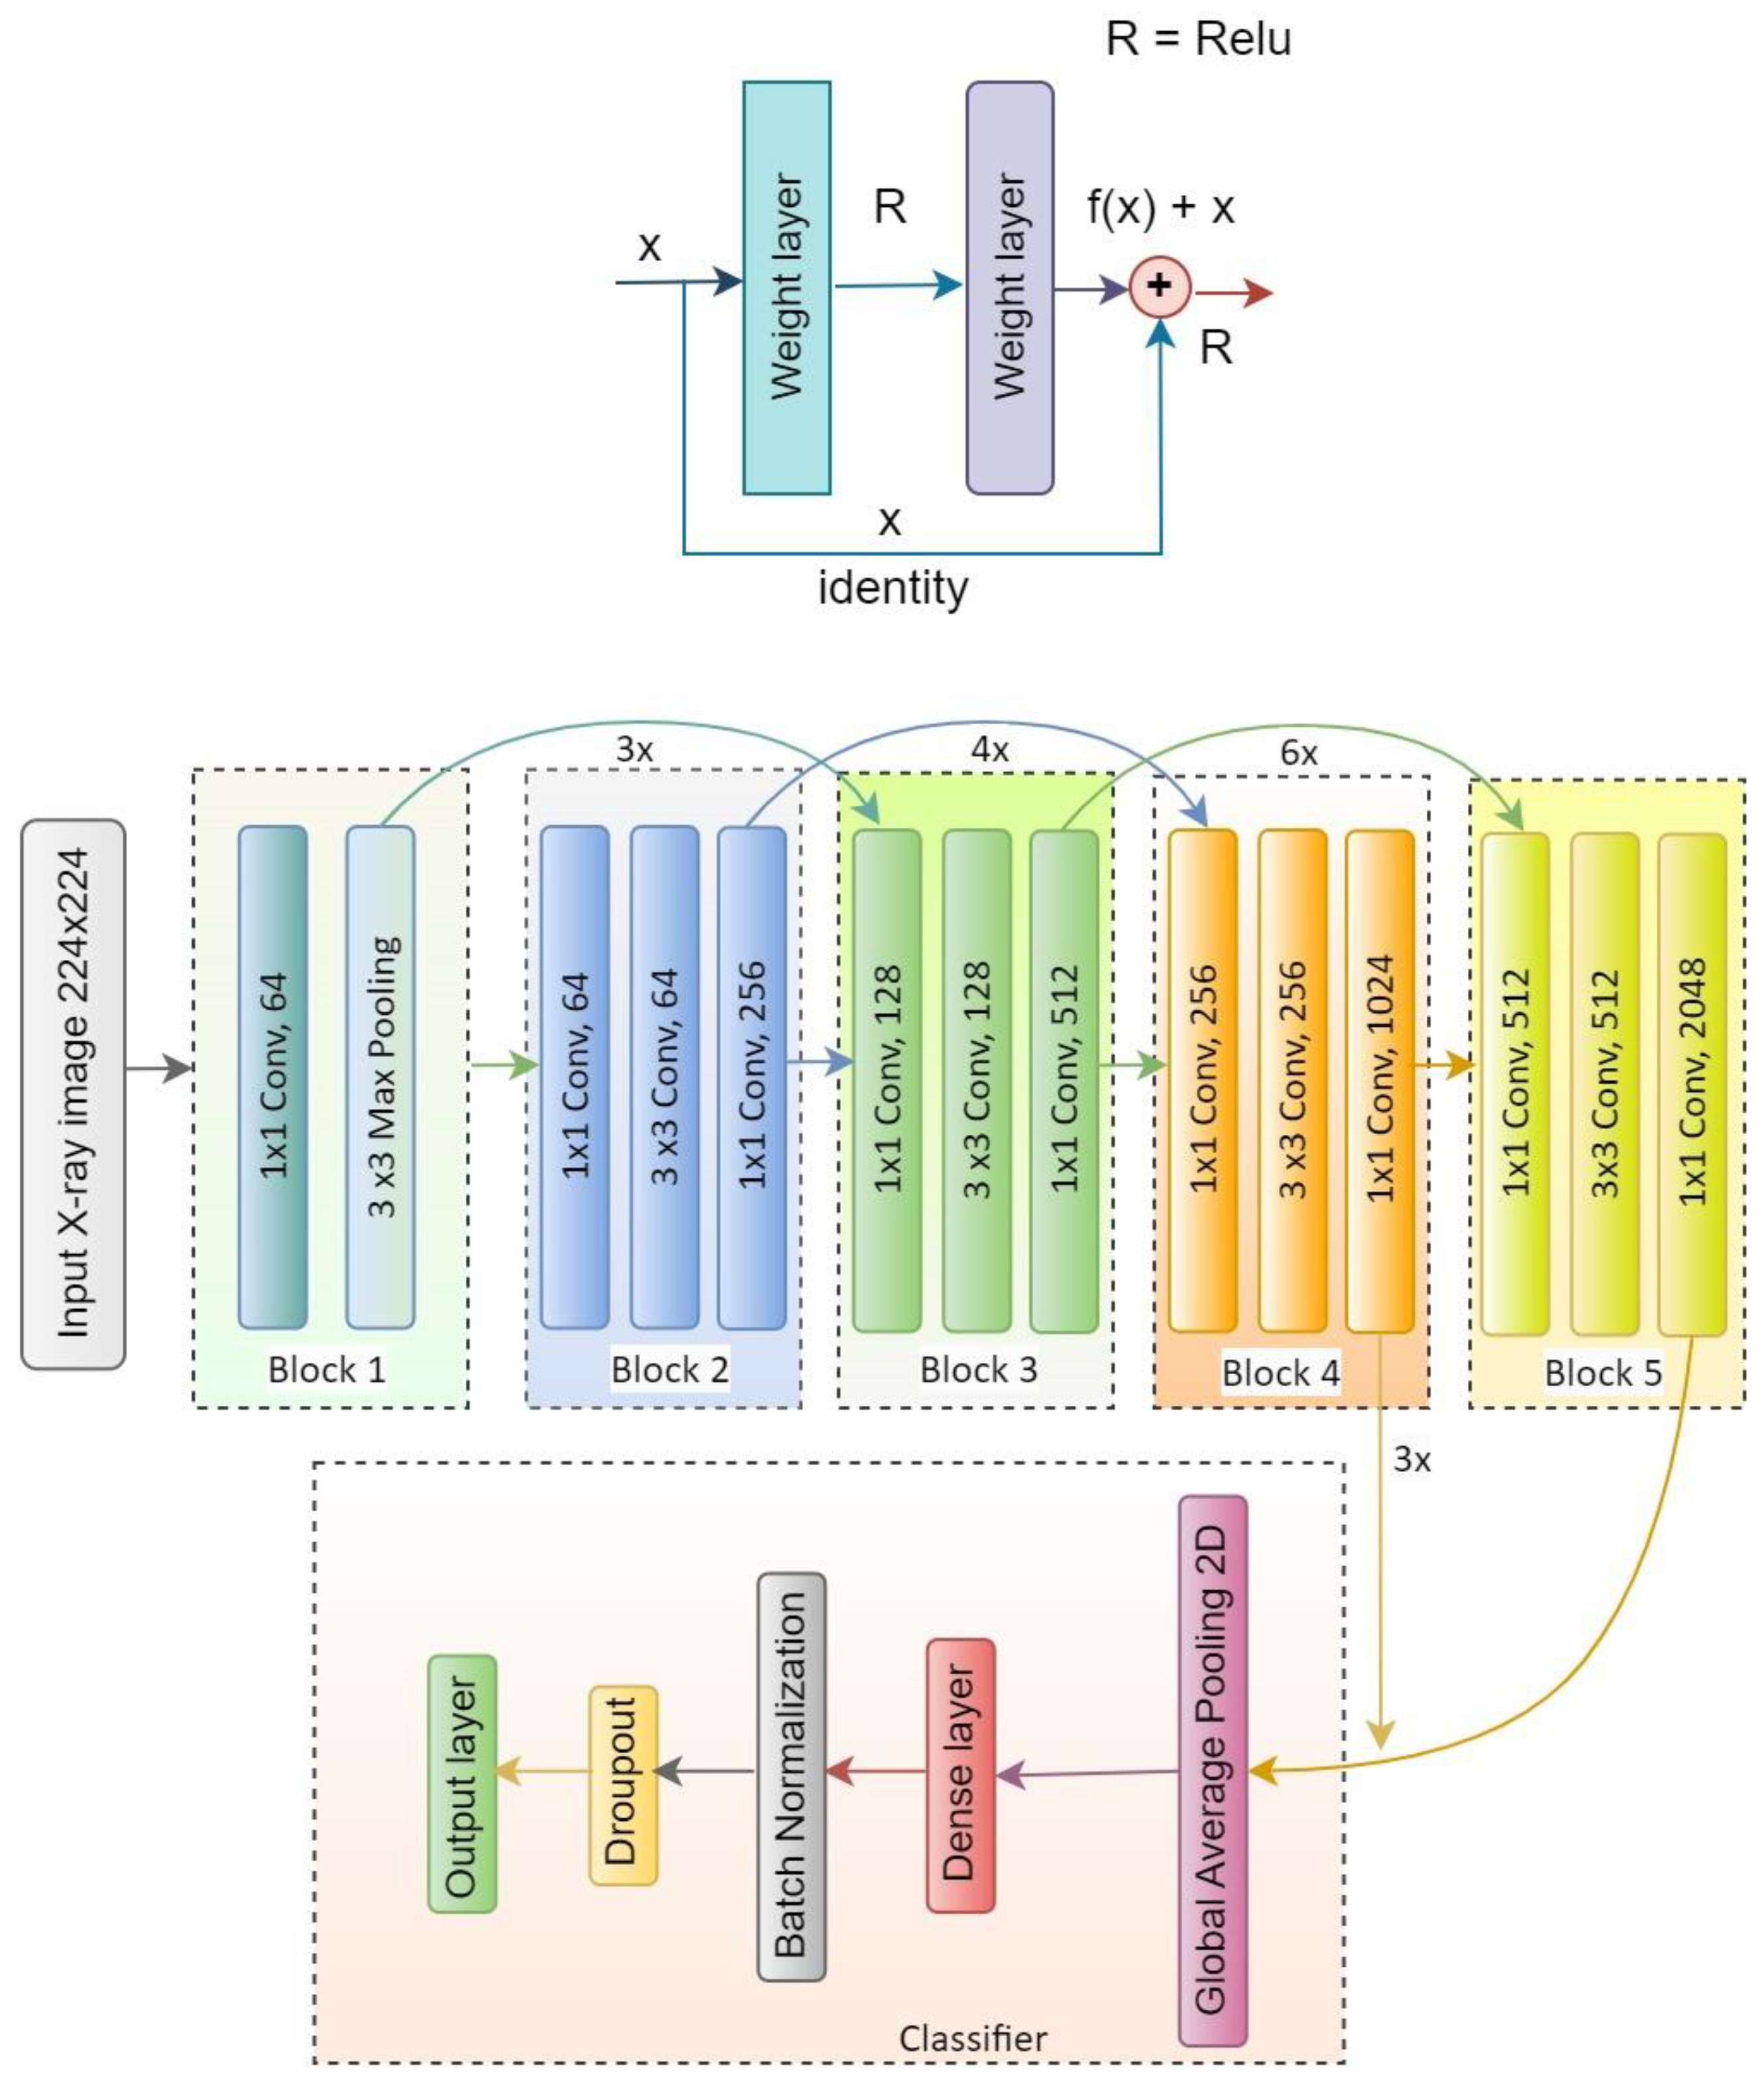
3.3. Deep Learning-Based Classification System
3.4. Microscopic Description of CNN Architecture
3.5. Weighted Average Ensemble
3.6. Working Functionality of the System
3.7. Proposed Algorithm
| Algorithm 1: Classification with Weighted Average Ensemble | |||
| Input: Chest X-ray images from the dataset | |||
| K: No. of epoch | |||
| M: number of models | |||
| Start | |||
| 1. | Get Dataset | ||
| 2. | Extend Zipfile | ||
| 3. | Split Data | ||
| 4. | Preprocess data | ||
| 5. | Set m to 0 | ||
| 6. | Do Model Train | ||
| 7. | Set Model | ||
| 8. | Set epoch to 0 | ||
| 9. | While epoch < k + 1 | ||
| 10. | Get Preprocessed image data | ||
| 11. | Apply Data Augmentation | ||
| 12. | Pass to Model | ||
| 13. | Get Accuracy_score | ||
| 14. | Get Validation Accuracy | ||
| 15. | Repeat Steps | ||
| 16. | End while | ||
| 17. | Save Model | ||
| 18. | Load Model | ||
| 19. | While m < 3 | ||
| 20. | Set pred1, Pred2, Pred3, WEPred to 0 | ||
| 21. | Pass input to Models | ||
| 22. | Get score of Pred1, Pred2, Pred3 | ||
| 23. | Set w1, w2 and w3 | ||
| 24. | Set WEP = ([w1, w2, w3].[Pred,1 Pred2, Pred3]) | ||
| 25. | Get Weighted Average Ensemble Accuracy_score | ||
| End | |||
3.8. Experimental Evaluation
4. Result and Discussion
4.1. Quantitative Analysis
4.2. Qualitative Analysis
5. Conclusions
Author Contributions
Funding
Institutional Review Board Statement
Informed Consent Statement
Data Availability Statement
Acknowledgments
Conflicts of Interest
References
- Areej, A.; Wahab, A.M.; Ashraf, Y.M. COVID-19 detection in X-ray images using CNN algorithm. In Proceedings of the International Conference on Promising Electronic Technologies (ICPET), Jerusalem, Palestine, 16–17 December 2020. [Google Scholar]
- Aparna, G.; Gowri, S.; Bharathi, R.; Vimali, J.S.; Jabez, J.; Ajitha, P. COVID-19 Prediction using X-ray Images. In Proceedings of the Fifth International Conference on Trends in Electronics and Informatics (ICOEI), Tirunelveli, India, 3–5 June 2021. [Google Scholar]
- Anooja, I.; Sreedevi, M. COVID-19 Detection from Chest Radiograph Images of Patients using Neural Networks. In Proceedings of the 8th International Conference on Advanced Computing and Communication Systems (ICACCS), Coimbatore, India, 25–26 March 2022. [Google Scholar]
- Haritha, D.; Swaroop, N.; Mounika, M. Prediction of COVID-19 Cases Using CNN with X-rays. In Proceedings of the 2020 5th International Conference on Computing, Communication and Security (ICCCS), Patna, India, 14–16 October 2020. [Google Scholar]
- Tawsifur, R.; Alex, A.; Muhammad, E.H.C.; Tarik, A.R.; Abdulkadir, S.; Amith, K.; Khandaker, R.I.; Aras, M.I. COV-ECGNET: COVID-19 detection using ECG trace images with deep convolutional neural network. Health Inf. Sci. Syst. 2022, 10, 1. [Google Scholar]
- Aysen, D.; Mete, A.; Mehmet, Y.; Serkan, K.; Muhammad, E.H.C.; Khalid, H.; Tahir, H.; Rashid, M.; Moncef, G. COVID-19 infection map generation and detection from chest X-ray images. Health Inf. Sci. Syst. 2021, 9, 15. [Google Scholar]
- Linda, W.; Zhong, Q.L.; Alexander, W. COVID-Net: A tailored deep convolutional neural network design for detection of COVID? 19 cases from chest X-ray images. Sci. Rep. 2020, 10, 19549. [Google Scholar]
- Arash, H.; Shiva, T.; Nima, J.N.; Mehmet, U. A privacy-aware method for COVID-19 detection in chest CT images using lightweight deep conventional neural network and blockchain. Comput. Biol. Med. 2022, 145, 105461. [Google Scholar]
- Muhammad, U.; Hoque, M.Z.; Oussalah, M.; Keskinarkaus, A.; Seppänen, T.; Sarder, P. SAM: Self-augmentation mechanism for COVID-19 detection using chest X-ray images. Knowl.-Based Syst. 2022, 241, 108207. [Google Scholar] [CrossRef] [PubMed]
- Ines, C.; Amira, E.; Rafik, K.; Wassim, Z.; Mohamed, G.; Ahmed, B.H. COVID-19 detection in CT and CXR images using deep learning models. Biogerontology 2022, 23, 65–84. [Google Scholar]
- Nasiri, H.; Hasani, S. Automated detection of COVID-19 cases from chest X-ray images using deep neural network and XGBoost. Radiography 2022, 28, 732–738. [Google Scholar] [CrossRef]
- Arpan, B.; Khalid, H.S.; Erik, C.; Ram, S. COVID-19 detection from CT scans using a two-stage framework. Expert Syst. Appl. 2022, 193, 116377. [Google Scholar]
- Zhou, C.; Song, J.; Zhou, S.; Zhang, Z.; Xing, J. COVID-19 Detection Based on Image Regrouping and Resnet-SVM Using Chest X-Ray Images. IEEE Access 2021, 9, 81902–81912. [Google Scholar] [CrossRef]
- Kong, L.; Cheng, J. Classification and detection of COVID-19 X-ray images based on DenseNet and VGG16 feature fusion. Biomed. Signal Process. Control 2022, 77, 103772. [Google Scholar] [CrossRef]
- Ronaldas, M.J.; Andi, S. Detection of CT-scan ling covid-19 image using Convolutional Network and CLACHE. In Proceedings of the 2020 3rd International Conference on Information and Communications Technology (ICOIACT), Yogyakarta, Indonesia, 24–25 November 2020. [Google Scholar]
- Terry, G. Chest X-ray image analysis and classification for COVID-19 pneumonia detection using Deep CNN. medRxiv 2020. [Google Scholar] [CrossRef]
- Loveleen, G.; Ujwal, B.; Jhanjhi, N.Z.; Ghulam, M.; Mehedi, M. Medical image-based detection of COVID-19 using Deep Convolution Neural Networks. Multimed. Syst. 2021. [Google Scholar] [CrossRef]
- Sohan, M.F.; Basalamah, A.; Solaiman, M. COVID-19 detection using machine learning: A large-scale assessment of X-ray and CT image datasets. J. Electron. Imaging 2022, 31, 041212. [Google Scholar] [CrossRef]
- Sushmithawathi, K.; Indra, P. Extraction of significant features using GLDM for COVID-19 prediction. J. Trends Comput. Sci. Smart Technol. 2021, 3, 287–293. [Google Scholar] [CrossRef]
- Shamima, A.; Javed, F.M.M.S.; Sovon, C.; Asif, K.; Sami, A. COVID-19 Detection Using Deep Learning Algorithm on Chest X-ray Images. Biology 2021, 10, 1174. [Google Scholar]
- Ali, N. Detection of COVID-19 Patients with Convolutional Neural Network Based Features on Multi-class X-ray Chest Images. In Proceedings of the 2020 Medical Technologies Congress (TIPTEKNO), Antalya, Turkey, 19–20 November 2020. [Google Scholar]
- Tuan, D.P. Classification of COVID?19 chest X-rays with deep learning: New models or fine tuning? Health Inf. Sci. Syst. 2021, 9, 2. [Google Scholar]
- Seyed, M.J.J.; Milad, A.; Sajad, A.; Rachid, H.; Abbas, K.; Saeid, N. X-ray image based COVID-19 detection using evolutionary deep learning approach. Expert Syst. Appl. 2022, 201, 116942. [Google Scholar]
- El-Kenawy, E.-S.M.; Ibrahim, A.; Mirjalili, S.; Eid, M.M.; Hussein, S.E. Novel Feature Selection and Voting Classifier Algorithms for COVID-19 Classification in CT Images. IEEE Access 2020, 8, 179317–179335. [Google Scholar] [CrossRef]
- Chang, J.; Cui, S.; Feng, M. DiCOVA-Net: Diagnosing COVID-19 using Acoustics based on Deep Residual Network for the DiCOVA Challenge 2021. arXiv 2021, arXiv:2107.06126v2. [Google Scholar]
- Yao, S.; Jun, L.; Xinghua, L.; Jinshan, T. COVID-19 Infection Segmentation and Severity Assessment Using a Self-Supervised Learning Approach. Diagnostics 2022, 12, 1805. [Google Scholar] [CrossRef]
- Shibaprasad, S.; Soumyajit, S.; Somnath, C.; Seyedali, M.; Ram, S. A bi-stage feature selection approach for COVID-19 predictionusing chest CT images. Appl. Intell. 2021, 51, 8985–9000. [Google Scholar] [CrossRef]
- Jiangeng, C.; Yucheng, R.; Cui, S.; John, S.T.Y.; Mengling, F. UFRC: A Unified Framework for Reliable COVID-19 Detection on Crowdsourced Cough Audio. In Proceedings of the 2022 44th Annual International Conference of the IEEE Engineering in Medicine & Biology Society (EMBC), Scottish Event Campus, Glasgow, UK, 11–15 July 2022. [Google Scholar]
- Fabricio, A.B. COVID-19 detection on Chest X-ray images: A comparison of CNN architectures and ensembles. Expert Syst. Appl. 2022, 204, 117549. [Google Scholar]
- Gaurav, S.; Aninditaa, C.; Mahesh, J.; Sandeep, C. CoviXNet: A novel and efficient deep learning model for detection of COVID-19 using chest X-Ray images. Biomed. Signal Process. Control 2022, 78, 103848. [Google Scholar]
- Shyni, H.M.; Chitra, E. A Comparative Study of X-Ray and CT Images in COVID-19 Detection Using Image Processing and Deep Learning techniques. Comput. Methods Programs Biomed. Update 2022, 2, 100054. [Google Scholar] [CrossRef] [PubMed]
- Mete, A.; Aysen, D.; Mehmet, Y.; Serkan, K.; Muhammad, E.H.C.; Khalid, H.; Tahir, H.; Rashid, M.; Moncef, G. Advance Warning Methodologies for COVID-19 Using Chest X-ray Images. IEEE Access 2021, 9, 41052–41065. [Google Scholar]
- Sumit, P.; Salil, B.; Khalid, M.; Mohamed, N.M.; Divya, A.; Osman, A.N. A Novel Ensemble Weight-Assisted Yolov5-Based Deep Learning Technique for the Localization and Detection of Malaria Parasites. Electronics 2022, 11, 3999. [Google Scholar] [CrossRef]
- Neha, R.; Bharat, S.H.; Mayank, M.; Soniya, L.; Rajesh, K. C-COVIDNet: A CNN Model for COVID-19 Detection Using Image Processing. Arab. J. Sci. Eng. 2022, 47, 10811–10822. [Google Scholar]
- Michael, J.H.; Subrata, C.; Manoranjan, P.; Anwaar, U.; Biswajeet, P.; Manash, S.; Nagesh, S. X-ray Image based COVID-19 Detection using Pre-trained Deep Learning Models. COVID-19 Detection through Transfer Learning using Multimodal Imaging Data. engrxiv 2020. [Google Scholar] [CrossRef]
- Vasilis, N.; Sebastiano, M.; Masoud, F.; Lampros, S.; Wolfgang, G. COVID-19 diagnosis from chest x rays: Developing a simple, fast, and accurate neural network. Health Inf. Sci. Syst. 2021, 9, 36. [Google Scholar]
- Tripti, G.; Murugan, R.; Seyedali, M.; Deba, K.C. OptCoNet: An optimized convolutional neural network for an automatic diagnosis of COVID-19. Appl. Intell. 2021, 51, 1351–1366. [Google Scholar] [CrossRef]
- He, J.; Zhu, Q.; Zhang, K.; Yu, P.; Tang, J. An evolvable adversarial network with gradient penalty for COVID-19 infection segmentation. Appl. Soft Comput. 2021, 113, 107947. [Google Scholar] [CrossRef] [PubMed]
- Shen, C.; Zhang, K.; Tang, J. A COVID-19 Detection Algorithm Using Deep Features and Discrete Social Learning Particle Swarm Optimization for Edge Computing Device. ACM Trans. Internet Technol. 2021, 22, 1–17. [Google Scholar] [CrossRef]


| Authors | Dataset Information | Important Remarks | Classification Type | Limitations |
|---|---|---|---|---|
| Areej et al. [1] | 550 chest X-ray images were used that were collected from Kaggle | Binary cross entropy (BCE) loss function was used for b. classification task. | Binary classification only | Only focused on binary classification, and no proper preprocessing techniques were mentioned. Comparison of the work was also missing. |
| Anooja et al. [3] | Chest X-ray dataset collected from Kaggle | Nicely compared the proposed work within the existing works, and accuracy obtained from the proposed system is also high. | Only binary classification | Fewer number instances were used to train the model, which may cause reliability issues. Multiclass classification is missing. The proposed system cannot detect other diseases except COVID-19. |
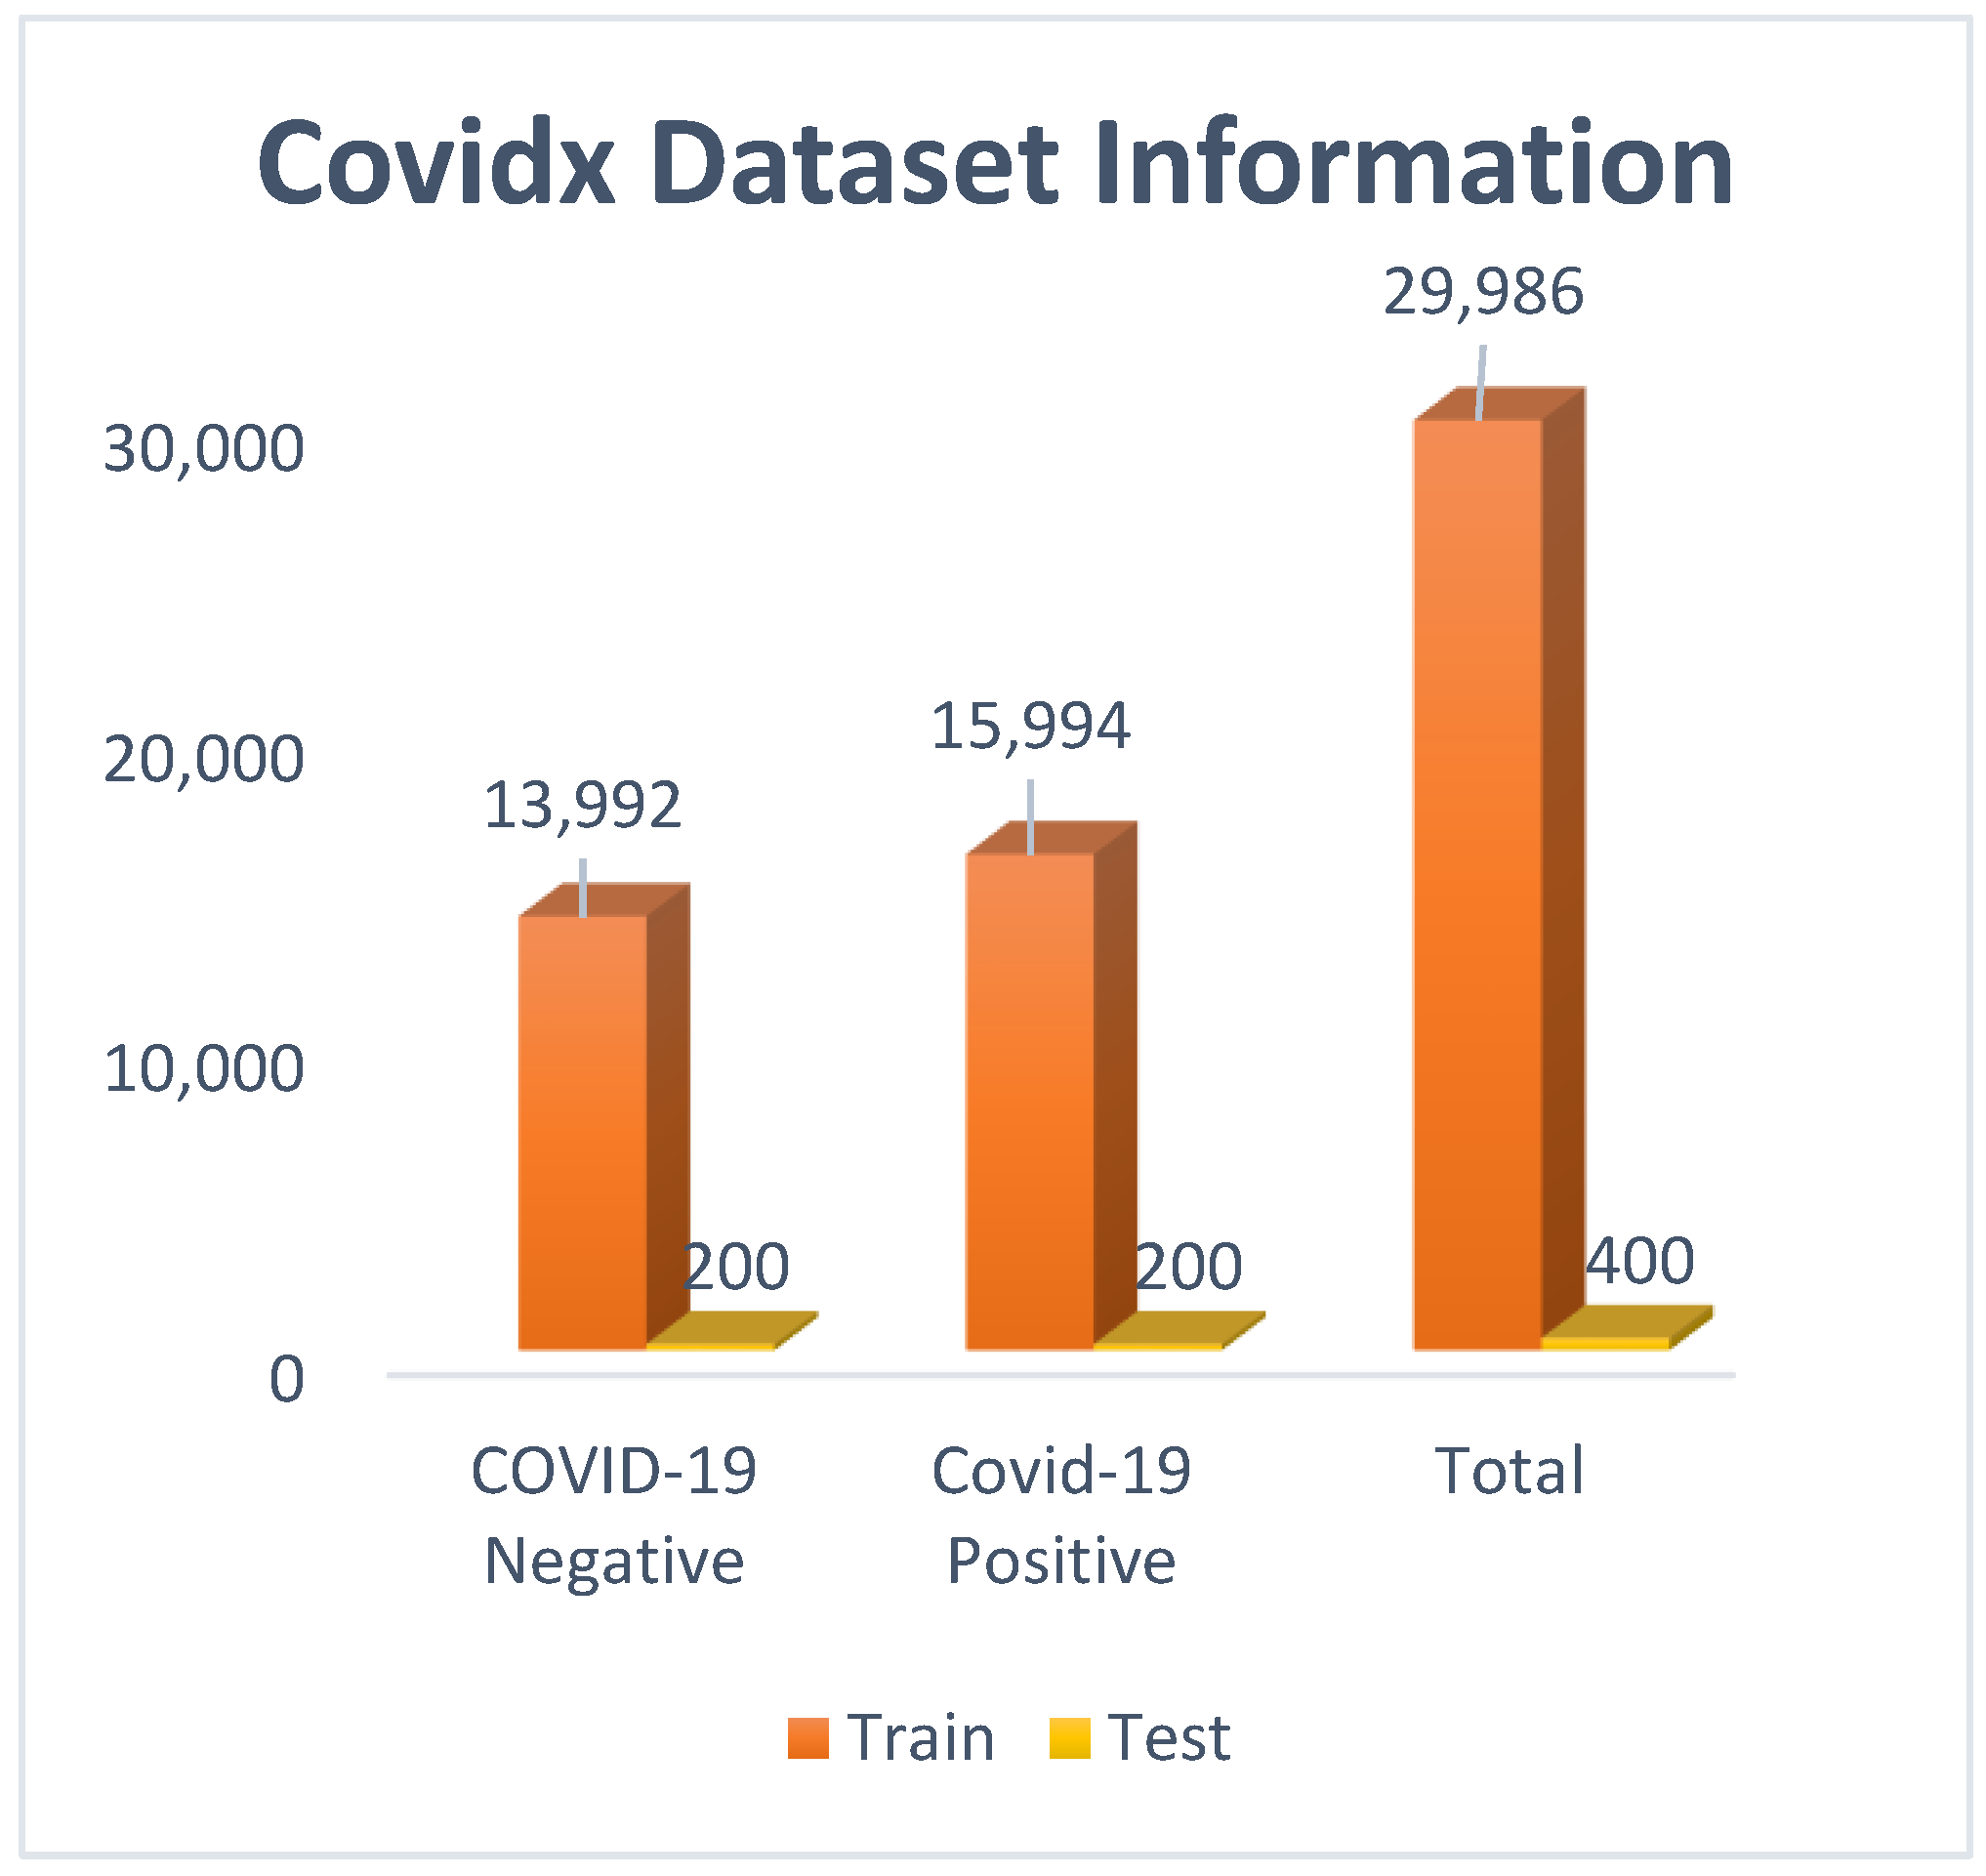
| Wang. et al. [7] | Covidx dataset; 13,975 CXR images across 13,870 patients | Nicely introduced RT-PCR with its performances and drawbacks. CXR analysis was drawn with proper comparison. | Both binary and multiclass classification | Dataset was not updated; an updated dataset always ensures the reliability of the system. |
| Ines et al. [10] | Dr. Jkooy’s open-source GitHub repository, COVID-19-radiography | A detailed comparison was shown, and used both CT scan and CXR images. | Both binary and multiclass classification | Data instances were much fewer. |
| GJIAN et al. [13] | “http://arxiv.org/abs/2003.11597 (accessed on 11 January 2023)” | Extracted features were used as the input of SVM for classification. | Only binary classification | Data instances to train the model were much fewer, which made the reliability of the system questionable. |
| Ronaldas et al. [15] | “http://axiv.org/abs/2003.13865 (accessed on 18 January 2023)” | Used 3 Max-Pooling layers, 3 convolutional layers and 2 fully connected layers | Binary classification only | Only binary classification was there. Data source authenticity is questionable. |
| Gaur. et al. [17] | EfficientNetB0, VGG16, InceptionV3 | Data instances used to train the model were properly preprocessed. | Both binary and multiclass classification | Data instances were less to make the system reliable. |
| Sushmithawathi et al. [19] | “https://github.com/agchung/Figure1-COVID-chestxray-dataset (accessed on 20 January 2023)” | Designed a GUI-based application that can be publicly used, developed with Google Colab GPU (Tesla K80 12GB GDDR5 VRAM). | Binary classification only | Different datasets were used separately. The ensemble technique could be used to improve the overall accuracy. |
| El-Kenawy et al. [24] | Two datasets were used, where the first dataset is a COVID-19 dataset with 334 CT images. The another dataset is a non-COVID-19 dataset with 794 images | Guided whale optimization technique with AlexNet model. KNN, NN, SVM classifiers were used for feature extraction. | Binary classification | The data instances used in the work were much fewer, which can create reliability issues for the proposed system. |
| Chang et al. [25] | DiCOVA challenge dataset 2021 was used with 1040 instances | ResNet50 model was used and ensemble technique was applied. | Acoustic-based COVID-19 classification | Dataset was not described properly, and a much lower number of instances were used. |
| Song et al. [26] | Two public datasets and a self-made dataset (3D-COVID) were used | U-Net and U-Net++ models were trained for segmenting the lung images. | Image segmentation | More efficient learning models can be implemented based on unlabeled data, which could reduce the scarcity of labeled data. |
| Sen et al. [27] | SARS-CoV-2 CT scan image database and COVID-CT database were used | Both feature extraction and feature selection techniques were developed. | Two-stage feature selection approach | Some well-established CNN models could be used to obtain better results at the initial stage. |
| Chang et al. [28] | DiCOVA2021 challenge dataset was used. | Both ensemble-based prediction and uncertainty estimator-based prediction were performed. | Binary classification | A proper comparison between the state-of-the-art technique and proposed technique was missing. |
| Models for Radiography Dataset | Validation Accuracy (%) | Test Accuracy (%) |
|---|---|---|
| ResNet50V2 (Model3) | 89.42 | 91.55 |
| VGG19 (Model2) | 85.50 | 83.04 |
| Xception (Mode1) | 87.48 | 87.29 |
| Average Ensemble | 93.02 | |
| Weighted Average Ensemble (WAE) | 94.10 |
| Models for Covidx Dataset | Validation Accuracy (%) | Test Accuracy (%) |
|---|---|---|
| Xception (Model1) | 85.82 | 88.89 |
| ResNet50 (Model3) | 89.62 | 92.54 |
| VGG19 (Model2) | 87.28 | 91.68 |
| VGG16 | 71.45 | 73.59 |
| Inception | 81.38 | 83.51 |
| Weighted Average Ensemble (WAE) | 97.25 |
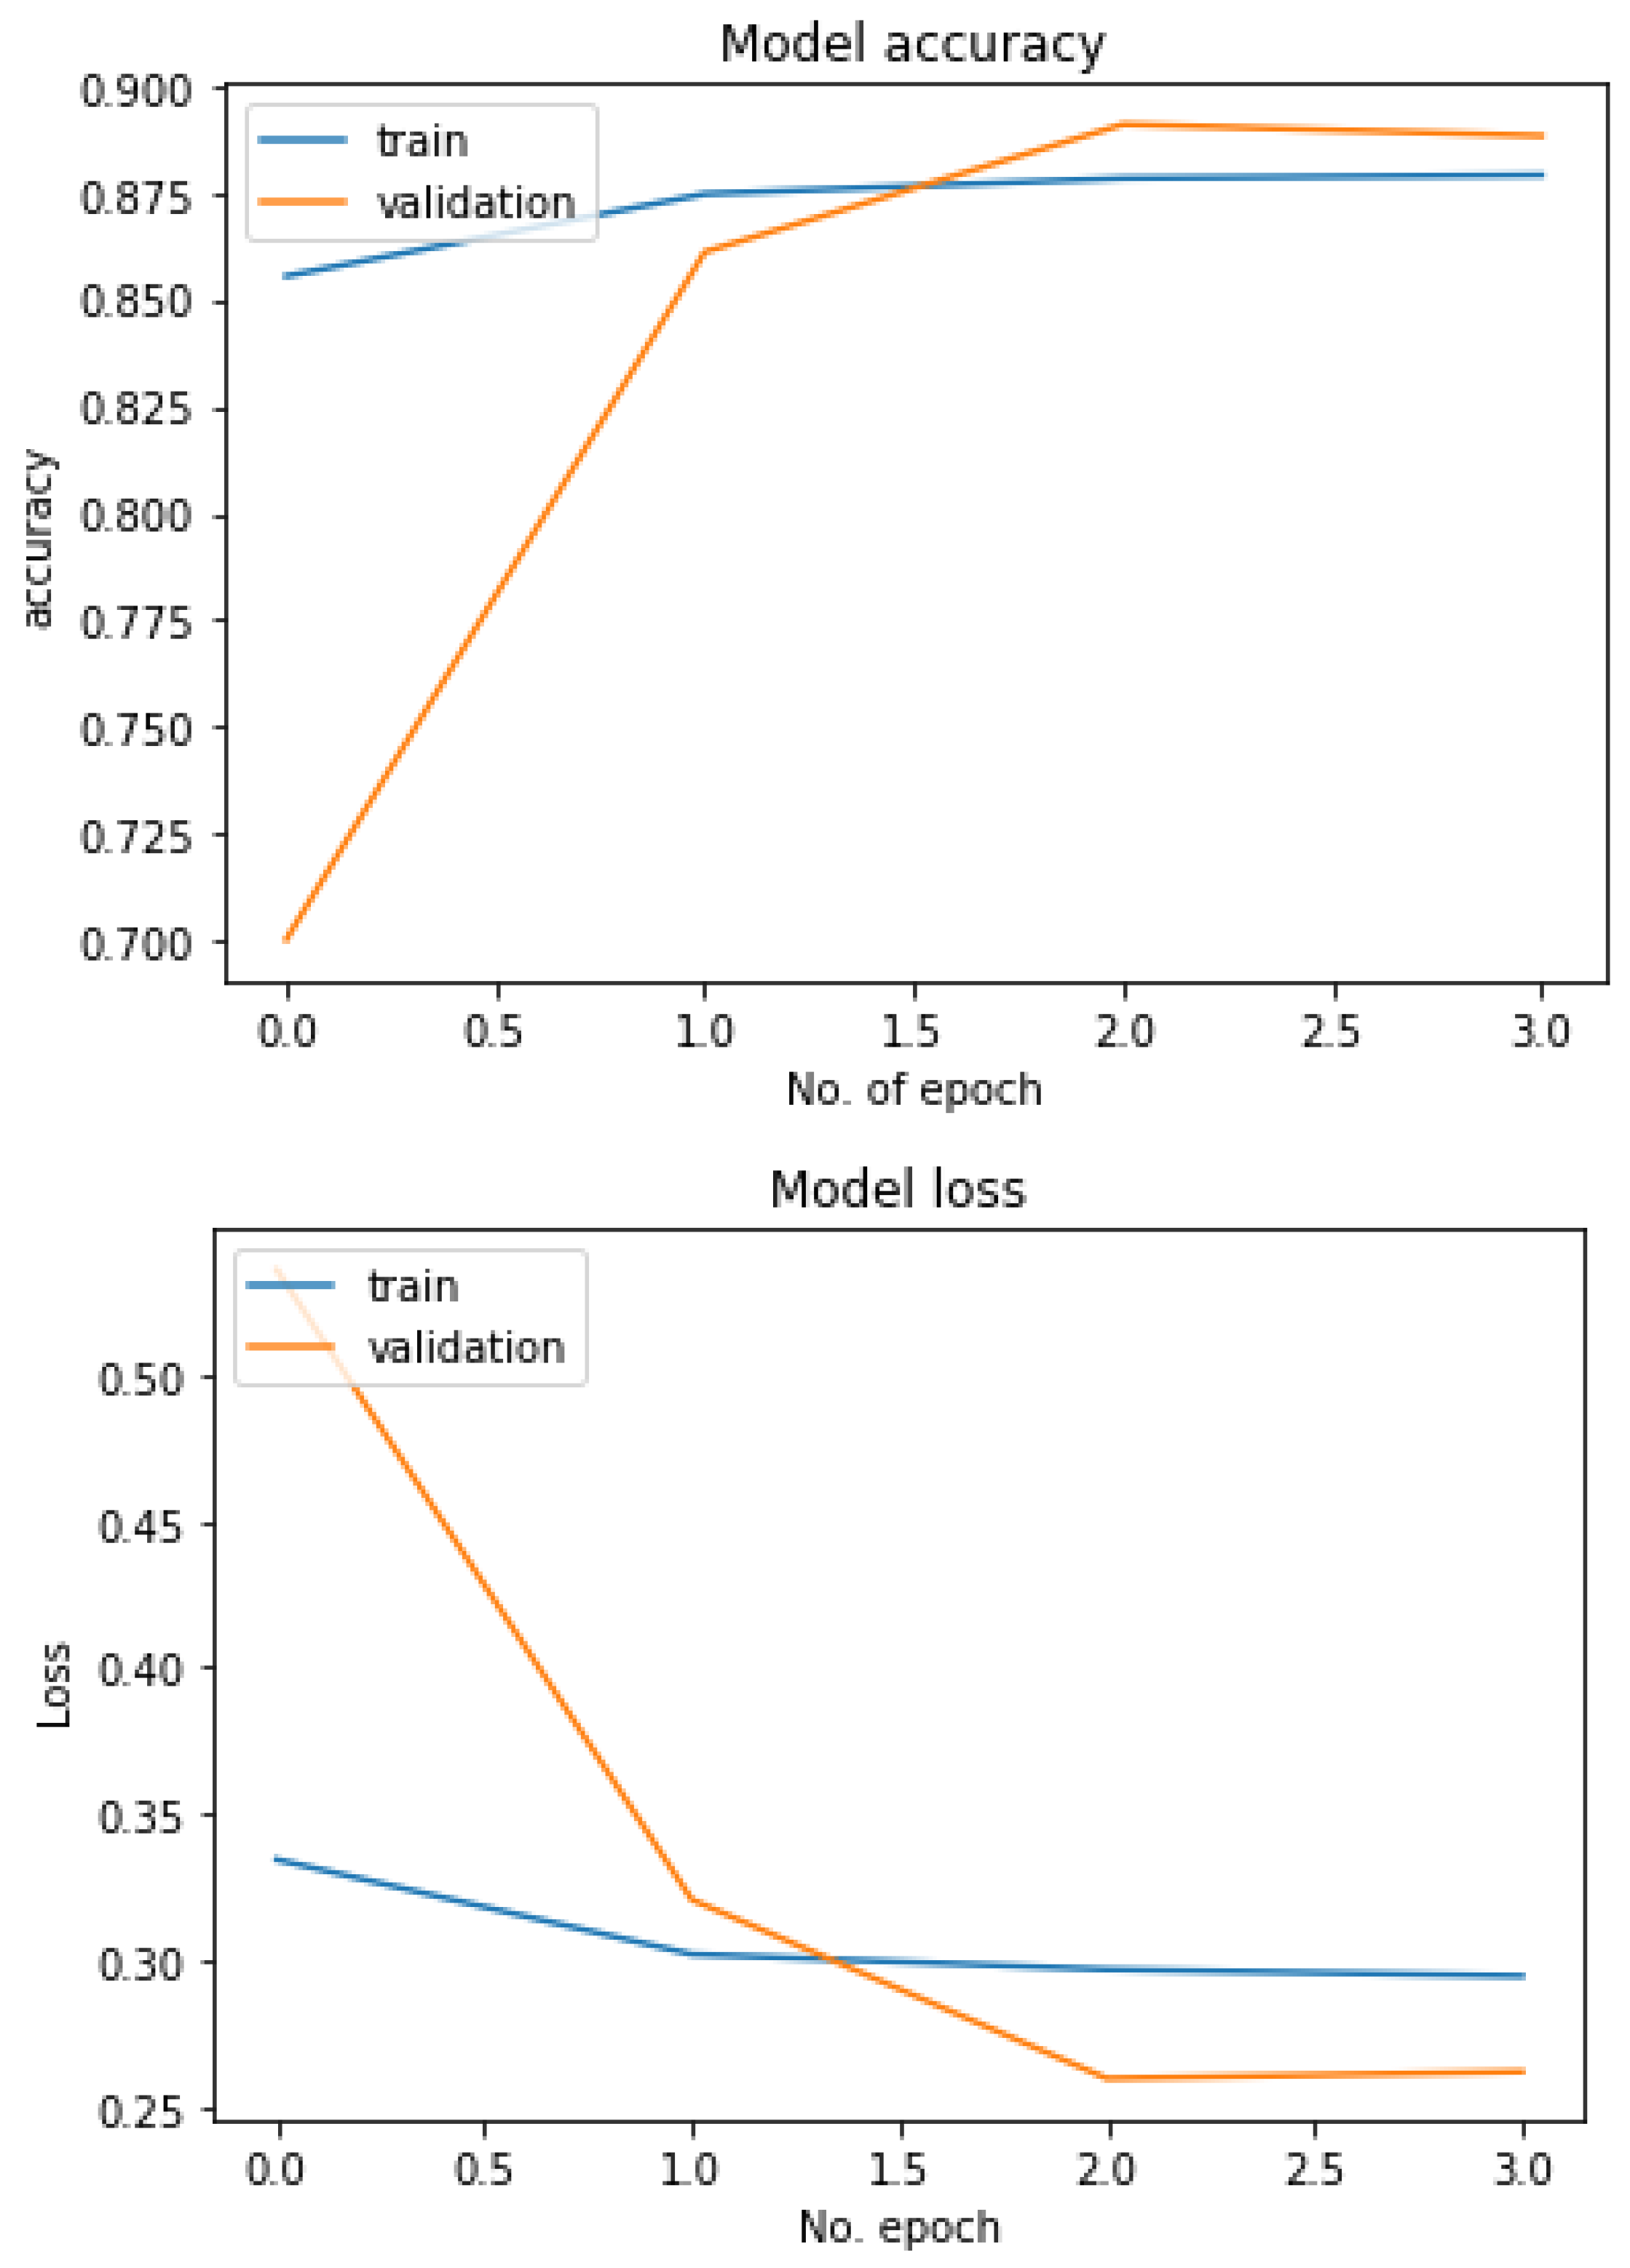
| Parameters | Binary Classification | Multiclass Classifiction |
|---|---|---|
| Val_loss | 0.2619 | 0.2583 |
| Val_accuracy | 87.28 | 89.42 |
| Training time | 4 h 30 min | 5 h 20 min |
| Epoch | 4 | 8 |
| Optimizer | Adam | Adam |
| Initial learning rate | 0.001 | 0.001 |
| Loss function | binary cross entropy | categorical cross entropy |
| Output activation fn() | Sigmoid | softmax |
| Binary Classification | Multiclass Classification | |
|---|---|---|
| Accuracy | 0.9725 | 0.9410 |
| Precision | 0.9695 | 0.9510 |
| Recall | 0.9636 | 0.9331 |
| Specificity | 0.9787 | - |
| F1 Score | 0.9665 | 0.9404 |
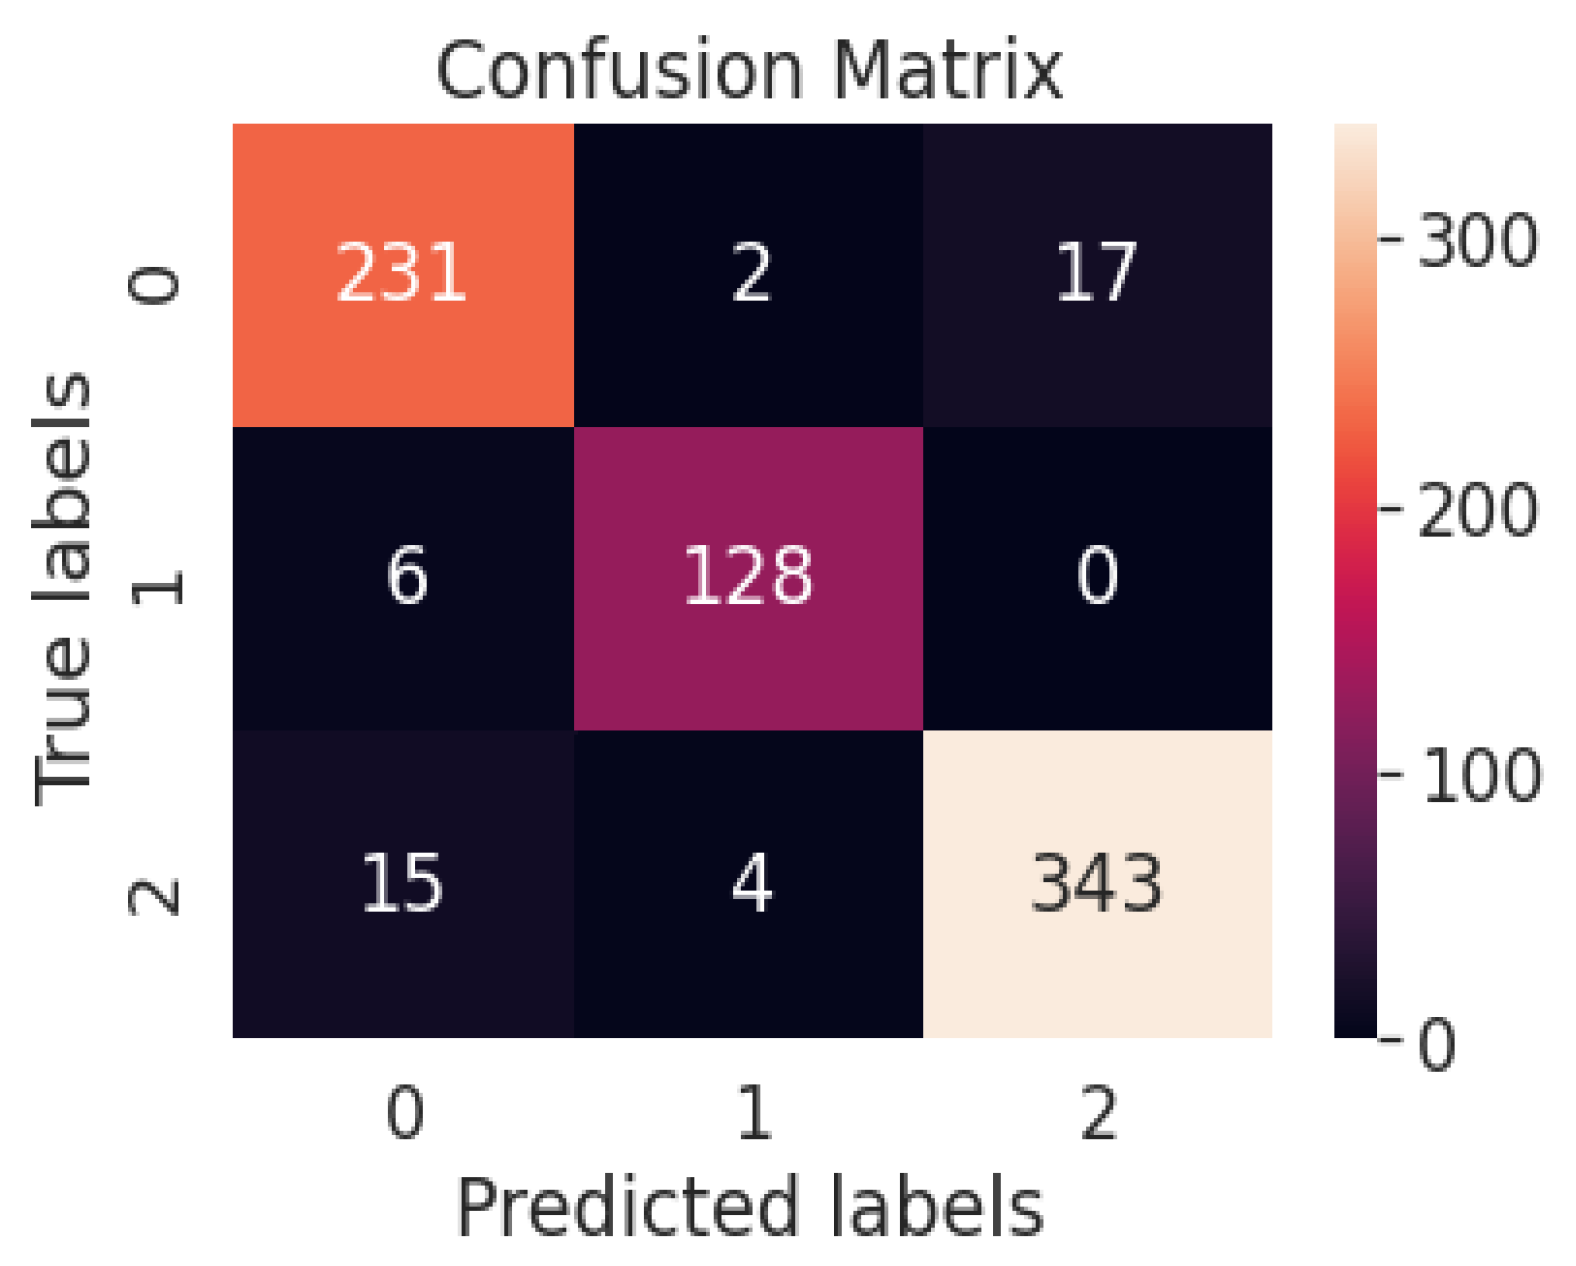
| Precision | Recall | F1 Score | |
|---|---|---|---|
| Normal | 0.79232 | 0.92121 | 0.85231 |
| Viral Pneumonia | 0.99178 | 0.91105 | 0.94260 |
| COVID | 0.93418 | 0.86816 | 0.89251 |
| Author | Precision | Recall | F1 Score |
|---|---|---|---|
| Anooja I. et al. [3] | 95 | 90 | 0.9243 |
| Ines C. et al. [10] | 88.5 | 86.0 | 0.865 |
| H.Nasiri et al. [11] | 92.5 | 95 | 0.912 |
| Ronaldas M.J. et al. [15] | 81.57 | 80.07 | 0.8081 |
| Loveleen G. et al. [17] | 88.3 | 90.0 | 0.88 |
| Proposed binary classification technique with WAE | 96.95 | 96.36 | 0.9665 |
| Proposed multiclass classification technique with WAE | 95.1 | 95.31 | 0.9404 |
| Author | Models and Methods | Total Images | Accuracy |
|---|---|---|---|
| Areej et al. [1] | Transfer learning with pretrained ChexNet model | 560 | 89.8273 |
| Anooja et al. [3] | AlexNet | 7240 | 93.65 |
| Ines et al. [10] | VGG-19, Xception | 2022 | 90.496 |
| CHANGJIAN et al. [13] | Transfer learning on ResNet | 1495 | 93 |
| Ronaldas et al. [15] | CNN with Lim. Adaptive histogram equalization technique | 702 | 83.29 |
| Loveleen et al. [17] | EfficientNetB0, VGG16, InceptionV3 | 5010 | 92.89 |
| Sushmithawathi et al. [19] | DenseNet201, ResNet50V2, Inceptionv3 | 7240 | 91.31 |
| El-Kenawy et al. [24] | Guided whale optimization technique with AlexNet, KNN, NN, SVM | 1128 | 79.0 |
| Chang et al. [25] | Ensemble technique with ResNet50 | 1040 | 84.53 |
| Song et al. [26] | Image segmentation with U-Net and U-Net++ models | 2922 | 95.49 |
| Sen et al. [27] | CNN models, Dragonfly feature selectioin technique with SVM classifier | 2482 | 90.00 |
| Chang et al. [28] | Gaussian noise-based augmentation technique and transfer learning with pretrained ResNet50 model | 1040 | 91 |
| He et al. [38] | Image segmentation with evolvable adversarial network using gradient penalty | 1199 | 94 |
| Proposed binary classification approach | Weighted average ensemble technique with ResNet50V2, VGG19 and Xception | 30,386 | 97.25 |
| Proposed multiclass classification approach | Weighted average ensemble technique with VGG19, Xception, ResNet50V2 | 7461 | 94.10 |
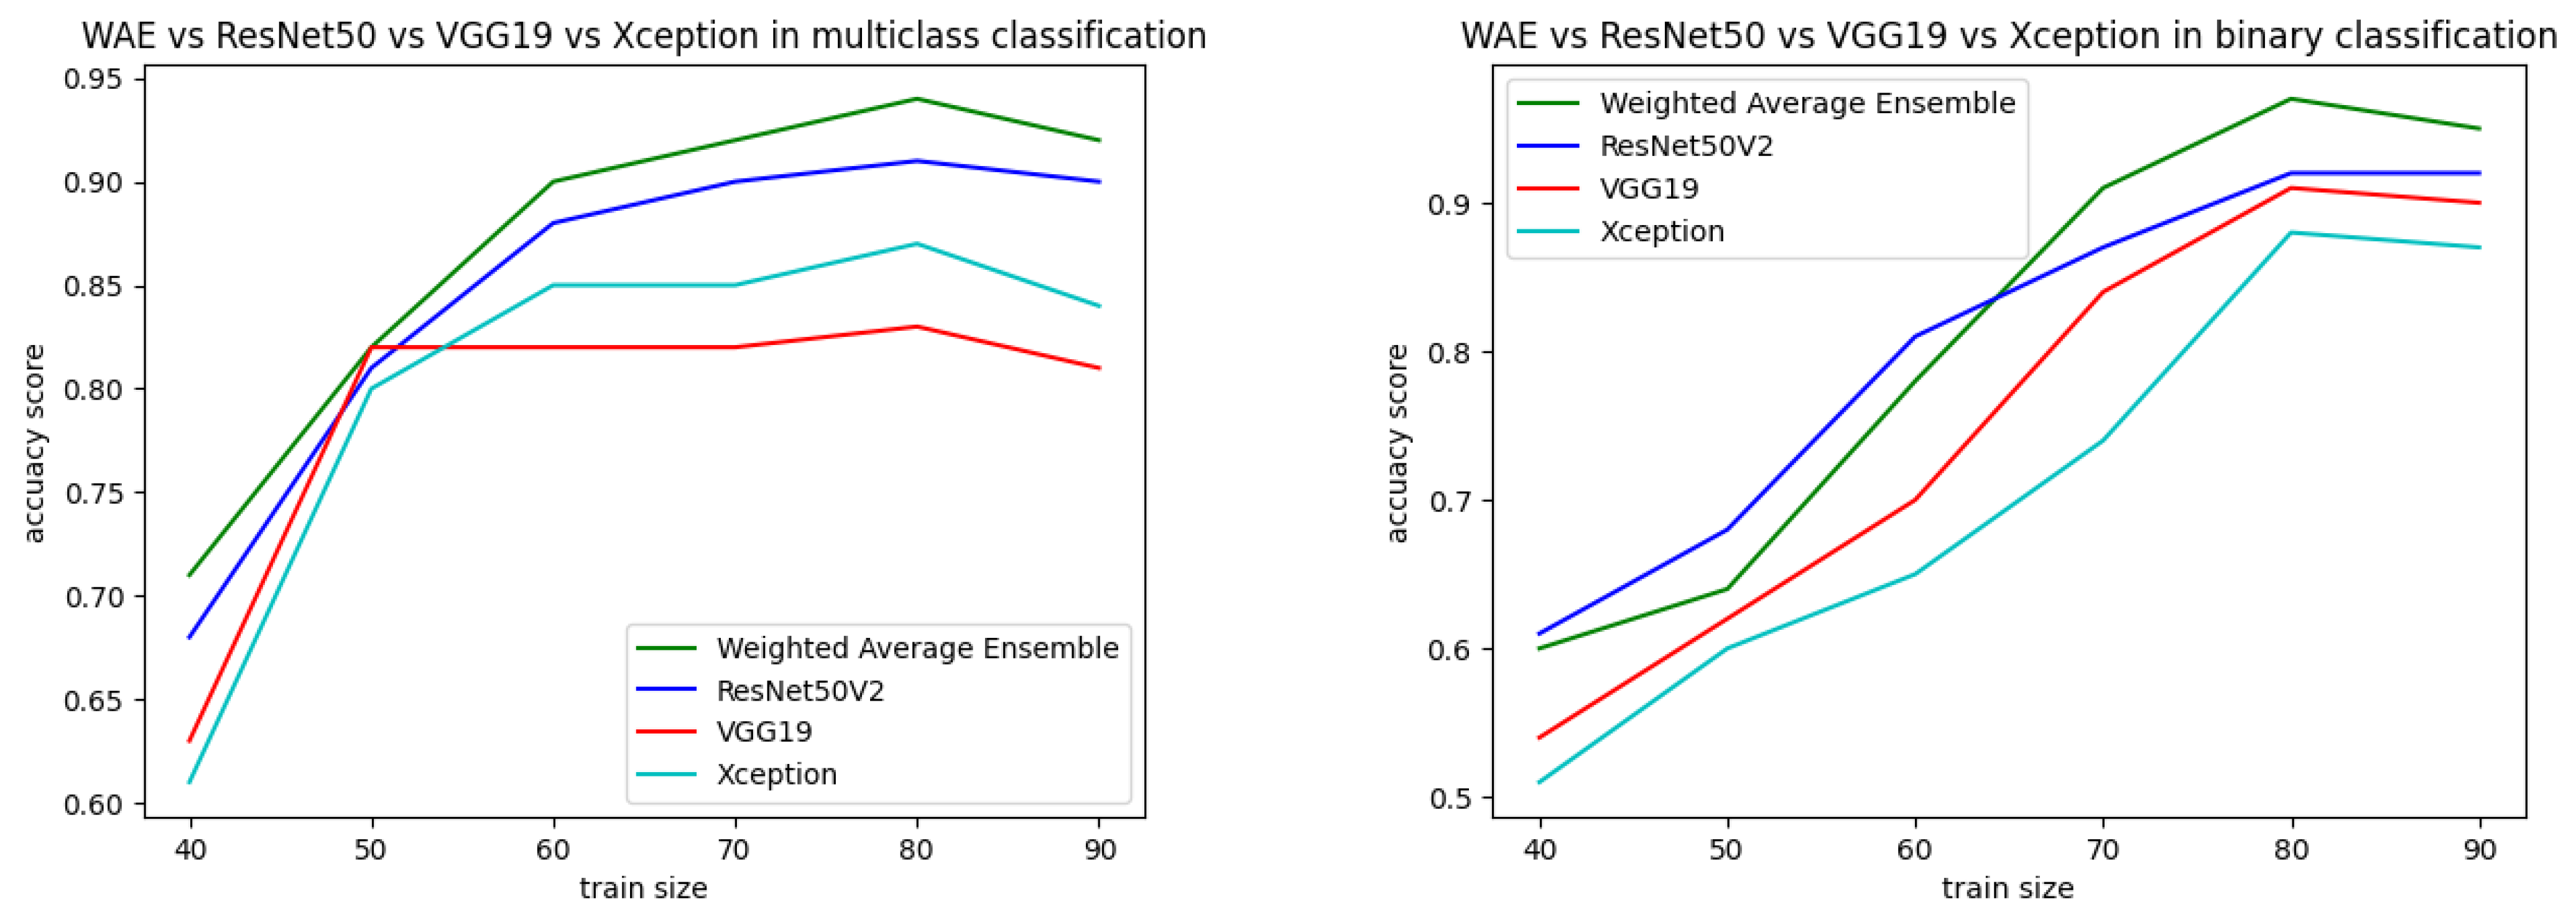
| Train–Test Ratio in Multiclass Approach | Accuracy with Weighted Average Ensemble | Accuracy with ResNet50v2 Model | Accuracy with VGG19 Model | Accuracy with Xception Model |
|---|---|---|---|---|
| 90:10 | 92.94 | 90.58 | 81.04 | 84.13 |
| 80:20 | 94.10 | 91.55 | 83.04 | 87.29 |
| 70:30 | 92.65 | 90.80 | 82.98 | 85.12 |
| 60:40 | 90.16 | 88.85 | 82.65 | 85.03 |
| 50:50 | 82.01 | 81.87 | 82.02 | 80.48 |
| 40:60 | 71.47 | 68.23 | 63.42 | 61.53 |
| Train–Test Ratio in Binary Approach | Accuracy with Weighted Average Ensemble | Accuracy with ResNet50v2 Model | Accuracy with VGG19 Model | Accuracy with Xception Model |
| 90:10 | 95.29 | 92.33 | 90.08 | 87.89 |
| 80:20 | 97.25 | 92.54 | 91.68 | 88.89 |
| 70:30 | 91.65 | 87.65 | 84.93 | 74.65 |
| 60:40 | 78.21 | 81.35 | 70.64 | 65.53 |
| 50:50 | 64.30 | 68.49 | 62.67 | 60.68 |
| 40:60 | 60.01 | 61.64 | 54.52 | 51.67 |
| Experiment No. | Multiclass Classification Accuracy | Binary Classification Accuracy |
|---|---|---|
| Learning experiment 1 | 94.10 | 97.25 |
| Learning experiment 2 | 94.09 | 97.21 |
| Learning experiment 3 | 94.12 | 97.24 |
| Learning experiment 4 | 94.10 | 97.25 |
| Learning experiment 5 | 94.10 | 97.25 |
| Learning experiment 6 | 94.08 | 97.24 |
| Learning experiment 7 | 94.09 | 97.24 |
| Learning experiment 8 | 94.08 | 97.24 |
| Learning experiment 9 | 94.10 | 97.25 |
| Learning experiment 10 | 94.10 | 97.24 |
| Mean accuracy | 94.096 | 97.24 |
| Standard deviation | 0.0117 | 0.0119 |
| Split Count | WAE in Binary Approach | WAE in Multiclass Approach |
|---|---|---|
| 1 | 87.24 | 90.41 |
| 2 | 81.67 | 81.35 |
| 3 | 91.74 | 88.64 |
| 4 | 79.61 | 84.32 |
| 5 | 90.25 | 80.56 |
| Mean | 86.1 | 86.05 |
| Standard deviation | 5.29 | 4.98 |
Disclaimer/Publisher’s Note: The statements, opinions and data contained in all publications are solely those of the individual author(s) and contributor(s) and not of MDPI and/or the editor(s). MDPI and/or the editor(s) disclaim responsibility for any injury to people or property resulting from any ideas, methods, instructions or products referred to in the content. |
© 2023 by the authors. Licensee MDPI, Basel, Switzerland. This article is an open access article distributed under the terms and conditions of the Creative Commons Attribution (CC BY) license (https://creativecommons.org/licenses/by/4.0/).
Share and Cite
Chakraborty, G.S.; Batra, S.; Singh, A.; Muhammad, G.; Torres, V.Y.; Mahajan, M. A Novel Deep Learning-Based Classification Framework for COVID-19 Assisted with Weighted Average Ensemble Modeling. Diagnostics 2023, 13, 1806. https://doi.org/10.3390/diagnostics13101806
Chakraborty GS, Batra S, Singh A, Muhammad G, Torres VY, Mahajan M. A Novel Deep Learning-Based Classification Framework for COVID-19 Assisted with Weighted Average Ensemble Modeling. Diagnostics. 2023; 13(10):1806. https://doi.org/10.3390/diagnostics13101806
Chicago/Turabian StyleChakraborty, Gouri Shankar, Salil Batra, Aman Singh, Ghulam Muhammad, Vanessa Yelamos Torres, and Makul Mahajan. 2023. "A Novel Deep Learning-Based Classification Framework for COVID-19 Assisted with Weighted Average Ensemble Modeling" Diagnostics 13, no. 10: 1806. https://doi.org/10.3390/diagnostics13101806