Article

Brain Volume Changes after COVID-19 Compared to Healthy Controls by Artificial Intelligence-Based MRI Volumetry

by
Zeynep Bendella
1,
Catherine Nichols Widmann
2,3,
Julian Philipp Layer
4,5,
Yonah Lucas Layer
4,
Robert Haase
1,3,
Malte Sauer
1,
Luzie Bieler
2,
Nils Christian Lehnen
1,3,
Daniel Paech
1,3,
Michael T. Heneka
2,3,6,
Alexander Radbruch
1,3 and
Frederic Carsten Schmeel
1,3,*
1
Department of Neuroradiology, University Hospital Bonn, Rheinische Friedrich-Wilhelms-Universität Bonn, Venusberg-Campus 1, 53127 Bonn, Germany
2
Department of Neurodegenerative Diseases and Geriatric Psychiatry, University Hospital Bonn, Rheinische Friedrich-Wilhelms-Universität Bonn, 53127 Bonn, Germany
3
German Center for Neurodegenerative Diseases (DZNE), 53127 Bonn, Germany
4
Department of Radiation Oncology, University Hospital Bonn, Rheinische Friedrich-Wilhelms-Universität Bonn, 53127 Bonn, Germany
5
Institute of Experimental Oncology, University Hospital Bonn, Rheinische Friedrich-Wilhelms-Universität Bonn, 53127 Bonn, Germany
6
Luxembourg Centre for Systems Biomedicine, University of Luxembourg, Esch-Belval, 4367 Luxembourg, Luxembourg
*
Author to whom correspondence should be addressed.
Diagnostics 2023, 13(10), 1716; https://doi.org/10.3390/diagnostics13101716
Submission received: 31 March 2023 / Revised: 5 May 2023 / Accepted: 11 May 2023 / Published: 12 May 2023
(This article belongs to the Special Issue Quantitative Imaging in COVID-19)

Abstract

:
Cohort studies that quantify volumetric brain data among individuals with different levels of COVID-19 severity are presently limited. It is still uncertain whether there exists a potential correlation between disease severity and the effects of COVID-19 on brain integrity. Our objective was to assess the potential impact of COVID-19 on measured brain volume in patients with asymptomatic/mild and severe disease after recovery from infection, compared with healthy controls, using artificial intelligence (AI)-based MRI volumetry. A total of 155 participants were prospectively enrolled in this IRB-approved analysis of three cohorts with a mild course of COVID-19 (n = 51, MILD), a severe hospitalised course (n = 48, SEV), and healthy controls (n = 56, CTL) all undergoing a standardised MRI protocol of the brain. Automated AI-based determination of various brain volumes in mL and calculation of normalised percentiles of brain volume was performed with mdbrain software, using a 3D T1-weighted magnetisation-prepared rapid gradient echo (MPRAGE) sequence. The automatically measured brain volumes and percentiles were analysed for differences between groups. The estimated influence of COVID-19 and demographic/clinical variables on brain volume was determined using multivariate analysis. There were statistically significant differences in measured brain volumes and percentiles of various brain regions among groups, even after the exclusion of patients undergoing intensive care, with significant volume reductions in COVID-19 patients, which increased with disease severity (SEV > MILD > CTL) and mainly affected the supratentorial grey matter, frontal and parietal lobes, and right thalamus. Severe COVID-19 infection, in addition to established demographic parameters such as age and sex, was a significant predictor of brain volume loss upon multivariate analysis. In conclusion, neocortical brain degeneration was detected in patients who had recovered from SARS-CoV-2 infection compared to healthy controls, worsening with greater initial COVID-19 severity and mainly affecting the fronto-parietal brain and right thalamus, regardless of ICU treatment. This suggests a direct link between COVID-19 infection and subsequent brain atrophy, which may have major implications for clinical management and future cognitive rehabilitation strategies.

1. Introduction

There is mounting evidence of brain-related pathology due to COVID-19, both during the acute phase of the disease and in the longer-term course [1]. In addition to the well-documented loss of taste and smell during the acute phase [2], individuals affected by the virus may also suffer long-term neurological, psychiatric, and neurocognitive impairments following COVID-19 infection, particularly cognitive deficits such as impaired concentration and memory, even after asymptomatic infection [3]. Persistent neurological complications have been reported in up to 25% of patients [4], although studies have demonstrated high variability in the prevalence and incidence of symptoms [5]. Given that acquired neural damage can increase the risk of initiating or exacerbating neurodegenerative processes [6], greater attention is now being paid to the long-term impact of COVID-19 on the central nervous system (CNS).
It has been postulated that patients severely ill with COVID-19 may also experience more severe CNS damage [7]. However, several case series have shown that neurological symptoms are not limited to severe cases. In fact, between 37% to 84% of patients with mild symptoms in intermediate care exhibit neurological impairment [7,8]. This implies that the severity of the initial infection may play a prominent role in long-term neurological trajectories. While most COVID-19 imaging studies to date have focused on acute and hospitalised cases with a fairly broad spectrum of gross cerebral abnormalities, such as white matter hyperintensities and cerebrovascular events, especially in the cerebrum [9], there have been fewer cohort studies that quantitatively compare volumetric brain data among subjects with different disease severity. As such, it remains unclear whether the effects of COVID-19 on the CNS can be quantitatively assessed even in milder cases, or whether they depend on the initial severity of the disease. Knowledge of such effects might reveal possible mechanisms for the spread and potential sequelae of the disease. To assess the potential impact of COVID-19 on the brain and its structural integrity, this magnetic resonance imaging (MRI) study was conducted to evaluate potential volumetric brain abnormalities among patients with asymptomatic/mild and severe cases of COVID-19 after remission of infection, in comparison to actively recruited healthy controls, using artificial intelligence (AI)-based volumetry. Utilising a volumetric approach may provide insights into possible cortical and subcortical alterations after COVID-19.

2. Materials and Methods

This monocentric longitudinal prospective cohort study was conducted at Bonn University Hospital and is one of three subprojects within a three-pronged research consortium known as “COVIMMUNE: Studies on immune system function and disease progression of COVID-19”, funded by the German Ministry of Health. In addition to clinical and neuropsychological examinations conducted by trained and qualified medical investigators at three timepoints (baseline, 6 and 12 months), standardised brain MR imaging was scheduled at two time points (baseline and after 12 months) for all participant groups. In this paper, we present the baseline MR imaging findings (i.e., after study enrolment) from the radiological project arm. MRI follow-up at 12 months is planned and currently pending, and therefore not yet part of the analysis below. The local Internal Review Board (the Medical Ethics Review Board of the University Hospital Bonn, ID 511/20) reviewed the study protocol, and final approval was obtained on 10 March 2021. All participants provided written informed consent before taking part in any study-specific procedures.
This study has been preregistered at the German Clinical Trials Registry (primary registry trial identifier: DRKS00023806; registration date: 16 March 2021, and cross-referenced with the World Health Organization’s International Clinical Trials Registry Platform [ICTRP]).

2.1. Study Population

A total of 172 participants with similar age and sex distribution were prospectively enrolled using frequency matching (as of 10 March 2022), of whom 10 failed screening and 7 were lost during the scheduled MRI examination stage due to claustrophobia (n = 4) or metallic implants (n = 3). The remaining 155 participants were categorized into three groups based on their health status: healthy control subjects (n = 56), patients with an asymptomatic/mild course (n = 51), and patients with a severe course of COVID-19 (n = 48), as explained below.
The entire study protocol was recently described elsewhere [10] and can be summarised as follows regarding the radiological project arm:
General inclusion criteria:
  • aged 25 to 75 years
Cohort-specific inclusion criteria:
  • Cohort I: asymptomatic course (MILD) of COVID-19 (SARS-CoV-2–positive) or mild course (i.e., declaration of no symptoms other than anosmia or ageusia)
  • Cohort II: severely affected course (SEV) of COVID-19 (SARS-CoV-2–positive) according to simplified WHO classification, defined as having been admitted to hospital (any ward type) for at least 24 h due to SARS-CoV-2 infection at any timepoint during the course of the disease
  • Cohort III: healthy controls (CTL) will only be included in the study if they also meet all of the following criteria:
    • must perform > –1.0 SD on the Hopkins Verbal Learning Test
    • no substance abuse
    • no known history of or current diagnosed psychiatric illness
    • negative nCoV IgG/IgM Rapid Test before inclusion, indicative of no recent COVID-19 infection
General exclusion criteria:
  • general contraindication for MRI
  • severe or unstable medical condition
  • current major depressive episode
  • psychotic disorder, bipolar disorder, substance abuse at present or in the past
  • known neurodegenerative disorder (Alzheimer’s disease, Parkinson’s disease, frontotemporal dementia, Huntington’s disease, amyotrophic lateral sclerosis)
  • vascular dementia or history of stroke
  • history of malignant disease

2.2. Magnetic Resonance Imaging

All participants underwent standardised brain MRI at baseline following enrolment in the study. MR imaging was performed on a clinical whole-body 3 T MRI system (Achieva TX, Philips Healthcare, Best, The Netherlands) equipped with an 8-channel head coil with identical scanning protocols. Morphological brain imaging included three-dimensional (3D) T1-weighted magnetisation-prepared rapid acquisition with gradient echo (3D MPRAGE), 3D fluid-attenuated inversion recovery (3D-FLAIR), diffusion-weighted imaging (DWI), susceptibility-weighted imaging (SWI) and T2-weighted imaging (T2W). Details of the MRI scanning parameters are summarised in Table 1.

2.3. Image Analysis

Board-certified radiologists with several years of neuroradiological experience visually examined the MRI datasets of all subjects for acute cerebral pathology and possible exclusion criteria.

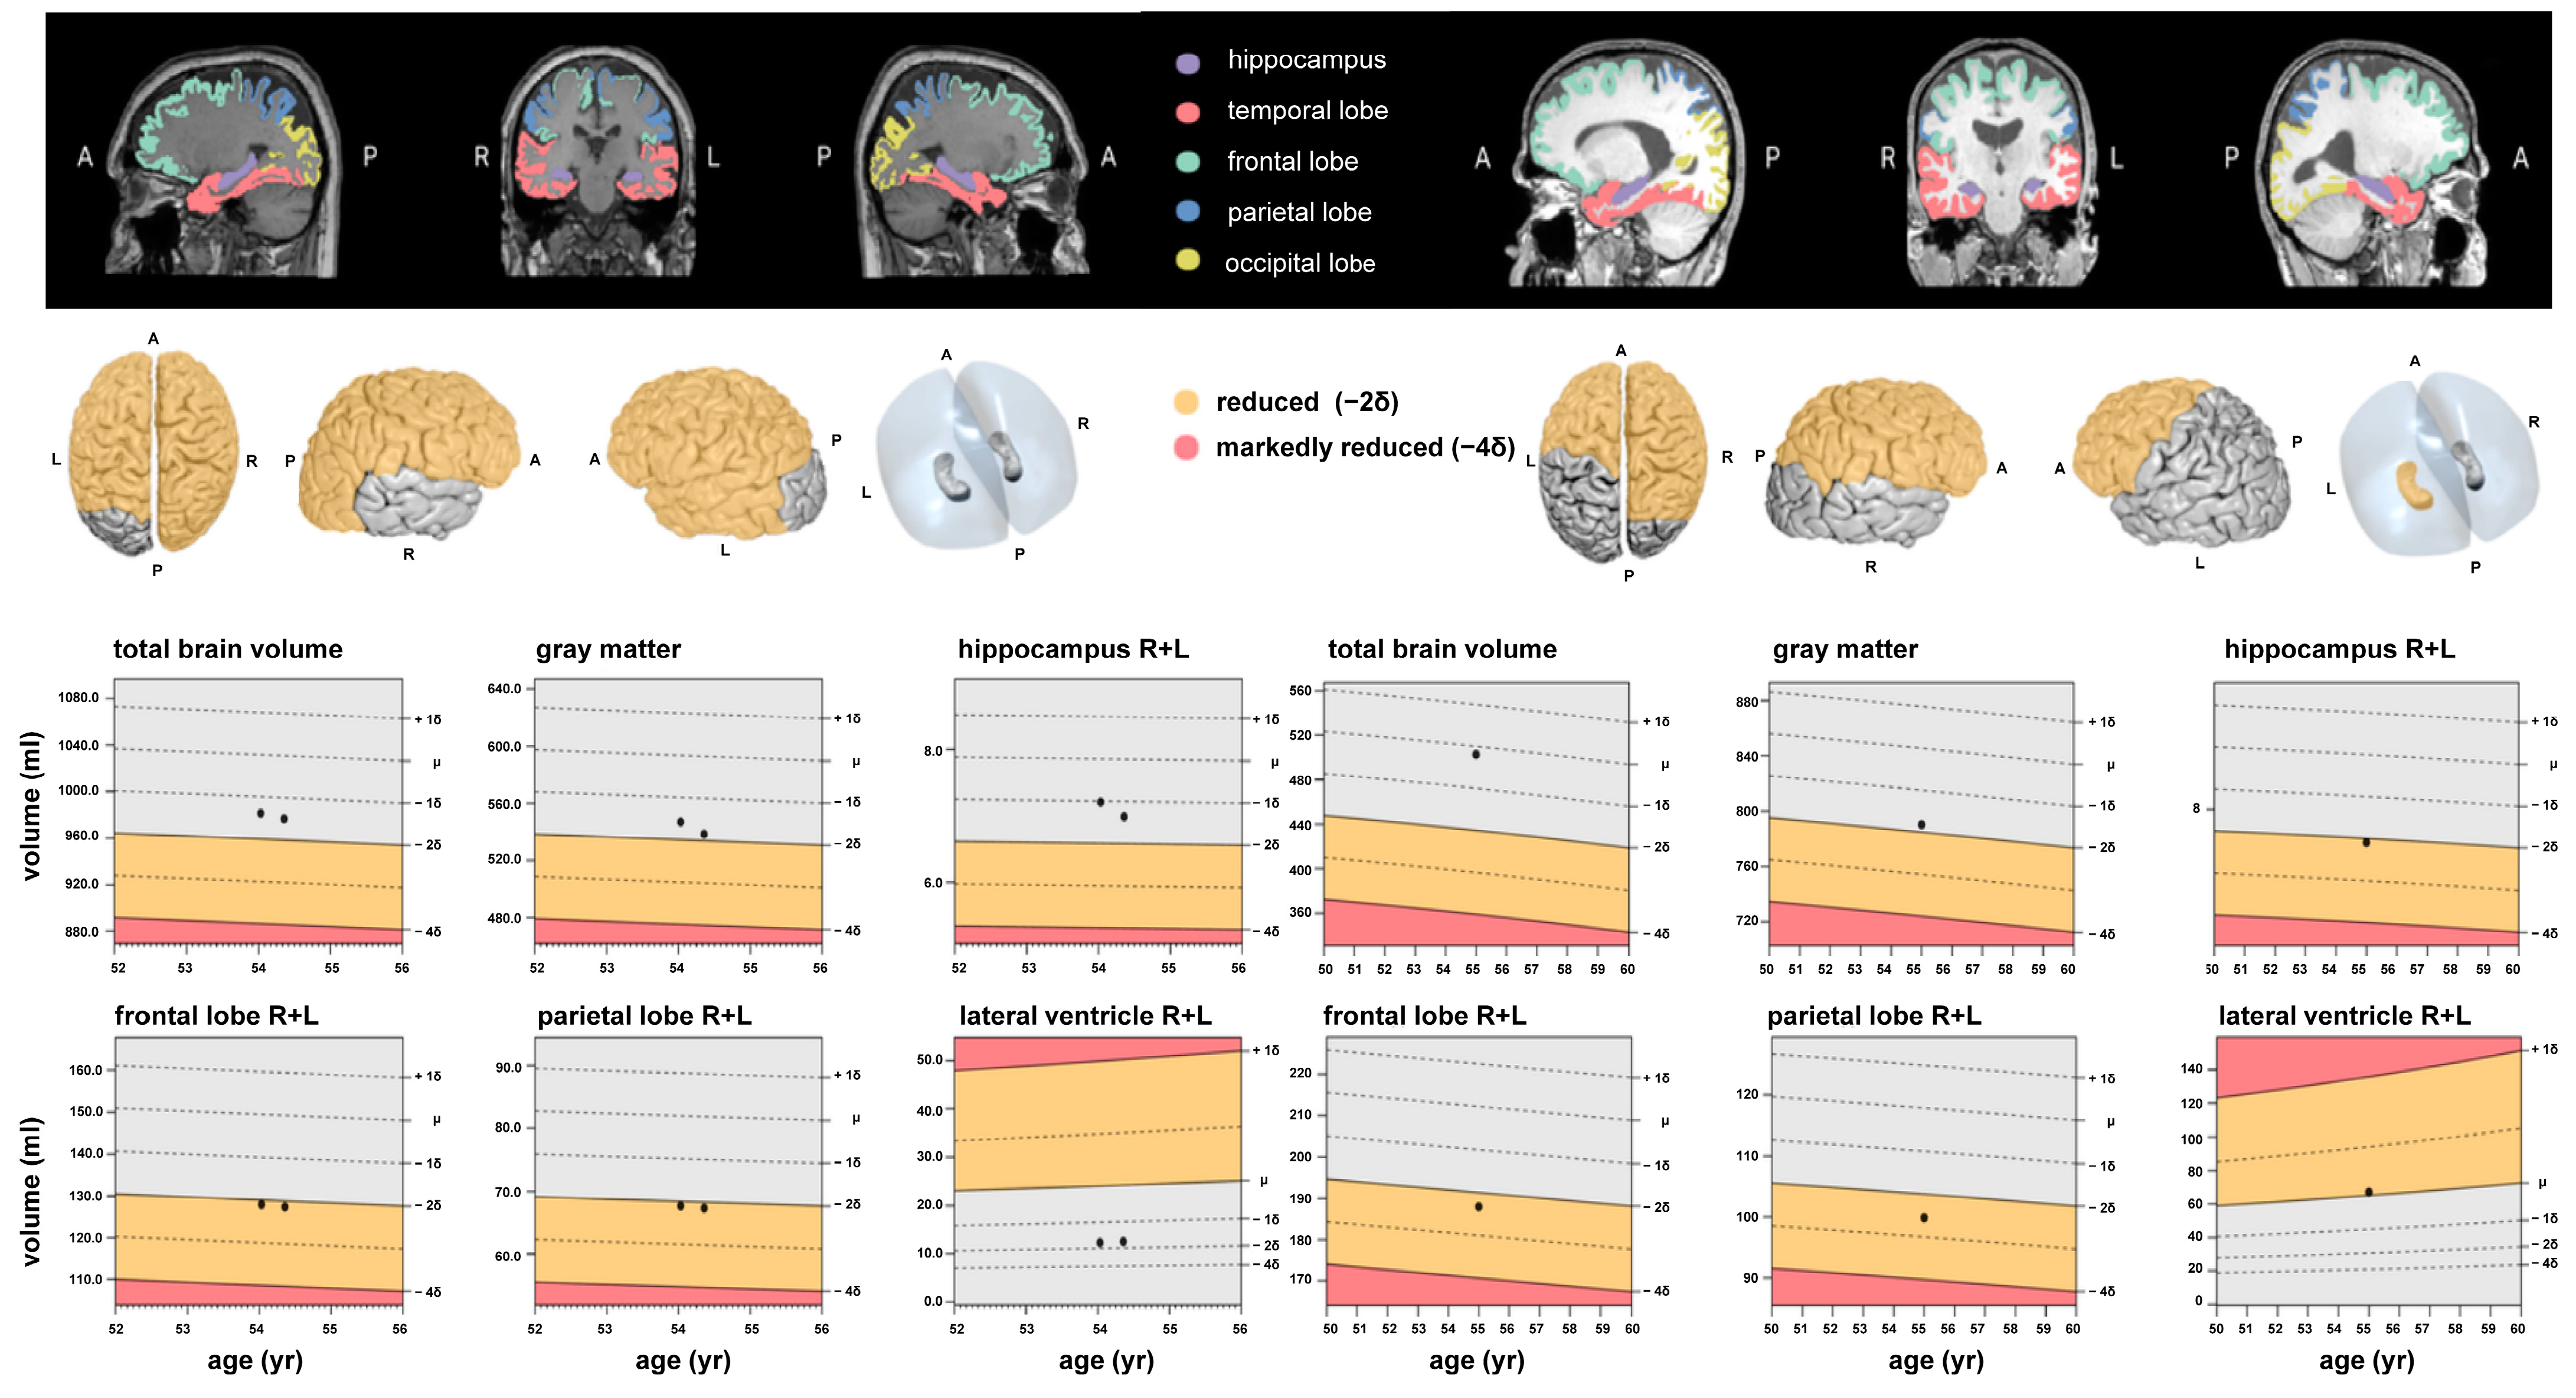
2.4. Post-Processing and Artificial Intelligence (AI)-Based Volumetry

Automated AI-based software was used to determine quantitative analyses of the volume of different brain areas in mL and age- and sex-adjusted percentiles (based on an internal reference collective of age- and sex-adjusted healthy controls from the general population embedded in the software). This commercially licensed MRI post-processing software, named “mdbrain”, is provided by mediaire GmbH, Berlin, Germany, an approved medical device manufacturer according to the European Medical Device Directive 93/42/EEC, and is certified according to DIN EN ISO 13485:2016. The “mdbrain” software is approved as a CE-marked medical device. It performs automatic brain volumetry of different brain regions using native 3D T1-weighted sequences to allow quantitative statements based on an extensive population-based normative database. The algorithm and embedded normative database are trained nationwide, not limited to the experience of a single centre, and have been validated for accuracy [11].
The 3D T1w MPRAGE sequence was manually transferred from the clinical PACS to the mdbrain software, v4.4.1 or higher, for automatic volumetrization and percentile calculation. The volumes and percentiles of all evaluated structures were automatically computed, saved and checked for plausibility. The volumetrized structures were the whole brain, whole white matter, whole grey matter, cerebral cortex, cerebellar cortex, frontal lobe, parietal lobe, precuneus, occipital lobe, temporal lobe, hippocampus, parahippocampal gyrus, entorhinal cortex, caudate nucleus, putamen, globus pallidum, thalamus, brainstem, mesencephalon, pons, lateral ventricle, third ventricle, and fourth ventricle. Volumes were determined separately for each of the paired structures.

2.5. Statistical Analysis

Statistical analyses were conducted using SPSS statistical software (v27 and above, IBM Corp., Armonk, NY, USA) and R (v4.2.2, R core Team, R Foundation for Statistical Computing, Vienna, Austria, URL https://www.R-project.org/ accessed on 15 March 2023) with the jtools package (v2.2.0, URL https://cran.r-project.org/package=jtools accessed on 15 March 2023). All applicable demographic and imaging data are given as mean ± standard deviation, unless otherwise specified. The statistical significance level was set at p < 0.05. A priori statistical power analyses were performed and recently described elsewhere [10], yielding a required total sample size of 126 at an estimated actual power of 80%. Mann–Whitney U and Kruskal–Wallis tests were used for pairwise and multiple group comparisons of independent clinical and imaging data, and a one-way ANOVA of variance with post hoc testing after Bonferroni correction was used for pairwise inter-class comparisons. A multivariate regression model was then used to analyse the independent variables further and estimate the relative contribution of demographic and clinical parameters to the observed differences between measured brain volumes. The predictors included in the model were age, sex, height, body mass index (BMI), asymptomatic/mild course (MILD) and severe course (SEV) of COVID-19. The obtained model provided a coefficient (estimate) for each predictor, allowing for the estimation of the magnitude and direction of the relationship between the dependent variable and each independent variable. This coefficient represents the amount by which the dependent variable (volume in mL) changes when the independent variable increases by one unit (years for age, cm for height and kg/m2 for BMI, the severity scale MILD or SEV for COVID-19), while keeping all other parameters unchanged. Further parameters included the corresponding standard error, t-value, p-value for the respective coefficient, p-values and R-squared values for the multivariate model.

3. Results

Table 2 summarised the general demographic and clinical characteristics of the cohort. There were no significant differences between the three sub-cohorts in terms of age, gender distribution, weight, height and BMI. However, on average, the SEV group was older and somewhat heavier than those in the CTL or MILD groups. The time from infection to study inclusion differed from 8.7 ± 4.8 months for ASY to 10.7 ± 5 months for SEV at the time of assessment. Most patients in the SEV group had presented to a normal ward or monitoring unit, whereas 9 out of 48 patients (19%) from the SEV group were admitted to the intensive care unit (ICU).

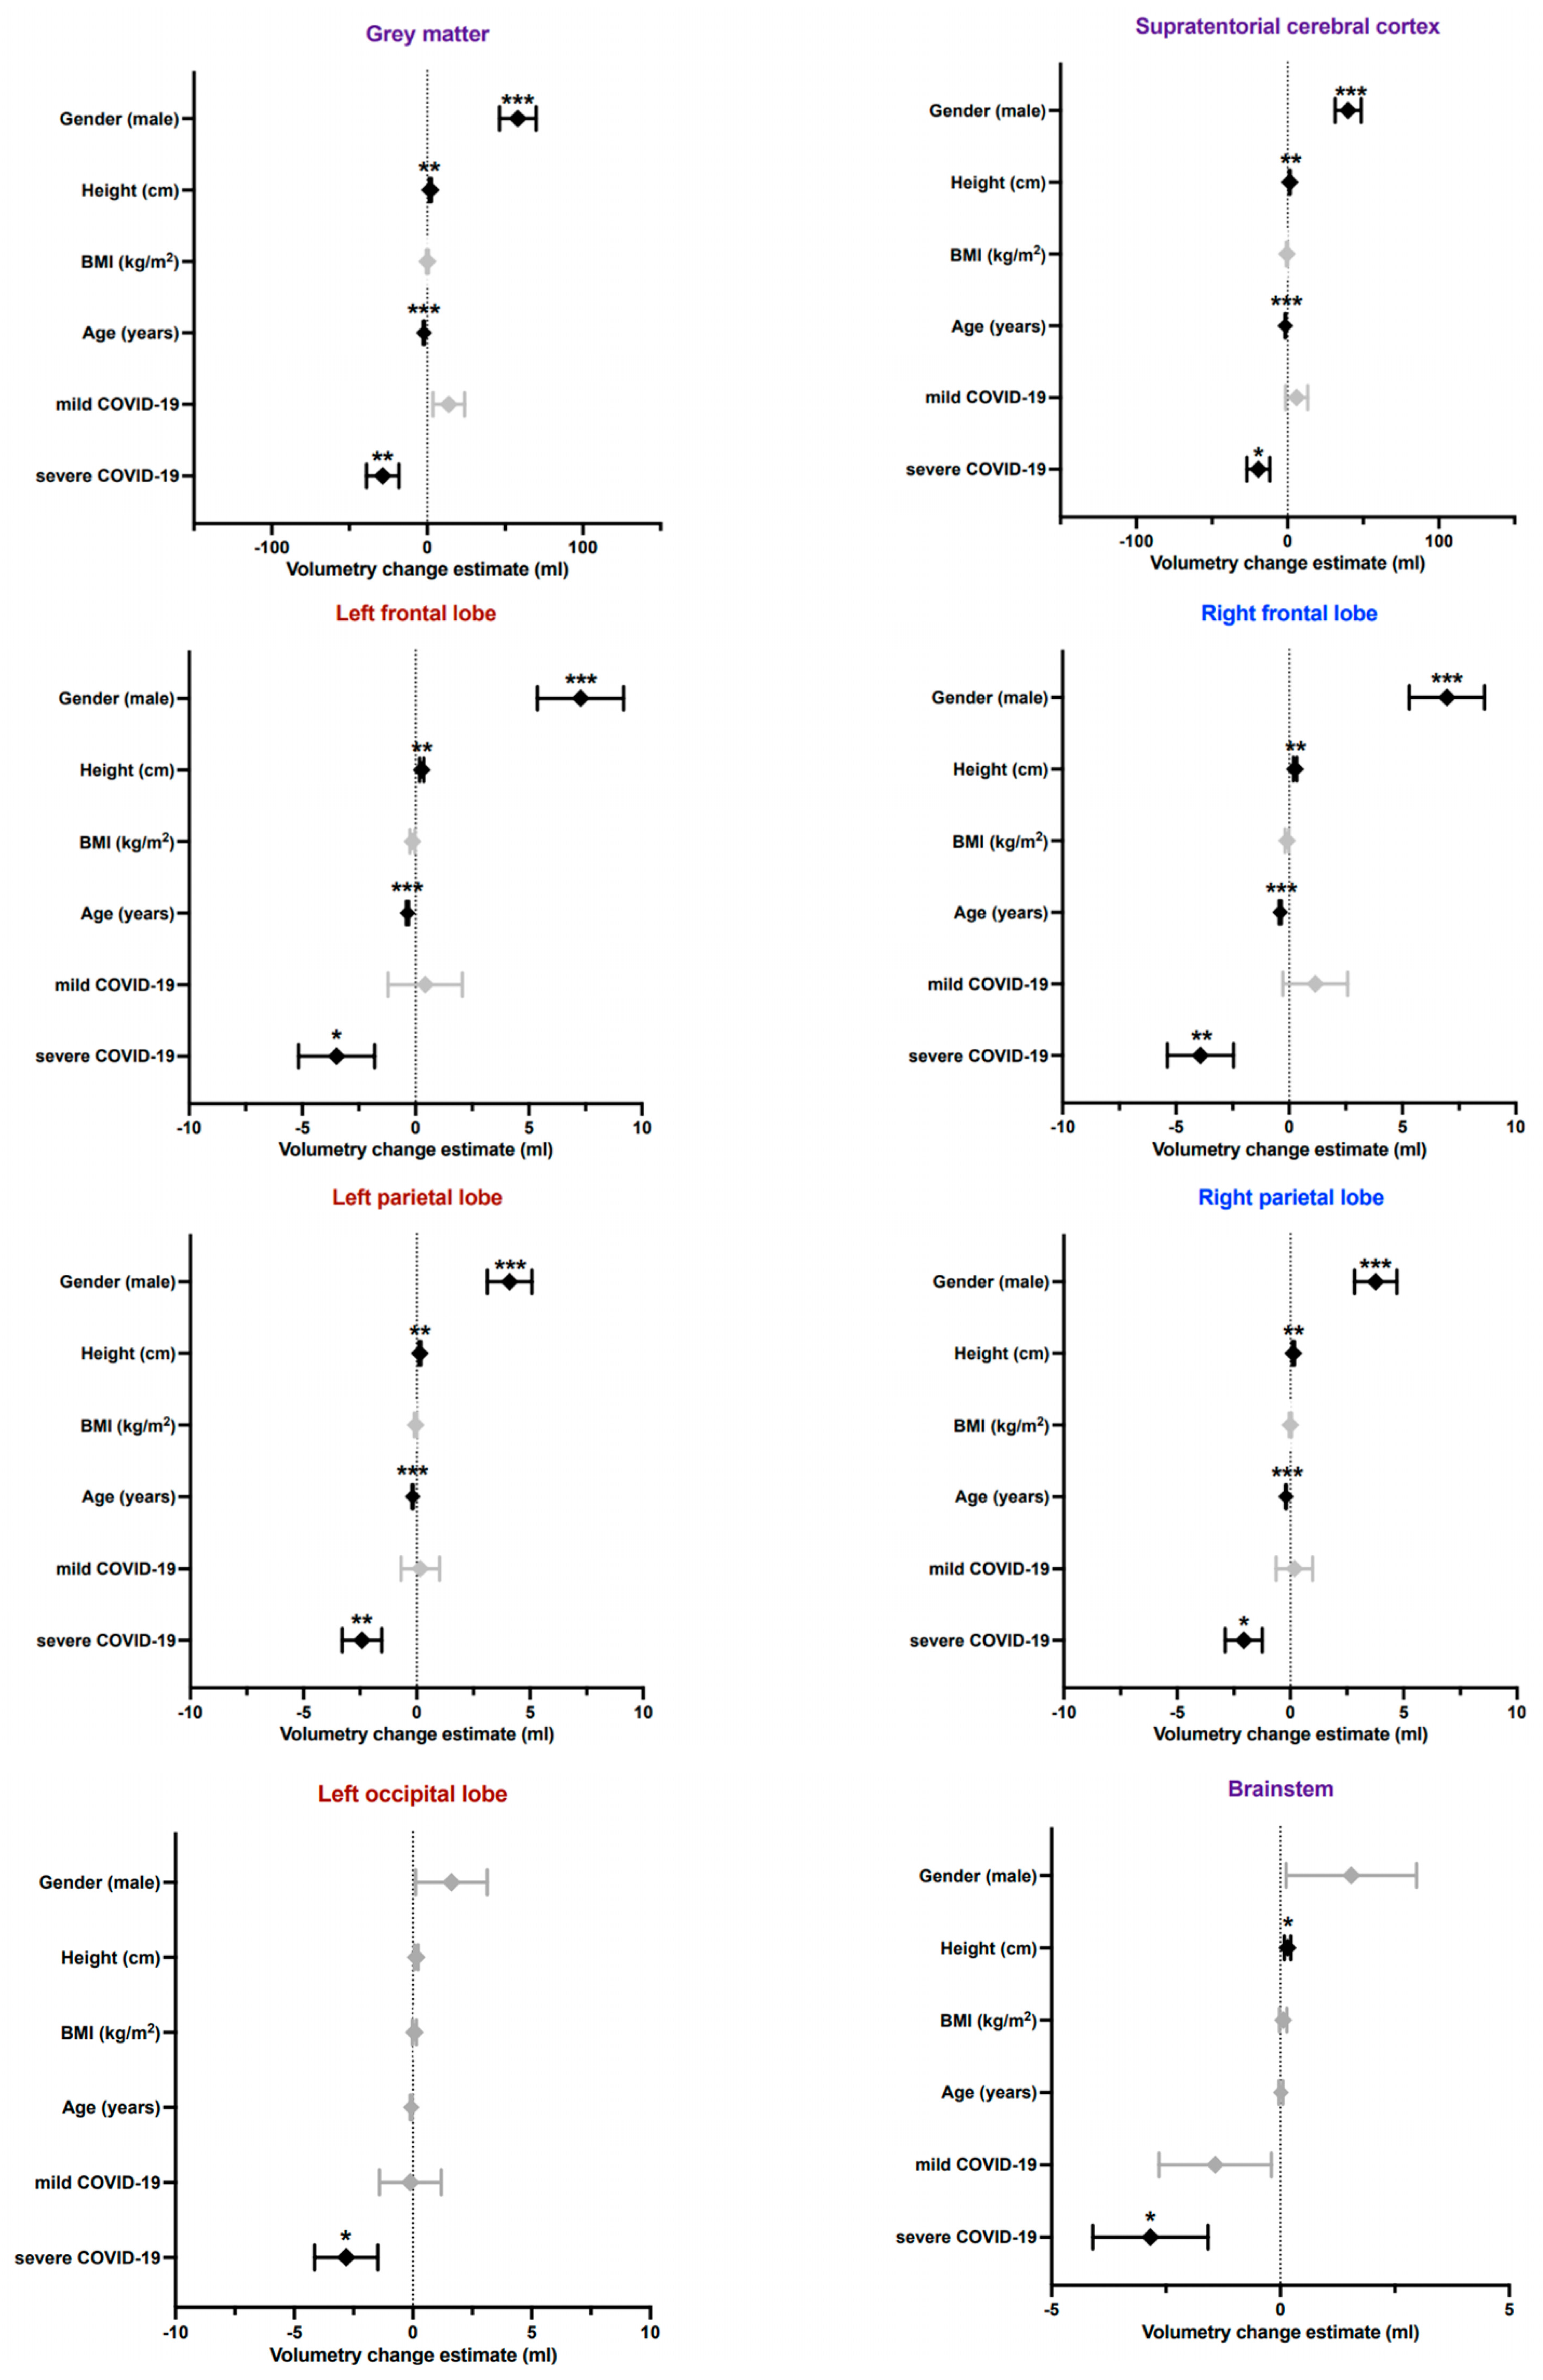
Volumetric Brain Analysis

No imaging findings in the visual clinical assessment led to exclusion of subjects according to the aforementioned exclusion criteria. The volumetry software successfully processed all MR imaging studies, and the measurement results of brain area and ventricle volumes in mL and the corresponding percentiles for the three participant groups CTL, MILD and SEV are shown in Table 3 and Table 4. The mean measured brain volumes of the CTL and MILD groups differed greatly from those of the SEV group. However, the mean measured volumes of the MILD group were of a similar magnitude or slightly higher than those of the CTL group. Exemplary MRI volumetry results are shown in Figure 1.
Comparing all COVID-19 recovered patients (MILD + SEV) with healthy controls, statistically significant smaller volumes in COVID-19 recovered patients were identified for the brainstem volume (74.22 mL vs. 84.68 mL, p = 0.046). Smaller percentiles were detected in the supratentorial grey matter (p = 0.042), frontal lobe right (p = 0.013) and the parietal lobe right (p = 0.03) and left (p = 0.023).
One-way ANOVA analyses across the three groups (CTL, MILD, SEV) revealed statistically significant differences in several brain volumes (see also Supplementary Table S1): whole brain, whole brain grey matter, supratentorial grey matter, frontal lobe right and left, parietal lobe right and left, precuneus right and left, occipital lobe left, temporal lobe right and left, caudate nucleus right and left, putamen right and left, pallidum right and left, thalamus right and left and cerebellar grey matter. Statistically significant differences in brain percentiles were detected in whole brain grey matter, frontal lobe right, caudate nucleus right and left and thalamus right and left.
Post hoc pairwise analyses showed statistically significant differences with increasing volume decline with disease severity (SEV > MILD > CTL) in the following brain areas, as additionally outlined in Supplementary Table S1: whole brain grey matter, supratentorial grey matter, both frontal lobes, both parietal lobes and thalamus right. Further statistically significant pairwise differences in brain volume were found between SEV and MILD, but not between SEV and CTL, in the following areas: whole brain, precuneus right and left, both temporal lobes, parahippocampal gyrus left, both caudate nuclei, putamen right and left, pallidum right and left, and cerebellar grey matter. Arithmetic differences in these brain volumes were also found between the SEV and CTL groups. The SEV group generally had smaller brain subvolumes than the CTL group, but this was not statistically significant in these areas. Regarding brain percentiles, statistically significant differences were detected between the SEV and CTL group in the whole brain, whole brain grey matter, frontal lobe right, caudate nucleus left and thalamus left. Statistically significant differences were observed in brain area percentiles between the SEV and MILD groups in the whole brain white matter, caudate nucleus left and third ventricle.
After excluding the ICU-treated patients (n = 9) from the data analysis, additional pairwise post hoc comparison between the three groups revealed statistically significant decreases in brain volumes that corresponded with increasing severity of disease (SEV > MILD > CTL). This is summarised in Supplementary Table S2, showing the whole brain grey matter, supratentorial grey matter, frontal lobe right, both parietal lobes and thalamus right.
In addition to established determinants of brain volume such as age and sex, the BMI, height and COVID-19 severity (MILD and SEV) were co-analysed as variables in a multivariate model, yielding statistically significant effects of COVID-19 on brain volume decline in the following areas (Table 5; a complete list of results are shown in Supplementary Table S3): whole brain grey matter, supratentorial grey matter, both frontal lobes, both parietal lobes, precuneus right, occipital lobe left, thalamus right and brainstem. The estimated impact of the respective variables on the selected brain volumes is graphically illustrated in Figure 2. Regarding brain percentiles, a statistically significant contribution of severe COVID-19 to the whole brain volume could be detected.

4. Discussion

This MR imaging study evaluated the potential impact of COVID-19 on brain volume in patients after recovery from asymptomatic/mild and severe SARS-CoV-2 infection using automated AI-based volumetry. To date, this study includes the largest number of severely affected COVID-19 patients compared to previously published imaging studies, to the best of our knowledge. Our volumetric analyses revealed small but statistically significant differences in measured brain volumes according to COVID-19 severity. These atrophy patterns primarily affected the total and supratentorial grey matter, both frontal and parietal lobes, and the right thalamus. These findings were further supported by reduced percentiles normalised across the general population in the corresponding brain areas. Notably, the observed group differences were significant even after excluding 9 ICU-treated patients (except for the left frontal lobe). This implies that the potential influence of relaxation, mechanical ventilation or intensified drug therapy on the overall outcome appears largely negligible [12,13]. Moreover, multivariate modelling showed that the severity of COVID-19 had a modest yet statistically significant impact on the measured brain volumes, along with established demographic factors such as age and sex, even after adjustment for ICU admission. Our data, therefore, highlight possible neocortical damage as a sequelae of COVID-19 that could be related to initial disease severity. However, these results likely reflect a cross-sectional effect on COVID-19 recovered individuals, and may not be generalisable, as not all participants exhibited brain changes in the post hoc setting examined here; this is also unlikely to be the case in our upcoming longitudinal studies. Therefore, future studies need to specify the underlying pathologic conditions that may cause severe brain involvement. Our findings may nevertheless be of significant rehabilitative and socioeconomic importance, given the association of brain atrophy with neurodegenerative diseases.
Previous imaging studies have mainly focused on gross CNS abnormalities in acute and hospitalised COVID-19 patients that could only be interpreted by visual assessment [9]. However, most of these studies showed no specific imaging findings or typical spatial distribution in most patients, except for some case series with clusters of white matter lesions or microbleeds within the middle and posterior cerebral artery territory and basal ganglia [14]. Therefore, it is conceivable that COVID-19 mainly causes microstructural damage, as suggested by the fact that macroscopic changes were much less common than microscopic changes in neuropathological case reports [14]. In contrast, our study relied on a fully automated, quantitative, and objective assessment of spatial clusters of brain volume abnormalities. This approach detected visually inconspicuous findings and potentially demonstrated the impact of COVID-19 on brain integrity, unlike most previous imaging studies. To date, only one prospective longitudinal imaging study by Douaud et al. has examined 401 subjects with a mainly mild course, both before and after SARS-CoV-2 infection, and compared them to matched controls using quantitative imaging biomarkers [15]. In a hypothesis-driven and exploratory approach, atrophy patterns were identified in the olfactory and gustatory cortical systems, with longitudinal reductions in grey matter thickness in the left parahippocampal gyrus, left superior (dorsal) insula, and left lateral orbitofrontal cortex, and marked widespread differences in fronto-parietal areas, particularly in the left hemisphere. Although pronounced atrophy was restricted to a few limbic areas, an increase in cerebrospinal fluid volume and a decrease in total brain volume indicated additional diffuse grey matter loss superimposed on the more regional effects observed in olfactory areas. Even though our automated volume measurements were performed on partially larger brain substructures and thus incorporated averaging effects, the results obtained by Douaud et al. are consistent with the atrophy pattern of the fronto-parietal brain observed in our study, and the volume decrease in the temporal lobes, including the gyri hippocampales, accentuated in severely affected patients. Therefore, we can confirm and extend those previous findings given our relatively large number of severely affected patients (n = 48); in severe cases, there may be increased brain damage in the form of atrophy of the whole-brain grey matter. This pattern of grey matter loss is also consistent with findings from two recent 18F-FDG-PET studies, which reported a decrease in glucose uptake in the bilateral fronto-parietal regions of hospitalised patients during the subacute stage of COVID-19 [16]. Additionally, bilateral hypometabolism in the orbital gyrus rectus and right medial temporal lobe was observed in patients who had recovered from COVID-19 [17]. A recent post hoc CT-based volumetric study found no significant differences between acutely hospitalised COVID-19 patients and control subjects, but did identify reduced grey matter volume in the frontal regions [18]. Similarly, a post-infection MR imaging study of 51 previously hospitalised COVID-19 patients revealed subtle abnormalities in terms of prolonged thalamic T2* relaxation times compared with matched controls, especially in the right thalamus, and more commonly in those with milder courses [19]. While we also observed thalamic atrophy in mild and severe COVID-19 courses, especially in the right thalamus, interpretation of the possible correlations of atrophy and T2* signal would be rather speculative. However, it is important to note that changes in microvascularity can alter T2* signalling, and microvascular injury and resulting inflammation may have altered T2* in the thalamus. A dysregulated inflammatory response in COVID-19 patients may be related to subsequent atrophy in the dependent volume [20]. Another recent study of 33 hospitalized COVID-19 cases with neurological impairment [21] also found lower cortical volume in the orbitofrontal, frontal, and cingulate areas in COVID-19 patients compared with healthy subjects, similar to our observations. At the beginning of the pandemic, MRI studies of ICU patients revealed signal abnormalities in the grey matter, particularly the hippocampus, frontal lobe, and insula [22], which align with our findings of lower grey matter volume, particularly in the orbitofrontal cortex, compared to controls. This is not surprising, given that this cortical area serves as a secondary olfactory cortex and may provide a potential direct pathway for SARS-CoV-2 to invade the CNS [23].
Many COVID-19 patients requiring hospitalisation present with mild to moderate neurocognitive deficits [24]. Dedicated neuropsychological testing has shown that hospitalised COVID-19 patients tend to experience the most severe deficits in memory and executive functions. In contrast, their language skills, orientation, general attention, and processing speed are typically mildly affected [10,16]. These specific patterns suggest that general deterioration or fatigue cannot be the plausible cause of these abnormalities. This is particularly evident given that these findings differ from those in post-septic patients, who typically experience impaired attention and processing speed [25,26]. Instead, our findings suggest the involvement of the fronto-parietal cortex, which aligns with the atrophy pattern in the fronto-parietal brain identified in our study by functional neurocognitive results [27]. In particular, the orbitofrontal and cingulate cortex play essential roles in several cognitive functions such as attention, motivation, decision making, and conflict-error monitoring, which are impaired in COVID-19 patients [28,29] and have been altered in our and other recent studies [15,21]. Moreover, some studies suggest that atrophy of the right thalamus, as observed in our study, is associated with cognitive deficits, including impairments in memory and attention [30].
The pathomechanisms of the acute and long-term neurologic damage resulting from COVID-19 remain largely unclear. However, secondary immune-mediated inflammatory complications [31] are discussed as triggers of neurologic and neurocognitive dysfunction in addition to direct viral invasion [32], given the known neurotropism of the coronavirus [33,34]. Functional PET studies have shown that neocortical damage might not result from persistent encephalitis or systemically triggered local inflammation [16,17]. One hypothesis is that SARS-CoV-2 enters the central nervous system via the olfactory mucosa and directly affects neurons [35]. The symptoms of hyposmia and hypogeusia often precede the full onset of the disease [8], and the neurons in the olfactory and gustatory networks show volumetrically pronounced atrophy [15,17,18,19], providing support for this idea. A study of olfactory loss, both congenital and acquired, found a positive correlation between grey matter volume in the orbitofrontal cortex and olfactory function [36]. Another hypothesis is that hypoxic brain injury may be responsible for the observed brain changes [14]. This is consistent with the finding that chronic under-supply of oxygen, as seen in patients with advanced chronic obstructive pulmonary diseases, causes a reduction in grey matter in widespread regions such as the frontal cortex, cingulate cortex, and other subcortical regions [37]. However, recent studies have identified structural brain changes in asymptomatic COVID-19 patients, as described in our own and other studies [10,15,19]. This makes a hypoxic aetiology of the observed changes less plausible, despite reports of individual cases of restitution after hypoxic brain damage [38].
Several limitations of this exploratory study must be acknowledged. Cross-sectional comparisons were made between healthy controls and COVID-19 patients who had already recovered. Accordingly, it cannot be determined with certainty whether relevant brain changes in COVID-19 patients existed before SARS-CoV-2 infection. The observed effects could ultimately be related to a pre-existing increased susceptibility of the brain to the effects of COVID-19, or therapeutic procedures. However, a recent large-scale pre-post imaging study supports our findings through the substantial overlap with the longitudinally assessed brain atrophies [15]. Furthermore, because our study was observational and not a controlled interventional study, the causality of the observed brain volume changes, in general, cannot be attributed with certainty to COVID-19. The cohort acquisition took place during the ongoing coronavirus pandemic, which saw the emergence of other viral variants such as Delta and Omicron in addition to the wild-type coronavirus. This raises the question whether the observed brain changes could be an expression of a specific strain of the virus. It is well known that patients admitted to the ICU and survivors of critical illness often exhibit neuropsychological and brain changes, including atrophies particularly of the basal ganglia and hippocampi [12,13,26,39]. Nevertheless, our results indicate that these changes do not merely reflect post-ICU effects, as we observed differences in non-hospitalised patients, and even after excluding ICU-patients. Finally, the use of higher resolution volumetry (i.e., segmentation and measurement of finer brain substructures) could potentially reveal further or even greater differences between subcohorts. However, this was not possible with our CE-marked commercial software solution. The use of an in-house built software solution with refined segmentation would have the major disadvantage of complicating comparisons with respect to multicentre research and clinical follow-up.

5. Conclusions

We identified a consistent spatial pattern of grey matter loss and focal atrophy in COVID-19 recovered patients, particularly in the frontal and parietal lobes and the right thalamus. These structural changes in the brain are broadly consistent with preliminary volumetric observations of grey matter loss, and were more pronounced in patients with greater disease severity of SARS-CoV-2 infection, regardless of prior ICU treatment. This strongly suggests a causal relationship between COVID-19 and the observed brain changes. Notably, our volumetric results were additionally substantiated by a concomitant decline in percentiles in the corresponding brain areas, setting our study apart from most previous imaging studies. This means that the measured brain volume differences of post-COVID-19 subjects not only exist in absolute numbers compared to our matched control and patient groups, but that the differences also increase with respect to the age- and sex-adjusted general population, with increasing severity of the initial disease. Whether these abnormal changes are due to the spread of the disease or the virus itself, which may result in future vulnerability to neurocognitive deficits or exacerbation of pre-existing neurodegenerative conditions in these patients, remains to be investigated. Our ongoing prospective re-imaging study promises to provide further insight into the cerebral effects of COVID-19, pending completion of the clinical and imaging follow-ups. To this end, our longitudinal investigation will specifically pursue two goals in the near future. Firstly, we aim to correlate the volumetric data with clinical neurologic, pneumonologic, and neuropsychologic findings to verify the potential clinical significance of the observed brain changes. Secondly, pending follow-ups may reveal whether there is a dynamic of brain atrophy over time, which might indicate the triggering of a chronic neurodegenerative process.

Supplementary Materials

The following supporting information can be downloaded at: https://www.mdpi.com/article/10.3390/diagnostics13101716/s1, Table S1: pairwise analyses; Table S2: pairwise analyses ex ICU; Table S3: multivariate analysis.

Author Contributions

Conceptualization, Z.B., C.N.W. and F.C.S.; methodology, Z.B., J.P.L., Y.L.L., C.N.W., D.P. and F.C.S.; software, D.P., N.C.L. and F.C.S.; validation, Z.B., C.N.W., J.P.L. and F.C.S.; formal analysis, Z.B., J.P.L., Y.L.L., C.N.W. and F.C.S.; investigation, Z.B., C.N.W., M.S., L.B., D.P., N.C.L. and F.C.S.; resources, M.T.H., A.R. and F.C.S.; data curation, Z.B., C.N.W., M.S. and F.C.S.; writing—original draft preparation, Z.B. and F.C.S.; writing—review and editing, all authors; visualization, Z.B., J.P.L., Y.L.L. and F.C.S.; supervision, A.R. and F.C.S.; project administration, C.N.W. and F.C.S.; funding acquisition, C.N.W., M.T.H., A.R. and F.C.S. All authors have read and agreed to the published version of the manuscript.

Funding

This research was funded by the German Ministry of Health for the Umbrella Project COVIMMUNE—Untersuchungen zur Funktion des Immunsystems und dem Krankheitsverlauf von COVID-19. Grant Number 01K/20343.

Institutional Review Board Statement

This study protocol was reviewed by the Medical Ethics Review Board of the University Hospital Bonn (IRB Number 511/20, approved on 10 March 2021).

Informed Consent Statement

Informed consent was obtained from all subjects involved in the study.

Data Availability Statement

All relevant scientific data are included in the manuscript or the Supplementary Materials.

Acknowledgments

We gratefully acknowledge the help and technical expertise of Andrea Reiland and all radiographers at the Neuroradiology department of Bonn University Hospital.

Conflicts of Interest

The authors declare no conflict of interest regarding the subject matter of the article. The German Ministry of Health had no role in the design and preparation, review, or approval of the manuscript, or in the decision to submit the manuscript for publication.

References

  1. Aghagoli, G.; Gallo Marin, B.; Katchur, N.J.; Chaves-Sell, F.; Asaad, W.F.; Murphy, S.A. Neurological Involvement in COVID-19 and Potential Mechanisms: A Review. Neurocritcal Care 2021, 34, 1062–1071. [Google Scholar] [CrossRef]
  2. Lechien, J.R.; Chiesa-Estomba, C.M.; De Siati, D.R.; Horoi, M.; Le Bon, S.D.; Rodriguez, A.; Dequanter, D.; Blecic, S.; El Afia, F.; Distinguin, L.; et al. Olfactory and gustatory dysfunctions as a clinical presentation of mild-to-moderate forms of the coronavirus disease (COVID-19): A multicenter European study. Eur. Arch. Otorhinolaryngol. 2020, 277, 2251–2261. [Google Scholar] [CrossRef] [PubMed]
  3. Ortelli, P.; Ferrazzoli, D.; Sebastianelli, L.; Engl, M.; Romanello, R.; Nardone, R.; Bonini, I.; Koch, G.; Saltuari, L.; Quartarone, A.; et al. Neuropsychological and neurophysiological correlates of fatigue in post-acute patients with neurological manifestations of COVID-19: Insights into a challenging symptom. J. Neurol. Sci. 2021, 420, 117271. [Google Scholar] [CrossRef]
  4. Romagnolo, A.; Balestrino, R.; Imbalzano, G.; Ciccone, G.; Riccardini, F.; Artusi, C.A.; Bozzali, M.; Ferrero, B.; Montalenti, E.; Montanaro, E.; et al. Neurological comorbidity and severity of COVID-19. J. Neurol. 2021, 268, 762–769. [Google Scholar] [CrossRef] [PubMed]
  5. Herman, C.; Mayer, K.; Sarwal, A. Scoping review of prevalence of neurologic comorbidities in patients hospitalized for COVID-19. Neurology 2020, 95, 77–84. [Google Scholar] [CrossRef]
  6. Heneka, M.T.; Golenbock, D.; Latz, E.; Morgan, D.; Brown, R. Immediate and long-term consequences of COVID-19 infections for the development of neurological disease. Alzheimer’s Res. Ther. 2020, 12, 69. [Google Scholar] [CrossRef]
  7. Mao, L.; Jin, H.; Wang, M.; Hu, Y.; Chen, S.; He, Q.; Chang, J.; Hong, C.; Zhou, Y.; Wang, D.; et al. Neurologic Manifestations of Hospitalized Patients With Coronavirus Disease 2019 in Wuhan, China. JAMA Neurol. 2020, 77, 683–690. [Google Scholar] [CrossRef]
  8. Helms, J.; Kremer, S.; Merdji, H.; Clere-Jehl, R.; Schenck, M.; Kummerlen, C.; Collange, O.; Boulay, C.; Fafi-Kremer, S.; Ohana, M.; et al. Neurologic Features in Severe SARS-CoV-2 Infection. N. Engl. J. Med. 2020, 382, 2268–2270. [Google Scholar] [CrossRef]
  9. Paterson, R.W.; Brown, R.L.; Benjamin, L.; Nortley, R.; Wiethoff, S.; Bharucha, T.; Jayaseelan, D.L.; Kumar, G.; Raftopoulos, R.E.; Zambreanu, L.; et al. The emerging spectrum of COVID-19 neurology: Clinical, radiological and laboratory findings. Brain 2020, 143, 3104–3120. [Google Scholar] [CrossRef]
  10. Widmann, C.N.; Wieberneit, M.; Bieler, L.; Bernsen, S.; Grafenkamper, R.; Brosseron, F.; Schmeel, C.; Tacik, P.; Skowasch, D.; Radbruch, A.; et al. Longitudinal Neurocognitive and Pulmonological Profile of Long COVID-19: Protocol for the COVIMMUNE-Clin Study. JMIR Res. Protoc. 2021, 10, e30259. [Google Scholar] [CrossRef] [PubMed]
  11. Dieckmeyer, M.; Roy, A.G.; Senapati, J.; Wachinger, C.; Grundl, L.; Dopfert, J.; Bertran, P.F.; Lemke, A.; Zimmer, C.; Kirschke, J.S.; et al. Effect of MRI acquisition acceleration via compressed sensing and parallel imaging on brain volumetry. Magn. Reson. Mater. Phys. Biol. Med. 2021, 34, 487–497. [Google Scholar] [CrossRef] [PubMed]
  12. Suchyta, M.R.; Jephson, A.; Hopkins, R.O. Neurologic changes during critical illness: Brain imaging findings and neurobehavioral outcomes. Brain Imaging Behav. 2010, 4, 22–34. [Google Scholar] [CrossRef]
  13. Gunther, M.L.; Morandi, A.; Krauskopf, E.; Pandharipande, P.; Girard, T.D.; Jackson, J.C.; Thompson, J.; Shintani, A.K.; Geevarghese, S.; Miller, R.R., 3rd; et al. The association between brain volumes, delirium duration, and cognitive outcomes in intensive care unit survivors: The VISIONS cohort magnetic resonance imaging study*. Crit. Care Med. 2012, 40, 2022–2032. [Google Scholar] [CrossRef] [PubMed]
  14. Manca, R.; De Marco, M.; Ince, P.G.; Venneri, A. Heterogeneity in Regional Damage Detected by Neuroimaging and Neuropathological Studies in Older Adults With COVID-19: A Cognitive-Neuroscience Systematic Review to Inform the Long-Term Impact of the Virus on Neurocognitive Trajectories. Front. Aging Neurosci. 2021, 13, 646908. [Google Scholar] [CrossRef]
  15. Douaud, G.; Lee, S.; Alfaro-Almagro, F.; Arthofer, C.; Wang, C.; McCarthy, P.; Lange, F.; Andersson, J.L.R.; Griffanti, L.; Duff, E.; et al. SARS-CoV-2 is associated with changes in brain structure in UK Biobank. Nature 2022, 604, 697–707. [Google Scholar] [CrossRef] [PubMed]
  16. Hosp, J.A.; Dressing, A.; Blazhenets, G.; Bormann, T.; Rau, A.; Schwabenland, M.; Thurow, J.; Wagner, D.; Waller, C.; Niesen, W.D.; et al. Cognitive impairment and altered cerebral glucose metabolism in the subacute stage of COVID-19. Brain 2021, 144, 1263–1276. [Google Scholar] [CrossRef]
  17. Guedj, E.; Million, M.; Dudouet, P.; Tissot-Dupont, H.; Bregeon, F.; Cammilleri, S.; Raoult, D. (18)F-FDG brain PET hypometabolism in post-SARS-CoV-2 infection: Substrate for persistent/delayed disorders? Eur. J. Nucl. Med. Mol. Imaging 2021, 48, 592–595. [Google Scholar] [CrossRef] [PubMed]
  18. Duan, K.; Premi, E.; Pilotto, A.; Cristillo, V.; Benussi, A.; Libri, I.; Giunta, M.; Bockholt, H.J.; Liu, J.; Campora, R.; et al. Alterations of frontal-temporal gray matter volume associate with clinical measures of older adults with COVID-19. Neurobiol. Stress 2021, 14, 100326. [Google Scholar] [CrossRef]
  19. Griffanti, L.; Raman, B.; Alfaro-Almagro, F.; Filippini, N.; Cassar, M.P.; Sheerin, F.; Okell, T.W.; Kennedy McConnell, F.A.; Chappell, M.A.; Wang, C.; et al. Adapting the UK Biobank Brain Imaging Protocol and Analysis Pipeline for the C-MORE Multi-Organ Study of COVID-19 Survivors. Front. Neurol. 2021, 12, 753284. [Google Scholar] [CrossRef]
  20. Lee, M.H.; Perl, D.P.; Nair, G.; Li, W.; Maric, D.; Murray, H.; Dodd, S.J.; Koretsky, A.P.; Watts, J.A.; Cheung, V.; et al. Microvascular Injury in the Brains of Patients with COVID-19. N. Engl. J. Med. 2021, 384, 481–483. [Google Scholar] [CrossRef]
  21. Sanabria-Diaz, G.; Etter, M.M.; Melie-Garcia, L.; Lieb, J.M.; Psychogios, M.N.; Hutter, G.; Granziera, C. Brain cortical alterations in COVID-19 patients with neurological symptoms. Front. Neurosci. 2022, 16, 992165. [Google Scholar] [CrossRef] [PubMed]
  22. Kandemirli, S.G.; Dogan, L.; Sarikaya, Z.T.; Kara, S.; Akinci, C.; Kaya, D.; Kaya, Y.; Yildirim, D.; Tuzuner, F.; Yildirim, M.S.; et al. Brain MRI Findings in Patients in the Intensive Care Unit with COVID-19 Infection. Radiology 2020, 297, E232–E235. [Google Scholar] [CrossRef] [PubMed]
  23. Bougakov, D.; Podell, K.; Goldberg, E. Multiple Neuroinvasive Pathways in COVID-19. Mol. Neurobiol. 2021, 58, 564–575. [Google Scholar] [CrossRef]
  24. Romoli, M.; Jelcic, I.; Bernard-Valnet, R.; Garcia Azorin, D.; Mancinelli, L.; Akhvlediani, T.; Monaco, S.; Taba, P.; Sellner, J.; Infectious Disease Panel of the European Academy of Neurology. A systematic review of neurological manifestations of SARS-CoV-2 infection: The devil is hidden in the details. Eur. J. Neurol. 2020, 27, 1712–1726. [Google Scholar] [CrossRef] [PubMed]
  25. Calsavara, A.J.C.; Nobre, V.; Barichello, T.; Teixeira, A.L. Post-sepsis cognitive impairment and associated risk factors: A systematic review. Aust. Crit. Care 2018, 31, 242–253. [Google Scholar] [CrossRef]
  26. Jackson, J.C.; Pandharipande, P.P.; Girard, T.D.; Brummel, N.E.; Thompson, J.L.; Hughes, C.G.; Pun, B.T.; Vasilevskis, E.E.; Morandi, A.; Shintani, A.K.; et al. Depression, post-traumatic stress disorder, and functional disability in survivors of critical illness in the BRAIN-ICU study: A longitudinal cohort study. Lancet Respir. Med. 2014, 2, 369–379. [Google Scholar] [CrossRef]
  27. Julayanont, P.; Tangwongchai, S.; Hemrungrojn, S.; Tunvirachaisakul, C.; Phanthumchinda, K.; Hongsawat, J.; Suwichanarakul, P.; Thanasirorat, S.; Nasreddine, Z.S. The Montreal Cognitive Assessment-Basic: A Screening Tool for Mild Cognitive Impairment in Illiterate and Low-Educated Elderly Adults. J. Am. Geriatr. Soc. 2015, 63, 2550–2554. [Google Scholar] [CrossRef]
  28. Ibi, K.; Fujii, K.; Kobayashi, H.; Senda, M.; Kitazawa, K.; Honda, A. Anterior cingulate cortex involvement in non-paraneoplastic limbic encephalitis. Brain Dev. 2019, 41, 735–739. [Google Scholar] [CrossRef]
  29. Lu, Y.; Li, X.; Geng, D.; Mei, N.; Wu, P.Y.; Huang, C.C.; Jia, T.; Zhao, Y.; Wang, D.; Xiao, A.; et al. Cerebral Micro-Structural Changes in COVID-19 Patients—An MRI-based 3-month Follow-up Study. EClinicalMedicine 2020, 25, 100484. [Google Scholar] [CrossRef]
  30. Seidenberg, M.; Hermann, B.; Pulsipher, D.; Morton, J.; Parrish, J.; Geary, E.; Guidotti, L. Thalamic atrophy and cognition in unilateral temporal lobe epilepsy. J. Int. Neuropsychol. Soc. 2008, 14, 384–393. [Google Scholar] [CrossRef]
  31. Yang, A.C.; Kern, F.; Losada, P.M.; Agam, M.R.; Maat, C.A.; Schmartz, G.P.; Fehlmann, T.; Stein, J.A.; Schaum, N.; Lee, D.P.; et al. Dysregulation of brain and choroid plexus cell types in severe COVID-19. Nature 2021, 595, 565–571. [Google Scholar] [CrossRef] [PubMed]
  32. de Erausquin, G.A.; Snyder, H.; Carrillo, M.; Hosseini, A.A.; Brugha, T.S.; Seshadri, S.; CNS SARS-CoV-2 Consortium. The chronic neuropsychiatric sequelae of COVID-19: The need for a prospective study of viral impact on brain functioning. Alzheimer’s Dement. 2021, 17, 1056–1065. [Google Scholar] [CrossRef]
  33. Meinhardt, J.; Radke, J.; Dittmayer, C.; Franz, J.; Thomas, C.; Mothes, R.; Laue, M.; Schneider, J.; Brunink, S.; Greuel, S.; et al. Olfactory transmucosal SARS-CoV-2 invasion as a port of central nervous system entry in individuals with COVID-19. Nat. Neurosci. 2021, 24, 168–175. [Google Scholar] [CrossRef] [PubMed]
  34. Butowt, R.; Meunier, N.; Bryche, B.; von Bartheld, C.S. The olfactory nerve is not a likely route to brain infection in COVID-19: A critical review of data from humans and animal models. Acta Neuropathol. 2021, 141, 809–822. [Google Scholar] [CrossRef] [PubMed]
  35. Butowt, R.; Bilinska, K.; von Bartheld, C.S. Olfactory dysfunction in COVID-19: New insights into the underlying mechanisms. Trends Neurosci. 2023, 46, 75–90. [Google Scholar] [CrossRef]
  36. Postma, E.M.; Smeets, P.A.M.; Boek, W.M.; Boesveldt, S. Investigating morphological changes in the brain in relation to etiology and duration of olfactory dysfunction with voxel-based morphometry. Sci. Rep. 2021, 11, 12704. [Google Scholar] [CrossRef]
  37. Zhang, H.; Wang, X.; Lin, J.; Sun, Y.; Huang, Y.; Yang, T.; Zheng, S.; Fan, M.; Zhang, J. Reduced regional gray matter volume in patients with chronic obstructive pulmonary disease: A voxel-based morphometry study. AJNR Am. J. Neuroradiol. 2013, 34, 334–339. [Google Scholar] [CrossRef]
  38. Harch, P.G.; Fogarty, E.F. Subacute normobaric oxygen and hyperbaric oxygen therapy in drowning, reversal of brain volume loss: A case report. Med. Gas Res. 2017, 7, 144–149. [Google Scholar] [CrossRef]
  39. Wilcox, M.E.; Brummel, N.E.; Archer, K.; Ely, E.W.; Jackson, J.C.; Hopkins, R.O. Cognitive dysfunction in ICU patients: Risk factors, predictors, and rehabilitation interventions. Crit. Care Med. 2013, 41, S81–S98. [Google Scholar] [CrossRef]
Figure 1. Examples of fully automated, artificial intelligence (AI)-based brain volumetry in patients with severe (left) and mild (right) cases of COVID-19, showing various brain volumes, along with the deviations of all volumes from a normative collective. These deviations are reported as either 2 or 4 standard deviations.
Diagnostics 13 01716 g001
Figure 2. Graphically illustrated results of multivariate modelling in selected brain areas showing the amount by which the dependent variable (volume in mL of a certain brain area) changes when the independent variable increases by one unit (years for age, cm for height and kg/m2 for BMI, severity MILD or SEV for COVID-19). Unilateral or whole brain structures are labelled purple, whereas areas on the left are red, and those on the right are blue. *= p ≤ 0.05, **= p ≤ 0.01, ***= p ≤ 0.001.
Diagnostics 13 01716 g002
Table 1. Sequence parameters.
SequencePulse TypeOrientationTR (ms)TE (ms)Reconstructed Voxel Size (mm)Matrix (mm)Slices
T2wTurbo spin echoaxial13.257900.94 × 0.94 × 1240 × 174140
SWI3D fast field echoaxial3100.6 × 0.6 × 2384 × 316145
DWIb values (0, 500, 1000 s/mm2)axial2725411 × 1 × 5128 × 12724
T1wMPRAGEsagittal7.33.91 × 1 × 1256 × 256180
FLAIR3D gradient echo sagittal48002751.12 × 1.12 × 1.12240 × 240321
DWI: diffusion-weighted imaging, MPRAGE: magnetisation prepared-rapid gradient echo, SWI: susceptibility-weighted imaging, T1W: T1-weighted, T2W: T2-weighted, TE: echo time, TR: repetition time.
Table 2. Patient demographics and characteristics.
CharacteristicsHealthy Control Subjects (CTL)Mild COVID-19 Course (MILD)Severe COVID-19 Course (SEV)Totalp-Value a
n565148155
Age (years)47.0 ± 13.345.7 ± 12.450.6 ± 12.047.7 ± 12.70.612
Gender (m:f)26:2528:2825:2378:760.775
Height (mm)175.0 ± 10.5173.6 ± 10.7172.8 ± 10.0173.8 ± 9.90.316
Weight (kg)79.6 ± 16.281.8 ± 23.584.4 ± 20.781.8 ± 20.20.315
BMI25.9 ± 4.327.2 ± 9.127.9 ± 6.127 ± 6.70.154
a calculated with Kruskal–Wallis test; statistical significance set at p ≤ 0.05.
Table 3. Absolute brain area and ventricle volumes (mL).
Brain RegionCTL MILD SEV
Mean±SDMean±SDMean±SDp-Value a
Whole brain1264.18117.281298.19143.631210.70113.490.003
Whole brain white substance554.2461.31571.7974.26537.2057.180.32
Whole brain grey substance709.8364.35726.8779.03670.3471.03≤0.001
Supratentorial gross cerebral cortex483.6846.01491.1758.25455.7948.260.002
Frontal right 91.289.7292.8111.2085.329.370.001
Frontal left87.529.0588.2213.7382.059.230.01
Parietal right 48.095.1248.535.8745.105.400.004
Parietal left 50.295.4450.636.0146.915.520.002
Precuneus right 11.441.4511.661.6010.771.360.008
Precuneus left 11.912.0512.161.7611.211.720.032
Occipital right31.523.3833.279.4030.265.510.073
Occipital left37.838.0937.797.3234.614.670.031
Temporal right71.607.2073.839.2068.497.440.005
Temporal left66.468.3168.209.6463.996.730.045
Mesiotemporal right23.8611.0026.2810.7923.9110.240.423
Mesiotemporal left22.4410.2324.679.7722.409.340.402
Hippocampus right5.025.874.350.534.170.420.43
Hippocampus left5.5410.694.873.794.120.580.569
Gyrus parahippocampalis right3.270.373.400.443.220.330.053
Gyrus parahippocampalis left3.410.333.550.373.320.330.005
Regio entorhinalis right2.510.312.600.322.470.240.097
Regio entorhinalis left2.450.282.520.312.420.300.27
Nucleus caudatus right3.300.433.490.403.190.430.002
Nucleus caudatus left2.930.383.150.352.840.40≤0.001
Putamen right4.190.464.330.514.020.480.006
Putamen left4.310.474.450.554.110.460.004
Pallidum right 1.430.171.470.151.380.140.014
Pallidum left1.380.151.440.161.340.150.005
Thalamus right8.130.768.350.817.660.77≤0.001
Thalamus left8.460.818.461.357.990.780.031
Brainstem 27.8710.3126.392.9224.882.620.072
Mesencephalon8.9112.297.230.906.810.840.307
Pons15.8611.1814.361.7713.591.470.228
Cerebellar grey matter109.6225.60112.5211.18105.9811.480.017
Left ventricle10.097.468.515.928.835.140.389
Right ventricle9.916.219.015.559.565.440.723
Third ventricle0.690.410.760.390.780.350.423
Fourth ventricle1.160.371.200.421.100.360.378
a calculated with one-way analysis of variance; statistical significance set at p ≤ 0.05.
Table 4. Percentiles of brain areas and ventricle volumes.
Brain RegionCTL MILD SEV
Mean±SDMean±SDMean±SDp-Value a
Whole brain82.0917.4080.5621.5171.0927.130.029
Whole brain white substance85.8216.0285.8416.6782.5524.630.619
Whole brain grey substance56.1424.2353.1826.6043.6526.240.041
Supratentorial gross cerebral cortex46.4925.9840.3526.0235.0526.770.088
Frontal right 55.3126.8146.8427.6739.8527.970.018
Frontal left48.4125.5343.4827.3035.8327.840.061
Parietal right 34.1621.8926.2721.0928.8724.100.178
Parietal left 46.4425.2636.9123.8736.2626.090.066
Precuneus right 47.7829.9145.6826.0042.6526.690.641
Precuneus left 70.3023.3464.9325.7460.3131.780.171
Occipital right23.7024.0821.9223.7219.8423.360.711
Occipital left40.5127.2738.0628.9834.7928.450.589
Temporal right56.3128.0757.8427.5451.7928.190.536
Temporal left56.8330.1359.4427.7049.3028.460.197
Mesiotemporal right48.9532.8953.5428.8348.3432.170.66
Mesiotemporal left48.2133.6652.6128.1948.0231.520.703
Hippocampus right56.1426.7957.4328.6556.0926.770.962
Hippocampus left58.8626.4159.1927.2158.8424.980.997
Gyrus parahippocampalis right62.8328.4169.8828.6167.6822.350.378
Gyrus parahippocampalis left60.6627.7371.5123.2760.9126.970.058
Regio entorhinalis right70.4626.9075.3721.5672.1319.830.543
Regio entorhinalis left59.1126.7463.9926.2358.6226.940.532
Nucleus caudatus right40.5025.8252.1924.9740.3727.250.033
Nucleus caudatus left27.3722.0839.5123.3127.9024.42≤0.001
Putamen right27.6922.3631.9524.2825.7425.120.415
Putamen left29.7124.4233.8425.3725.1122.970.207
Pallidum right 36.6527.6440.7325.4436.0829.200.648
Pallidum left27.0923.8528.5122.1925.0825.640.773
Thalamus right44.4330.4344.1428.1731.9327.930.052
Thalamus left56.7329.8454.3326.6842.8329.390.037
Brainstem 55.9124.9756.3528.3246.2526.650.106
Mesencephalon49.4227.3749.8228.5640.9027.230.198
Pons54.0127.0151.1529.2444.3727.230.204
Cerebellar grey matter68.0124.5670.4525.6060.2427.650.127
Left ventricle54.3731.0648.4829.3156.0727.710.401
Right ventricle54.6731.6451.0829.4656.6129.850.723
Third ventricle48.6429.0143.4729.4459.2027.780.024
Fourth ventricle48.3428.6754.3827.1648.8230.700.498
a calculated with one-way analysis of variance; statistical significance set at p ≤ 0.05.
Table 5. Multivariate modelling in selected brain regions with volumetric changes following severe COVID-19 infection.
Brain Region EstimateStandard Errort-Valuep-Value
Whole brainAge (years)−2.41070.6102−3.951 <0.001
Gender (male)97.184221.33024.556 <0.001
COVID-19 Mild32.695918.37261.780 0.077195
COVID-19 Severe−36.127318.8432−1.917 0.057131
Height4.07551.05743.854 <0.001
BMI−0.92111.1922−0.773 0.441023
Multiple R-squared0.4932 p-value<0.001
Grey matterAge (years)−2.206690.33652−6.557 <0.001
Gender (male)58.2257011.764484.949 <0.001
COVID-19 Mild13.8429310.133241.3660.17398
COVID-19 Severe−28.6440910.39277−2.7560.00658
Height1.924460.583213.3000.00121
BMI0.056460.657570.0860.93169
Multiple R-squared0.5367 p-value<0.001
SupratentorialAge (years)−1.539340.24475−6.289<0.001
cerebral Gender (male)39.973398.556234.671<0.001
cortexCOVID-19 Mild5.921857.369840.8030.42295
COVID-19 Severe−19.362627.55859−2.5610.01141
Height1.379470.424163.2520.00141
BMI−0.413090.47824−0.8630.38911
Multiple R-squared0.5097 p-value<0.001
Frontal lobeAge (years)−0.398900.04735−8.425 <0.001
rightGender (male)6.963031.655264.207 <0.001
COVID-19 Mild1.150131.425750.8070.42114
COVID-19 Severe−3.920921.46226−2.6810.00816
Height0.257410.082063.1370.00206
BMI−0.096470.09252−1.0430.29881
Multiple R-squared0.5397 p-value<0.001
Frontal lobeAge (years)−0.355500.05445−6.529 <0.001
leftGender (male)7.284311.903643.827 <0.001
COVID-19 Mild0.425271.639690.259 0.795716
COVID-19 Severe−3.484251.68168−2.072 0.040011
Height0.271210.094372.874 0.004651
BMI−0.135520.10640−1.274 0.204797
Multiple R-squared0.4524 p-value<0.001
Parietal lobeAge (years)−0.197830.02668−7.414<0.001
rightGender (male)3.762980.932814.034<0.001
COVID-19 Mild0.177470.803470.2210.8255
COVID-19 Severe−2.057890.82405−2.4970.0136
Height0.132980.046242.8760.0046
BMI−0.003550.05214−0.0680.9458
Multiple R-squared0.4866 p-value<0.001
Parietal lobeAge (years)−0.182530.02821−6.47<0.001
leftGender (male)4.099060.986324.156<0.001
COVID-19 Mild0.150450.849560.1770.8597
COVID-19 Severe−2.41840.87132−2.7760.0062
Height0.134950.04892.760.0065
BMI−0.0480.05513−0.8710.3853
Multiple R-squared0.4701 p-value<0.001
PrecuneusAge (years)−0.03790.00757−5.01<0.001
rightGender (male)1.13210.264474.281<0.001
COVID-19 Mild0.167440.22780.7350.4635
COVID-19 Severe−0.48250.23363−2.0650.0406
Height0.033980.013112.5920.0105
BMI0.000590.014780.040.9682
Multiple R-squared0.4255 p-value<0.001
Occipital lobeAge (years)−0.071670.04324−1.6580.0995
leftGender (male)1.621711.511541.0730.2851
COVID-19 Mild−0.109261.30195−0.0840.9332
COVID-19 Severe−2.813611.3353−2.1070.0368
Height0.140920.074931.8810.062
BMI0.059910.084490.7090.4794
Multiple R-squared0.1398 p-value<0.001
ThalamusAge (years)−0.022830.00425−5.375<0.001
rightGender (male)0.34450.148512.320.0217
COVID-19 Mild0.203920.127921.5940.113
COVID-19 Severe−0.337290.13119−2.5710.0111
Height0.02140.007362.9060.0042
BMI−0.002890.0083−0.3480.7284
Multiple R-squared0.3903 p-value<0.001
BrainstemAge (years)0.00990.040760.2430.8083
Gender (male)1.547831.42481.0860.2791
COVID-19 Mild−1.42371.22724−1.160.2479
COVID-19 Severe−2.840741.25867−2.2570.0255
Height0.155660.070632.2040.0291
BMI0.059380.079640.7460.4571
Multiple R-squared0.1434 p-value<0.001
Disclaimer/Publisher’s Note: The statements, opinions and data contained in all publications are solely those of the individual author(s) and contributor(s) and not of MDPI and/or the editor(s). MDPI and/or the editor(s) disclaim responsibility for any injury to people or property resulting from any ideas, methods, instructions or products referred to in the content.

