
Role of Diphosphonates Bone Scintigraphy in Correlation with Biomarkers for a Personalized Approach to ATTR Cardiac Amyloidosis in North-Eastern Romania

 , ,
, ,  and
and
Abstract
:1. Introduction
2. Materials and Method
3. Results
3.1. ATTR Patients
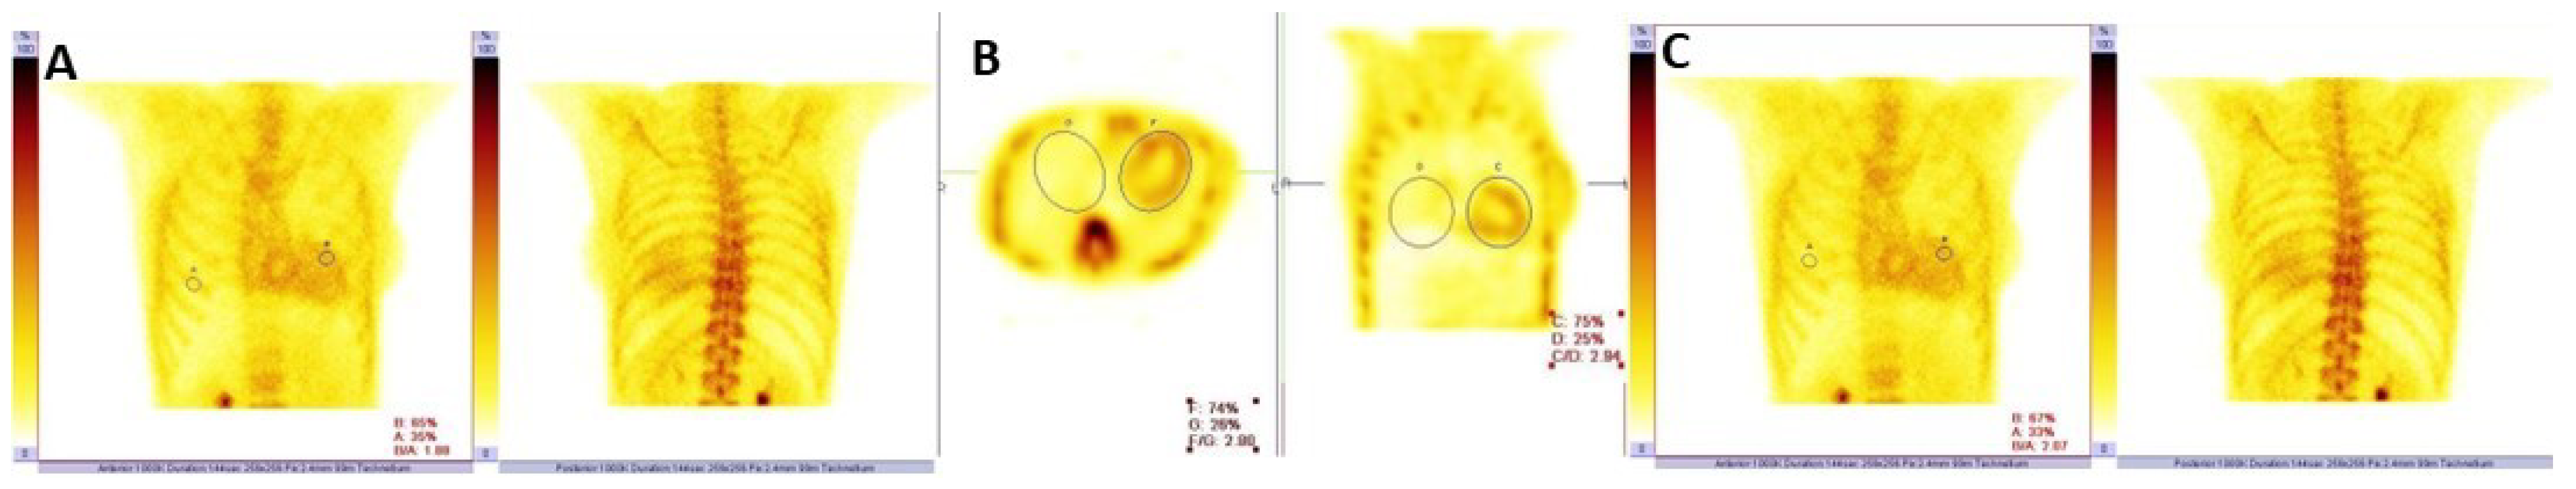
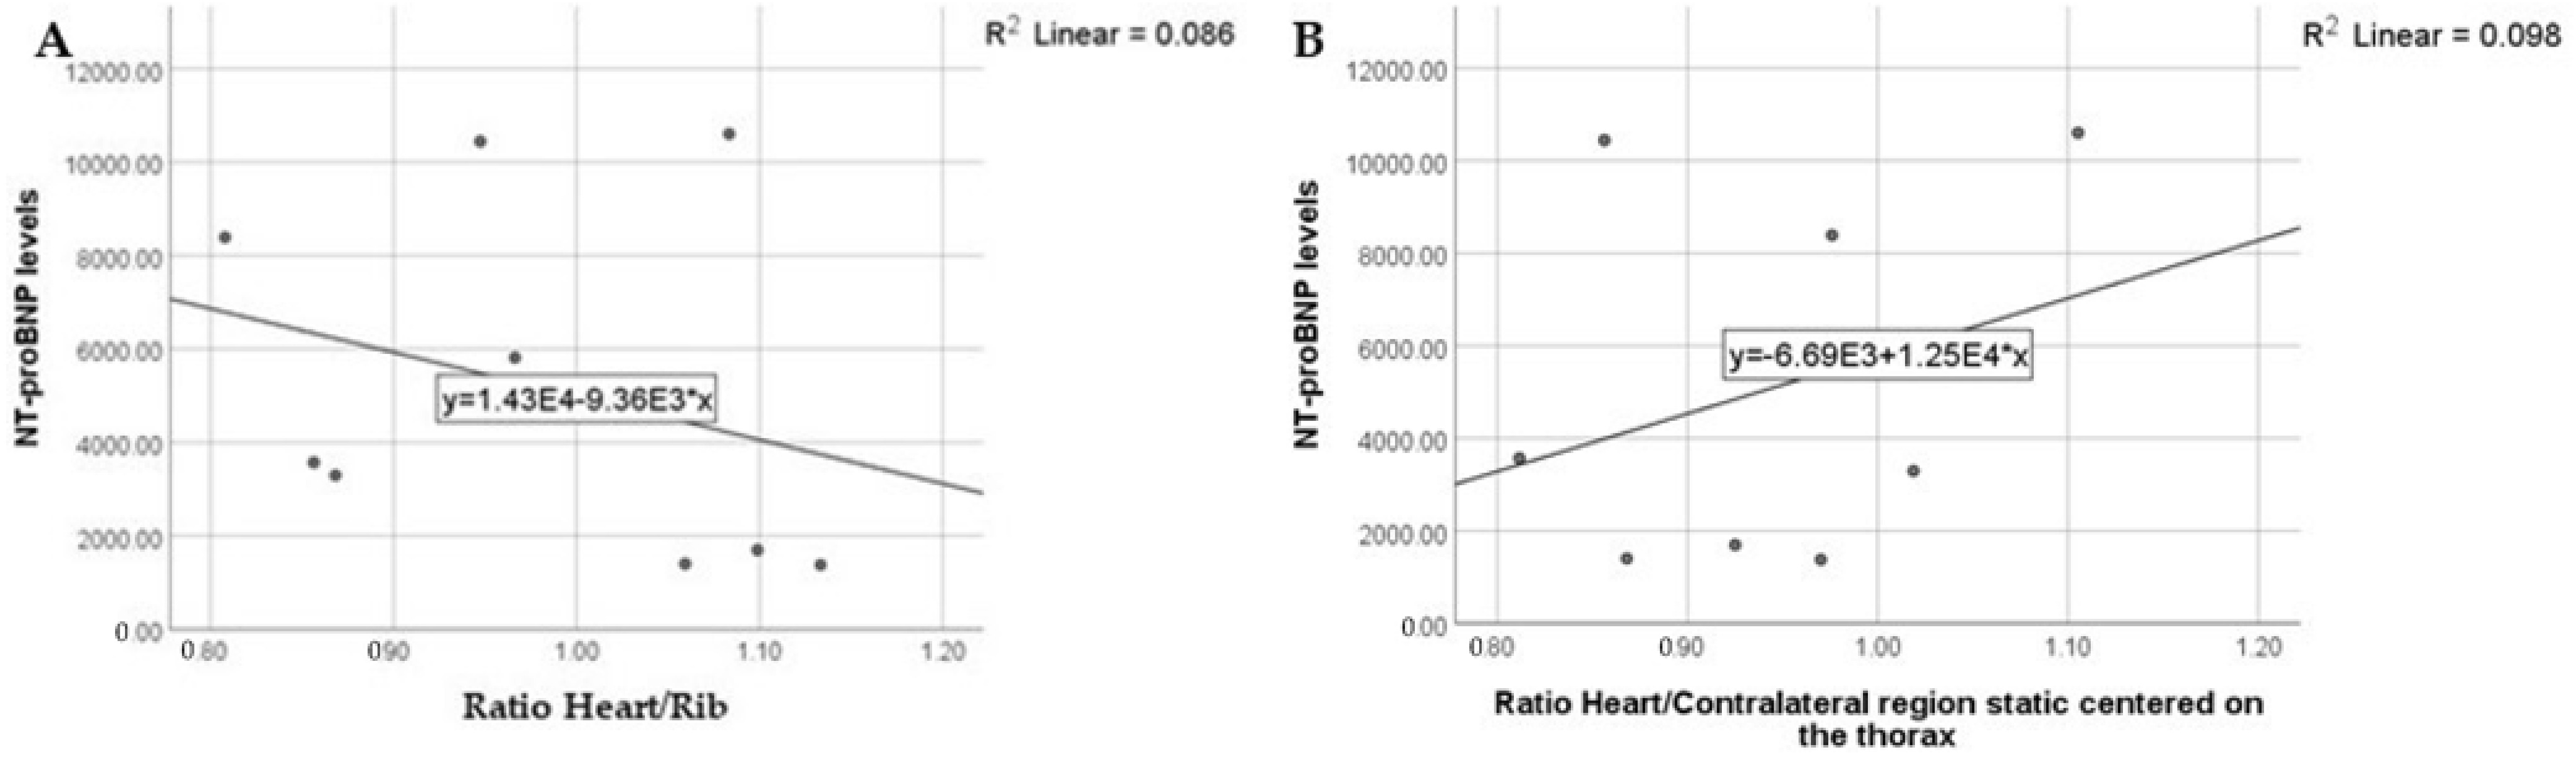
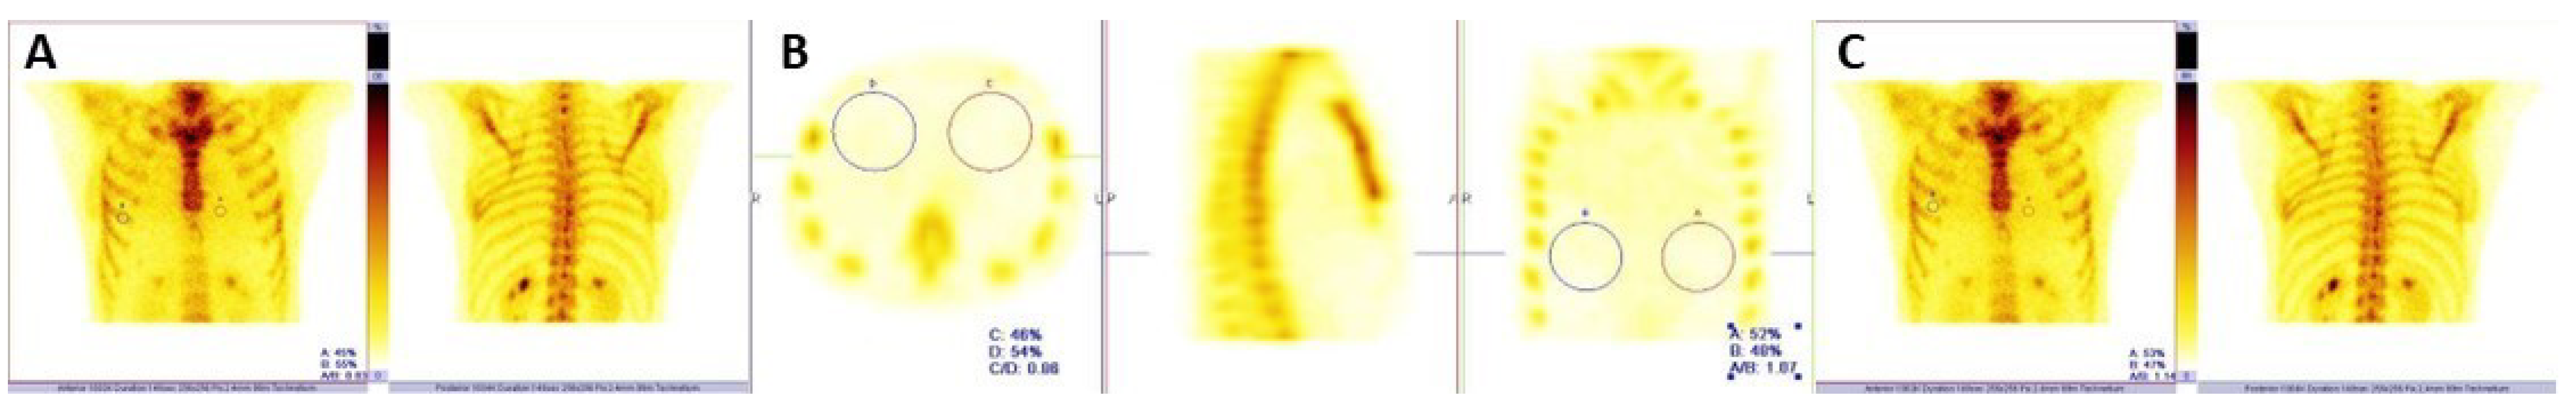
- A: heart/rib ratio; the highest NT-proBNP levels were detected in patients with ratios between 0.9 and 1.1; the NT-proBNP levels were also high when the ratios were between 1.1 and 1.2 but did not have extreme values;
- B: heart/contralateral-region-on-static-images ratio; the highest NT-proBNP levels were detected in patients with ratios between 0.8 and 1.2; the NT-proBNP levels were also high when the ratios were between 0.8 and 1.1, but did not have extreme values (Figure 3)
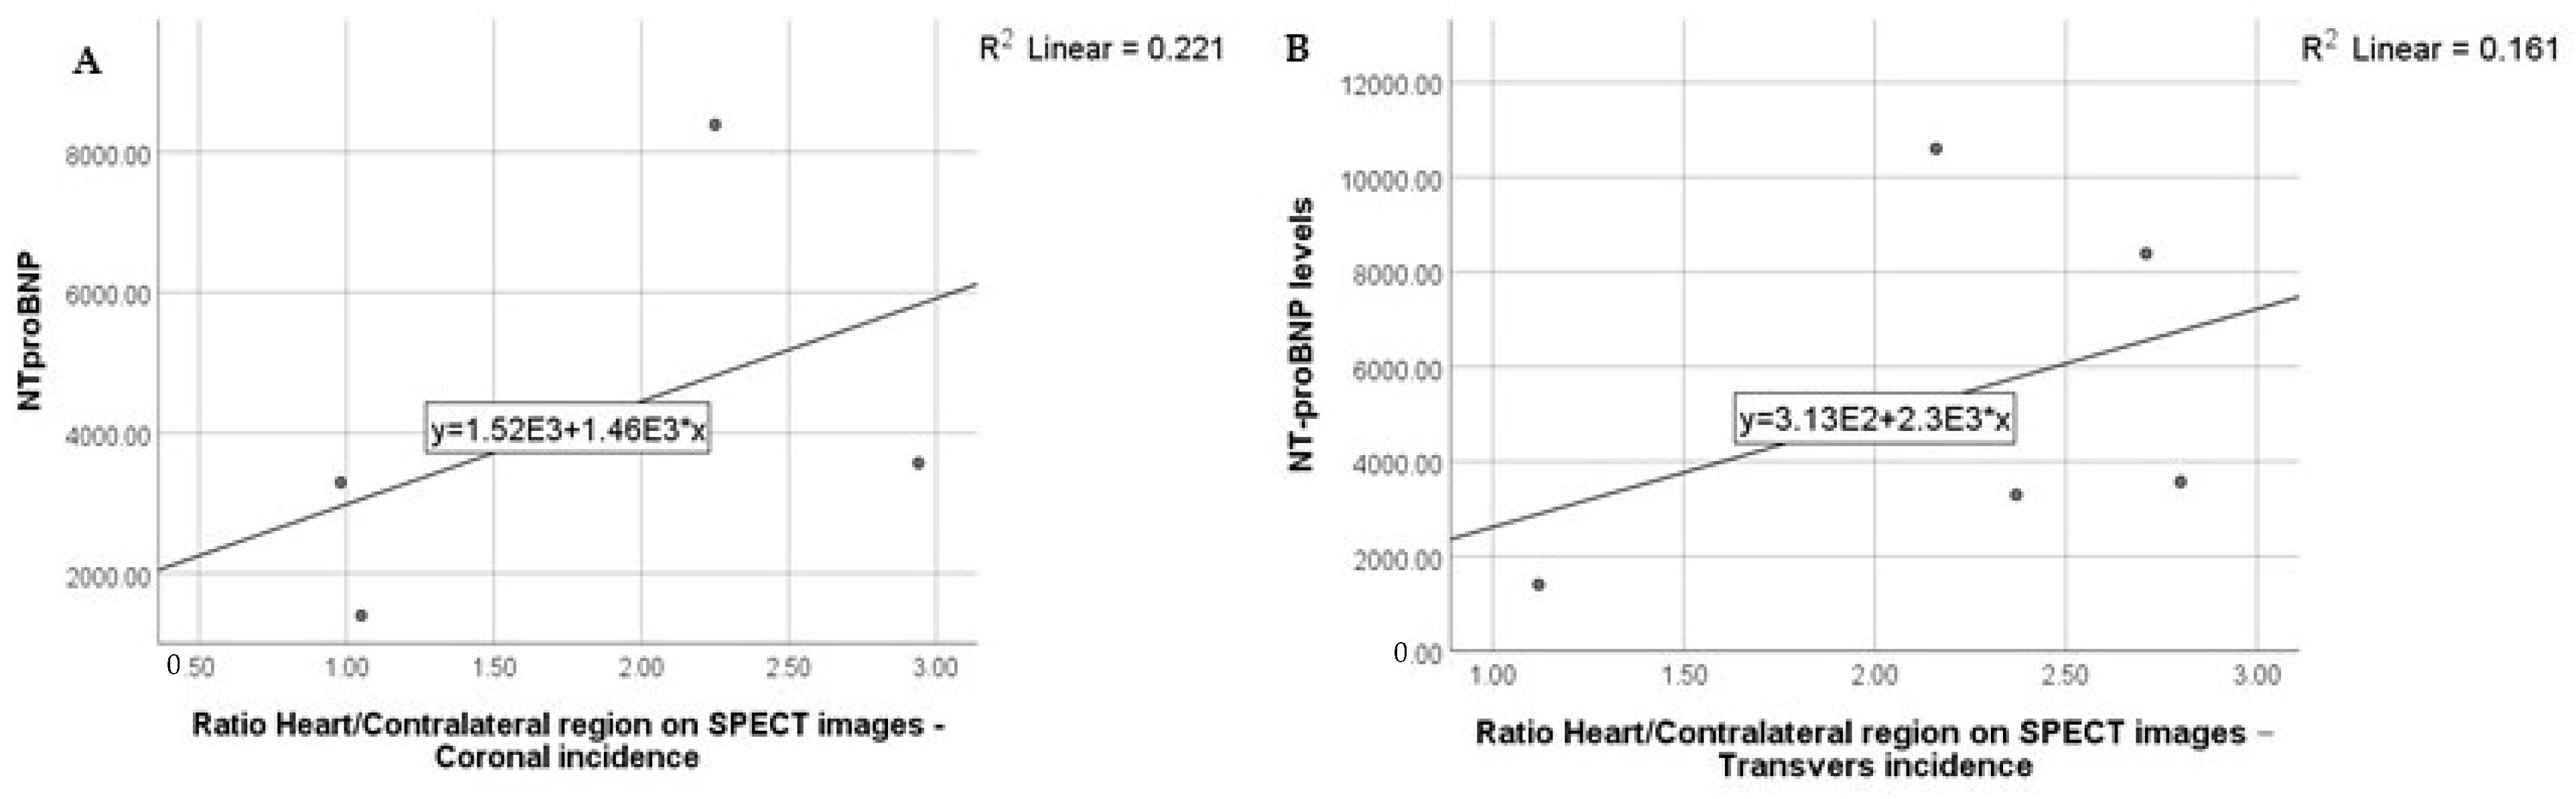
- Heart/contralateral region ratio on SPECT images: the highest NT-proBNP levels were detected in patients with ratios between 2 and 3 (Figure 4)
3.2. AL Patients
4. Discussion
5. Conclusions
Author Contributions
Funding
Institutional Review Board Statement
Informed Consent Statement
Data Availability Statement
Conflicts of Interest
References
- Schmidt, E.K.; Kiuru-Enari, S.; Atula, S.; Tanskanen, M. Amyloid in parenchymal organs in gelsolin (AGel) amyloidosis. Amyloid 2019, 26, 118–124. [Google Scholar] [CrossRef] [PubMed]
- Gonzalez-Lopez, E.; Lopez-Sainz, A.; Garcia-Pavia, P. Diagnosis and Treatment of Transthyretin Cardiac Amyloidosis. Progress and Hope. Rev. Esp. Cardiol. 2017, 70, 991–1004. [Google Scholar] [CrossRef] [PubMed]
- Law, S.; Gillmore, J.D. When to Suspect and How to Approach a Diagnosis of Amyloidosis. AJM 2022, 135 (Suppl. S1), S2–S8. [Google Scholar] [CrossRef] [PubMed]
- Rubin, J.; Maurer, M.S. Cardiac Amyloidosis: Overlooked, Underappreciated, and Treatable. Annu. Rev. Med. 2020, 71, 203–219. [Google Scholar] [CrossRef] [Green Version]
- Adam, R.; Neculae, G.; Stan, C.; Jurcut, R. Current Challenges of Cardiac Amyloidosis Awareness among Romanian Cardiologists. Diagnostics 2021, 11, 834. [Google Scholar] [CrossRef]
- McDonagh, T.A.; Metra, M.; Adamo, M.; Gardner, R.S.; Baumbach, A.; Böhm, M.; Burri, H.; Butler, J.; Čelutkienė, J.; Chioncel, O.; et al. ESC Scientific Document Group. 2021 ESC Guidelines for the diagnosis and treatment of acute and chronic heart failure. Eur. Heart J. 2021, 42, 3599–3726. [Google Scholar] [CrossRef]
- Garcia-Pavia, P.; Rapezzi, C.; Adler, Y.; Arad, M.; Basso, C.; Brucato, A.; Burazor, I.; Caforio, A.L.P.; Damy, T.; Eriksson, U.; et al. Diagnosis and treatment of cardiac amyloidosis: A position statement of the ESC Working Group on Myocardial and Pericardial Diseases. Eur. Heart J. 2021, 42, 1554–1568. [Google Scholar] [CrossRef]
- Witteles, R.M.; Bokhari, S.; Damy, T.; Elliott, P.M.; Falk, R.H.; Fine, N.M.; Gospodinova, M.; Obici, L.; Rapezzi, C.; Garcia-Pavia, P. Screening for transthyretin amyloid cardiomyopathy in everyday practice. JACC Heart Fail. 2019, 7, 709–716. [Google Scholar] [CrossRef]
- Porcari, A.; Falco, L.; Lio, V.; Merlo, M.; Fabris, E.; Bussani, R.; Sinagra, G. Cardiac amyloidosis: Do not forget to look for it. Eur. Heart J. Suppl. 2020, 22 (Suppl. E), E142–E147. [Google Scholar] [CrossRef]
- Hotta, V.T.; Giorgi, M.C.P.; Fernandes, F.; Abduch, M.C.D.; Falcao, A.M.G.M.; Mady, C. Cardiac amyloidosis: Non-invasive diagnosis. Rev. Assoc. Med. Bras. 2020, 66, 345–352. [Google Scholar] [CrossRef]
- Bistola, V.; Parissis, J.; Foukarakis, E.; Valsamaki, P.N.; Anastasakis, A.; Koutsis, G.; Efthimiadis, G.; Kastritis, E. Practical recommendations for the diagnosis and management of transthyretin cardiac amyloidosis. Heart Fail. Rev. 2021, 26, 861–879. [Google Scholar] [CrossRef] [PubMed]
- Jung, M.-H.; Chang, S.; Han, E.J.; Youn, J.-C. Multimodal Imaging and Biomarkers in Cardiac Amyloidosis. Diagnostics 2022, 12, 627. [Google Scholar] [CrossRef] [PubMed]
- Takashio, S.; Nishi, M.; Tsuruta, Y.; Tsujita, K. Wild-type transthyretin amyloid cardiomyopathy complicated by spinal canal stenosis, carpal tunnel syndrome, and rotator cuff tears: A case report. ESC Heart Fail. 2020, 4, 1. [Google Scholar] [CrossRef] [PubMed]
- Cuscaden, C.; Ramsay, S.C.; Prasad, S.; Goodwin, B.; Smith, J. Estimation of prevalence of transthyretin (ATTR) cardiac amyloidosis in an Australian subpopulation using bone scans with echocardiography and clinical correlation. J. Nucl. Cardiol. 2020, 28, 2845–2856. [Google Scholar] [CrossRef]
- Donnelly, J.; Hanna, M. Cardiac amyloidosis: An update on diagnosis and treatment. Clevel. Clin. J. Med. 2017, 84, 12–26. [Google Scholar] [CrossRef] [Green Version]
- Siddiqi, O.K.; Ruberg, F.L. Cardiac amyloidosis: An update on pathophysiology, diagnosis and treatment. Trends Cardiovasc. Med. 2018, 28, 10–21. [Google Scholar] [CrossRef]
- Papathanasiou, M.; Carpinteiro, A.; Rischpler, C.; Hagenacker, T.; Rassaf, T.; Luedike, P. Diagnosing cardiac amyloidosis in every-day practice: A practical guide for the cardiologist. Int. J. Cardiol. Heart Vasc. 2020, 28, 100519. [Google Scholar] [CrossRef]
- Balciunaite, G.; Rimkus, A.; Zurauskas, E.; Zaremba, T.; Palionis, D.; Valeviciene, N.; Aidietis, A.; Serpytis, P.; Rucinskas, K.; Sogaard, P.; et al. Transthyretin cardiac amyloidosis in aortic stenosis: Prevalence, diagnostic challenges, and clinical implications. Hellenic. J. Cardiol. 2020, 61, 92–98. [Google Scholar] [CrossRef]
- Costache, I.I.; Buburuz, A.M.; Crisu, D.; Statescu, A.M.; Ungureanu, C.; Aursulesei, V. The role of echocardiography and 99mTc- HDP scintigraphy in non-invasive diagnosis of cardiac amyloidosis: A case series and literature review. Medicine 2019, 98, e17256. [Google Scholar] [CrossRef]
- Singh, V.; Falk, R.; Di Carli, M.F.; Kijewski, M.; Rapezzi, C.; Dorbala, S. State-of-the-art radionuclide imaging in cardiac transthyretin amyloidosis. J. Nucl. Cardiol. 2019, 26, 158–173. [Google Scholar] [CrossRef]
- Castellucci, P.; Désirée, D.; Krizasán, K.Á.; Mirzaei, S.; Prior, J.; Sattler, B. Scintigrafia osoasă. In Ghid European de Medicină Nucleară: Publicație Comună a EANM și UEMS/EBNM; Editura Medicală Universitară ”Iuliu Hațeganu”: Cluj-Napoca, Romania, 2021; pp. 230–234. [Google Scholar]
- Graham, R.; Little, D.; Cade, S.; Redman, S. British Nuclear Medicine Society Clinical Guideline for bone scintigraphy. Nucl. Med. Commun. 2022, 43, 1109–1112. [Google Scholar] [CrossRef] [PubMed]
- Yang, J.C.; Fox, J.; Chen, C.; Yu, A.F. Cardiac ATTR amyloid nuclear imaging-not all bone scintigraphy radionuclide tracers are created equal. J. Nucl. Cardiol. 2018, 25, 1879–1884. [Google Scholar] [CrossRef] [PubMed]
- Hutt, D.F.; Fontana, M.; Burniston, M.; Quigley, A.M.; Petrie, A.; Ross, J.C.; Page, J.; Martinez-Naharro, A.; Wechalekar, A.D.; Lachmann, H.J.; et al. Prognostic utility of the Perugini grading of 99mTc-DPD scintigraphy in transthyretin (ATTR) amyloidosis and its relationship with skeletal muscle and soft tissue amyloid. Eur. Heart J. Cardiovasc. Imaging 2017, 18, 1344–1350. [Google Scholar] [CrossRef] [PubMed]
- Abulizi, M.; Cottereau, A.S.; Guellich, A.; Vandeventer, S.; Galat, A.; Van Der Gucht, A.; Plante-Bordeneuve, V.; Dubois-Randé, J.-L.; Bodez, D.; Rosso, J.; et al. Early-phase myocardial uptake intensity of 99mTc-HMDP vs 99mTc-DPD in patients with hereditary transthyretin-related cardiac amyloidosis. J. Nucl. Cardiol. 2018, 25, 217–222. [Google Scholar] [CrossRef]
- Perugini, E.; Guidalotti, P.L.; Salvi, F.; Cooke, R.M.; Pettinato, C.; Riva, L.; Leone, O.; Farsad, M.; Ciliberti, P.; Bacchi-Reggiani, L.; et al. Noninvasive etiologic diagnosis of cardiac amyloidosis using 99mTc-3,3-diphosphono-1,2-propanodicarboxylic acid scintigraphy. J. Am. Coll. Cardiol. 2005, 46, 1076–1084. [Google Scholar] [CrossRef] [Green Version]
- Glaudemans, A.W.; van Rheenen, R.W.; van den Berg, M.P.; Noordzij, W.; Koole, M.; Blokzijl, H.; Dierckx, R.A.; Slart, R.; Hazenberg, B.P.C. Bone scintigraphy with (99m) technetium-hydroxymethylene diphosphonate allows early diagnosis of cardiac involvement in patients with transthyretin-derived systemic amyloidosis. Amyloid 2014, 21, 35–44. [Google Scholar] [CrossRef]
- Dorbala, S.; Bokhari, S.; Miller, E.J.; Bullock Palmer, R.; Soman, P.; Thompson, R. 99mTechnetium-pyrophosphate imaging for transthyretin cardiac amyloidosis. In ASNC Practice Points; ASNC: Fairfax, VA, USA, 2019; pp. 1–8. [Google Scholar]
- Dorbala, S.; Ando, Y.; Bokhari, S.; Dispenzieri, A.; Falk, R.H.; Ferrari, V.A.; Fontana, M.; Gheysens, O.; Gillmore, J.D.; Glaudemans, A.W.; et al. ASNC/AHA/ASE/EANM/HFSA/ISA/SCMR/SNMMI Expert consensus recommendations for multimodality imaging in cardiac amyloidosis: Part 1 of 2—Evidence base and standardized methods of imaging. J. Nucl. Cardiol. 2019, 25, e1–e39. [Google Scholar]
- Dorbala, S.; Ando, Y.; Bokhari, S.; Dispenzieri, A.; Falk, R.H.; Ferrari, V.A.; Fontana, M.; Gheysens, O.; Gillmore, J.D.; Glaudemans, A.W.J.M.; et al. ASNC/AHA/ASE/EANM/HFSA/ISA/SCMR/SNMMI Expert consensus recommendations for multimodality imaging in cardiac amyloidosis: Part 2 of 2—Diagnostic criteria and appropriate utilization. J. Nucl. Cardiol. 2019, 27, 659–673. [Google Scholar] [CrossRef]
- Bhogal, S.; Ladia, V.; Sitwala, P.; Cook, E.; Bajaj, K.; Ramu, V.; Lavie, C.J.; Paul, T.K. Cardiac amyloidosis: An updated review with emphasis on diagnosis and future directions. Curr. Probl. Cardiol. 2018, 43, 10–34. [Google Scholar] [CrossRef]
- Oerlemans, M.I.F.J.; Rutten, K.H.G.; Minnema, M.C.; Raymakers, R.A.P.; Asselbergs, F.W.; de Jonge, N. Cardiac amyloidosis: The need for early diagnosis. Neth. Heart J. 2019, 27, 525–536. [Google Scholar] [CrossRef] [Green Version]
- Rodrigues, P.; Dias Frias, A.; Gouveia, P.; Trepa, M.; Fontes Oliveira, M.; Costa, R.; Reis, H.; Amorim, I.; Palma, P.; Cyrne Carvalho, H.; et al. Radionuclide imaging in the diagnosis of transthyretin cardiac amyloidosis: Different sensitivity in early-onset V30M mutation? JACC Cardiovasc. Imaging 2020, 13, 1072. [Google Scholar]
- Cappelli, F.; Martone, R.; Gabriele, M.; Taborchi, G.; Morini, S.; Vignini, E.; Allinovi, M.; Di Gioia, M.; Bartolini, S.; Di Mario, C.; et al. Biomarkers and Prediction of Prognosis in Transthyretin-Related Cardiac Amyloidosis: Direct Comparison of Two Staging Systems. CJC 2020, 36, 424–431. [Google Scholar] [CrossRef] [PubMed]
- Chacko, L.; Martone, R.; Cappelli, F.; Fontana, M. Cardiac amyloidosis: Updates in imaging. Curr. Cardiol. Rep. 2019, 21, 108. [Google Scholar] [CrossRef] [PubMed] [Green Version]
- Gillmore, J.D.; Damy, T.; FontAna, M.; Hutchinson, M.; Lachmann, H.J.; Martinez-Naharro, A.; Quarta, C.C.; Rezk, T.; Whelan, C.J.; Gonzalez-Lopez, E.; et al. A new staging system for cardiac transthyretin amyloidosis. Eur. Heart J. 2018, 39, 2799–2806. [Google Scholar] [CrossRef] [PubMed]


| Semiquantitative Method | ||
|---|---|---|
| Ratio | Results | Interpretation |
| Heart/Rib | >1 | Myocardial uptake greater than rib uptake Diagnosis: ATTR cardiac amyloidosis |
| <1 | Myocardial uptake lower than rib uptake Diagnosis: possible AL cardiac amyloidosis | |
| 1 | Myocardial uptake similar to rib uptake Diagnosis: possible ATTR in an early form | |
| Heart/Contralateral region | 0–1.49 | Absence/slight uptake of the radiopharmaceutical in the myocardium Diagnosis: AL cardiac amyloidosis |
| 1.5–3 | Moderate/increased uptake of the radiopharmaceutical in the myocardium Diagnosis: ATTR cardiac amyloidosis | |
| Semiquantitative Method—Results for ATTR Positive Patients—Static Images | |||
|---|---|---|---|
| Patient | Visual Score | Heart to Rib | Heart to Contralateral Side |
| Patient 4 | 3 | 1.68 | 2.09 |
| Patient 16 | 3 | 2.06 | 2.41 |
| Patient 19 | 3 | 2.08 | 2.14 |
| Patient 20 | 3 | 1.85 | 2.71 |
| Patient 21 | 3 | 1.92 | 2.11 |
| Patient 29 | 3 | 1.67 | 1.6 |
| Patient 45 | 2 | 0.91 | 1.2 |
| Patient 54 | 2 | 1.64 | 1.81 |
| Patient 55 | 2 | 1.88 | 2.07 |
| Patient 56 | 2 | 1.18 | 1.44 |
| Patient 58 | 3 | 1.77 | 2.08 |
| Semiquantitative Method—Results for ATTR Positive Patients—SPECT Images | |||
|---|---|---|---|
| Patient | Visual Score | Heart to Contralateral Side | |
| Transverse | Coronal | ||
| Patient 4 | 3 | 2.13 | 2.5 |
| Patient 16 | 3 | 2.97 | 2.98 |
| Patient 19 | 3 | - | - |
| Patient 20 | 3 | - | - |
| Patient 21 | 3 | - | - |
| Patient 29 | 3 | 2.37 | 0.98 |
| Patient 45 | 2 | - | - |
| Patient 54 | 2 | 2.11 | 1.79 |
| Patient 55 | 2 | 2.8 | 2.94 |
| Patient 56 | 2 | 1.12 | 1.05 |
| Patient 58 | 3 | 2.71 | 2.25 |
| Semiquantitative Method—ATTR Positive Patients | |||||
|---|---|---|---|---|---|
| Static Centered on the Thorax | SPECT Centered on the Thorax | ||||
| Patient | Visual Score | Heart/Rib * | Heart/Contralateral Side ** | Heart/Contralateral Side ** | |
| Transverse | Coronal | ||||
| Patient 4 | 3 | 1.68 | 2.09 | 2.13 | 2.5 |
| Patient 16 | 3 | 2.06 | 2.41 | 2.97 | 2.98 |
| Patient 19 | 3 | 2.08 | 2.14 | - | - |
| Patient 20 | 3 | 1.85 | 2.71 | - | - |
| Patient 21 | 3 | 1.92 | 2.11 | - | - |
| Patient 29 | 3 | 1.67 | 1.6 | 2.37 | 0.98 |
| Patient 45 | 2 | 0.91 | 1.2 | - | - |
| Patient 54 | 2 | 1.64 | 1.81 | 2.11 | 1.79 |
| Patient 55 | 2 | 1.88 | 2.07 | 2.8 | 2.94 |
| Patient 56 | 2 | 1.18 | 1.44 | 1.12 | 1.05 |
| Patient 58 | 3 | 1.77 | 2.08 | 2.71 | 2.25 |
| Patient | ATTR Subtype | Mutation | Family History of Cardiovascular Disease |
|---|---|---|---|
| Patient 4 | ATTRm | Val142Ile | No |
| Patient 16 | ATTRm | Glu74Gln | No |
| Patient 19 | ATTRwt | - | No |
| Patient 20 | ATTRwt | - | No |
| Patient 21 | ATTRm | Glu74Gln | No |
| Patient 29 | - | - | YES |
| Patient 45 | - | - | No |
| Patient 55 | ATTRm | Glu74Gln | No |
| Patient 56 | - | - | YES |
| Patient 58 | - | - | No |
| NT-proBNP | 0–125 | 125–1000 | 1001–2000 | 2001–3000 | 3001–4000 | 4001–5000 | 5001–6000 | 6001–7000 | 7001–8000 | 8001–9000 | 9001–10,000 | >10,001 |
|---|---|---|---|---|---|---|---|---|---|---|---|---|
| Number of patients with ATTR | 0 | 0 | 3 | 0 | 1 | 0 | 1 | 0 | 0 | 1 | 0 | 2 |
| Urea Normal Value: 15–45 mg/dL | Creatinine Normal Values: 0.6–1.3 mg/dL | |
|---|---|---|
| Patient 4 | 44 | 0.8 |
| Patient 16 | 25 | 0.82 |
| Patient 19 | - | 1.58 |
| Patient 20 | - | 2.09 |
| Patient 21 | 35 | 0.89 |
| Patient 29 | 103 | 1.40 |
| Patient 45 | - | - |
| Patient 54 | 149 | 1.57 |
| Patient 55 | 51 | 0.60 |
| Patient 56 | 28 | 0.98 |
| Patient 58 | 42 | 1.11 |
| MDRD—Stages | COCKROFT—GAULT—Stages | ||||||||||
|---|---|---|---|---|---|---|---|---|---|---|---|
| Number of patients with ATTR | G1 | G2 | G3a | G3b | G4 | G5 | 1 | 2 | 3 | 4 | 5 |
| 2 | 2 | 3 | 2 | 1 | 0 | 2 | 2 | 5 | 1 | 0 | |
| Parameter | Pearson Correlation | p Value | |
|---|---|---|---|
| ATTR | Urea | −0.036 | 0.947 |
| Creatinine | 0.503 | 0.204 | |
| eGFR | −0.185 | 0.661 | |
| Cl creatinine CG | −0.087 | 0.838 | |
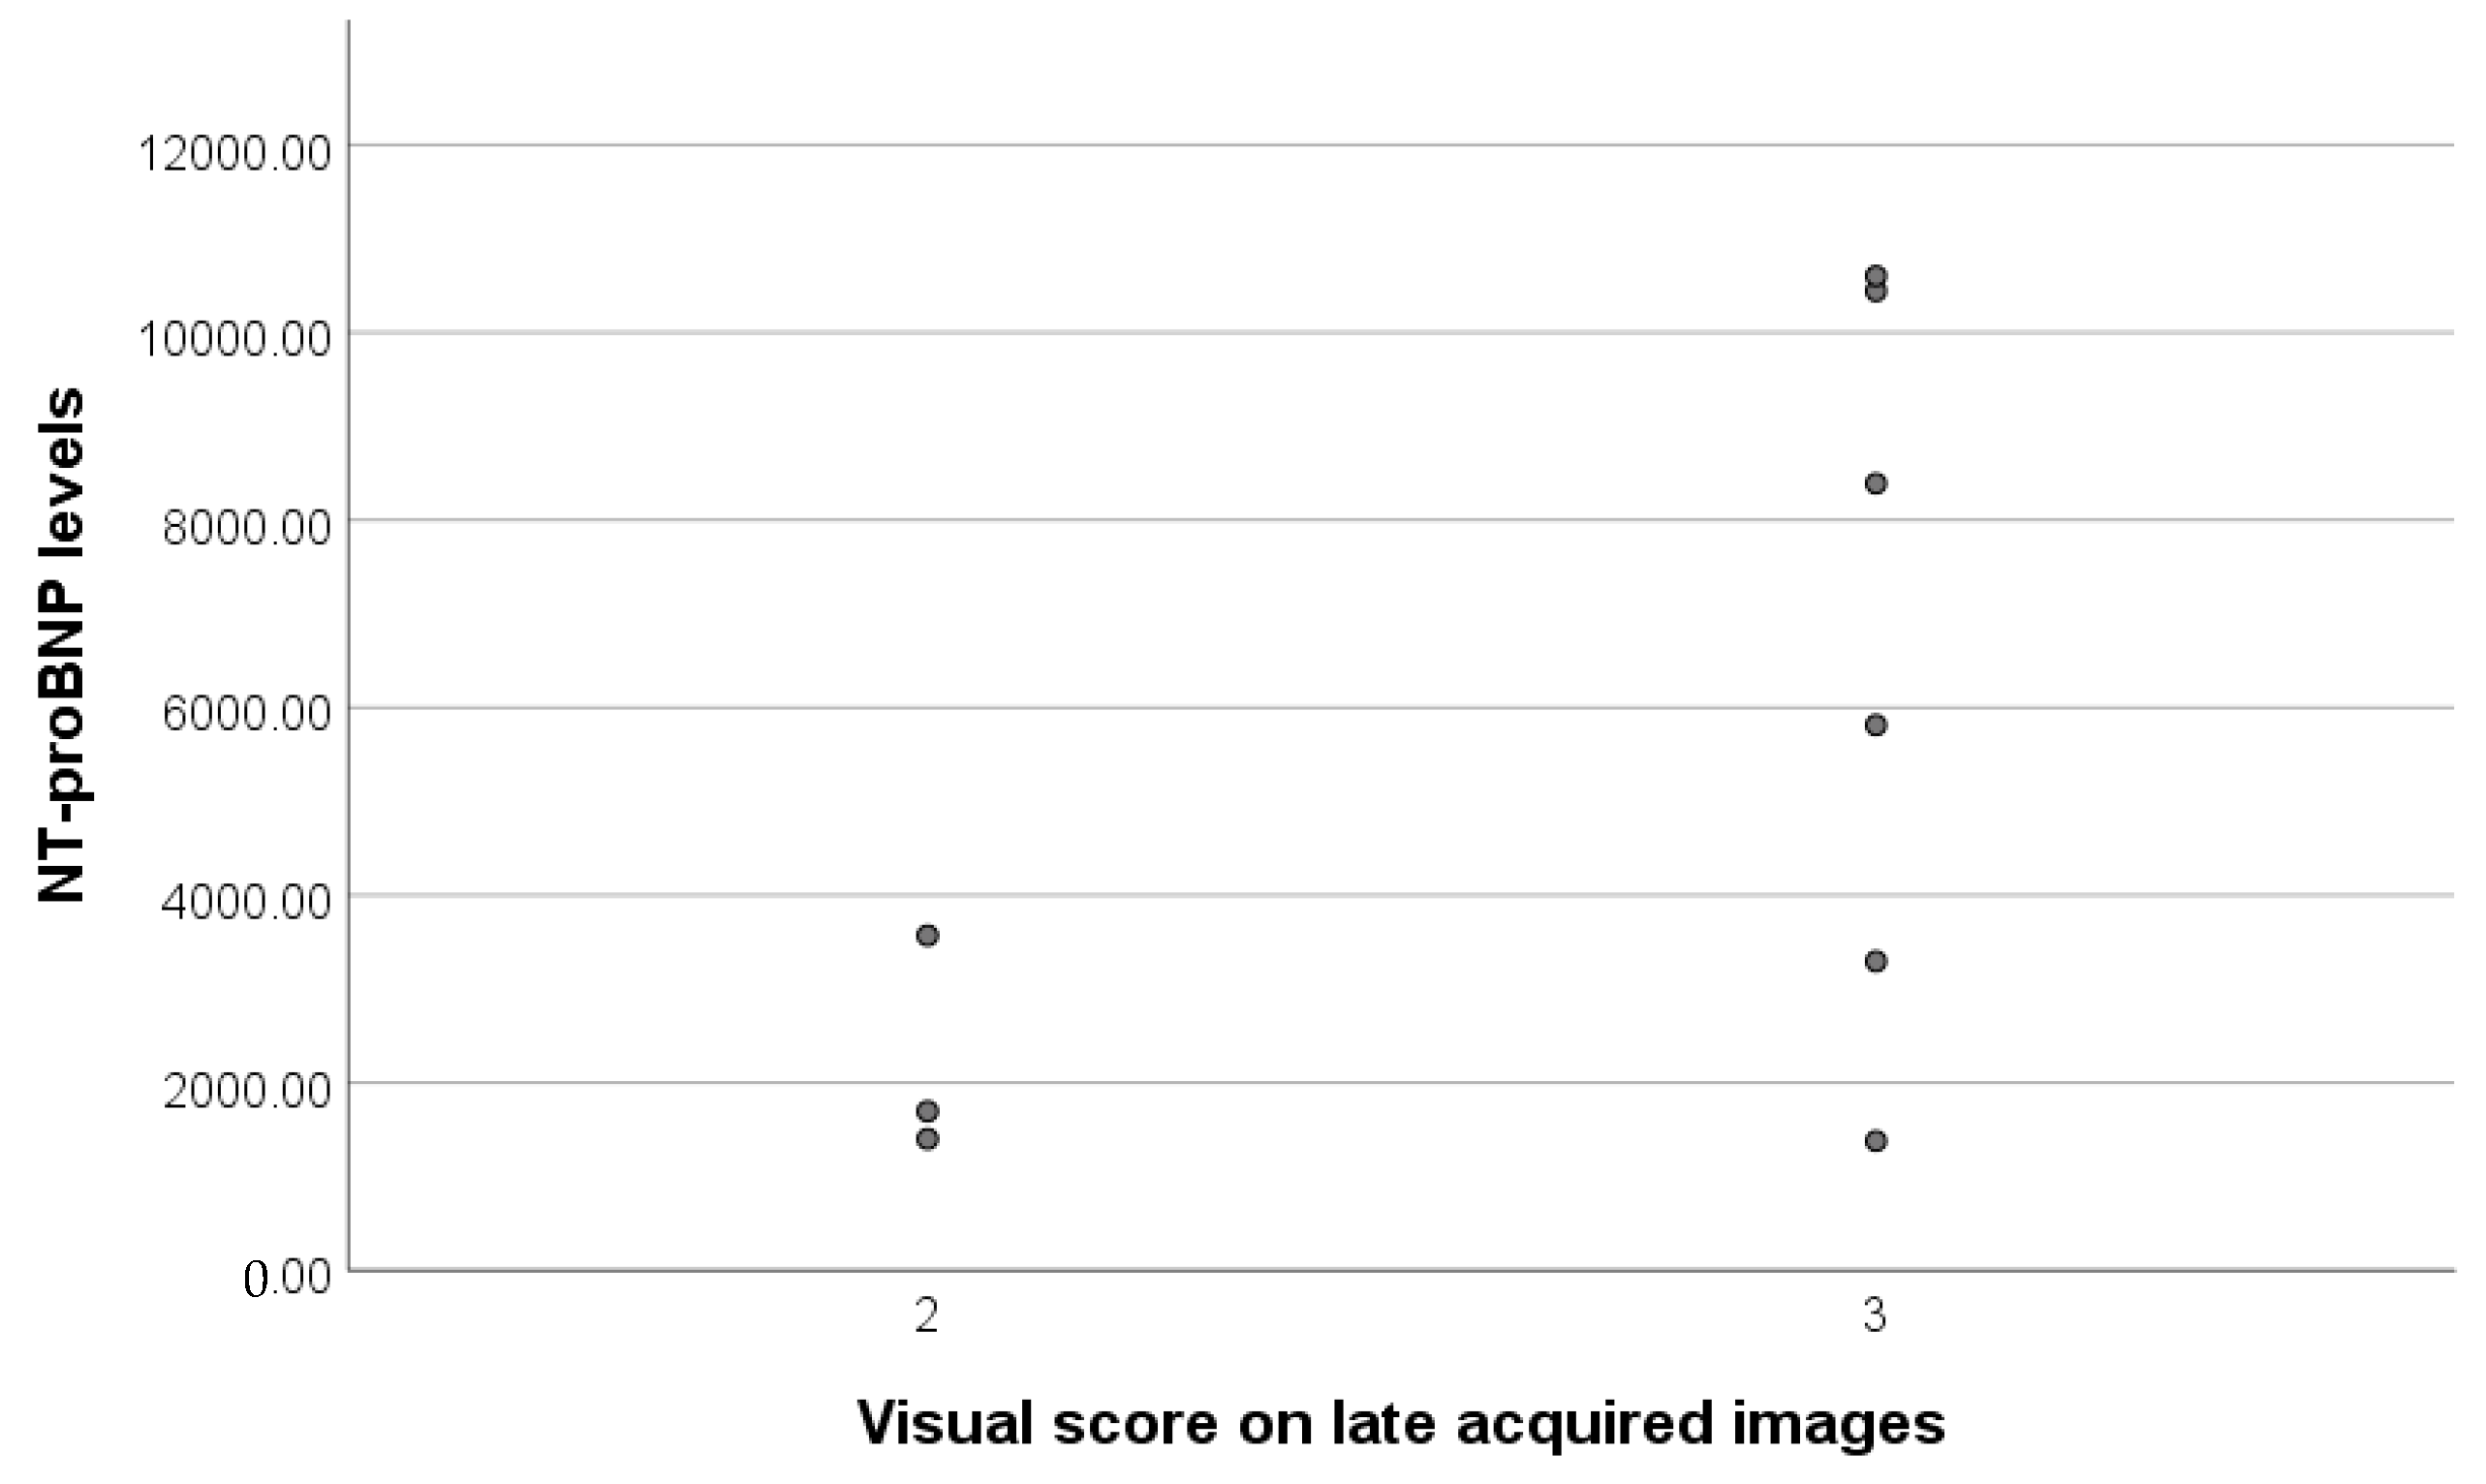
| Visual score on late acquired images | 0.585 | 0.098 | |
| Ratio Heart/Rib | −0.294 | 0.443 | |
| Ratio Heart/Contralateral region static centered on the thorax | 0.312 | 0.413 | |
| Ratio Heart/Contralateral region on SPECT images—Transverse incidence | 0.401 | 0.504 | |
| Ratio Heart/Contralateral region on SPECT images—Coronal incidence | 0.470 | 0.530 |
| Semiquantitative Method—AL Positive Patients | |||||
|---|---|---|---|---|---|
| Static Centered on the Thorax | SPECT Centered on the Thorax | ||||
| Patient | Visual Score | Heart to Rib | Heart to Contralateral Side | Heart to Contralateral Side | |
| Transverse | Coronal | ||||
| Patient 1 | 1 | 0.91 | 1.20 | 1.28 | 1.06 |
| Patient 10 | 0 | 0.66 | 0.98 | - | - |
| Patient 32 | 0 | 1.2 | 1.67 | 1.05 | 1.04 |
| Patient 41 | 0 | 0.83 | 1.14 | 1.16 | 0.93 |
| NT-proBNP | 0–125 | 125–1000 | 1001–2000 | 2001–3000 | 3001–4000 | 4001–5000 | 5001–6000 | 6001–7000 | 7001–8000 | 8001–9000 | 9001–10,000 | >10,001 |
|---|---|---|---|---|---|---|---|---|---|---|---|---|
| Number of patients with AL | 0 | 0 | 0 | 0 | 1 | 0 | 0 | 0 | 2 | 0 | 0 | 0 |
| Uree Normal Value: 15–45 mg/dL | Creatinine Normal Values: 0.6–1.3 mg/dL | |
|---|---|---|
| Patient 1 | 36 | 0.82 |
| Patient 10 | 33 | 0.93 |
| Patient 32 | 31 | 0.74 |
| Patient 41 | 58 | 1.06 |
| MDRD—Stages | COCKROFT—GAULT—Stages | ||||||||||
|---|---|---|---|---|---|---|---|---|---|---|---|
| G1 | G2 | G3a | G3b | G4 | G5 | 1 | 2 | 3 | 4 | 5 | |
| Number of patients with AL | 0 | 4 | 0 | 0 | 0 | 0 | 2 | 2 | 0 | 0 | 0 |
| Parameter | Total Group (n = 59) | AL (n = 4) | ATTR (n = 11) |
|---|---|---|---|
| NT-proBNP | 5796.40 ± 6363.61 | 6133.33 ± 2651.45 | 5176.33 ± 3788.09 |
| Parameter | Total Group (n = 59) | AL (n = 4) | ATTR (n = 11) |
|---|---|---|---|
| Urea | 60.34 ± 42.83 | 39.50 ± 12.50 | 59.63 ± 43.60 |
| Creatinine | 1.32 ± 1.11 | 0.89 ± 0.14 | 1.47 ± 1.26 |
| eGFR | 85.62 ± 53.01 | 98.93 ± 8.93 | 75.43 ± 37.34 |
| Creatinine Clearance | 110.10 ± 45.52 | 139.97 ± 13.23 | 95.46 ± 46.71 |
| CKD—MDRD | |||
| G1 | 9 (15.3%) | - | 2 (18.2%) |
| G2 | 21 (35.6%) | 4 (100.0%) | 2 (18.2%) |
| G3a | 8 (13.6%) | - | 2 (18.2%) |
| G3b | 10 (16.9%) | - | 2 (18.2%) |
| G4 | 2 (3.4%) | - | 1 (9.1%) |
| G5 | 2 (3.4%) | - | - |
| CKD—Cockcroft-Gault formula | |||
| stage 1 | 14 (23.7%) | 2 (50.0%) | 2 (18.2%) |
| stage 2 | 17 (28.8%) | 2 (50.0%) | 2 (18.2%) |
| stage 3 | 20 (33.9%) | - | 5 (45.5%) |
| stage 4 | 3 (5.1%) | - | 1 (9.1%) |
Disclaimer/Publisher’s Note: The statements, opinions and data contained in all publications are solely those of the individual author(s) and contributor(s) and not of MDPI and/or the editor(s). MDPI and/or the editor(s) disclaim responsibility for any injury to people or property resulting from any ideas, methods, instructions or products referred to in the content. |
© 2022 by the authors. Licensee MDPI, Basel, Switzerland. This article is an open access article distributed under the terms and conditions of the Creative Commons Attribution (CC BY) license (https://creativecommons.org/licenses/by/4.0/).
Share and Cite
Ionescu, T.M.; Ciocoiu, M.; Lupușoru, R.-V.; Grierosu, I.; Sascău, R.A.; Jalloul, W.; Iacob, R.; Stolniceanu, C.R.; Clement, A.; Stătescu, A.-M.; et al. Role of Diphosphonates Bone Scintigraphy in Correlation with Biomarkers for a Personalized Approach to ATTR Cardiac Amyloidosis in North-Eastern Romania. Diagnostics 2023, 13, 83. https://doi.org/10.3390/diagnostics13010083
Ionescu TM, Ciocoiu M, Lupușoru R-V, Grierosu I, Sascău RA, Jalloul W, Iacob R, Stolniceanu CR, Clement A, Stătescu A-M, et al. Role of Diphosphonates Bone Scintigraphy in Correlation with Biomarkers for a Personalized Approach to ATTR Cardiac Amyloidosis in North-Eastern Romania. Diagnostics. 2023; 13(1):83. https://doi.org/10.3390/diagnostics13010083
Chicago/Turabian StyleIonescu, Teodor Marian, Manuela Ciocoiu, Raoul-Vasile Lupușoru, Irena Grierosu, Radu Andy Sascău, Wael Jalloul, Roxana Iacob, Cati Raluca Stolniceanu, Alexandra Clement, Ana-Maria Stătescu, and et al. 2023. "Role of Diphosphonates Bone Scintigraphy in Correlation with Biomarkers for a Personalized Approach to ATTR Cardiac Amyloidosis in North-Eastern Romania" Diagnostics 13, no. 1: 83. https://doi.org/10.3390/diagnostics13010083