
Shear-Wave Elastography and Viscosity PLUS for the Assessment of Peripheric Muscles in Healthy Subjects: A Pre- and Post-Contraction Study
 , and
, and
Abstract
:1. Introduction
2. Materials and Methods
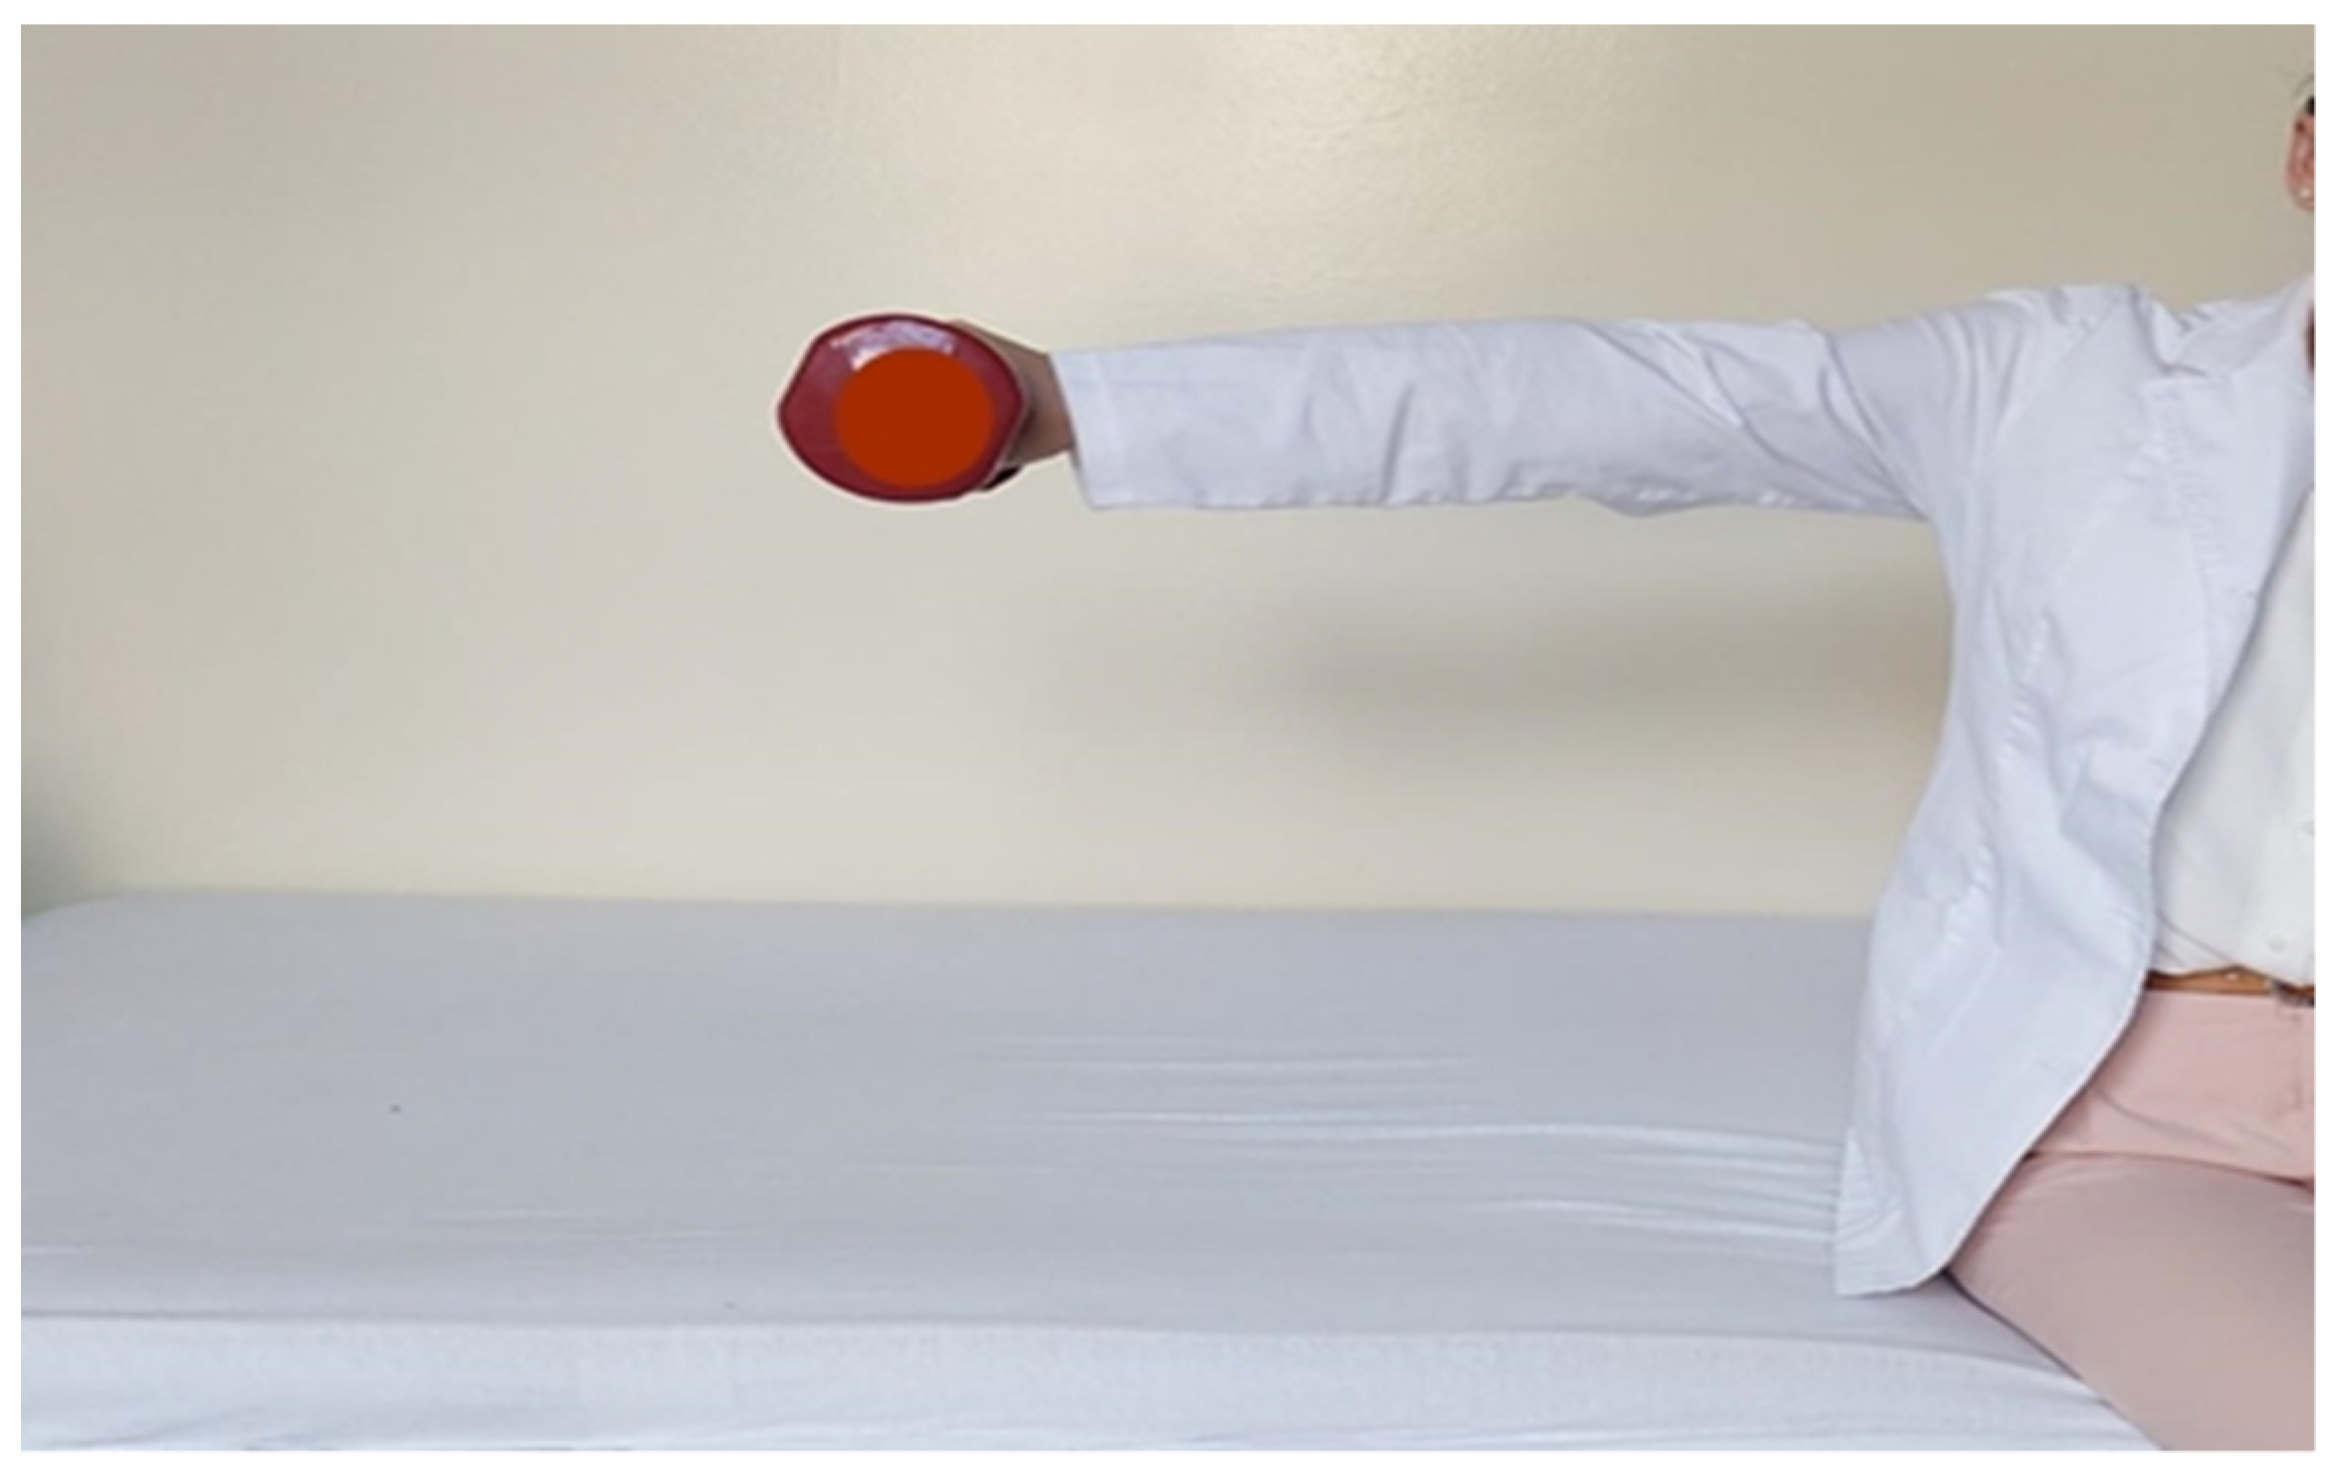
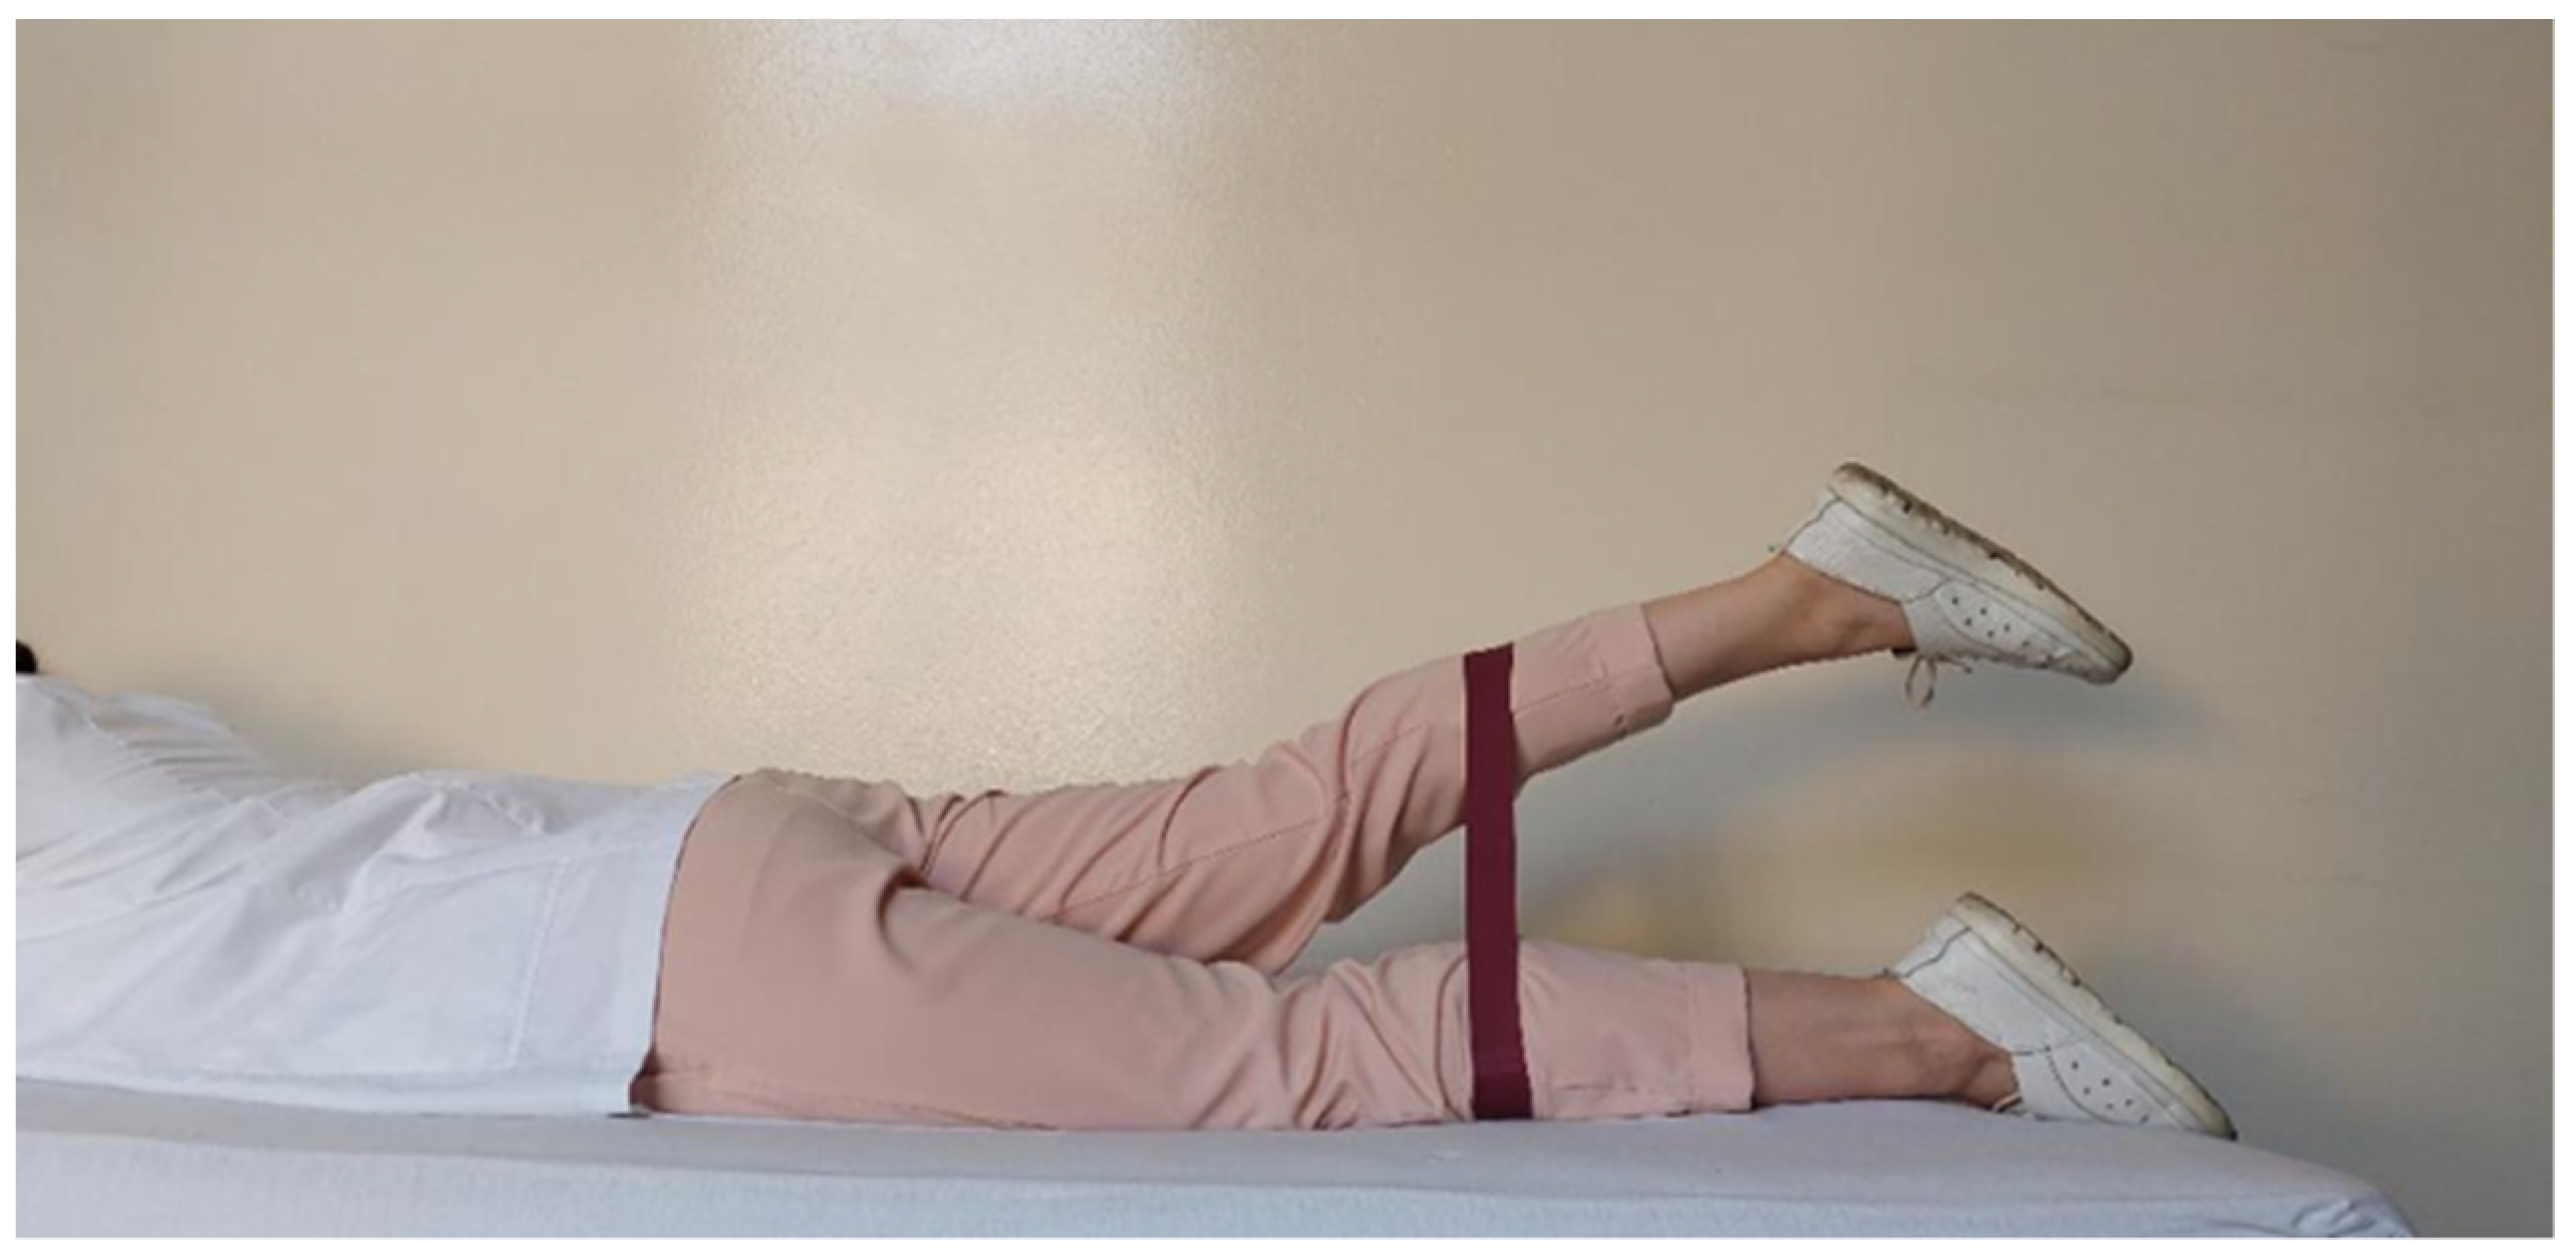
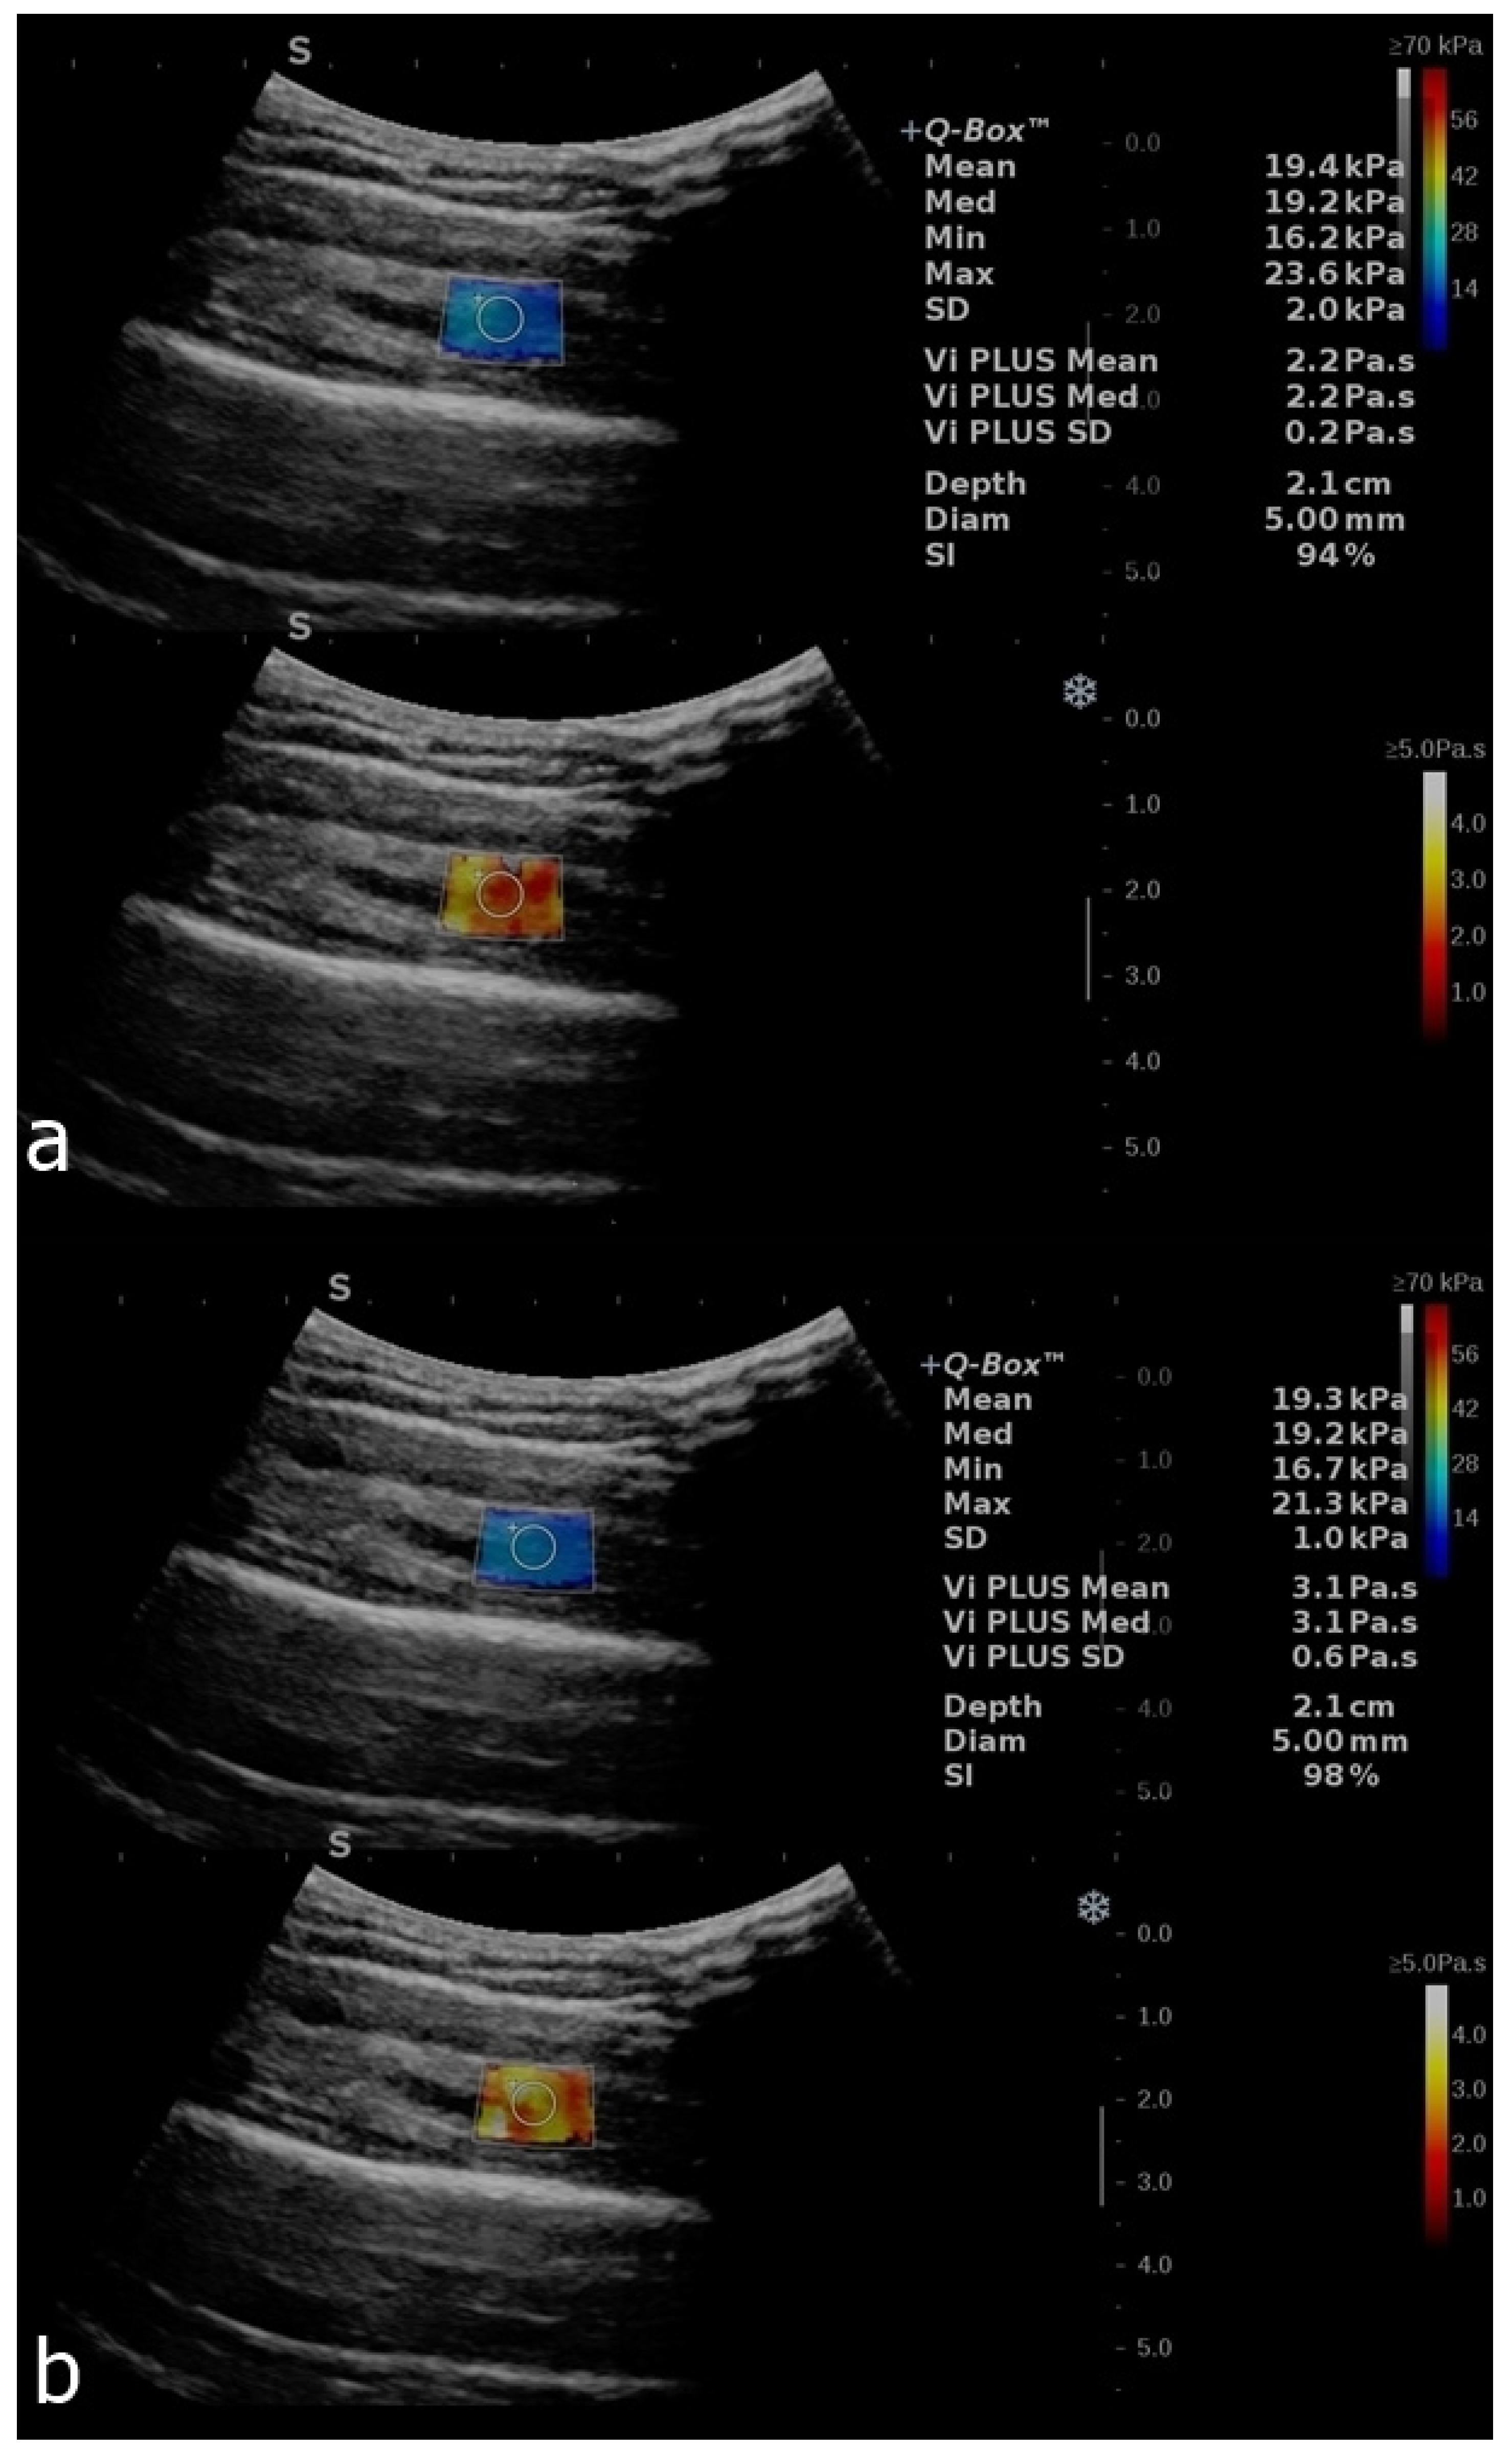
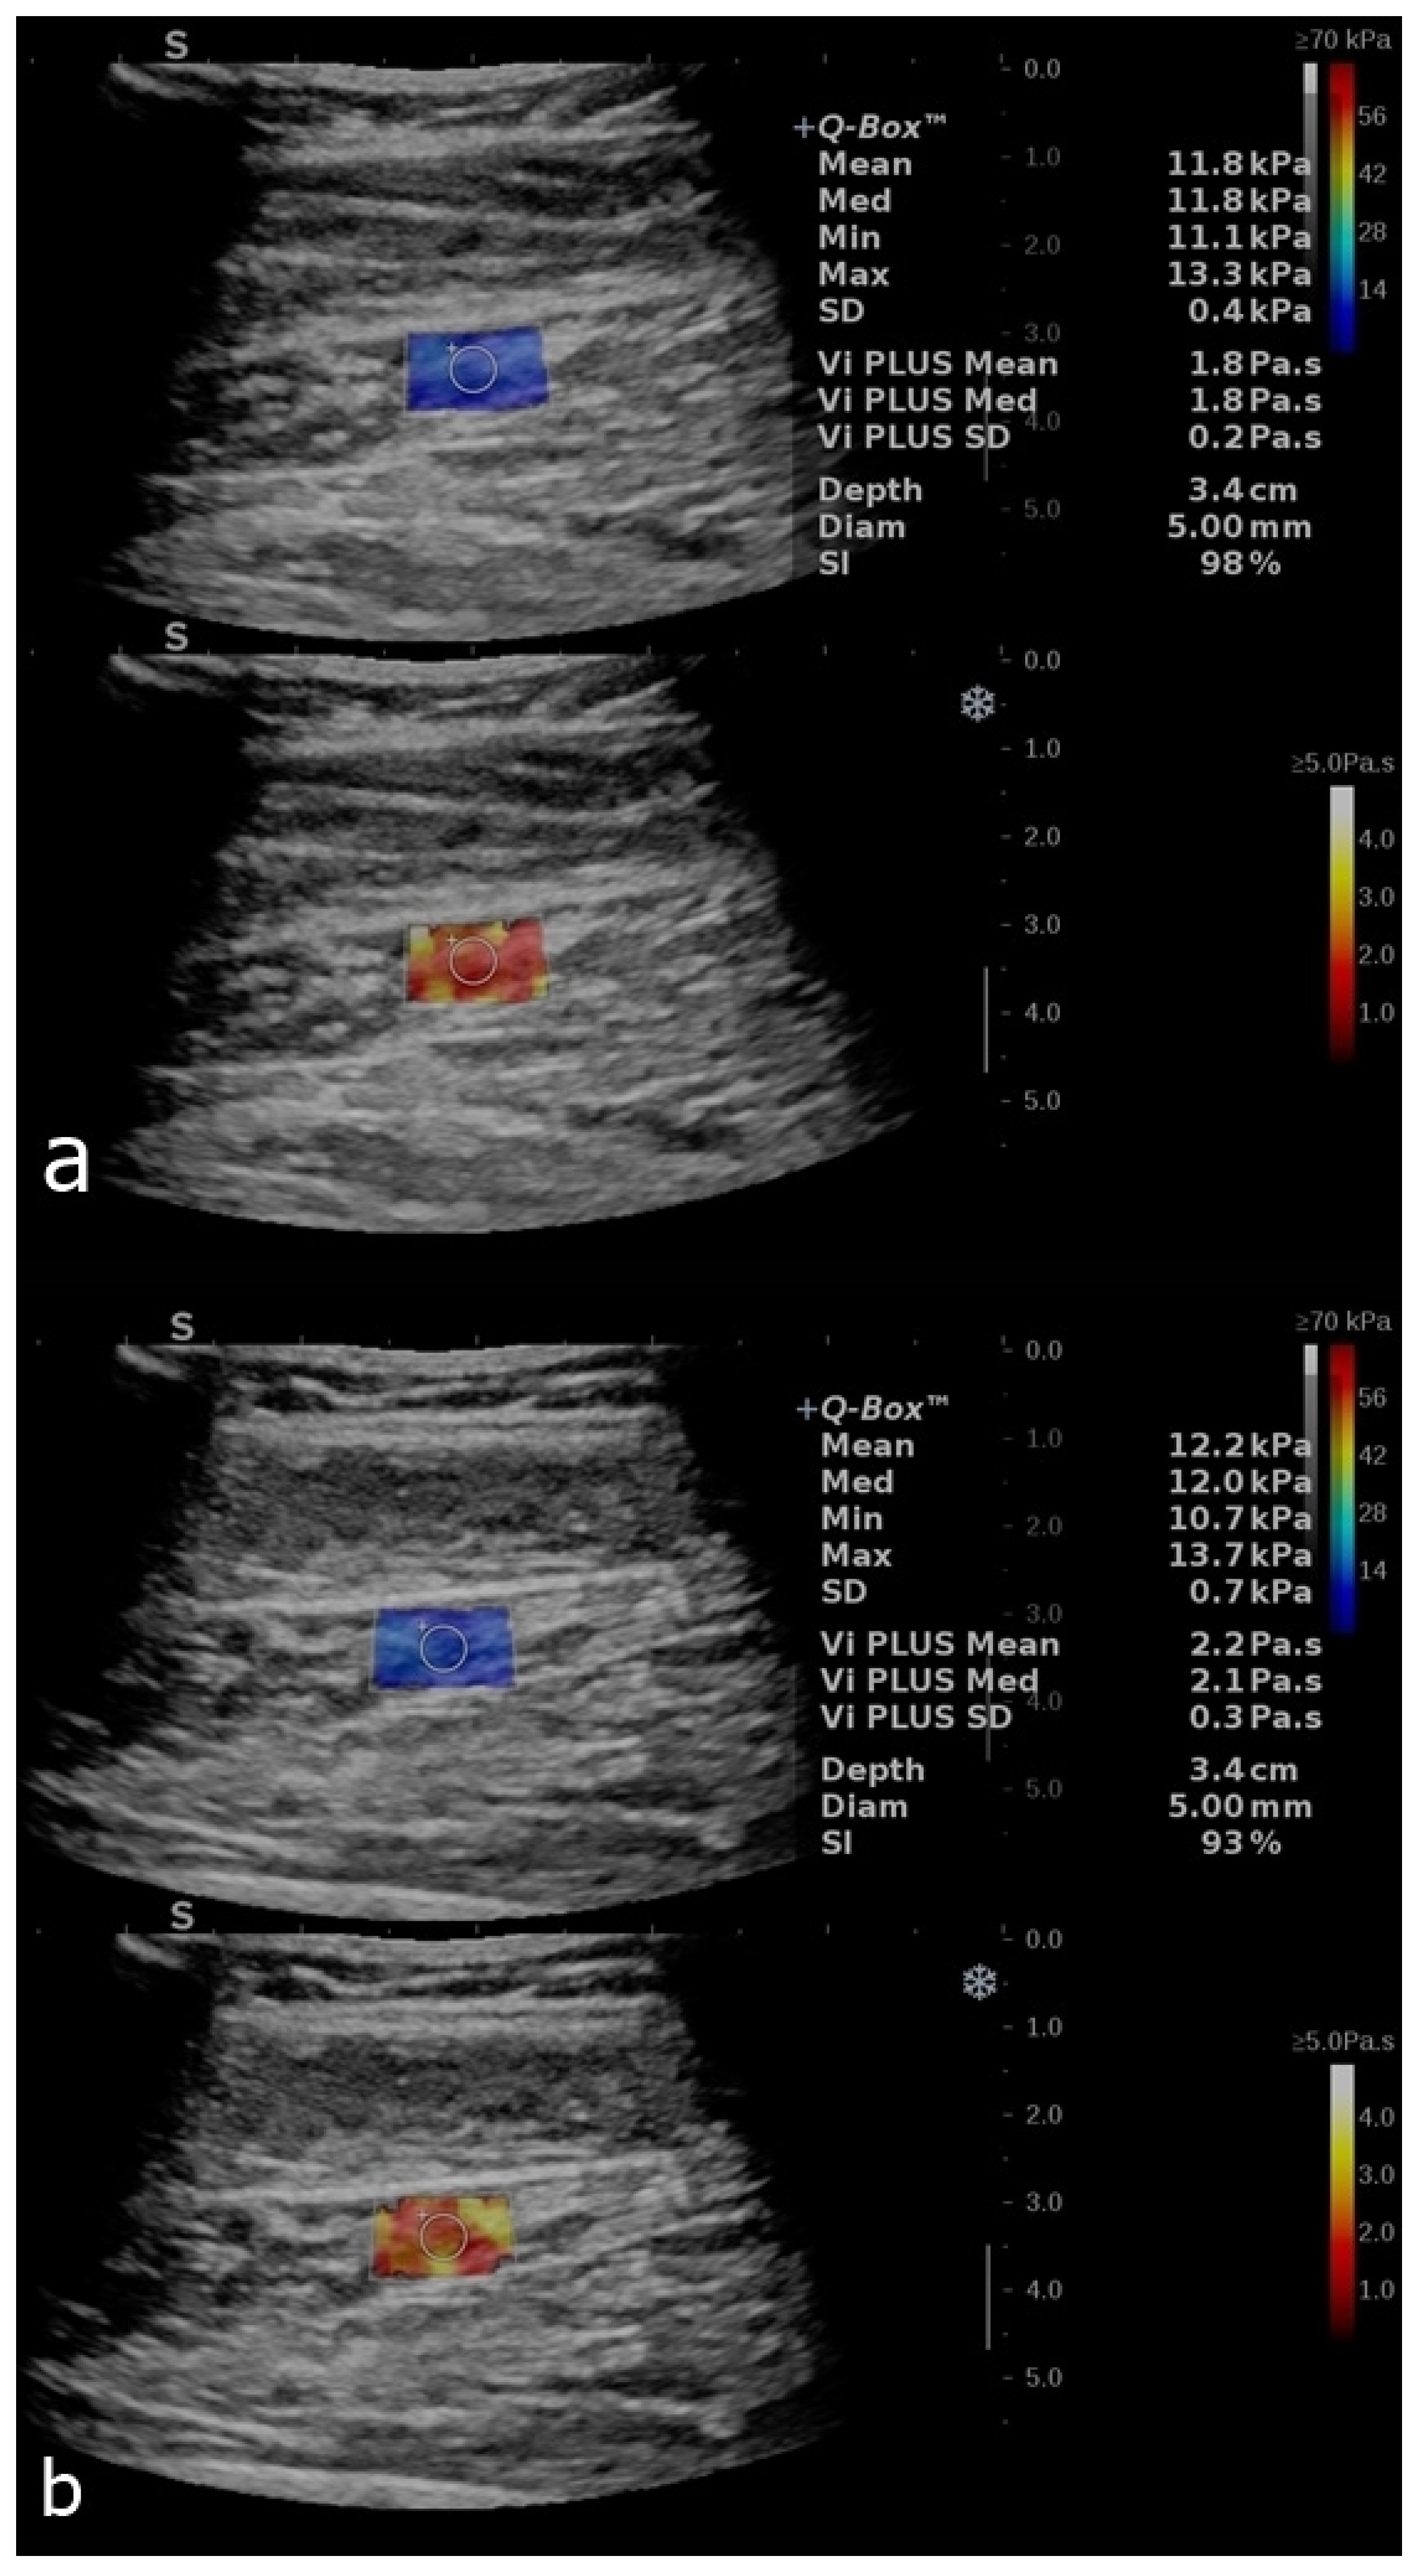
2.1. Image Acquisition
2.2. Statistical Analysis
3. Results
4. Discussion
5. Conclusions
Author Contributions
Funding
Institutional Review Board Statement
Informed Consent Statement
Data Availability Statement
Conflicts of Interest
References
- Ryu, J.; Jeong, W.K. Current status of musculoskeletal application of shear wave elastography. Ultrasonography 2017, 36, 185–197. [Google Scholar] [CrossRef]
- Cosgrove, D.; Piscaglia, F.; Bamber, J.; Bojunga, J.; Correas, J.M.; Gilja, O.A.; Dietrich, C.F. EFSUMB guidelines and recommendations on the clinical use of ultrasound elastography. Part 1: Basic principles and technology. Ultraschall. Med. 2013, 34, 169–184. [Google Scholar]
- Hossain, M.M.; Gallippi, C.M. Viscoelastic Response Ultrasound Derived Relative Elasticity and Relative Viscosity Reflect True Elasticity and Viscosity: In Silico and Experimental Demonstration. IEEE Trans. Ultrason. Ferroelectr. Freq. Control 2020, 67, 1102–1117. [Google Scholar] [CrossRef] [PubMed]
- Van Sloun, R.J.; Wildeboer, R.R.; Wijkstra, H.; Mischi, M. Viscoelasticity Mapping by Identification of Local Shear Wave Dynamics. IEEE Trans. Ultrason. Ferroelectr. Freq. Control 2017, 64, 1666–1673. [Google Scholar] [CrossRef] [PubMed]
- Kazemirad, S.; Bernard, S.; Hybois, S.; Tang, A.; Cloutier, G. Ultrasound Shear Wave Viscoelastography: Model-Independent Quantification of the Complex Shear Modulus. IEEE Trans. Ultrason. Ferroelectr. Freq. Control 2016, 63, 1399–1408. [Google Scholar] [CrossRef] [PubMed]
- Sugimoto, K.; Moriyasu, F.; Oshiro, H.; Takeuchi, H.; Yoshimasu, Y.; Kasai, Y.; Itoi, T. Viscoelasticity Measurement in Rat Livers Using Shear-Wave US Elastography. Ultrasound Med. Biol. 2018, 44, 2018–2024. [Google Scholar] [CrossRef]
- Chen, S.; Sanchez, W.; Callstrom, M.R.; Gorman, B.; Lewis, J.T.; Sanderson, S.O.; Metz, S. Assessment of liver viscoelasticity by using shear waves induced by ultrasound radiation force. Radiology 2013, 266, 964–970. [Google Scholar] [CrossRef]
- Sugimoto, K.; Moriyasu, F.; Oshiro, H.; Takeuchi, H.; Yoshimasu, Y.; Kasai, Y.; Itoi, T. Clinical utilization of shear wave dispersion imaging in diffuse liver disease. Ultrasonography 2020, 39, 3–10. [Google Scholar] [CrossRef]
- Rus, G.; Faris, I.H.; Torres, J.; Callejas, A.; Melchor, J. Why Are Viscosity and Nonlinearity Bound to Make an Impact in Clinical Elastographic Diagnosis? Sensors 2020, 20, 2379. [Google Scholar] [CrossRef]
- Zhou, B.; Zhang, X. Comparison of five viscoelastic models for estimating viscoelastic parameters using ultrasound shear wave elastography. J. Mech. Behav. Biomed. Mater. 2018, 85, 109–116. [Google Scholar] [CrossRef]
- Van Loocke, M.; Lyons, C.G.; Simms, C.K. Viscoelastic properties of passive skeletal muscle in compression: Stress-relaxation behaviour and constitutive modelling. J. Biomech. 2008, 41, 1555–1566. [Google Scholar] [CrossRef] [PubMed]
- Wheatley, B.B.; Pietsch, R.B.; Haut Donahue, T.L.; Williams, L.N. Fully non-linear hyper-viscoelastic modeling of skeletal muscle in compression. Comput. Methods Biomech. Biomed. Eng. 2016, 19, 1181–1189. [Google Scholar] [CrossRef] [PubMed]
- Chen, S.; Fatemi, M.; Greenleaf, J.F. Quantifying elasticity and viscosity from measurement of shear wave speed dispersion. J. Acoust. Soc. Am. 2004, 115, 2781–2785. [Google Scholar] [CrossRef] [PubMed]
- Romano, A.; Staber, D.; Grimm, A.; Kronlage, C.; Marquetand, J. Limitations of Muscle Ultrasound Shear Wave Elastography for Clinical Routine-Positioning and Muscle Selection. Sensors 2021, 21, 8490. [Google Scholar] [CrossRef]
- Creze, M.; Nordez, A.; Soubeyrand, M.; Rocher, L.; Maître, X.; Bellin, M.F. Shear wave sonoelastography of skeletal muscle: Basic principles, biomechanical concepts, clinical applications, and future perspectives. Skeletal Radiol. 2018, 47, 457–471. [Google Scholar] [CrossRef]
- Snoj, Ž.; Wu, C.H.; Taljanovic, M.S.; Dumić-Čule, I.; Drakonaki, E.E.; Klauser, A.S. Ultrasound Elastography in Musculoskeletal Radiology: Past, Present, and Future. Semin. Musculoskelet Radiol. 2020, 24, 156–166. [Google Scholar] [CrossRef]
- Yanagisawa, O.; Niitsu, M.; Kurihara, T.; Fukubayashi, T. Evaluation of human muscle hardness after dynamic exercise with ultrasound real-time tissue elastography: A feasibility study. Clin. Radiol. 2011, 66, 815–819. [Google Scholar] [CrossRef]
- Botar Jid, C.; Vasilescu, D.; Damian, L.; Dumitriu, D.; Ciurea, A.; Dudea, S.M. Musculoskeletal sonoelastography—Pictorial essay. Med. Ultrasound 2012, 14, 239–245. [Google Scholar]
- Săftoiu, A.; Gilja, O.H.; Sidhu, P.S.; Dietrich, C.F.; Cantisani, V.; Amy, D.; Vilmann, P. The EFSUMB Guidelines and Recommendations for the Clinical Practice of Elastography in Non-Hepatic Applications: Update 2018. Ultraschall. Med. 2019, 40, 425–453. [Google Scholar] [CrossRef]
- Gennisson, J.L.; Deffieux, T.; Macé, E.; Montaldo, G.; Fink, M.; Tanter, M. Viscoelastic and anisotropic mechanical properties of in vivo muscle tissue assessed by supersonic shear imaging. Ultrason. Med. Biol. 2010, 36, 789–801. [Google Scholar] [CrossRef]
- Hoyt, K.; Kneezel, T.; Castaneda, B.; Parker, K.J. Quantitative sonoelastography for the in vivo assessment of skeletal muscle viscoelasticity. Phys. Med. Biol. 2008, 53, 4063–4080. [Google Scholar] [CrossRef] [PubMed]
- Moore, C.J.; Caughey, M.C.; Meyer, D.O.; Emmett, R.; Jacobs, C.; Chopra, M.; Gallippi, C.M. In Vivo Viscoelastic Response (VisR) Ultrasound for Characterizing Mechanical Anisotropy in Lower-Limb Skeletal Muscles of Boys with and without Duchenne Muscular Dystrophy. Ultrasound Med. Biol. 2018, 44, 2519–2530. [Google Scholar] [CrossRef] [PubMed]
- Koo, T.K.; Li, M.Y. A guideline of selecting and reporting intraclass correlation coefficients for reliability research. J. Chiropr. Med. 2016, 15, 155–163, Erratum in J. Chiropr. Med. 2017, 16, 346. [Google Scholar] [CrossRef] [PubMed]
- Akkoc, O.; Caliskan, E.; Bayramoglu, Z. Effects of passive muscle stiffness measured by Shear Wave Elastography, muscle thickness, and body mass index on athletic performance in adolescent female basketball players. Med. Ultrason. 2018, 2, 170–176. [Google Scholar] [CrossRef]
- Ferraioli, G.; Barr, R.G.; Farrokh, A.; Radzina, M.; Cui, X.W.; Dong, Y.; Dietrich, C.F. How to perform shear wave elastography. Part II. Med. Ultrason. 2022, 24, 196–210. [Google Scholar] [CrossRef]
- Nakamura, M.; Ikezoe, T.; Kobayashi, T.; Umegaki, H.; Takeno, Y.; Nishishita, S.; Ichihashi, N. Acute effects of static stretching on muscle hardness of the medial gastrocnemius muscle belly in humans: An ultrasonic shear-wave elastography study. Ultrasound Med. Biol. 2014, 40, 1991–1997. [Google Scholar] [CrossRef]
- Davis, L.C.; Baumer, T.G.; Bey, M.J.; Van Holsbeeck, M. Clinical utilization of shear wave elastography in the musculoskeletal system. Ultrasonography 2019, 38, 2–12. [Google Scholar] [CrossRef]
- Cortez, C.D.; Hermitte, L.; Ramain, A.; Mesmann, C.; Lefort, T.; Pialat, J.B. Ultrasound shear wave velocity in skeletal muscle: A reproducibility study. Diagn. Interv. Imaging 2016, 97, 71–79. [Google Scholar] [CrossRef]
- Eby, S.F.; Song, P.; Chen, S.; Chen, Q.; Greenleaf, J.F.; An, K.-N. Validation of Shear Wave Elastography in Skeletal Muscle. J. Biomech. 2013, 46, 2381–2387. [Google Scholar] [CrossRef]
- Lacourpaille, L.; Hug, F.; Bouillard, K.; Hogrel, J.-Y.; Nordez, A. Supersonic shear imaging provides a reliable measurement of resting muscle shear elastic modulus. Physiol. Meas. 2012, 33, N19–N28. [Google Scholar] [CrossRef]
- Chino, K.; Kawakami, Y.; Takahashi, H. Tissue elasticity of in vivo skeletal muscles measured in the transverse and longitudinal planes using shear wave elastography. Clin. Physiol. Funct. Imaging 2017, 37, 394–399. [Google Scholar] [CrossRef] [PubMed]
- Alfuraih, A.M.; O’Connor, P.; Hensor, E.; Tan, A.L.; Emery, P.; Wakefield, R.J. The effect of unit, depth, and probe load on the reliability of muscle shear wave elastography: Variables affecting reliability of SWE. J. Clin. Ultrasound 2018, 46, 108–115. [Google Scholar] [CrossRef] [PubMed]


| Variables | All Samples (n = 38) Median Range (Min–Max) | Male (n = 8) Median Range (Min–Max) | Female (n = 30) Median Range (Min–Max) |
|---|---|---|---|
| Age (years) | 26 (21–29) | 24 (21–28) | 27 (21–29) |
| BMI (kg/m2) | 20.98 (17.85–34.88) | 25.78 (19.5–34.88) | 20.5 (17.8–27.5) |
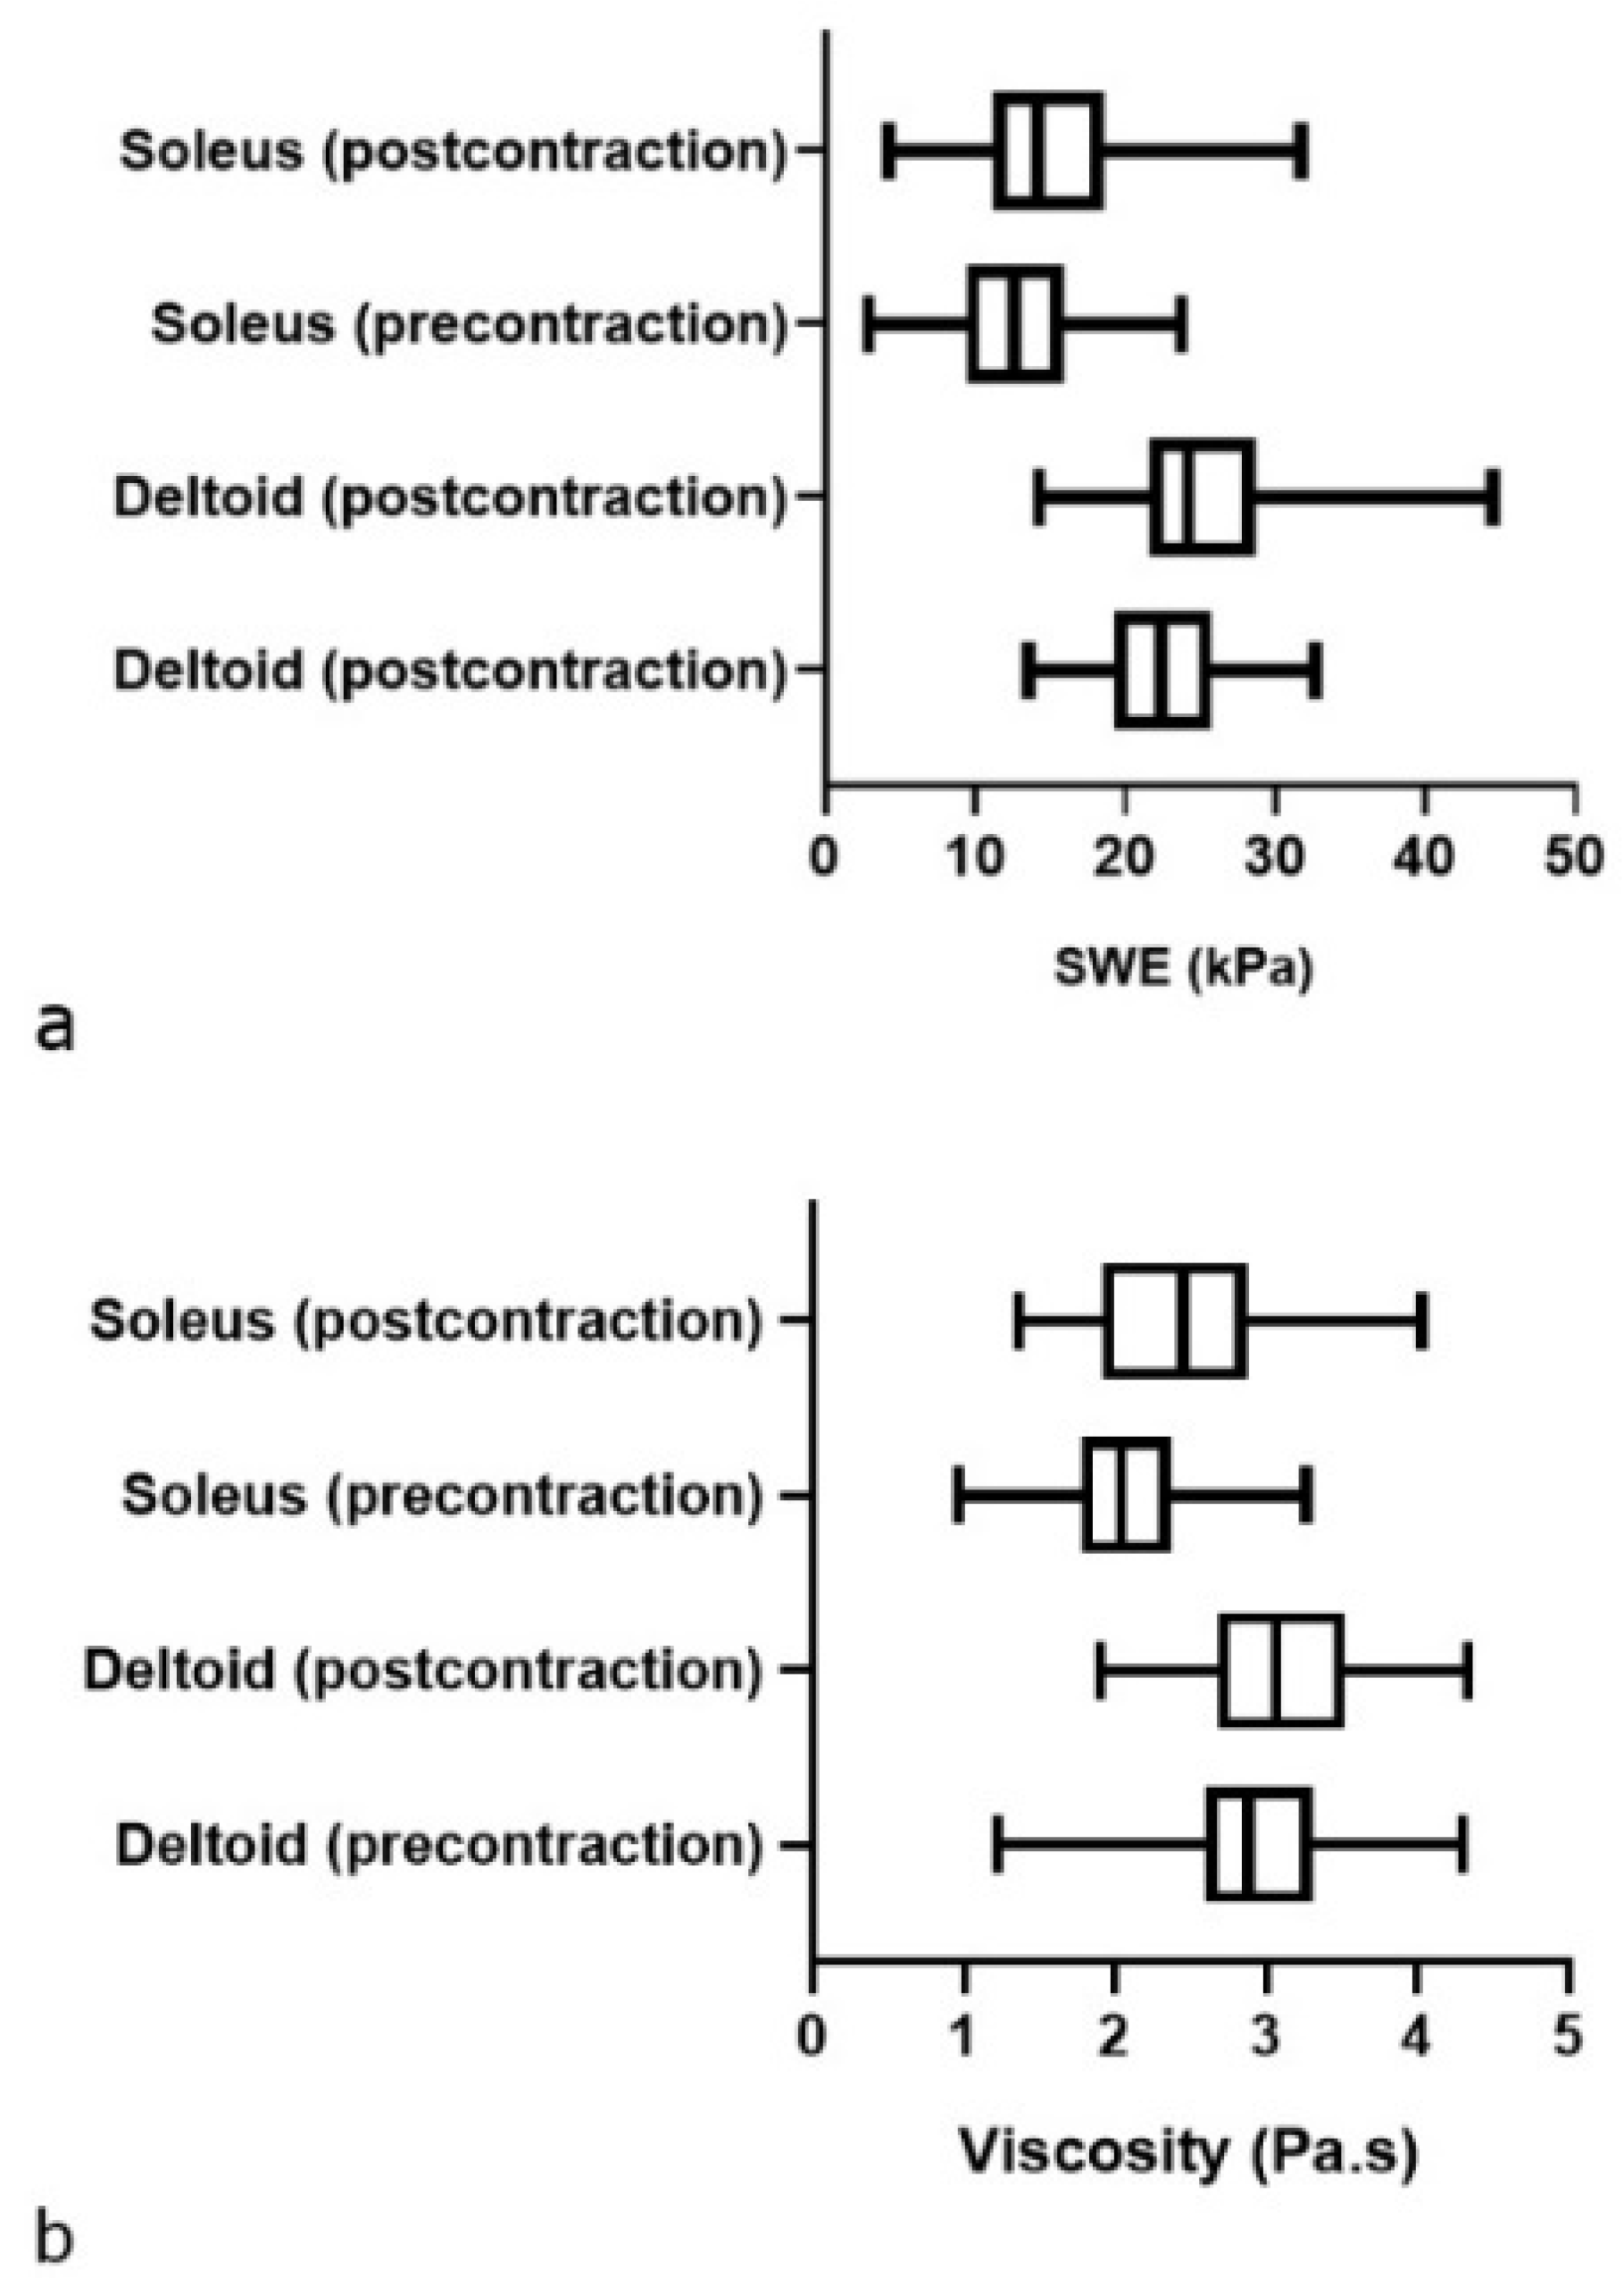
| Variables | Deltoid (Precontraction) Mean ± SD 95% CI of Mean | Deltoid (Postcontraction) Mean ± SD 95% CI of Mean | Soleus (Precontraction) Mean ± SD 95% CI of Mean | Soleus (Postcontraction) Mean ± SD Median (Range) 95% CI of Mean 25–75% Percentile |
|---|---|---|---|---|
| SWE (kPa/s) | 22.2 ± 4.4 [21.2–23.2] | 24.9 ± 5.3 [23.6–26.1] | 13.1 ± 4.7 [12–14.1] | 14.2 (4.2–31.7) [25% 11.3–75% 18.5] |
| ViPLUS (Pa.s) | 2.9 ± 0.5 [2.8–3] | 3.1 ± 0.5 [3–3.2] | 2.1 ± 0.5 [1.9–2.2] | 2.4 ± 0.6 [2.3–2.6] |
| Variables | Deltoid SWE Comparison Pre/Post Contraction Paired t-Test | Deltoid ViPLUS Comparison Pre/Post Contraction PAIRED t-Test | Soleus SWE Comparison Pre/Post Contraction Wilcoxon Matched-Pairs Signed-Rank Test | Soleus ViPLUS Comparison Pre/Post Contraction Paired t-Test |
|---|---|---|---|---|
| t,df | 4.72, 75 | 2.56, 75 | 4.48, 75 | |
| * p value (two-tailed) | <0.0001 | 0.0124 | 0.0003 | <0.0001 |
| r (correlation coefficient), p value (one tailed) | 0.5, <0.0001 | 0.4, 0.0006 | 0.6, <0.0001 | 0.3, 0.0147 |
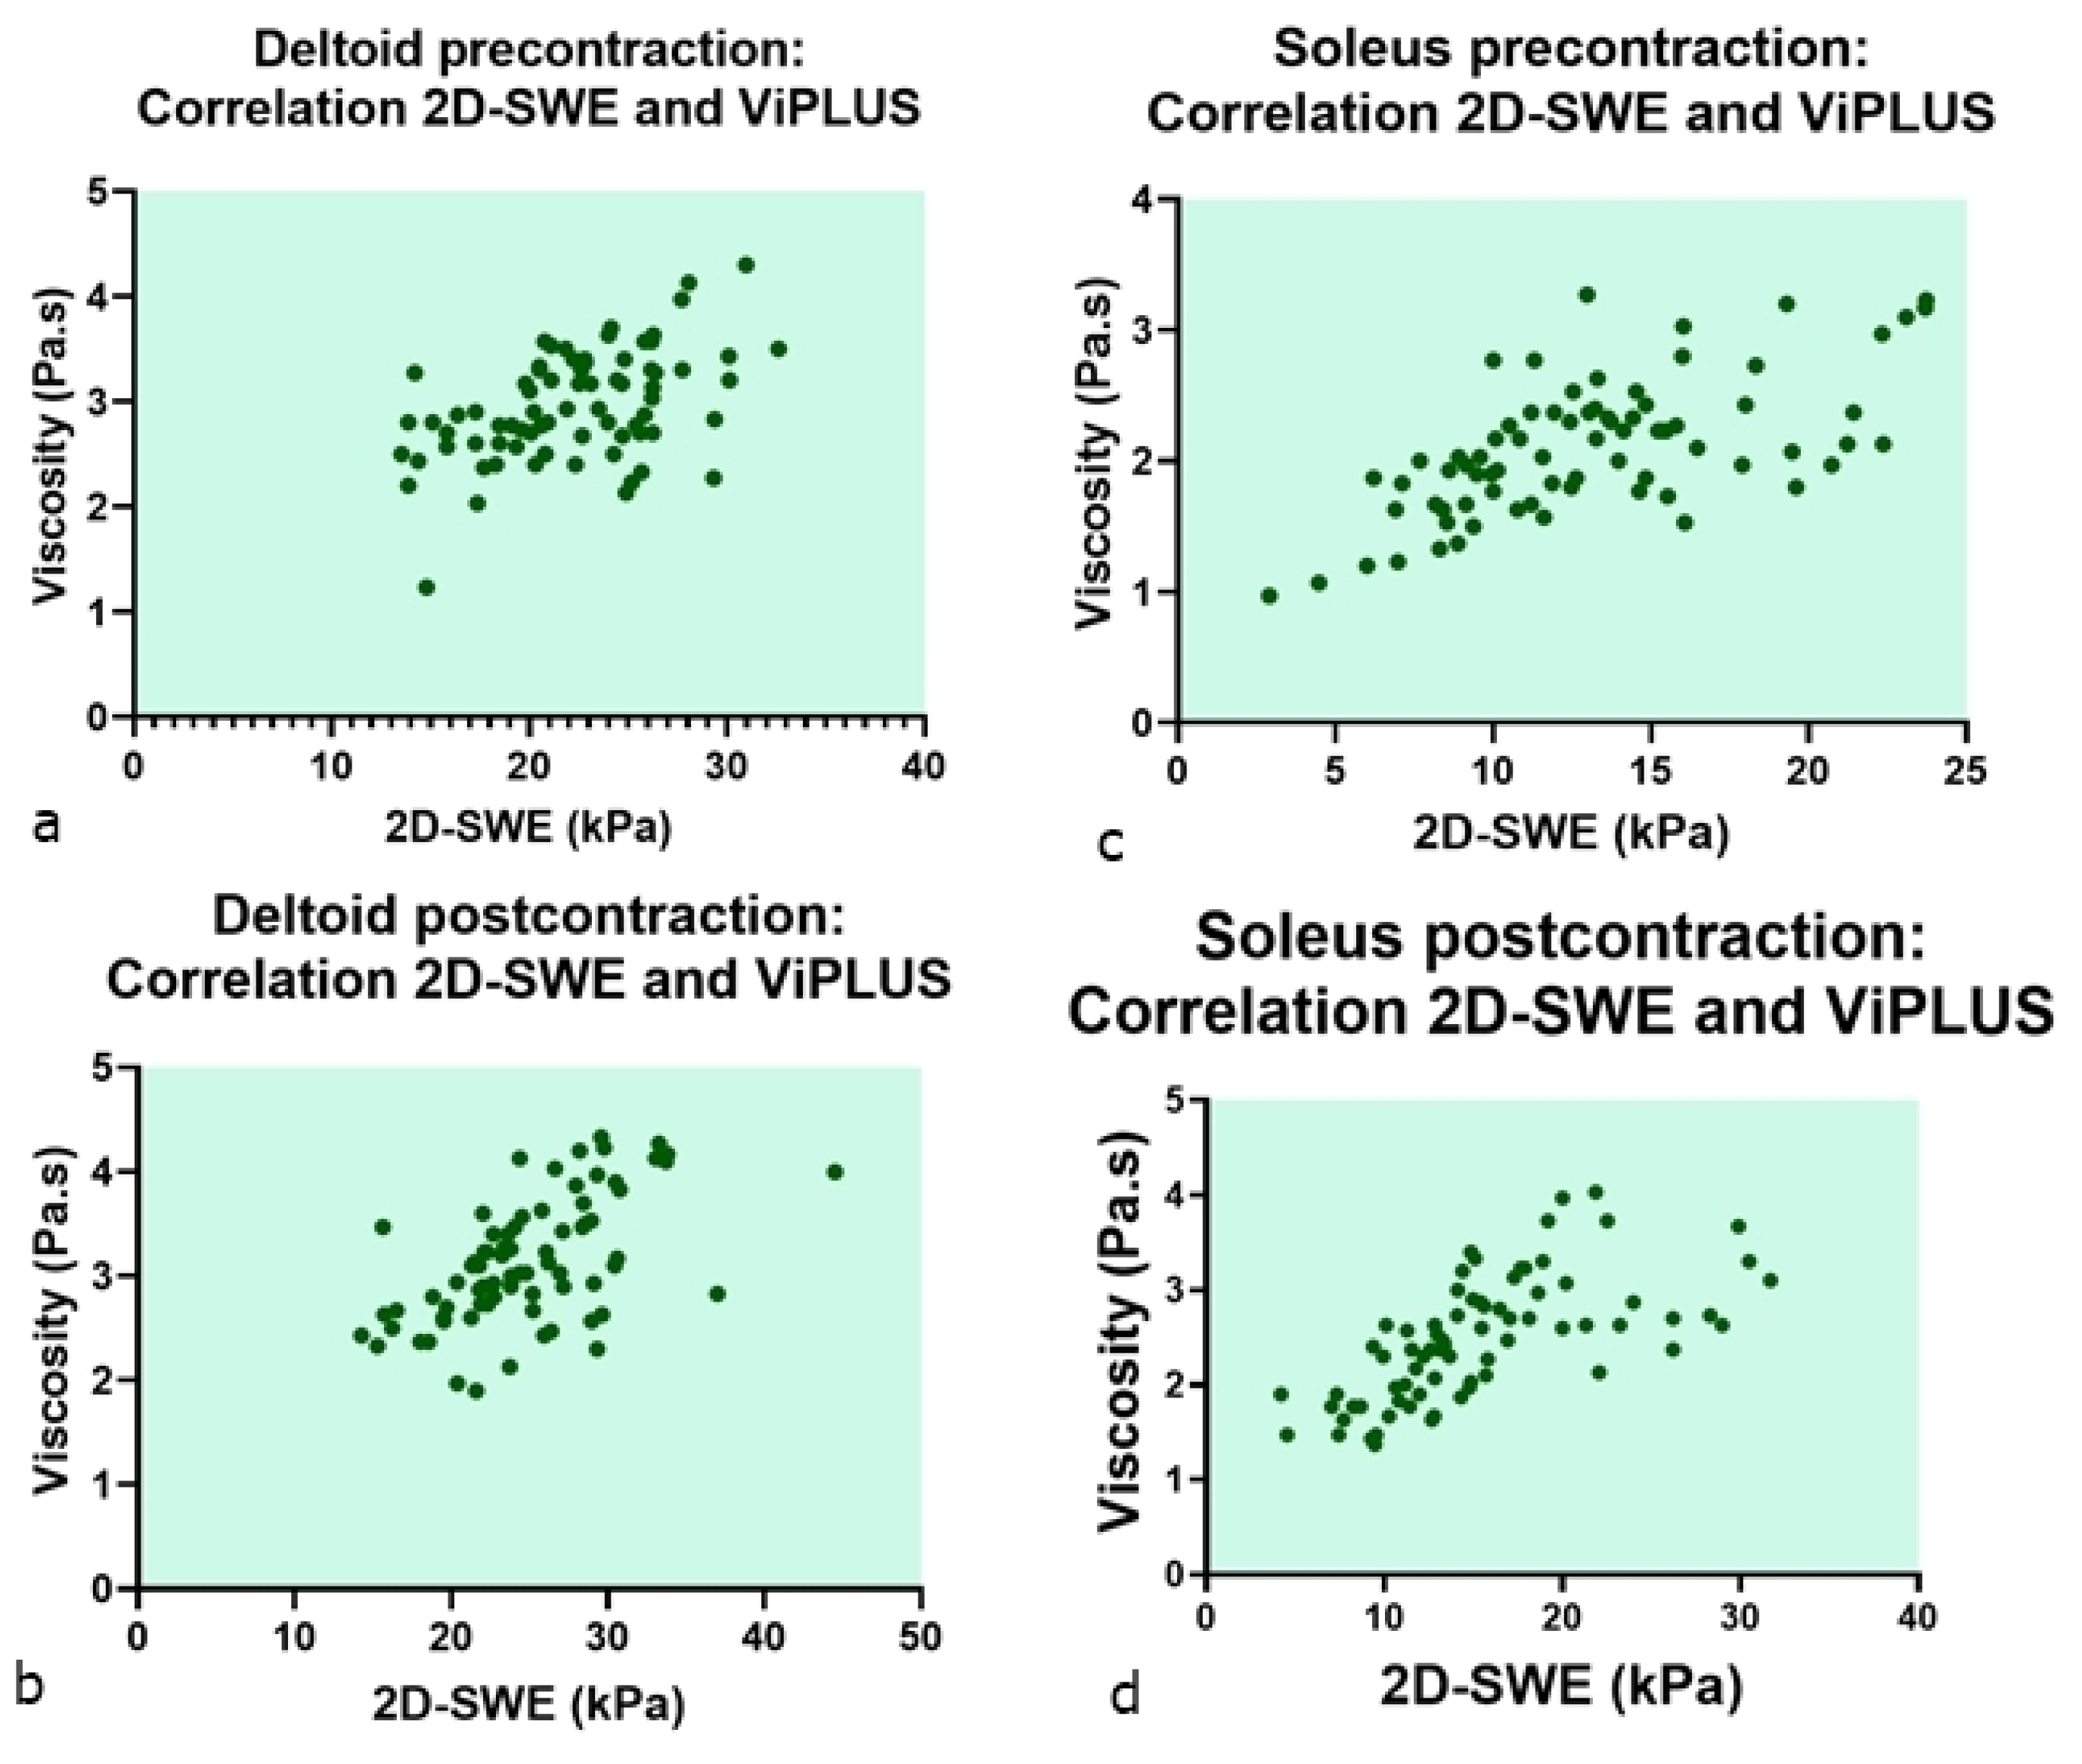
| Correlation Coefficient [95% Confidence Interval] Significance Level p * (Two-Tailed) | Deltoid ViPLUS Precontraction | Deltoid ViPLUS Postcontraction | Soleus ViPLUS Precontraction | Soleus ViPLUS Post-Contraction |
|---|---|---|---|---|
| Deltoid SWE precontraction | Pearson r = 0.48 [95% CI 0.28–0.63] p < 0.0001 | |||
| Deltoid SWE postcontraction | Pearson r = 0.57 [95% CI 0.4–0.7] p < 0.0001 | |||
| Soleus SWE precontraction | Pearson r = 0.63 [95% 0.48 = 0.75], p < 0.0001 | |||
| Soleus SWE postcontraction | Spearman r = 0.75 [95% 0.63–0.83], p < 0.0001 |
| Intraclass Correlation Coefficient | |||||||
|---|---|---|---|---|---|---|---|
| Intraclass Correlation b | 95% Confidence Interval | F Test with True Value 0 | |||||
| Lower Bound | Upper Bound | Value | df1 | df2 | Sig | ||
| Single Measures | 0.912 a | 0.891 | 0.929 | 21.671 | 303 | 303 | 0.000 |
| Average Measures | 0.954 | 0.942 | 0.963 | 21.671 | 303 | 303 | 0.000 |
Publisher’s Note: MDPI stays neutral with regard to jurisdictional claims in published maps and institutional affiliations. |
© 2022 by the authors. Licensee MDPI, Basel, Switzerland. This article is an open access article distributed under the terms and conditions of the Creative Commons Attribution (CC BY) license (https://creativecommons.org/licenses/by/4.0/).
Share and Cite
Dulgheriu, I.-T.; Solomon, C.; Muntean, D.D.; Petea-Balea, R.; Lenghel, M.; Ciurea, A.I.; Dudea, S.M. Shear-Wave Elastography and Viscosity PLUS for the Assessment of Peripheric Muscles in Healthy Subjects: A Pre- and Post-Contraction Study. Diagnostics 2022, 12, 2138. https://doi.org/10.3390/diagnostics12092138
Dulgheriu I-T, Solomon C, Muntean DD, Petea-Balea R, Lenghel M, Ciurea AI, Dudea SM. Shear-Wave Elastography and Viscosity PLUS for the Assessment of Peripheric Muscles in Healthy Subjects: A Pre- and Post-Contraction Study. Diagnostics. 2022; 12(9):2138. https://doi.org/10.3390/diagnostics12092138
Chicago/Turabian StyleDulgheriu, Ioana-Teofana, Carolina Solomon, Delia Doris Muntean, Raluca Petea-Balea, Manuela Lenghel, Anca Ileana Ciurea, and Sorin Marian Dudea. 2022. "Shear-Wave Elastography and Viscosity PLUS for the Assessment of Peripheric Muscles in Healthy Subjects: A Pre- and Post-Contraction Study" Diagnostics 12, no. 9: 2138. https://doi.org/10.3390/diagnostics12092138