
Assessment of Iodine Contrast-To-Noise Ratio in Virtual Monoenergetic Images Reconstructed from Dual-Source Energy-Integrating CT and Photon-Counting CT Data

 ,
,
Abstract
:1. Introduction
2. Materials and Methods
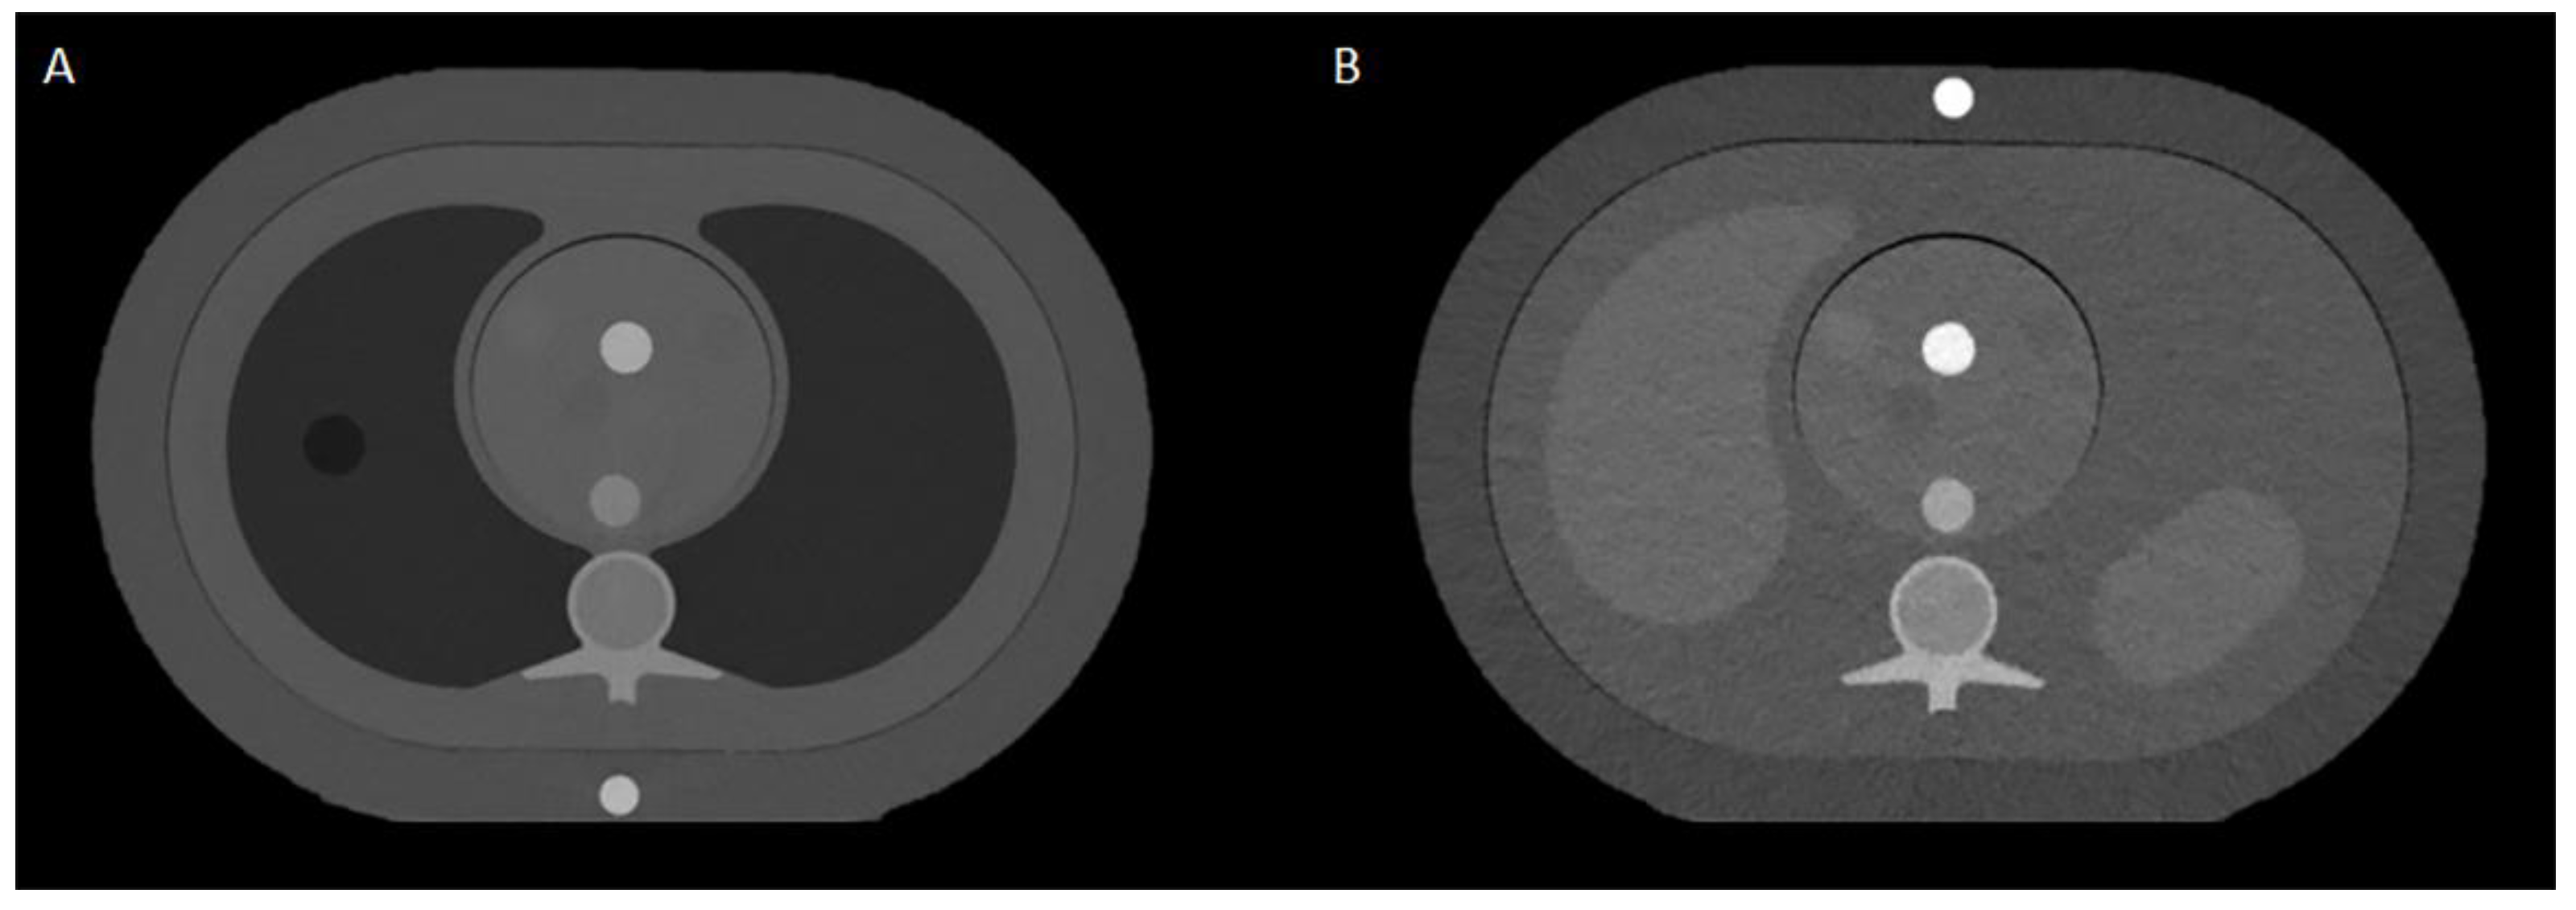
2.1. Phantoms and CT Systems
2.2. Data Acquisition and Reconstruction Parameters
2.3. Data Analysis
2.4. Statistical Analysis
3. Results
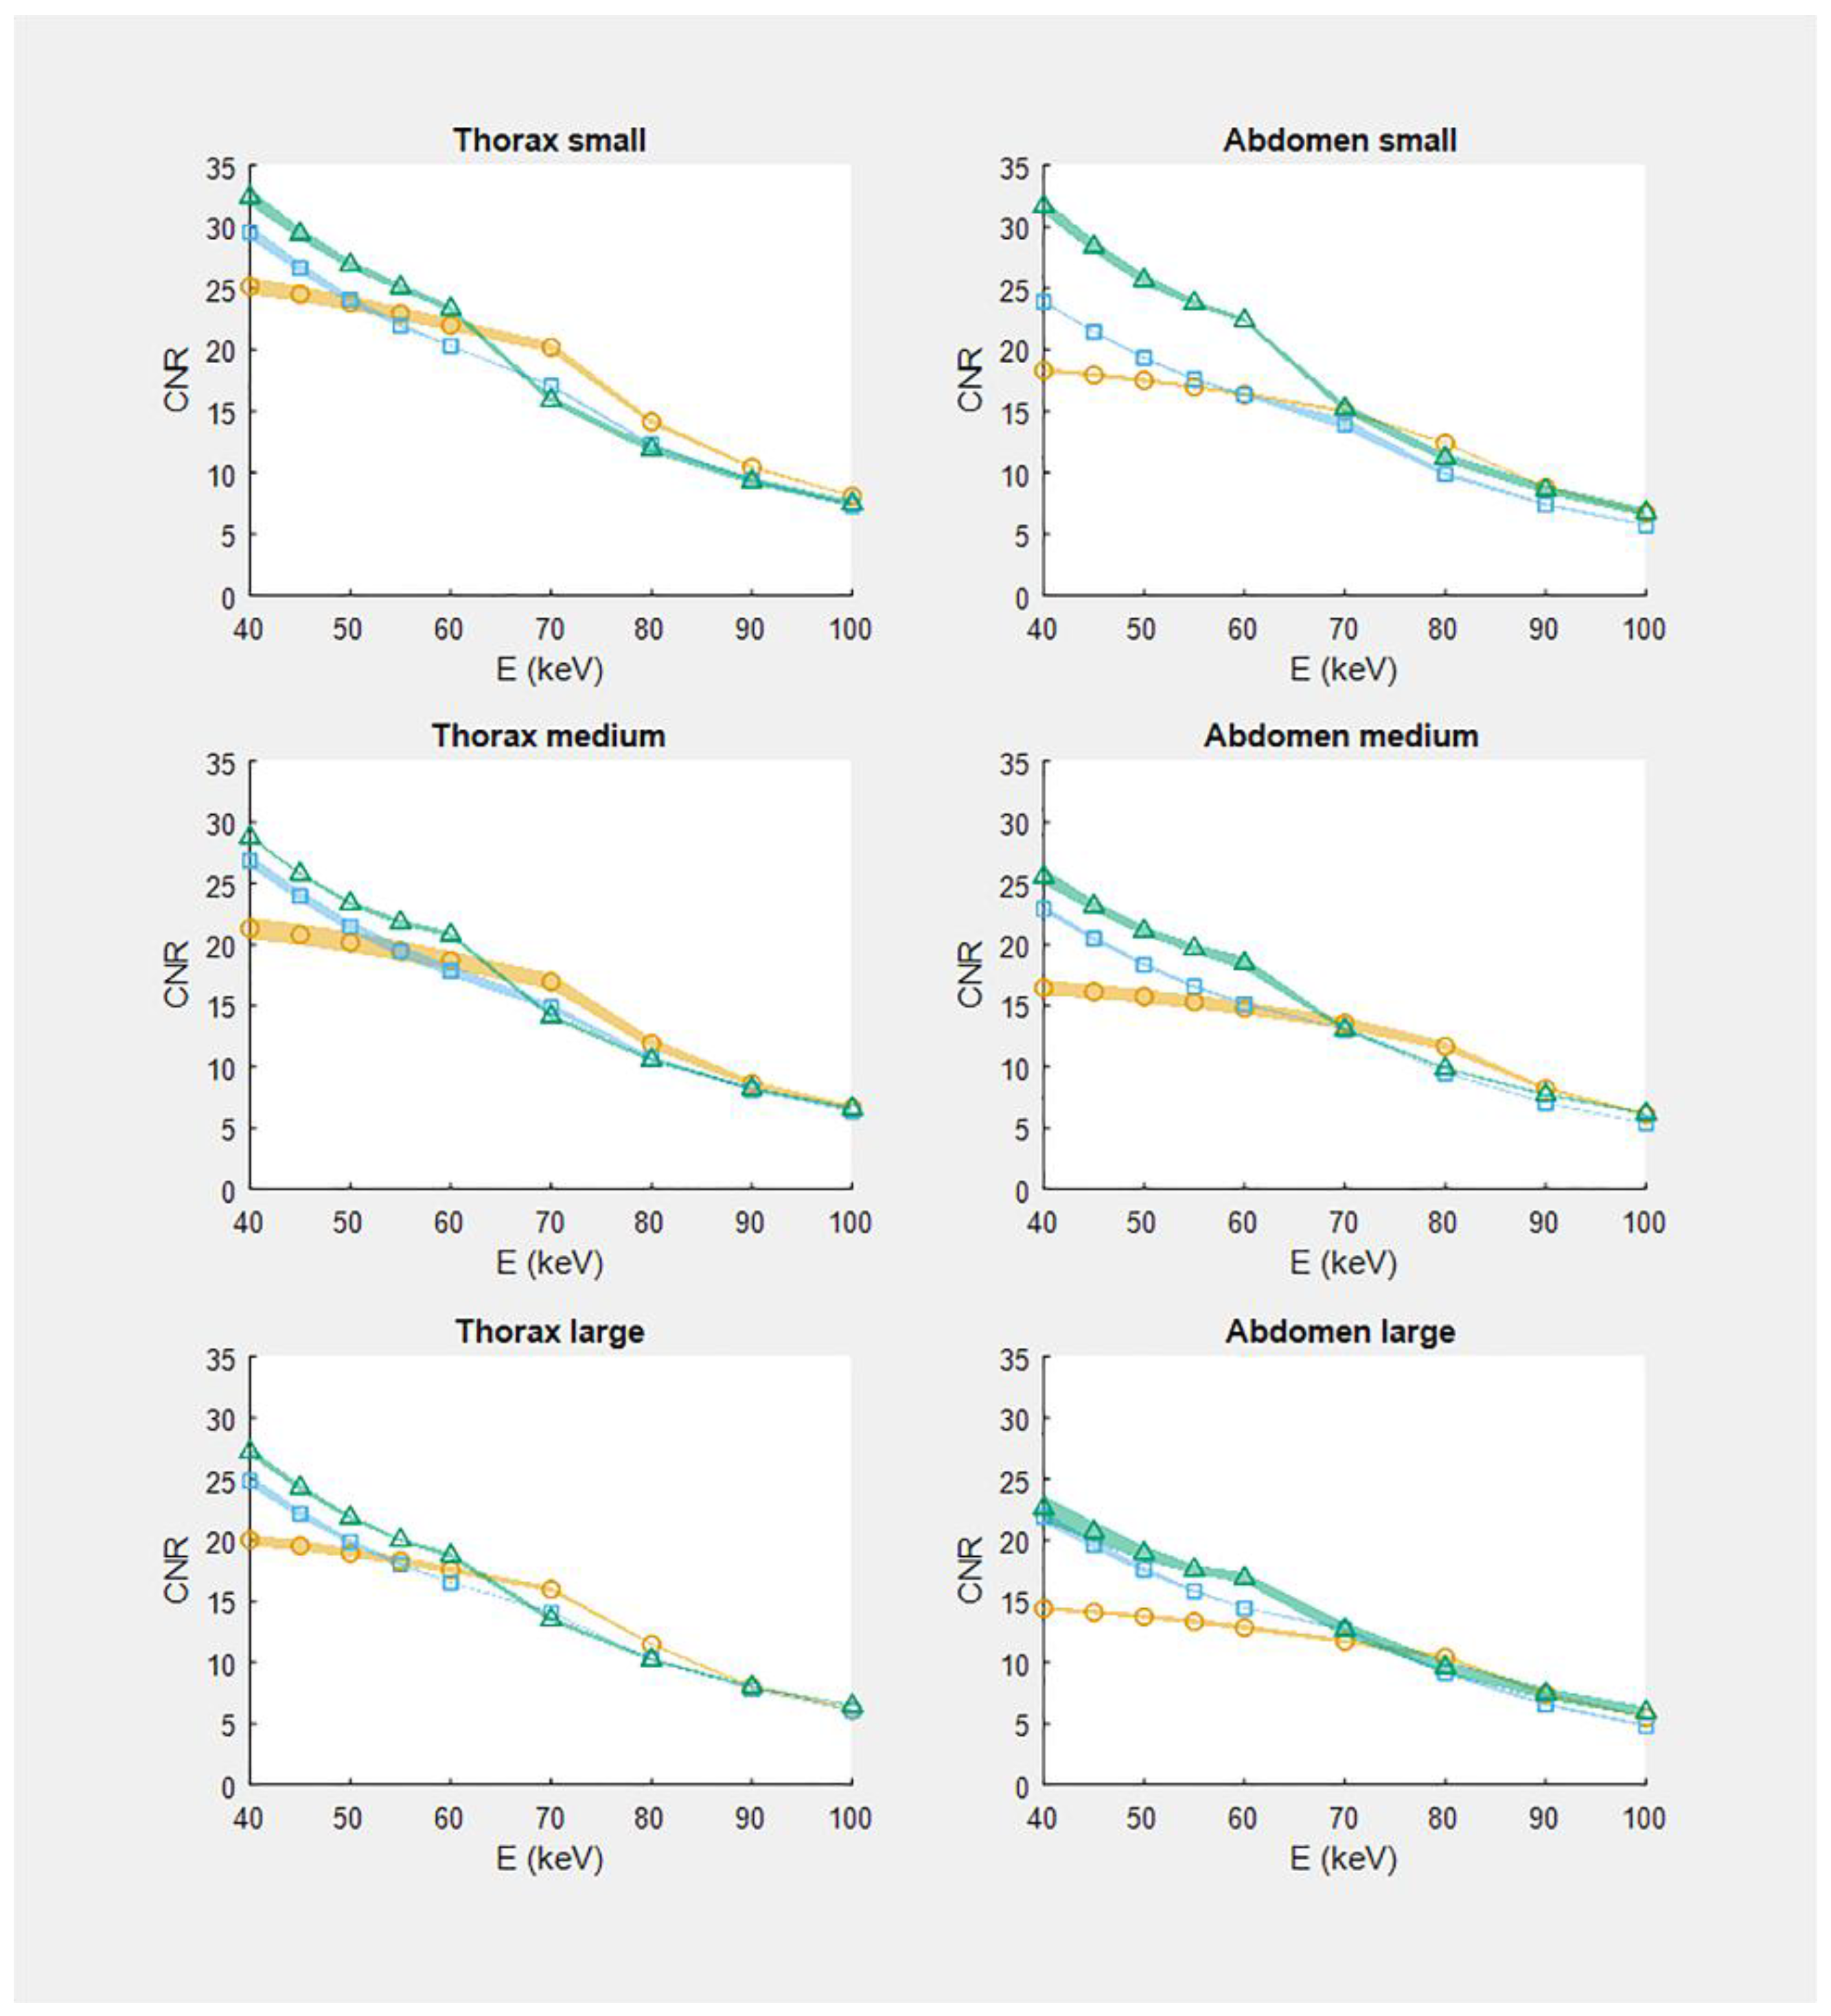
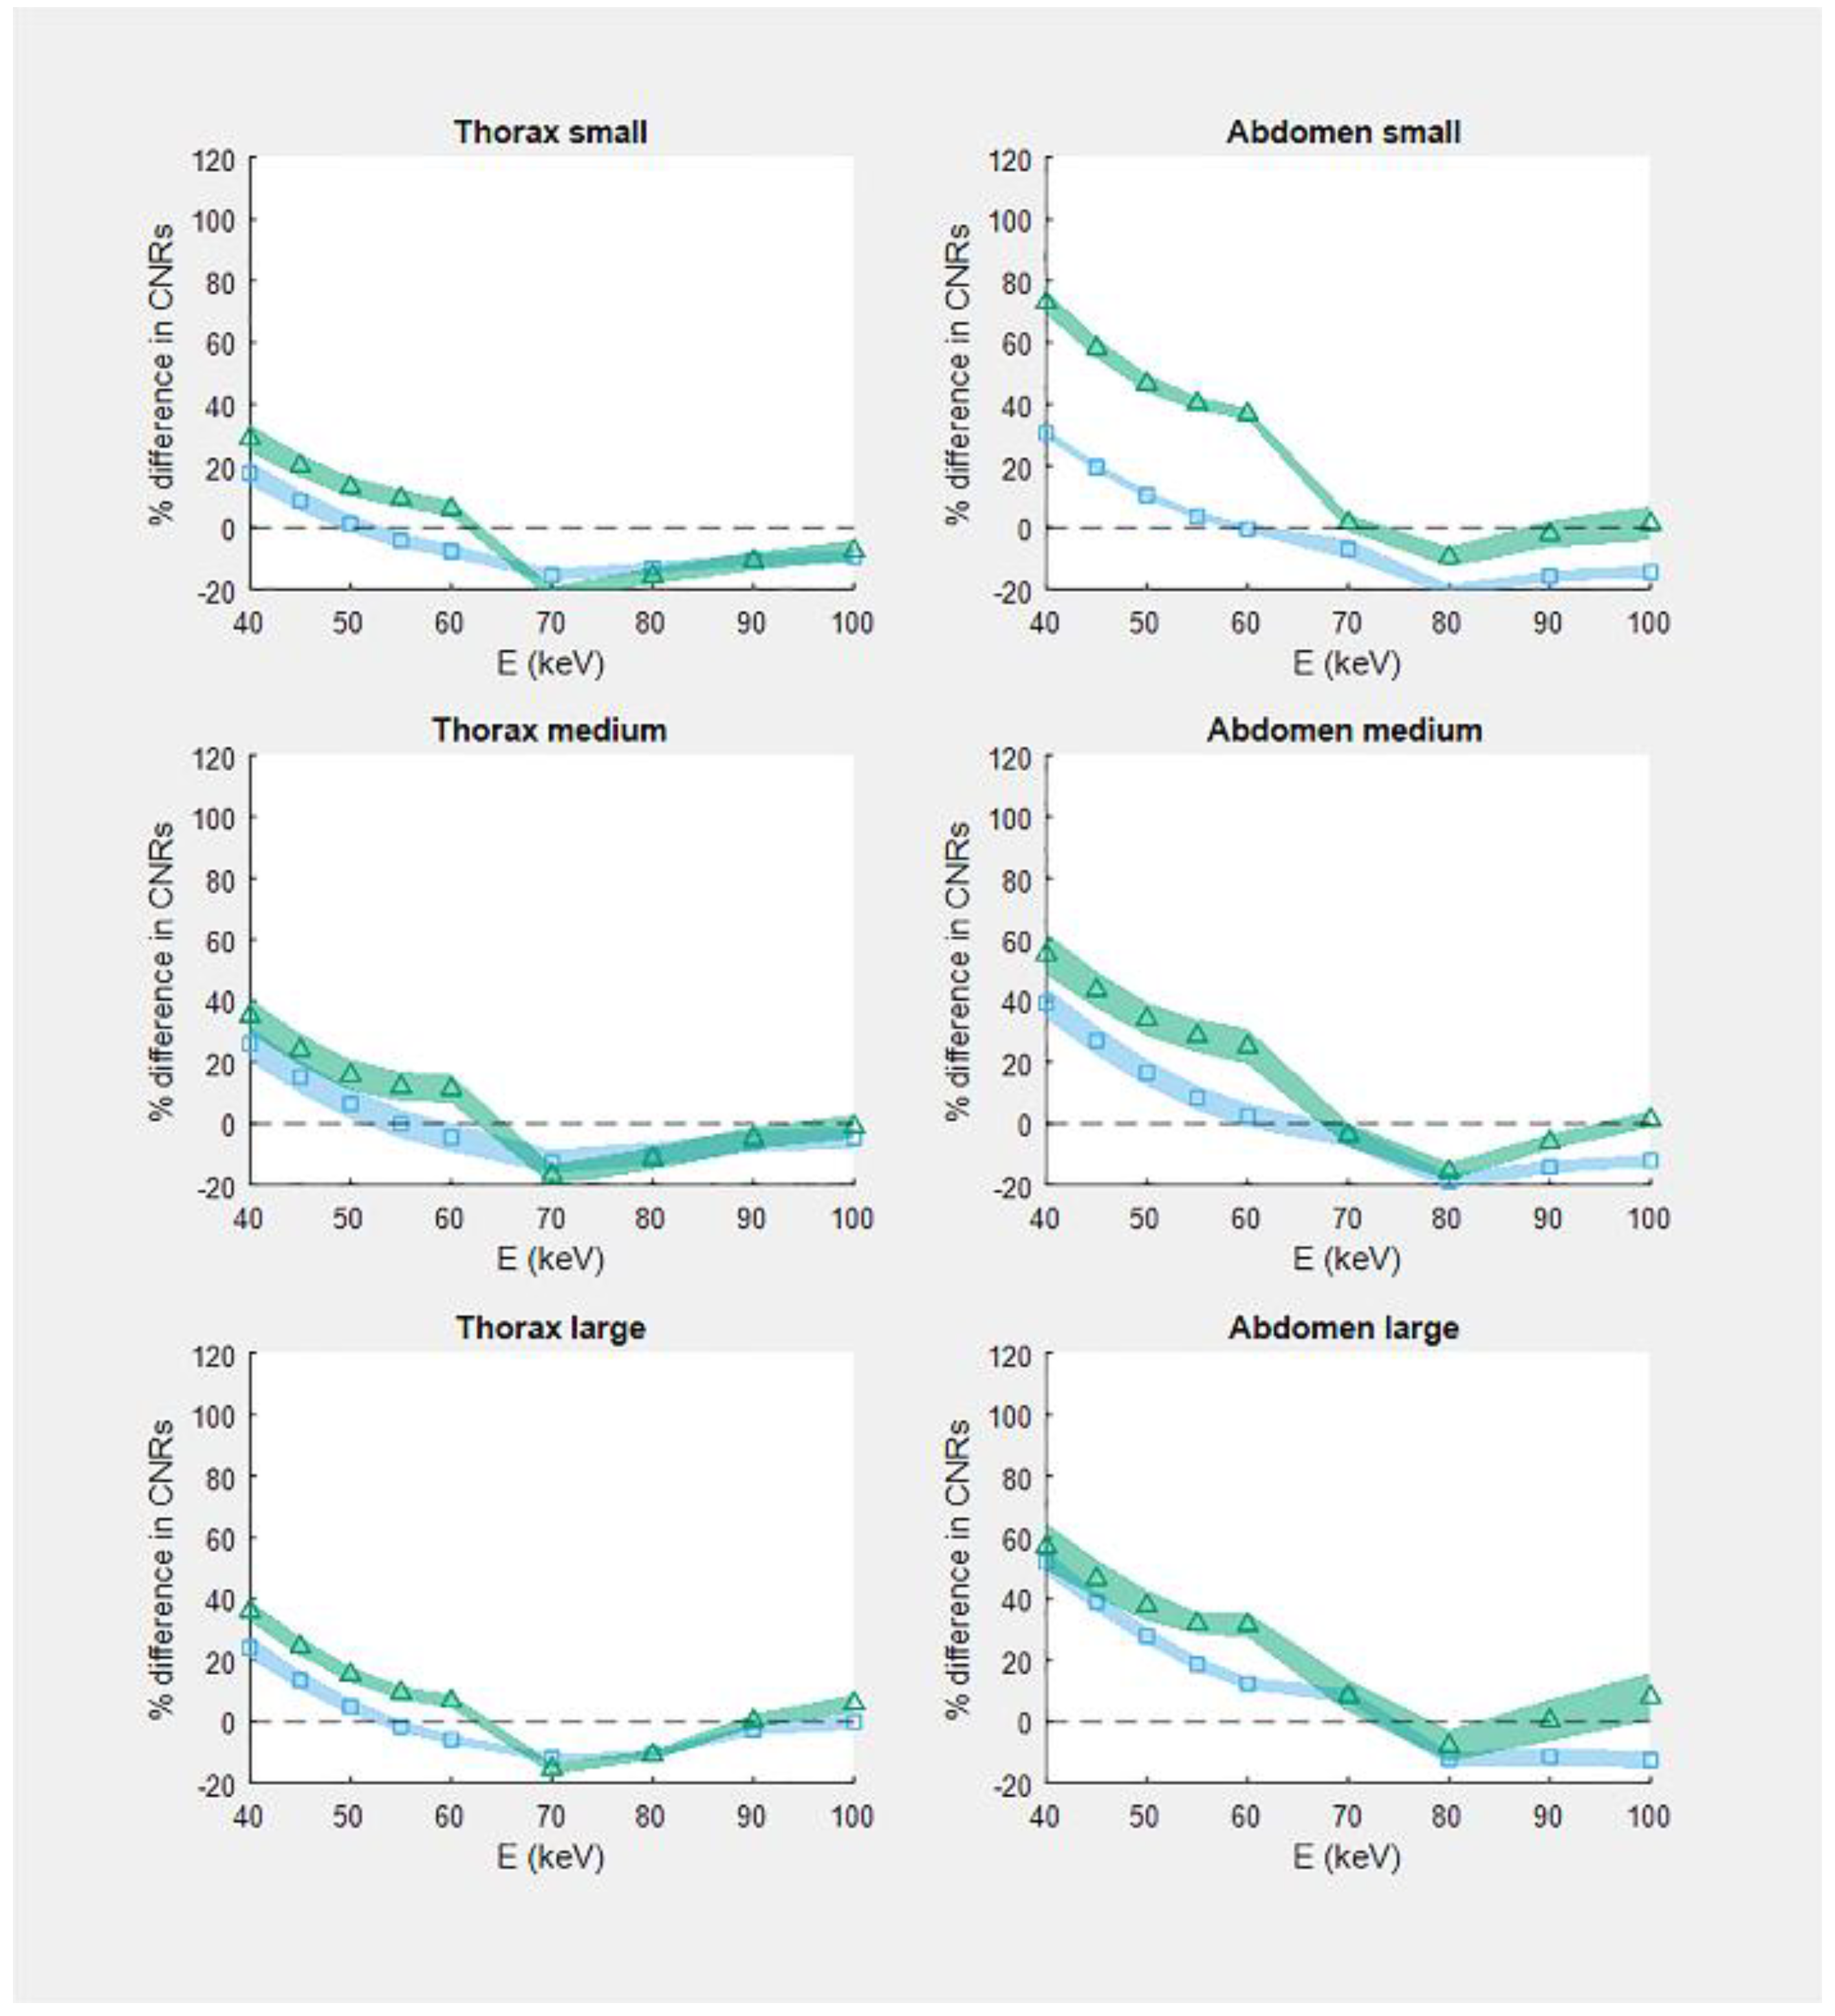
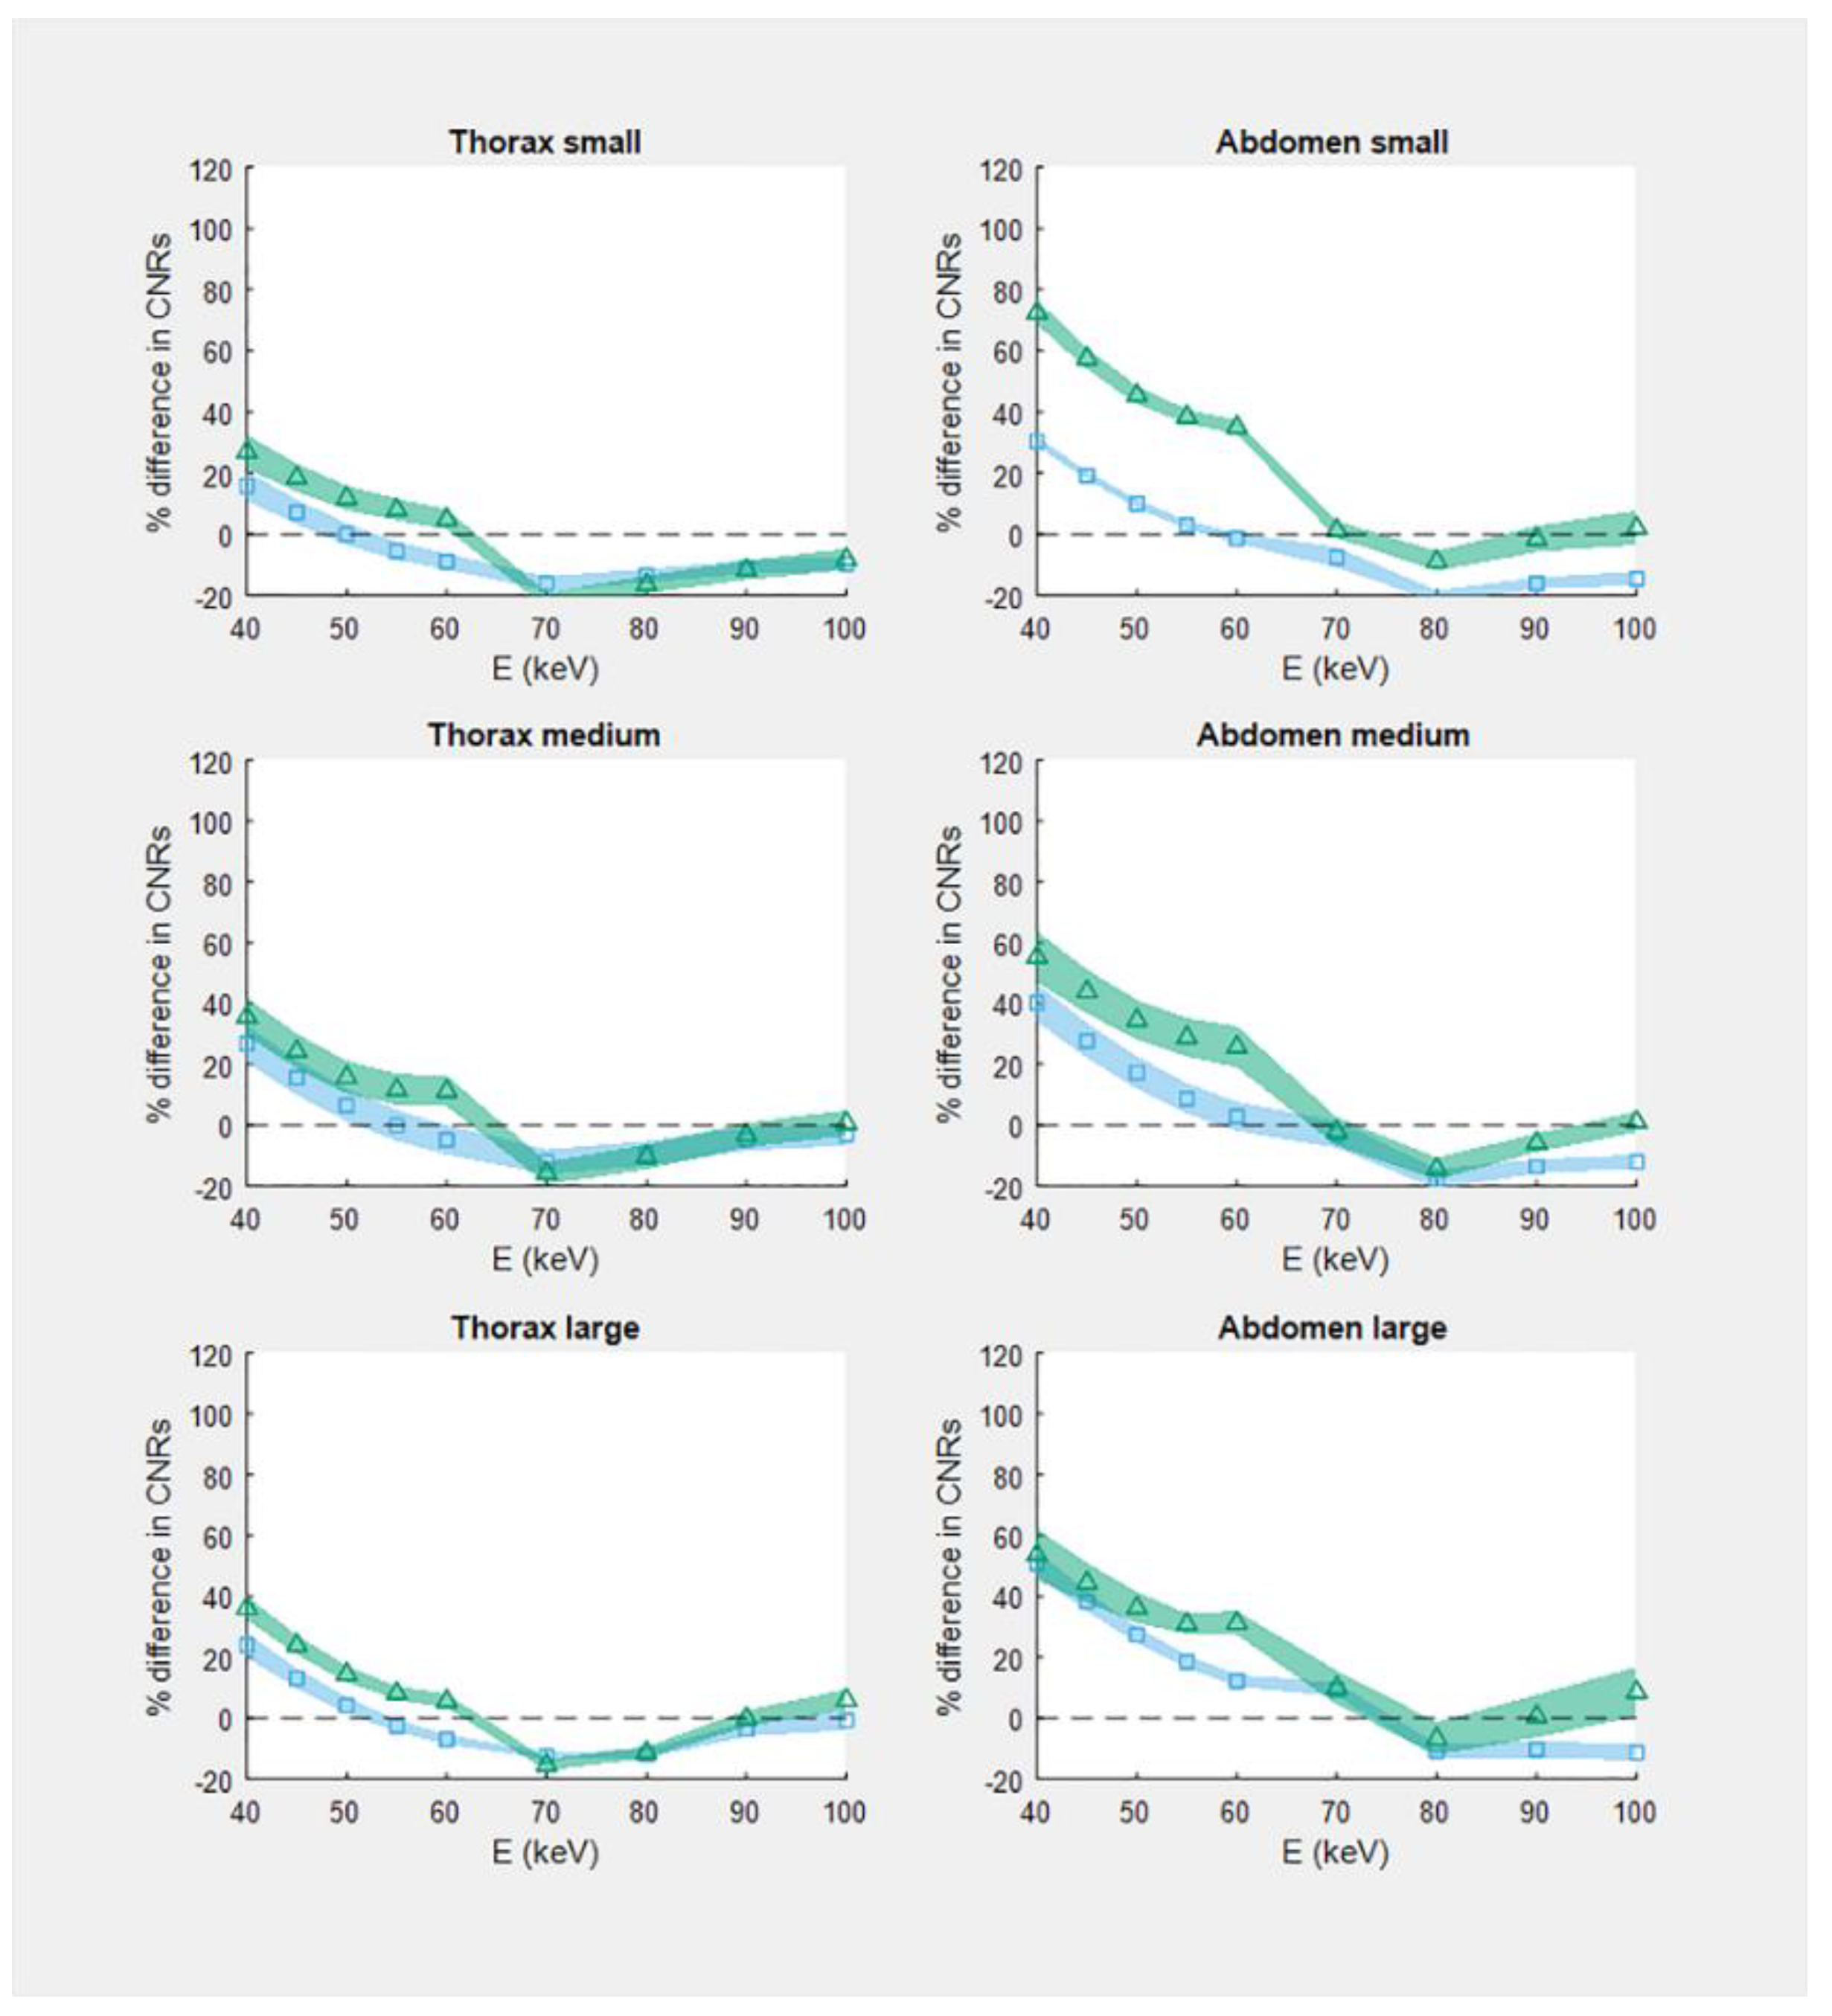
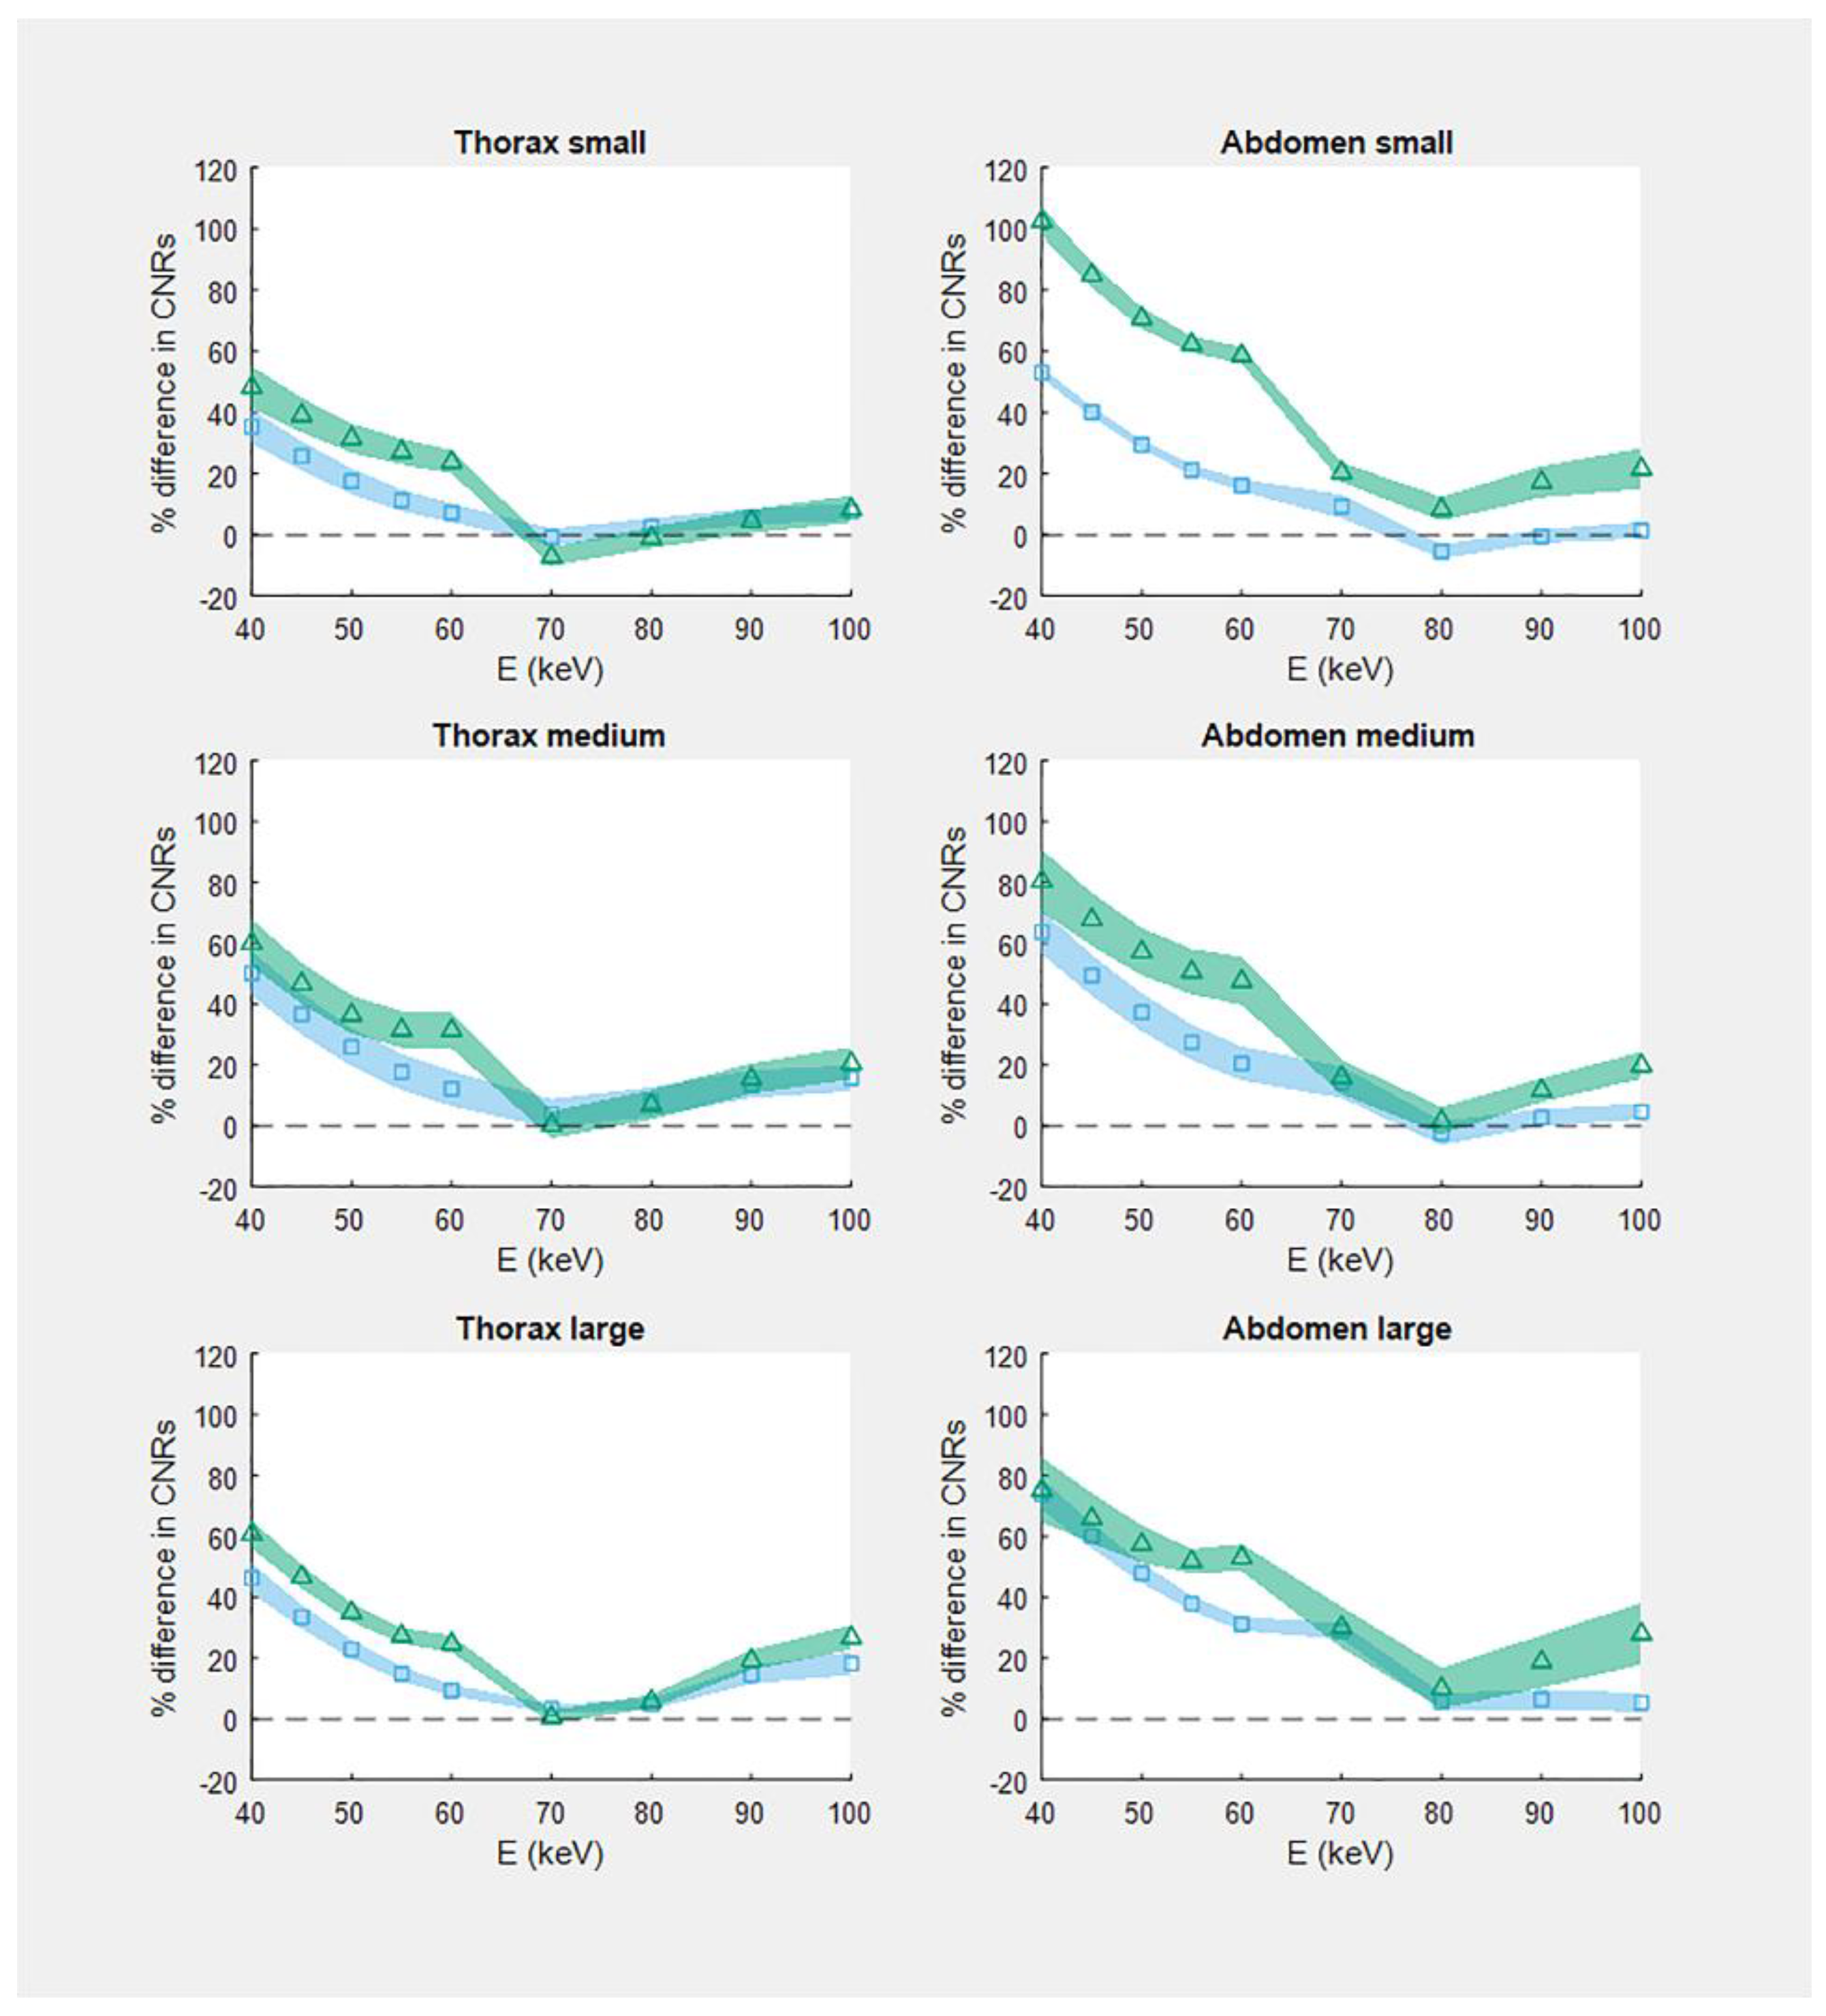
3.1. CNR
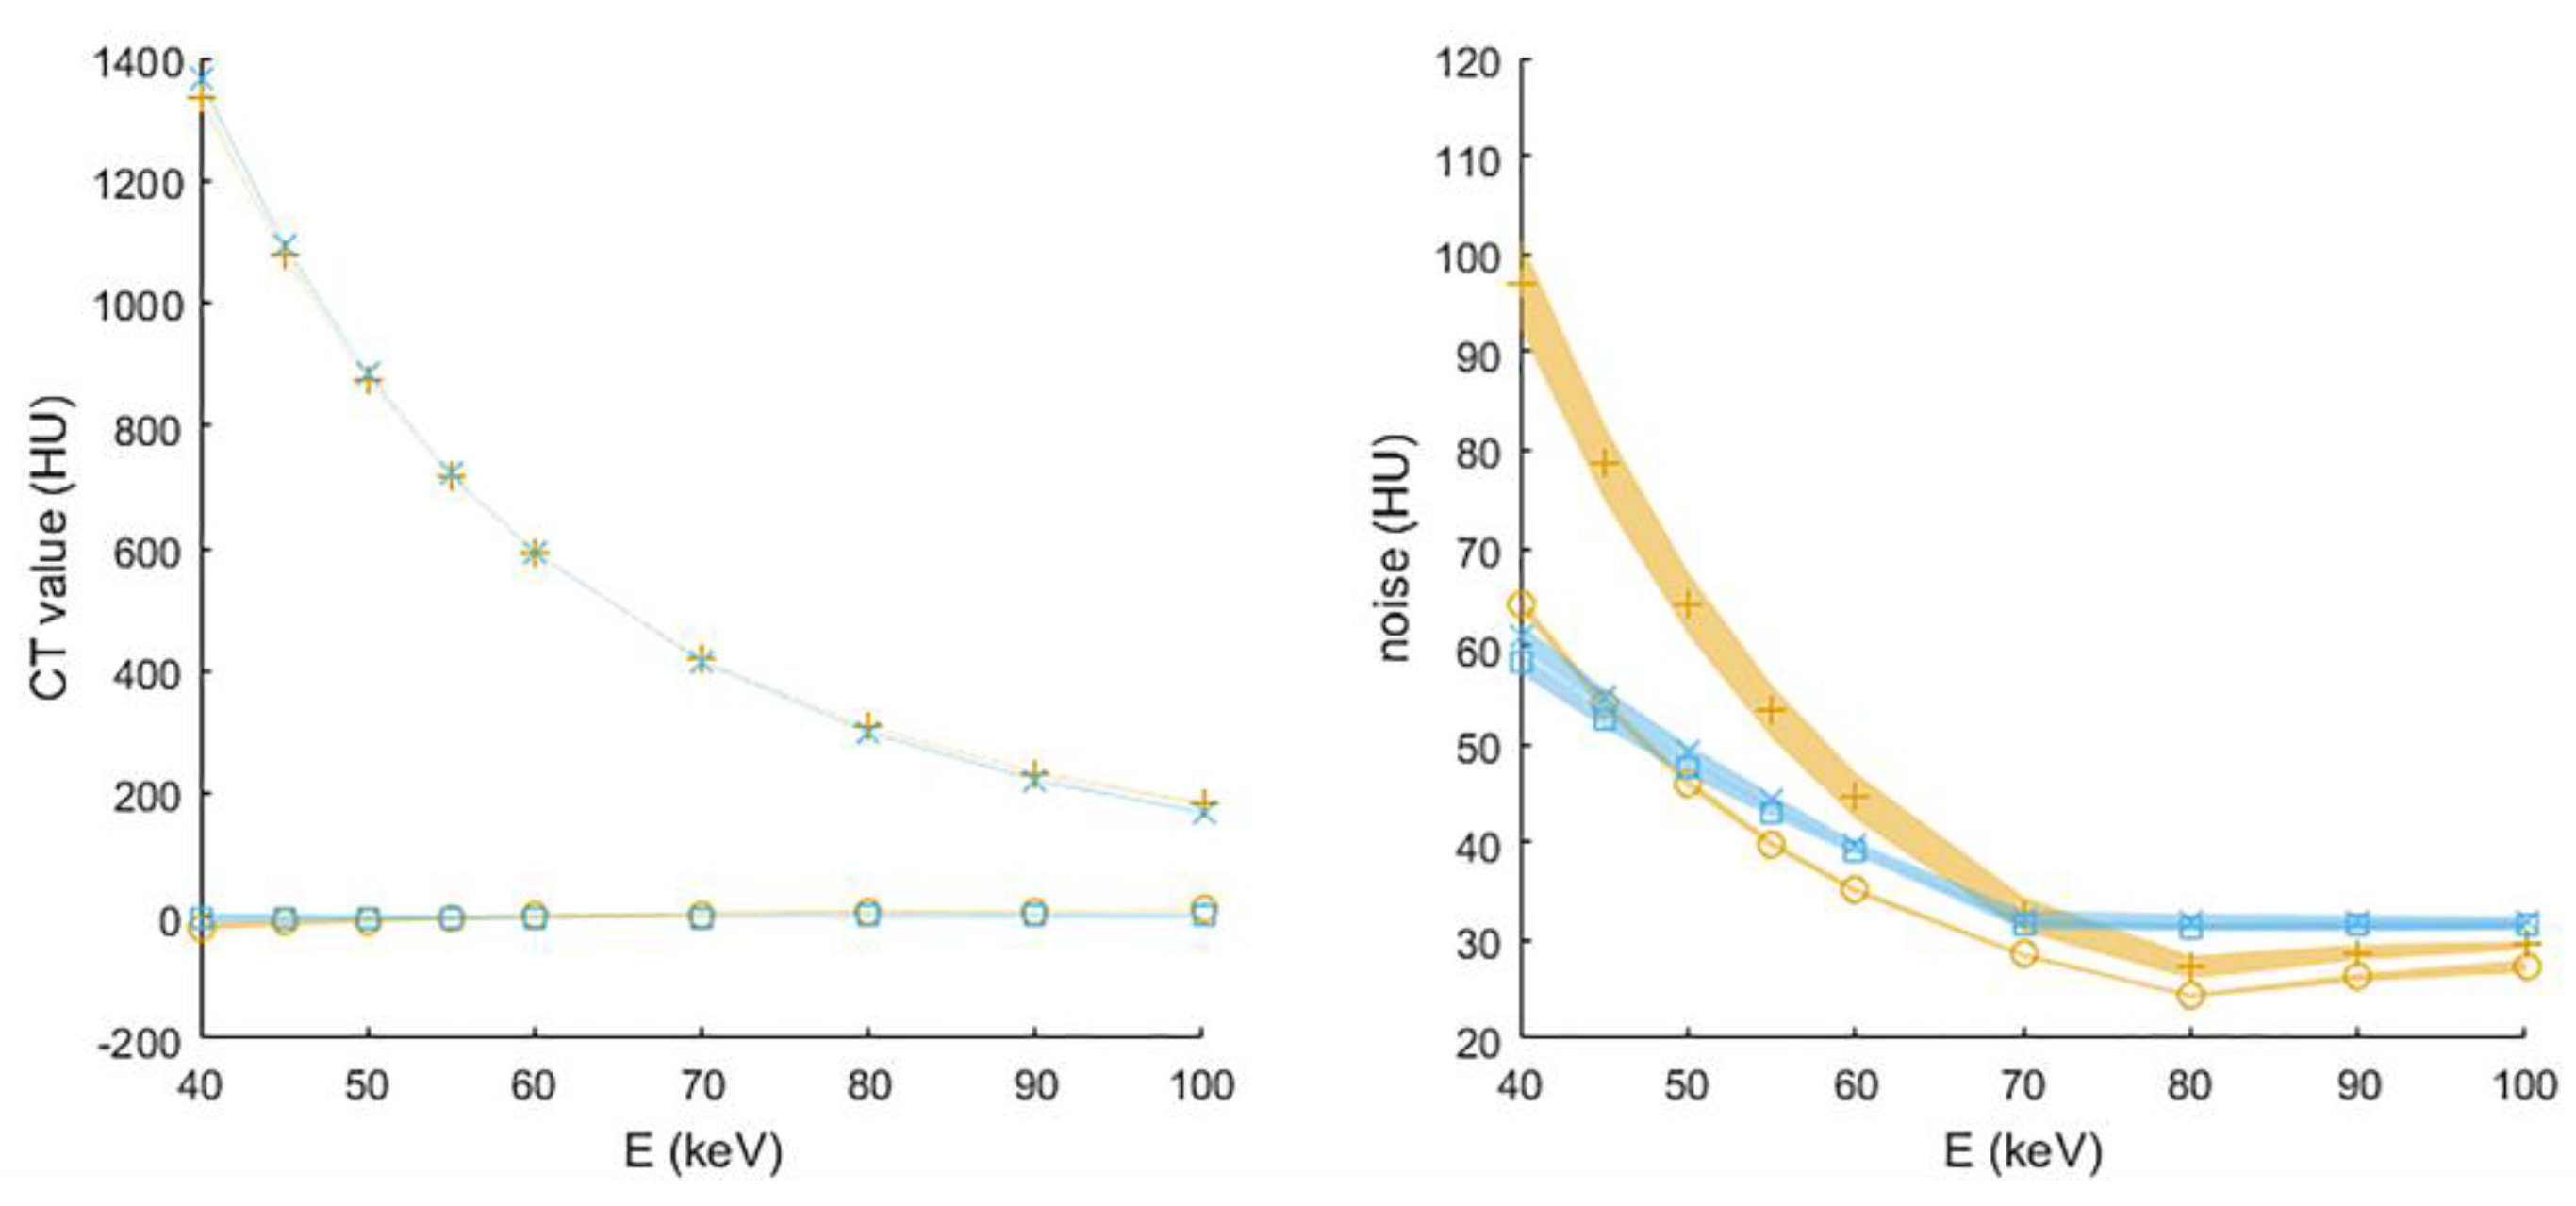
3.2. CT Values and Noise
4. Discussion
5. Conclusions
Author Contributions
Funding
Institutional Review Board Statement
Informed Consent Statement
Conflicts of Interest
Appendix A


References
- Boone, J.M.; McCollough, C.H. Computed tomography turns 50. Phys. Today 2021, 74, 34–40. [Google Scholar] [CrossRef]
- Booij, R.; Budde, R.P.J.; Dijkshoorn, M.L.; van Straten, M. Technological developments of X-ray computed tomography over half a century: User’s influence on protocol optimization. Eur. J. Radiol. 2020, 131, 109261. [Google Scholar] [CrossRef] [PubMed]
- Kyongtae, T.B. Intravenous Contrast Medium Administration and Scan Timing at CT: Considerations and Approaches. Radiology 2010, 256, 32–61. [Google Scholar] [CrossRef]
- Tang, K.; Wang, L.; Li, R.; Lin, J.; Zheng, X.; Cao, G. Effect of Low Tube Voltage on Image Quality, Radiation Dose, and Low-Contrast Detectability at Abdominal Multidetector CT: Phantom Study. J. Biomed. Biotechnol. 2012, 2012, 130169. [Google Scholar] [CrossRef]
- Grant, K.L.; Flohr, T.G.; Krauss, B.; Sedlmair, M.; Thomas, C.; Schmidt, B. Assessment of an Advanced Image-Based Technique to Calculate Virtual Monoenergetic Computed Tomographic Images from a Dual-Energy Examination to Improve Contrast-To-Noise Ratio in Examinations Using Iodinated Contrast Media. Investig. Radiol. 2014, 49, 586–592. [Google Scholar] [CrossRef]
- Yu, L.; Leng, S.; McCollough, C.H. Dual-energy CT-based monochromatic imaging. Am. J. Roentgenol. 2012, 199 (Suppl. 5), S9–S15. [Google Scholar] [CrossRef]
- McCollough, C.H.; Leng, S.; Yu, L.; Fletcher, J.G. Dual- and Multi-Energy CT: Principles, Technical Approaches, and Clinical Applications. Radiology 2015, 276, 637–653. [Google Scholar] [CrossRef]
- Willemink, M.J.; Persson, M.; Pourmorteza, A.; Pelc, N.J.; Fleischmann, D. Photon-counting CT: Technical Principles and Clinical Prospects. Radiology 2018, 289, 293–312. [Google Scholar] [CrossRef]
- Flohr, T.; Petersilka, M.; Henning, A.; Ulzheimer, S.; Ferda, J.; Schmidt, B. Photon-counting CT review. Phys. Med. 2020, 79, 26–136. [Google Scholar] [CrossRef]
- Muenzel, D.; Bar-Ness, D.; Roessl, E.; Blevis, I.; Bartels, M.; Fingerle, A.A.; Ruschke, S.; Coulon, P.; Daerr, H.; Kopp, F.K.; et al. Spectral Photon-counting CT: Initial Experience with Dual–Contrast Agent K-Edge Colonography. Radiology 2017, 283, 723–728. [Google Scholar] [CrossRef] [Green Version]
- Pourmorteza, A.; Symons, R.; Sandfort, V.; Mallek, M.; Fuld, M.K.; Henderson, G.; Jones, E.C.; Malayeri, A.A.; Folio, L.R.; Bluemke, D.A. Abdominal Imaging with Contrast-enhanced Photon-counting CT: First Human Experience. Radiology 2016, 279, 239–245. [Google Scholar] [CrossRef] [PubMed]
- Si-Mohamed, S.; Bar-Ness, D.; Sigovan, M.; Cormode, D.P.; Coulon, P.; Coche, E.; Vlassenbroek, A.; Normand, G.; Boussel, L.; Douek, P. Review of an initial experience with an experimental spectral photon-counting computed tomography system. Nucl. Instrum. Methods Phys. Res. Sect. A Accel. Spectrometers Detect. Assoc. Equip. 2017, 873, 27–35. [Google Scholar] [CrossRef]
- Symons, R.; Reich, D.S.; Bagheri, M.; Cork, T.E.; Krauss, B.; Ulzheimer, S.; Kappler, S.; Bluemke, D.A.; Pourmorteza, A. Photon-Counting Computed Tomography for Vascular Imaging of the Head and Neck: First In Vivo Human Results. Investig. Radiol. 2018, 53, 135–142. [Google Scholar] [CrossRef] [PubMed]
- Danielsson, M.; Persson, M.; Sjölin, M. Photon-counting x-ray detectors for CT. Phys. Med. Biol. 2021, 66, 3TR01. [Google Scholar] [CrossRef] [PubMed]
- Sawall, S.; Klein, L.; Wehrse, E.; Rotkopf, L.T.; Amato, C.; Maier, J.; Schlemmer, H.-P.; Ziener, C.H.; Heinze, S.; Kachelrieß, M. Threshold-dependent iodine imaging and spectral separation in a whole-body photon-counting CT system. Eur. Radiol. 2021, 31, 6631–6639. [Google Scholar] [CrossRef] [PubMed]
- Rajendran, K.; Petersilka, M.; Henning, A.; Shanblatt, E.R.; Schmidt, B.; Flohr, T.G.; Ferrero, A.; Baffour, F.; Diehn, F.E.; Lifeng, Y.; et al. First Clinical Photon-counting Detector CT System: Technical Evalua-tion. Radiology 2021, 303, 212579. [Google Scholar] [CrossRef]
- Euler, A.; Higashigaito, K.; Mergen, V.; Sartoretti, T.; Zanini, B.; Schmidt, B.; Flohr, T.G.; Ulzheimer, S.; Eberhard, M.; Alkadhi, H. High-Pitch Photon-Counting Detector Computed Tomography Angiography of the Aorta: Intraindividual Comparison to Energy-Integrating Detector Computed Tomography at Equal Radiation Dose. Invest. Radiol. 2022, 57, 115–121. [Google Scholar] [CrossRef]
- Higashigaito, K.; Euler, A.; Eberhard, M.; Flohr, T.G.; Schmidt, B.; Alkadhi, H. Contrast-Enhanced Abdominal CT with Clinical Photon-Counting Detector CT: Assessment of Image Quality and Comparison with Energy-Integrating Detector CT. Acad. Radiol. 2022, 29, 689–697. [Google Scholar] [CrossRef]
- Sartoretti, T.; Landsmann, A.; Nakhostin, D.; Eberhard, M.; Roeren, C.; Mergen, V.; Higashigaito, K.; Raupach, R.; Alkadhi, H.; Euler, A. Quantum Iterative Reconstruction for Abdominal Photon-counting Detector CT Improves Image Quality. Radiology 2022, 303, 339–348. [Google Scholar] [CrossRef]
- Sartoretti, T.; Racine, D.; Mergen, V.; Jungblut, L.; Monnin, P.; Flohr, T.G.; Martini, K.; Frauenfelder, T.; Alkadhi, H.; Euler, A. Quantum Iterative Reconstruction for Low-Dose Ultra-High-Resolution Photon-Counting Detector CT of the Lung. Diagnostics 2022, 12, 522. [Google Scholar] [CrossRef]
- McCollough, C.H.; Ulzheimer, S.; Halliburton, S.S.; Shanneik, K.; White, R.D.; Kalender, W.A. Coronary Artery Calcium: A Multi-institutional, Multimanufacturer International Standard for Quantification at Cardiac CT. Radiology 2007, 243, 527–538. [Google Scholar] [CrossRef] [PubMed]
- Rajendran, K.; Petersilka, M.; Henning, A.; Shanblatt, E.; Marsh, J.; Thorne, J.; Schmidt, B.; Flohr, T.; Fletcher, J.; McCollough, C.; et al. Full field-of-view, high-resolution, photon-counting detector CT: Technical assessment and initial patient experience. Phys. Med. Biol. 2021, 66, 205019. [Google Scholar] [CrossRef] [PubMed]
- Gutjahr, R.; Halaweish, A.F.; Yu, Z.; Leng, S.; Yu, L.; Li, Z.; Jorgensen, S.M.; Ritman, E.L.; Kappler, S.; McCollough, C.H. Human Imaging with Photon Counting-Based Computed Tomography at Clinical Dose Levels: Contrast-to-Noise Ratio and Cadaver Studies. Invest. Radiol. 2016, 51, 421–429. [Google Scholar] [CrossRef] [PubMed] [Green Version]
- Leng, S.; Zhou, W.; Yu, Z.; Halaweish, A.; Krauss, B.; Schmidt, B.; Yu, L.; Kappler, S.; McCollough, C. Spectral performance of a whole-body research photon counting detector CT: Quantitative accuracy in derived image sets. Phys. Med. Biol. 2017, 62, 7216–7232. [Google Scholar] [CrossRef] [Green Version]
- Bette, S.; Decker, J.A.; Braun, F.M.; Becker, J.; Haerting, M.; Haeckel, T.; Gebhard, M.; Risch, F.; Woźnicki, P.; Scheurig-Muenkler, C.; et al. Optimal Conspicuity of Liver Metastases in Virtual Monochromatic Imaging Reconstructions on a Novel Photon-Counting Detector CT—Effect of keV Settings and BMI. Diagnostics 2022, 12, 1231. [Google Scholar] [CrossRef]


| Scanner Name/Software Version | SOMATOM Force/Syngo CT VB10 | NAEOTOM Alpha/Syngo VA40A_2.01 |
|---|---|---|
| Detector type | energy integrating | photon counting |
| Scan mode | dual-source, helical | single-source, helical |
| Tube voltages (kVp) | 80/Sn150 (thorax); 90/Sn150 (abdomen) | 90 and 120 (both thorax and abdomen) |
| CTDIvol32 S/M/L thorax (mGy) * | 2.2/3.7/6.9 | 2.2/3.7/6.9 |
| CTDIvol32 S/M/L abdomen (mGy) * | 3.4/5.4/8.1 | 3.4/5.4/8.1 |
| Collimation (mm) | 96 × 0.6 = 57.4 | 144 × 0.4 = 57.4 |
| Pitch | 0.8 | 0.8 |
| Rotation time (s) | 0.5 | 0.5 |
| Image reconstruction kernel | Qr40 | Qr40 |
| Reconstruction technique ** | ADMIRE strength 3 (60%); WFBP | QIR strength 2 (50%) and 3 (75%); QIR-off |
| VMI energy levels (keV) *** | 40, 45, 50, 55, 60,70, 80, 90, 100 | 40, 45, 50, 55, 60,70, 80, 90, 100 |
| Slice thickness/increment (mm) | 1.0/1.0 | 1.0/1.0 |
| Field-of-view (mm) | 110 | 110 |
| Reconstruction matrix size | 512 × 512 | 512 × 512 |
| CT System | |||
|---|---|---|---|
| Phantom Type and Size | EID | PCD at 120 kVp | PCD at 90 kVp |
| Thorax small | 25.2 ± 0.7 | 29.6 ± 0.6 | 32.4 ± 0.7 |
| Thorax medium | 21.3 ± 0.9 | 26.8 ± 0.5 | 28.8 ± 0.1 |
| Thorax large | 20.0 ± 0.5 | 24.8 ± 0.5 | 27.2 ± 0.3 |
| Abdomen small | 18.3 ± 0.2 | 23.9 ± 0.1 | 31.7 ± 0.6 |
| Abdomen medium | 16.5 ± 0.6 | 22.9 ± 0.3 | 25.5 ± 0.7 |
| Abdomen large | 14.4 ± 0.2 | 21.9 ± 0.5 | 22.6 ± 1.1 |
Publisher’s Note: MDPI stays neutral with regard to jurisdictional claims in published maps and institutional affiliations. |
© 2022 by the authors. Licensee MDPI, Basel, Switzerland. This article is an open access article distributed under the terms and conditions of the Creative Commons Attribution (CC BY) license (https://creativecommons.org/licenses/by/4.0/).
Share and Cite
Booij, R.; van der Werf, N.R.; Dijkshoorn, M.L.; van der Lugt, A.; van Straten, M. Assessment of Iodine Contrast-To-Noise Ratio in Virtual Monoenergetic Images Reconstructed from Dual-Source Energy-Integrating CT and Photon-Counting CT Data. Diagnostics 2022, 12, 1467. https://doi.org/10.3390/diagnostics12061467
Booij R, van der Werf NR, Dijkshoorn ML, van der Lugt A, van Straten M. Assessment of Iodine Contrast-To-Noise Ratio in Virtual Monoenergetic Images Reconstructed from Dual-Source Energy-Integrating CT and Photon-Counting CT Data. Diagnostics. 2022; 12(6):1467. https://doi.org/10.3390/diagnostics12061467
Chicago/Turabian StyleBooij, Ronald, Niels R. van der Werf, Marcel L. Dijkshoorn, Aad van der Lugt, and Marcel van Straten. 2022. "Assessment of Iodine Contrast-To-Noise Ratio in Virtual Monoenergetic Images Reconstructed from Dual-Source Energy-Integrating CT and Photon-Counting CT Data" Diagnostics 12, no. 6: 1467. https://doi.org/10.3390/diagnostics12061467