
Urine Proteome in Distinguishing Hepatic Steatosis in Patients with Metabolic-Associated Fatty Liver Disease


 and
and 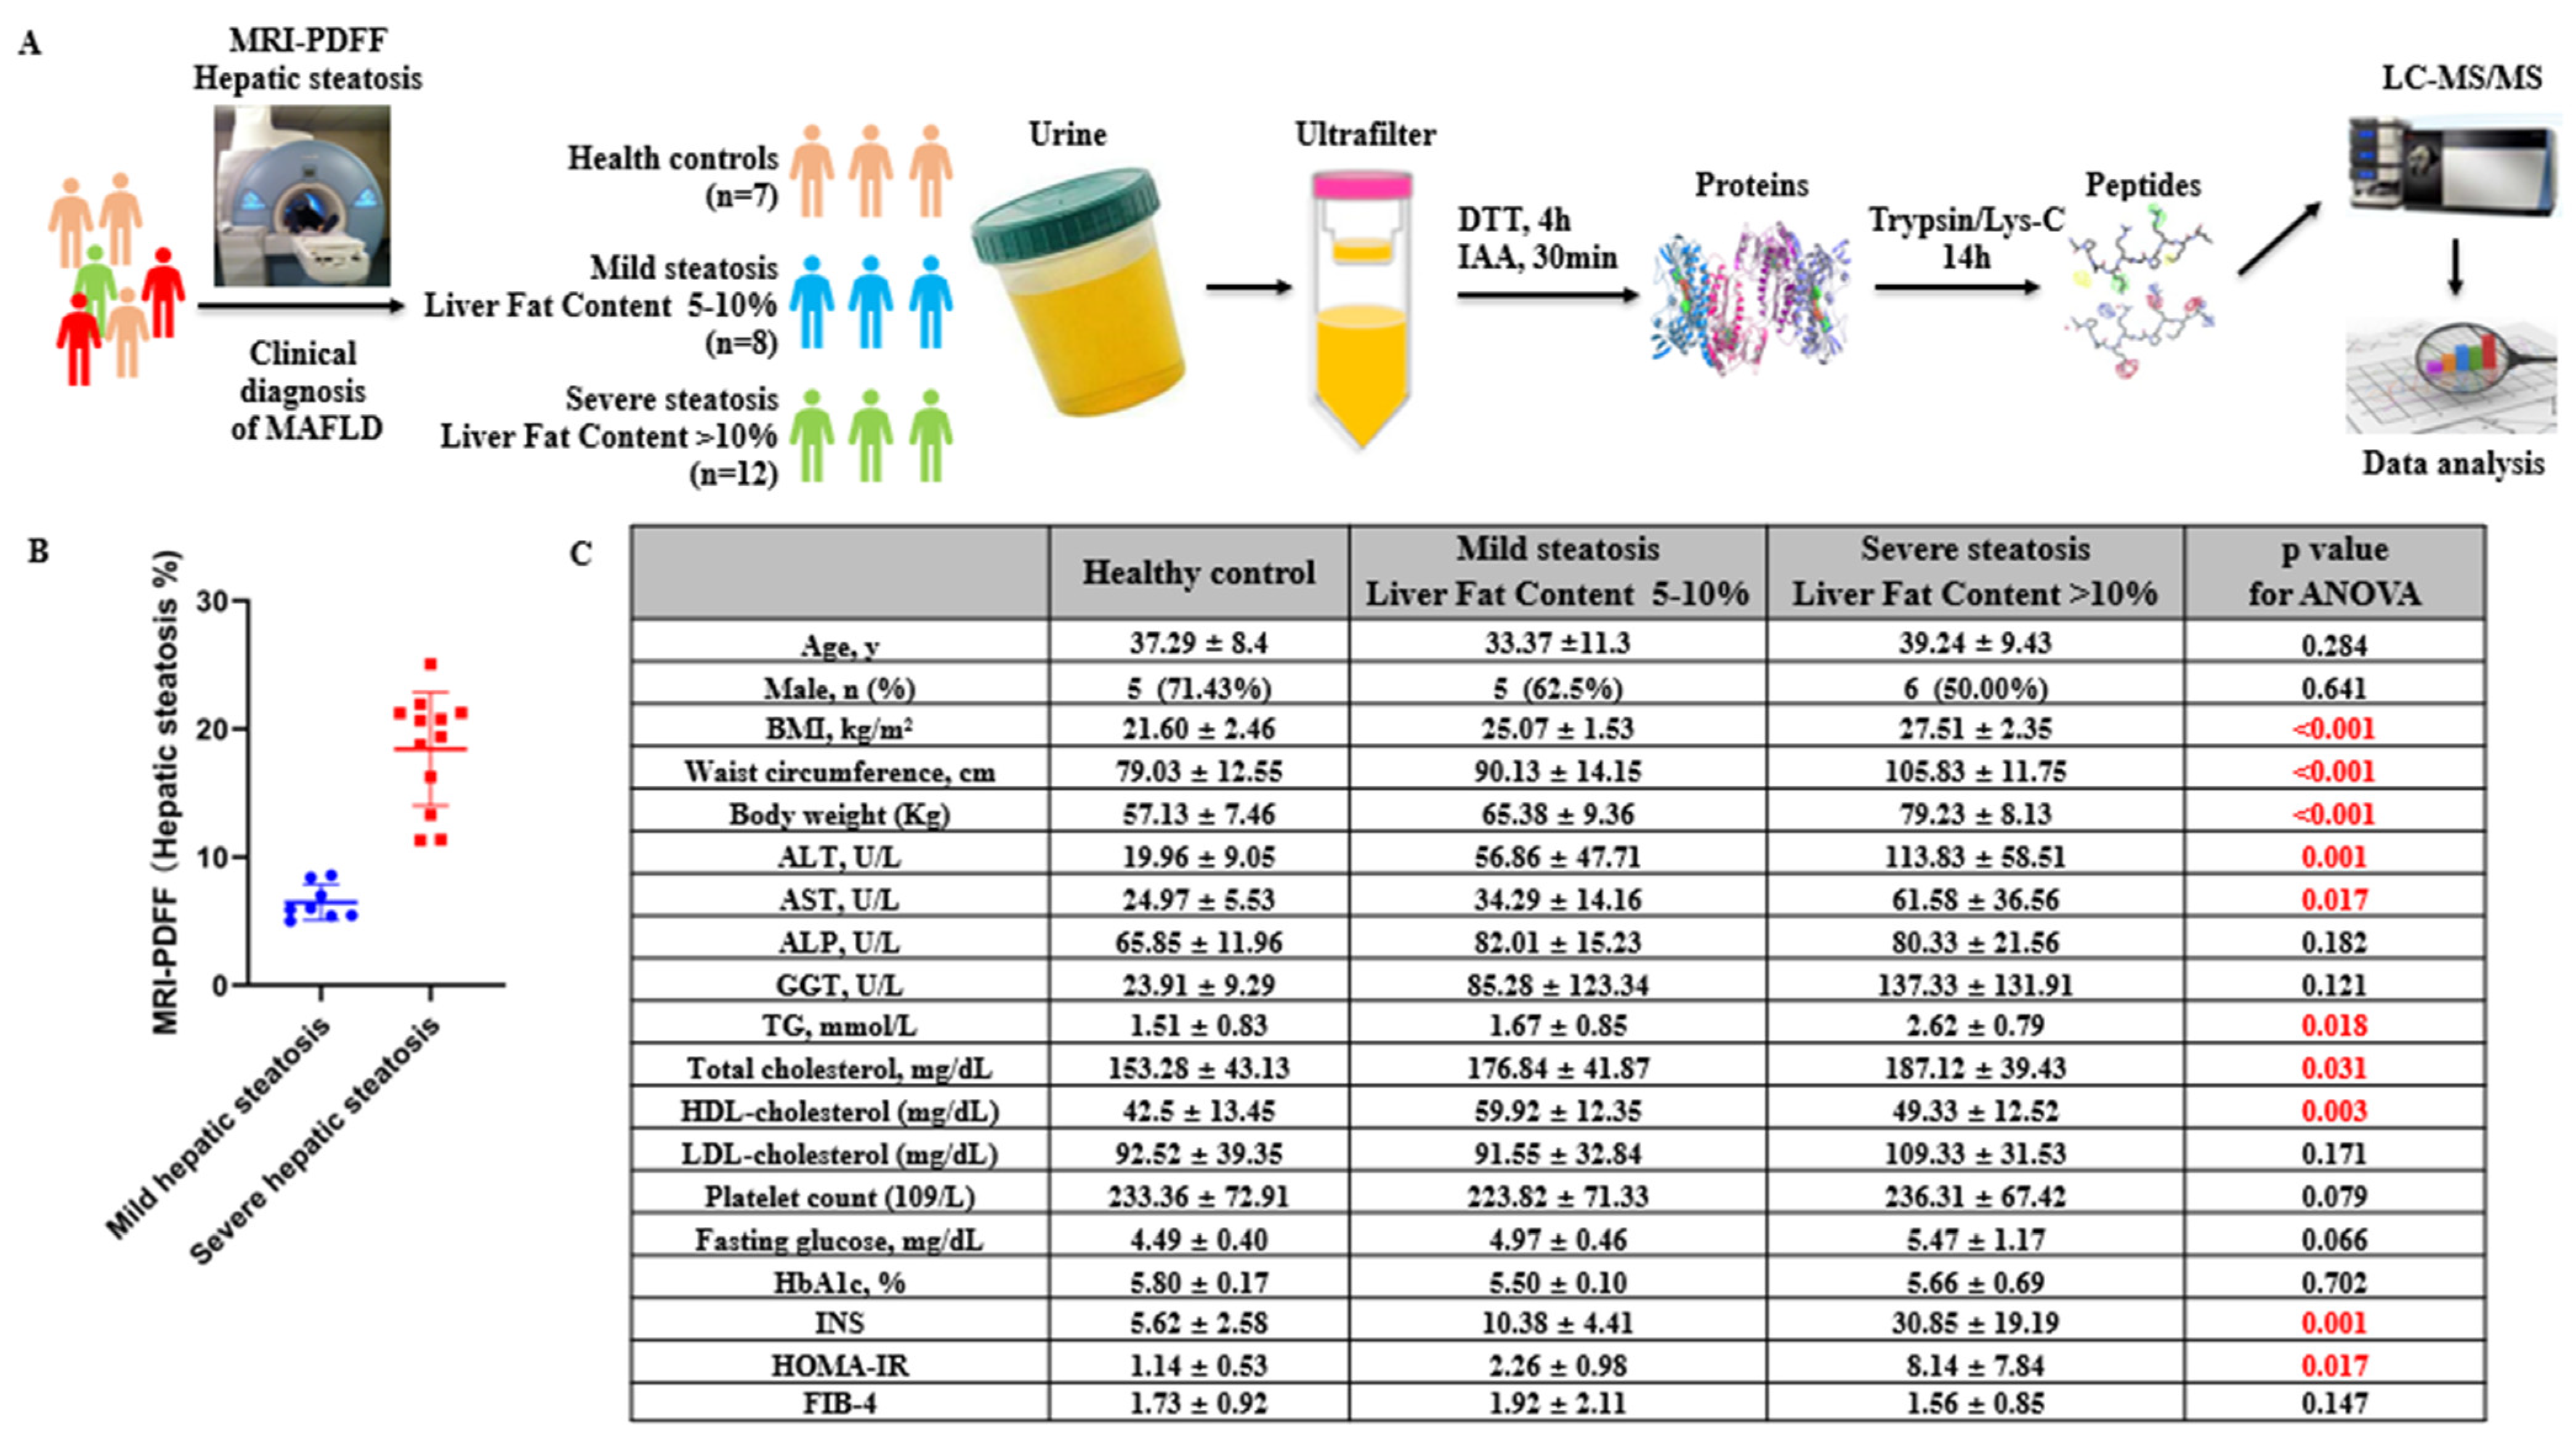
Abstract
:1. Introduction
2. Method
2.1. Patients and Urine Sample Collection
2.2. MRI-PDFF-Measured Liver Fat Content
2.3. Controlled Attenuation Parameter (CAP) and Liver Stiffness Measurements (LSM)
2.4. Proteomics Sample Preparation and LC–MS/MS Analysis
2.5. Western Blot and ELISA
2.6. Statistics
3. Results
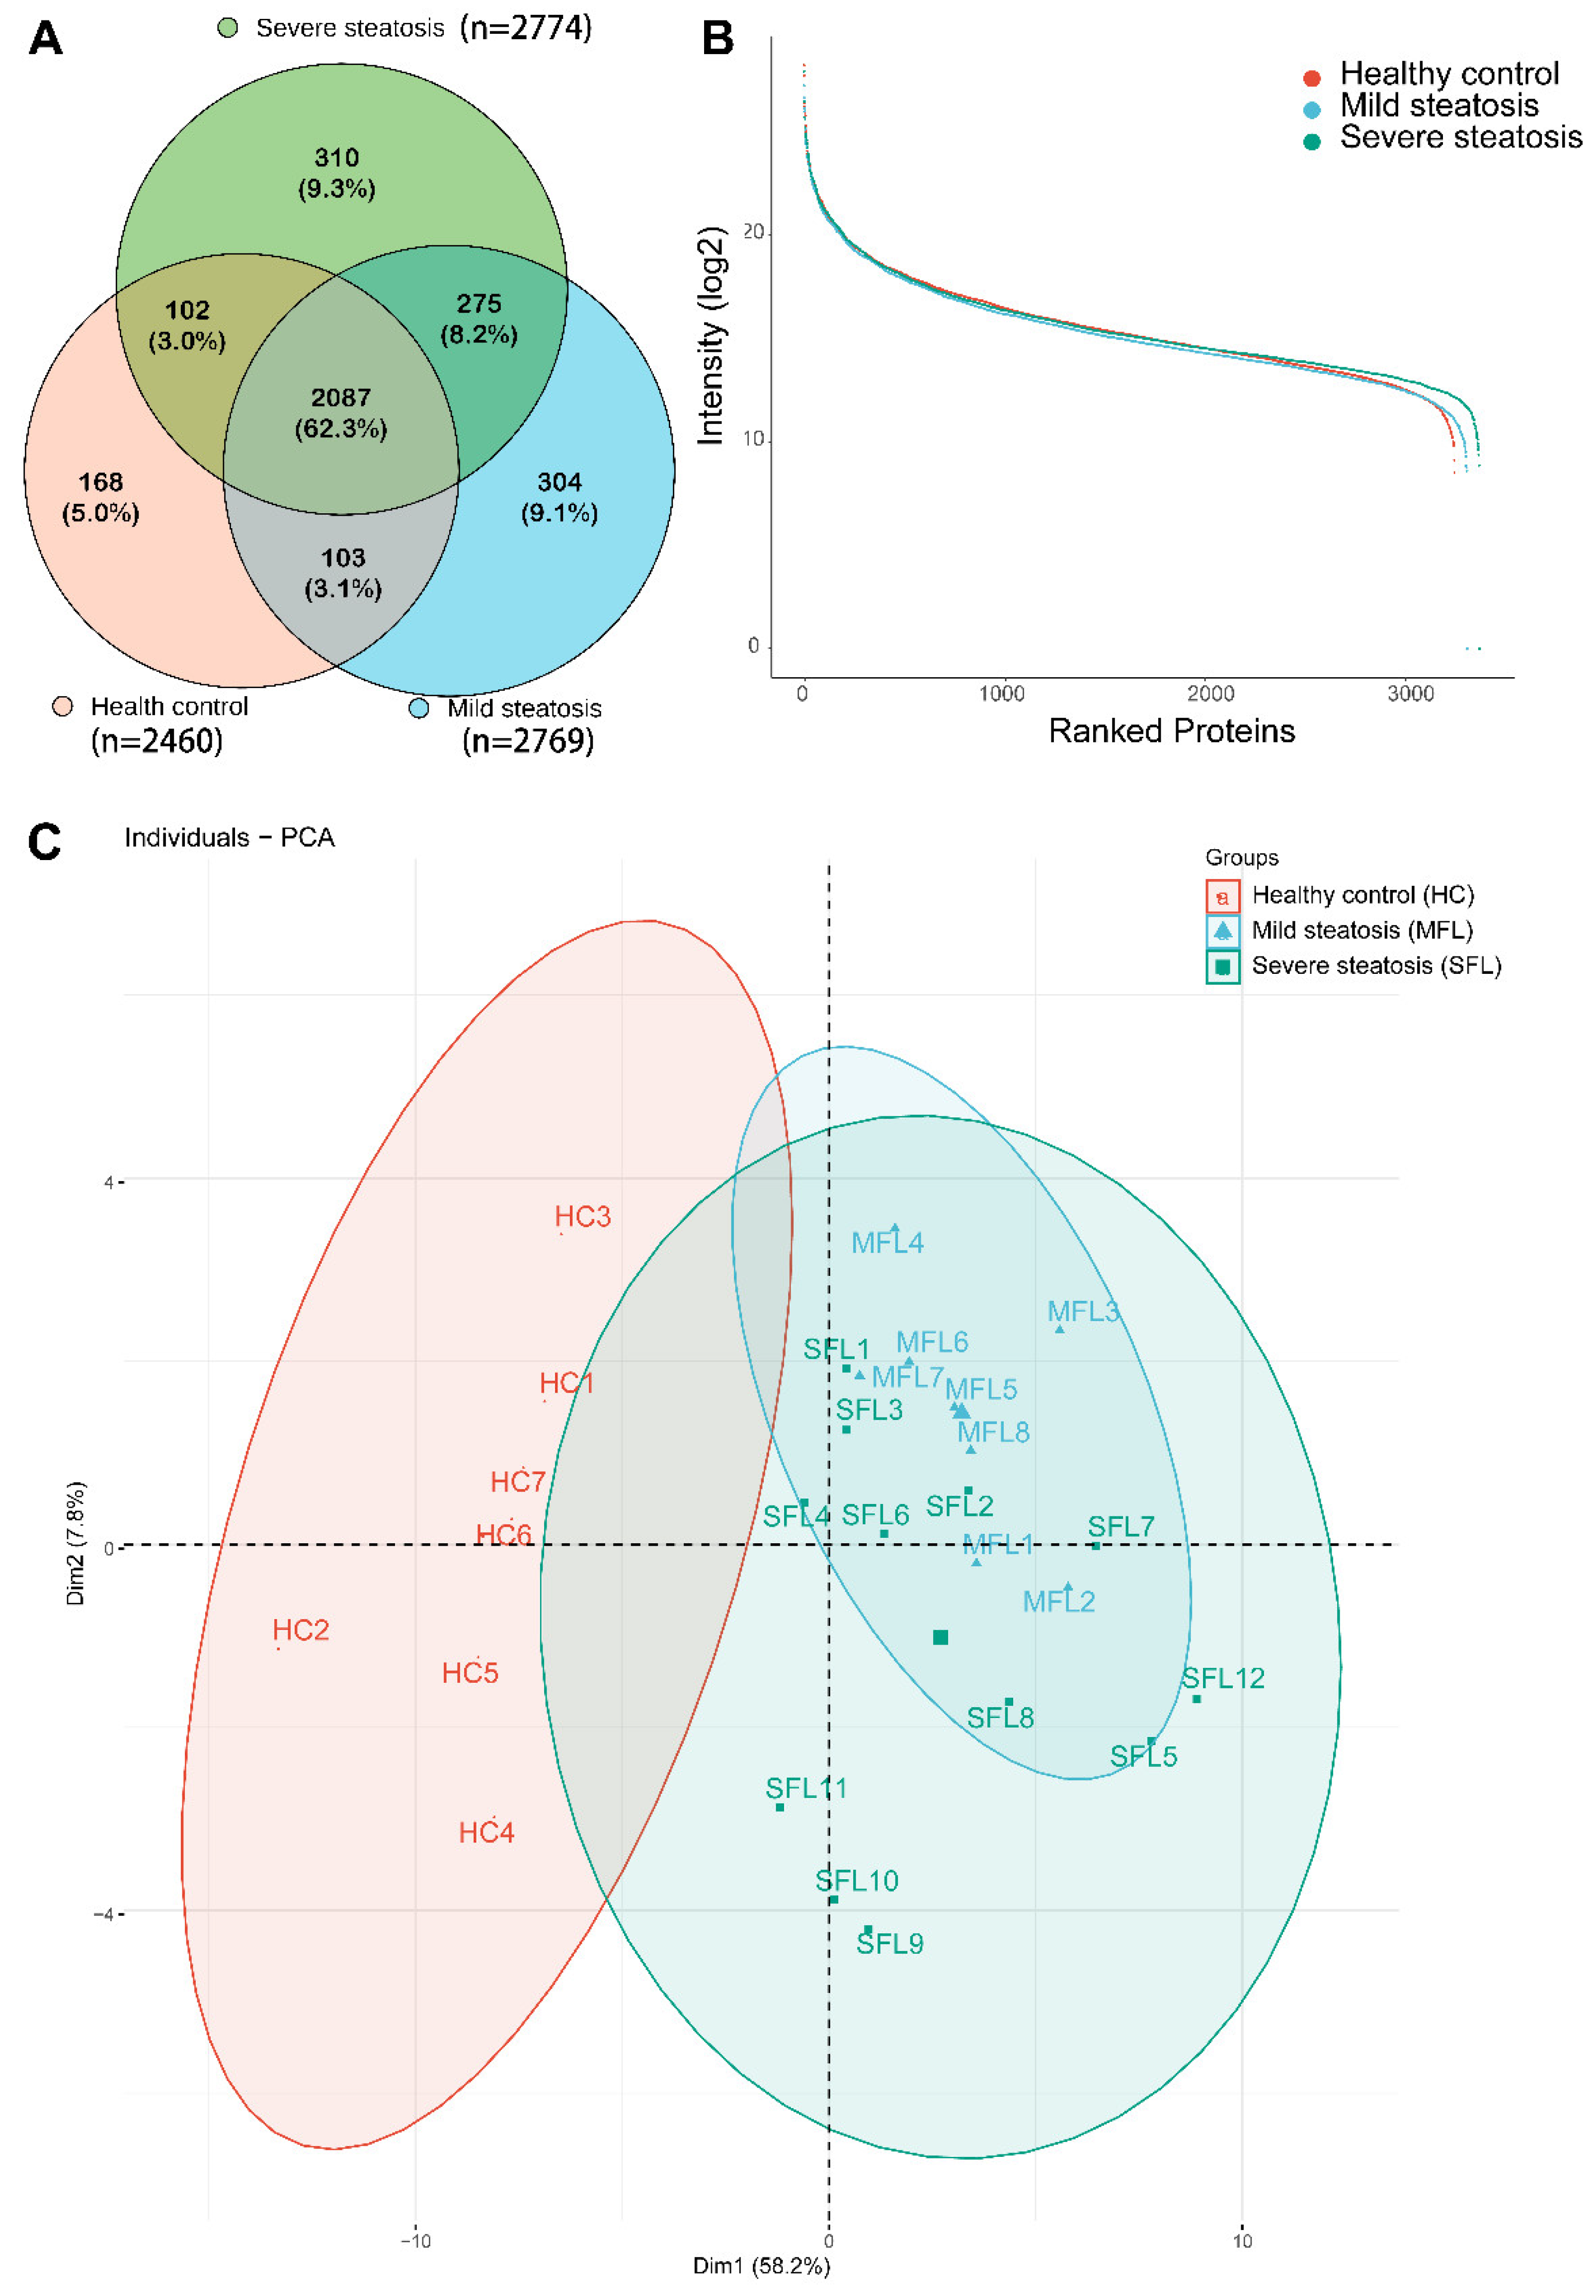
3.1. Characterization of Urine Proteomes in Healthy Controls and Patients with MAFLD
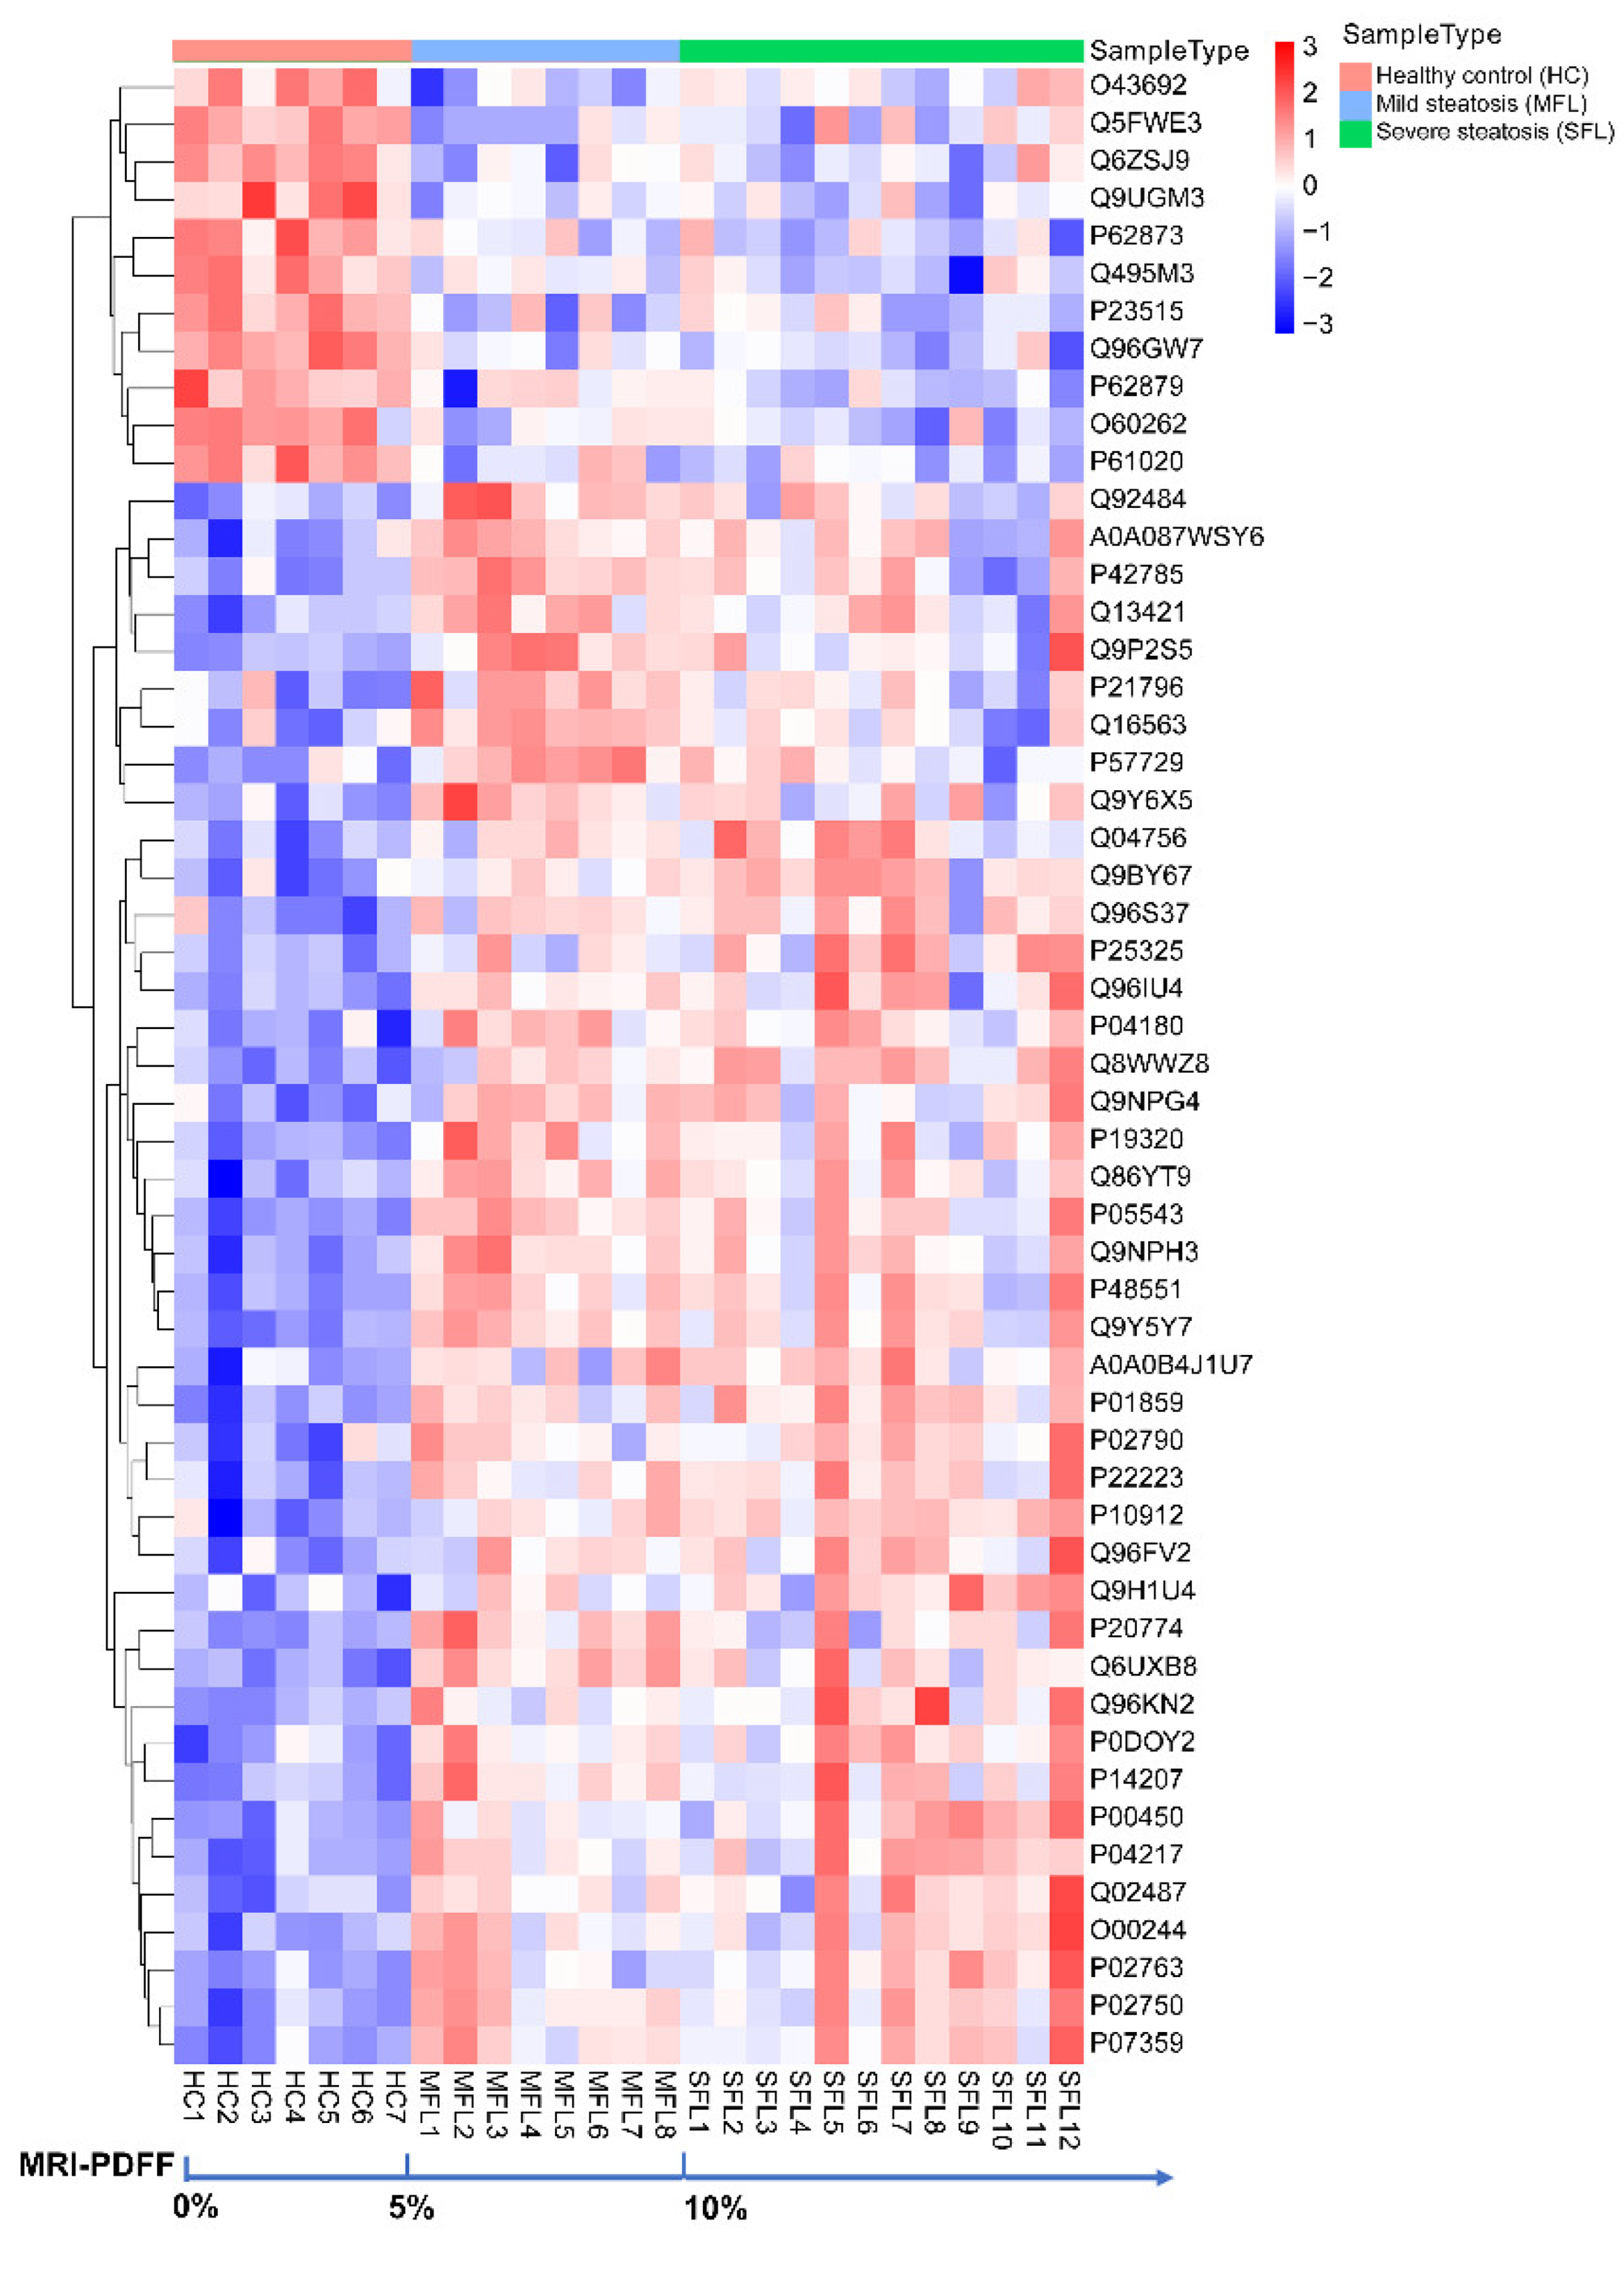
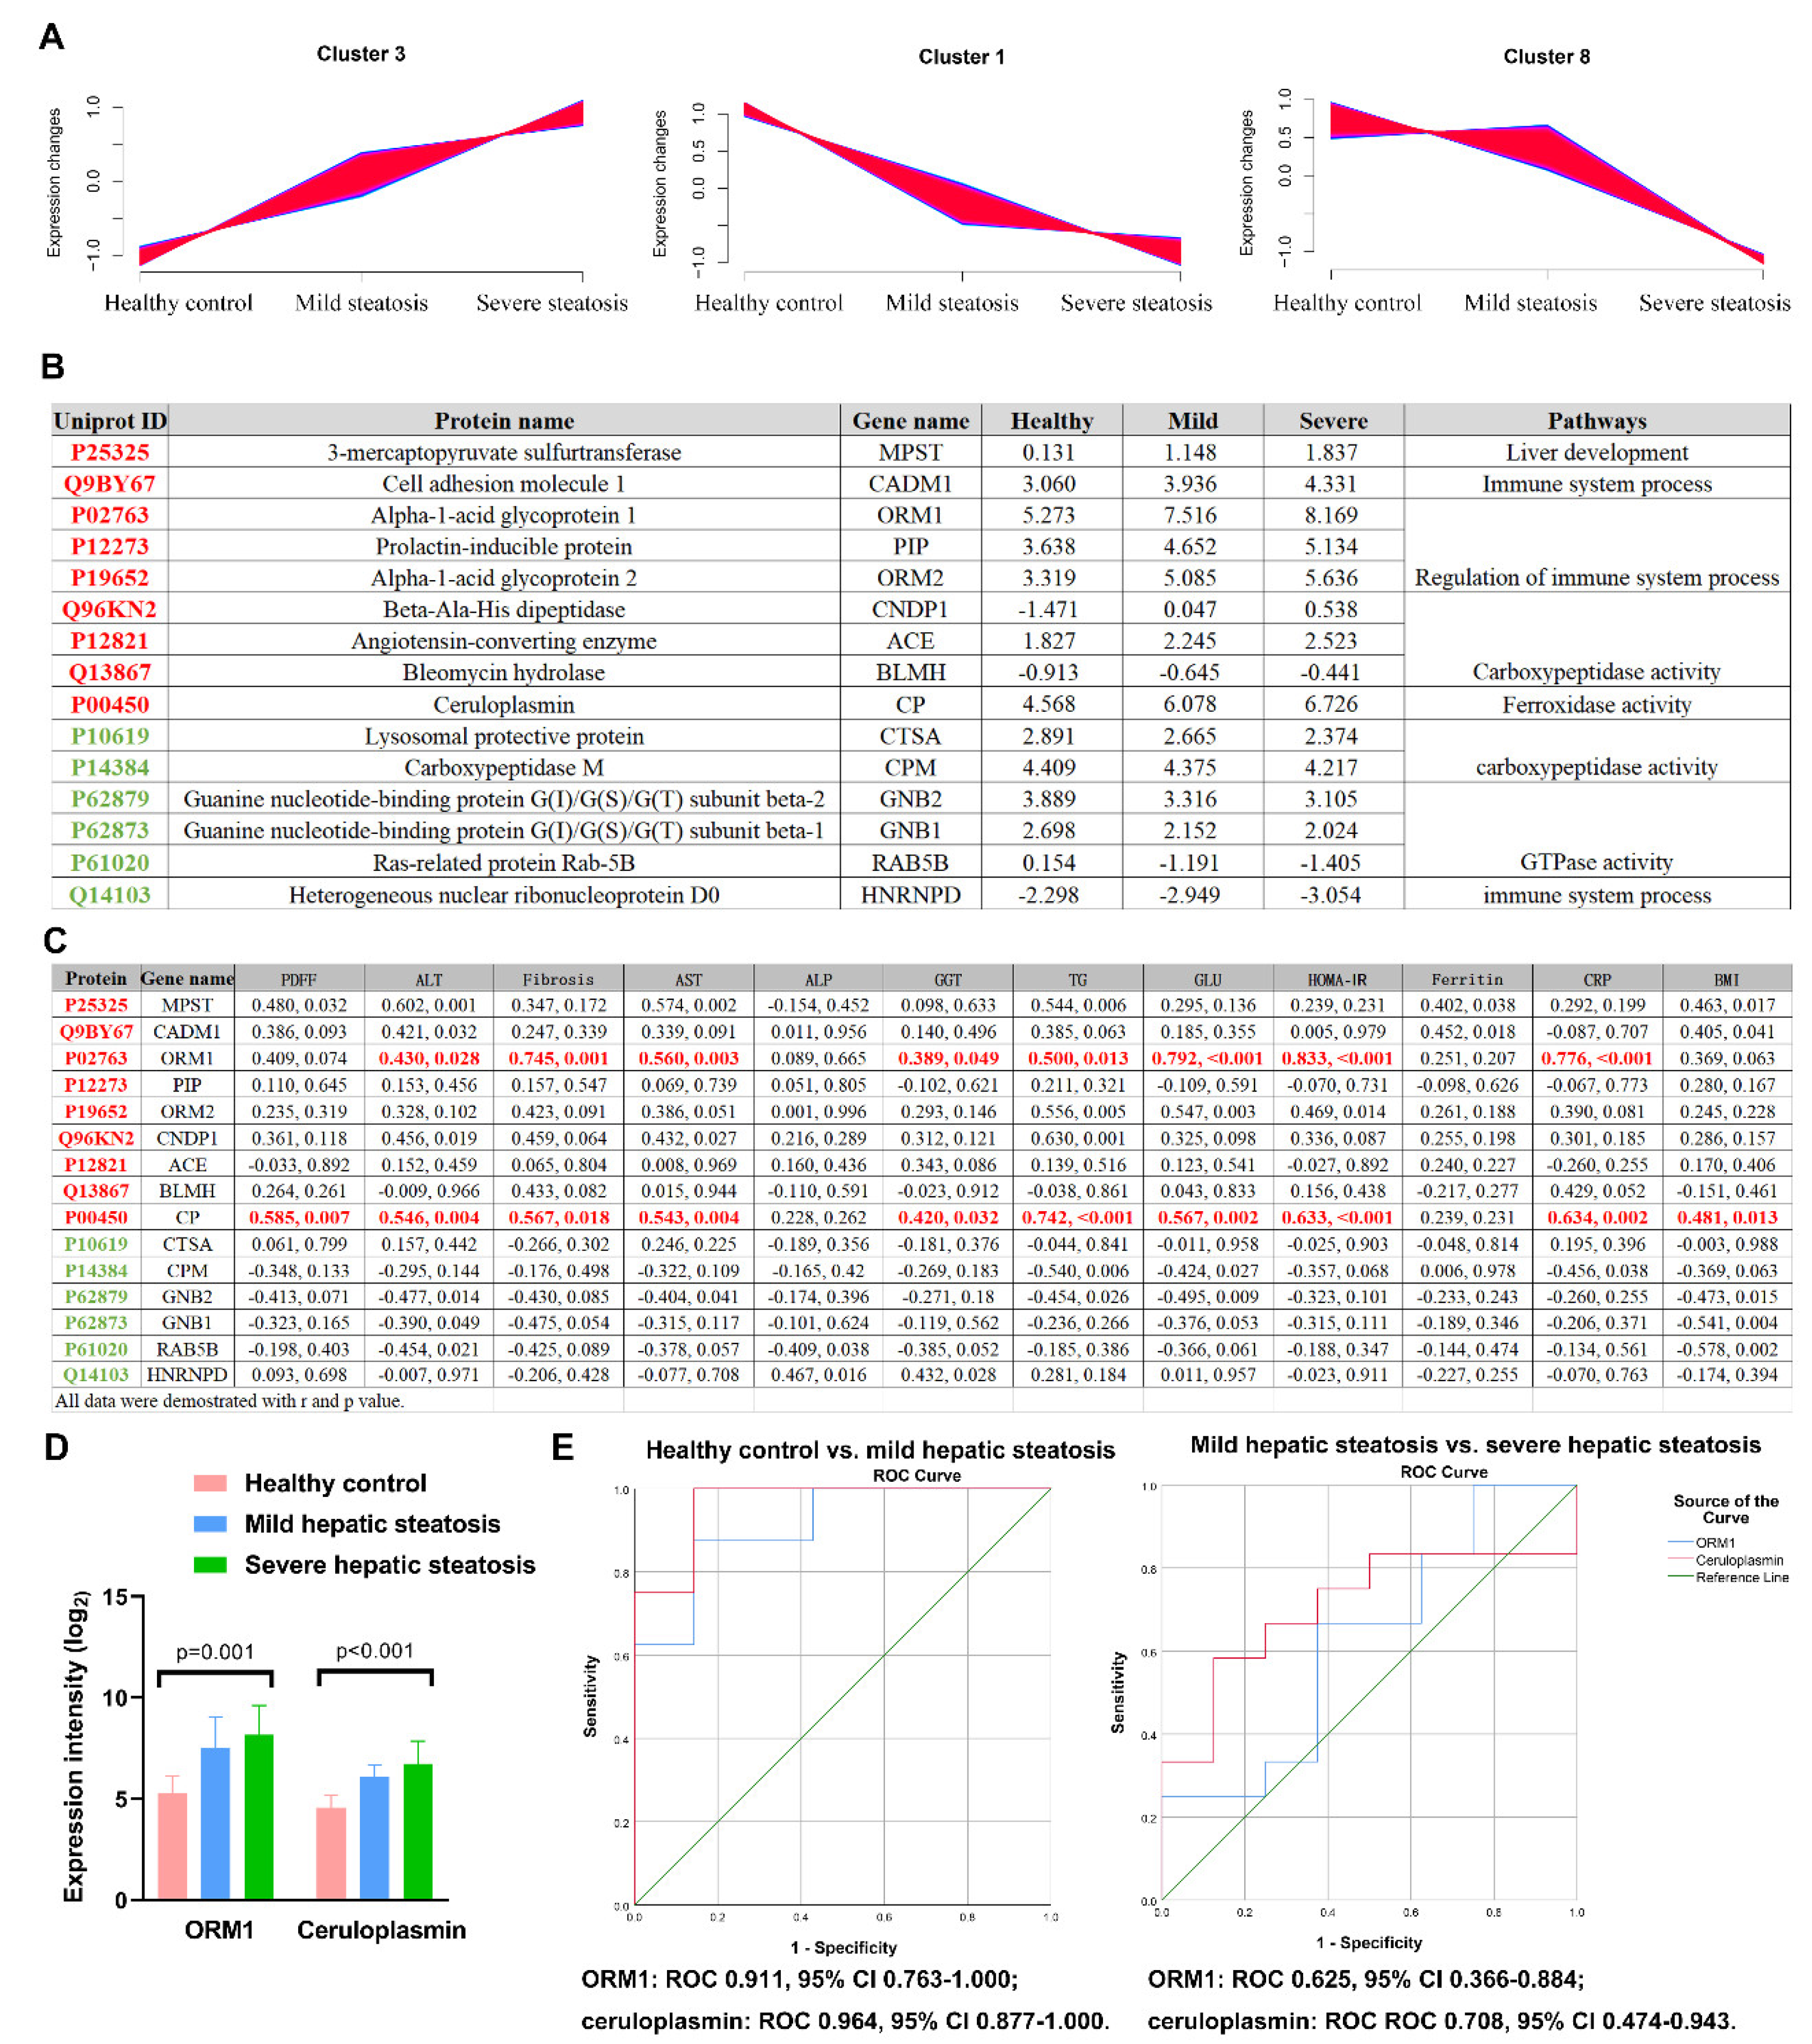
3.2. Urine Proteomics Differentiates Mild/Severe Hepatic Steatosis of MAFLD Patients from Healthy Controls
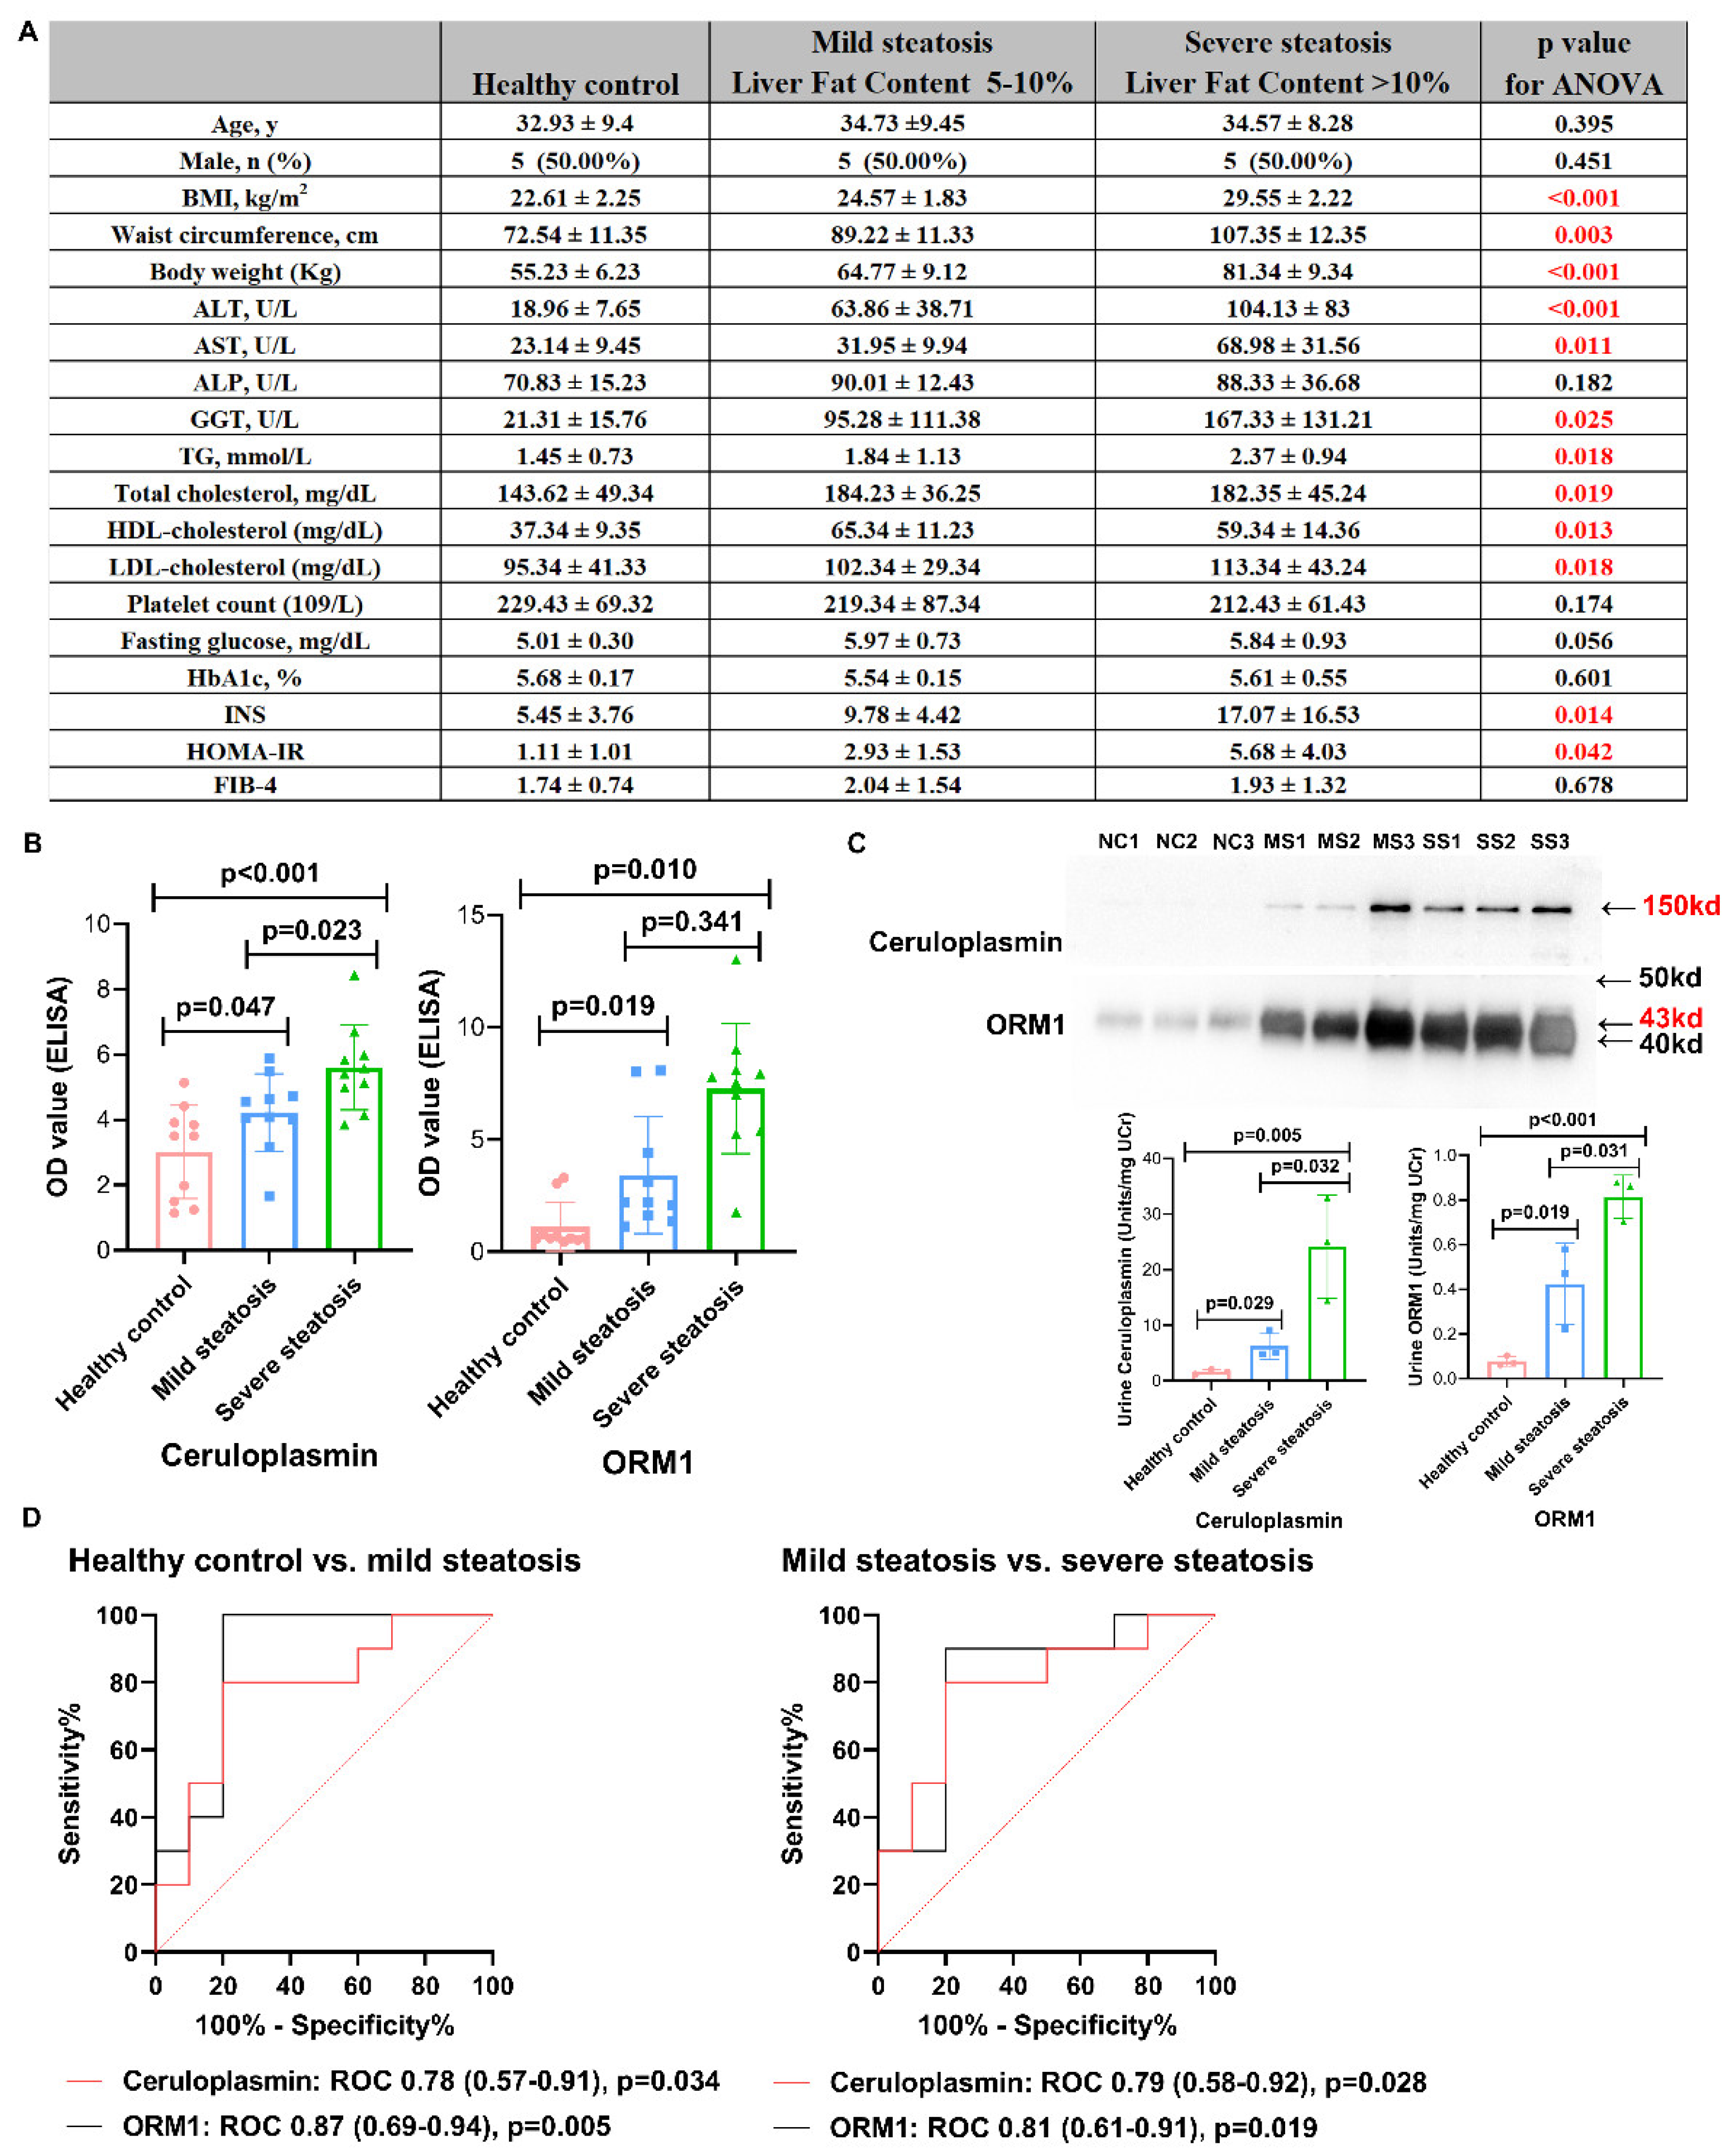
3.3. Validation by Western Blot and ELISA
4. Discussion
Supplementary Materials
Author Contributions
Funding
Institutional Review Board Statement
Informed Consent Statement
Data Availability Statement
Acknowledgments
Conflicts of Interest
References
- Younossi, Z.M.; Corey, K.E.; Lim, J.K. AGA Clinical Practice Update on Lifestyle Modification Using Diet and Exercise to Achieve Weight Loss in the Management of Nonalcoholic Fatty Liver Disease: Expert Review. Gastroenterology 2021, 160, 912–918. [Google Scholar] [CrossRef]
- Petroni, M.L.; Brodosi, L.; Bugianesi, E.; Marchesini, G. Management of non-alcoholic fatty liver disease. BMJ 2021, 372, m4747. [Google Scholar] [CrossRef] [PubMed]
- Sheka, A.C.; Adeyi, O.; Thompson, J.; Hameed, B.; Crawford, P.A.; Ikramuddin, S. Nonalcoholic Steatohepatitis: A Review. JAMA 2020, 323, 1175–1183. [Google Scholar] [CrossRef]
- Zhou, J.; Zhou, F.; Wang, W.; Zhang, X.-J.; Ji, Y.-X.; Zhang, P.; She, Z.G.; Zhu, L.; Cai, J.; Li, H. Epidemiological Features of NAFLD from 1999 to 2018 in China. Hepatology 2020, 71, 1851–1864. [Google Scholar] [CrossRef] [PubMed]
- Estes, C.; Anstee, Q.M.; Arias-Loste, M.T.; Bantel, H.; Bellentani, S.; Caballeria, J.; Colombo, M.; Craxi, A.; Crespo, J.; Day, C.P.; et al. Modeling NAFLD disease burden in China, France, Germany, Italy, Japan, Spain, United Kingdom, and United States for the period 2016–2030. J. Hepatol. 2018, 69, 896–904. [Google Scholar] [CrossRef]
- Younossi, Z.M.; Rinella, M.E.; Sanyal, A.J.; Harrison, S.A.; Brunt, E.M.; Goodman, Z.; Cohen, D.E.; Loomba, R. From NAFLD to MAFLD: Implications of a Premature Change in Terminology. Hepatology 2020, 73, 1194–1198. [Google Scholar] [CrossRef]
- Eslam, M.; Sanyal, A.J.; George, J.; on behalf of theInternational Consensus Panel. MAFLD: A Consensus-Driven Proposed Nomenclature for Metabolic Associated Fatty Liver Disease. Gastroenterology 2020, 158, 1999–2014.e1991. [Google Scholar] [CrossRef] [PubMed]
- Fabbrini, E.; Magkos, F.; Mohammed, B.S.; Pietka, T.; Abumrad, N.A.; Patterson, B.W.; Okunade, A.; Klein, S. Intrahepatic fat, not visceral fat, is linked with metabolic complications of obesity. Proc. Natl. Acad. Sci. USA 2009, 106, 15430–15435. [Google Scholar] [CrossRef] [PubMed] [Green Version]
- Targher, G.; Byrne, C.D. Clinical Review: Nonalcoholic fatty liver disease: A novel cardiometabolic risk factor for type 2 diabetes and its complications. J. Clin. Endocrinol. Metab. 2013, 98, 483–495. [Google Scholar] [CrossRef] [Green Version]
- Lonardo, A.; Sookoian, S.; Pirola, C.J.; Targher, G. Non-alcoholic fatty liver disease and risk of cardiovascular disease. Metabolism 2015, 65, 1136–1150. [Google Scholar] [CrossRef] [PubMed]
- Pietzner, M.; Budde, K.; Homuth, G.; Kastenmüller, G.; Henning, A.-K.; Artati, A.; Krumsiek, J.; Völzke, H.; Adamski, J.; Lerch, M.M.; et al. Hepatic Steatosis Is Associated with Adverse Molecular Signatures in Subjects without Diabetes. J. Clin. Endocrinol. Metab. 2018, 103, 3856–3868. [Google Scholar] [CrossRef] [PubMed] [Green Version]
- Arefhosseini, S.; Pouretedal, Z.; Tutunchi, H.; Ebrahimi-Mameghani, M. Serum copper, ceruloplasmin, and their relations to metabolic factors in nonalcoholic fatty liver disease: A cross-sectional study. Eur. J. Gastroenterol. Hepatol. 2021, 34, 443–448. [Google Scholar] [CrossRef] [PubMed]
- Tarantino, G.; Finelli, C.; Gioa, S.; Citro, V.; La Sala, N.; Gentile, M. Serum levels of Lp(a) are related to waist circumference in NAFLD patients with low prevalence of co-morbidities. Scand. J. Clin. Lab. Investig. 2016, 76, 544–552. [Google Scholar] [CrossRef]
- Ber, T.I.; Ilan, Y. Biomarkers for Nonalcoholic Steatohepatitis. Gastroenterology 2018, 154, 1546. [Google Scholar] [CrossRef] [PubMed] [Green Version]
- Caussy, C.; Reeder, S.B.; Sirlin, C.B.; Loomba, R. Noninvasive, Quantitative Assessment of Liver Fat by MRI-PDFF as an Endpoint in NASH Trials. Hepatology 2018, 68, 763–772. [Google Scholar] [CrossRef] [Green Version]
- Vilar-Gomez, E.; Calzadilla-Bertot, L.; Wong, V.W.-S.; Castellanos, M.; La Fuente, R.A.-D.; Metwally, M.; Eslam, M.; Gonzalez-Fabian, L.; Sanz, M.A.-Q.; Conde-Martín, A.F.; et al. Fibrosis Severity as a Determinant of Cause-Specific Mortality in Patients with Advanced Nonalcoholic Fatty Liver Disease: A Multi-National Cohort Study. Gastroenterology 2018, 155, 443–457.e417. [Google Scholar] [CrossRef]
- Ampuero, J.; Aller, R.; Gallego-Durán, R.; Crespo, J.; Calleja, J.L.; García-Monzón, C.; Gómez-Camarero, J.; Caballería, J.; Iacono, O.L.; Ibáñez-Samaniego, L.; et al. Significant fibrosis predicts new-onset diabetes mellitus and arterial hypertension in patients with NASH. J. Hepatol. 2020, 73, 17–25. [Google Scholar] [CrossRef] [PubMed]
- Wang, X.; He, Y.; Mackowiak, B.; Gao, B. MicroRNAs as regulators, biomarkers and therapeutic targets in liver diseases. Gut 2020, 70, 784–795. [Google Scholar] [CrossRef]
- Liu, C.-H.; Ampuero, J.; Gil-Gomez, A.; Montero-Vallejo, R.; Muñoz-Hernández, R.; Gallego-Durán, R.; Romero-Gómez, M. miRNAs in patients with non-alcoholic fatty liver disease: A systematic review and meta-analysis. J. Hepatol. 2018, 69, 1335–1348. [Google Scholar] [CrossRef]
- Liu, C.; Ampuero, J.; Pavlides, M.; Wong, V.W.; Fan, J.; Bai, L.; Li, H.; Wu, D.; Zhou, L.; Du, L.; et al. Simple non-invasive scoring systems and histological scores in predicting mortality in patients with non-alcoholic fatty liver disease: A systematic review and meta-analysis. J. Gastroenterol. Hepatol. 2021, 36, 1754–1768. [Google Scholar] [CrossRef]
- Pavlides, M.; Banerjee, R.; Sellwood, J.; Kelly, M.; Robson, M.D.; Booth, J.C.; Collier, J.; Neubauer, S.; Barnes, E. Multiparametric magnetic resonance imaging predicts clinical outcomes in patients with chronic liver disease. J. Hepatol. 2015, 64, 308–315. [Google Scholar] [CrossRef] [Green Version]
- Caussy, C.; Alquiraish, M.H.; Nguyen, P.; Hernandez, C.; Cepin, S.; Fortney, L.E.; Ajmera, V.; Bettencourt, R.; Collier, S.; Hooker, J.; et al. Optimal threshold of controlled attenuation parameter with MRI-PDFF as the gold standard for the detection of hepatic steatosis. Hepatology 2017, 67, 1348–1359. [Google Scholar] [CrossRef] [PubMed] [Green Version]
- Craven, L.; Rahman, A.; Nair Parvathy, S.; Beaton, M.; Silverman, J.; Qumosani, K.; Hramiak, I.; Hegele, R.; Joy, T.; Meddings, J.; et al. Allogenic Fecal Microbiota Transplantation in Patients with Nonalcoholic Fatty Liver Disease Improves Abnormal Small Intestinal Permeability: A Randomized Control Trial. Am. J. Gastroenterol. 2020, 115, 1055–1065. [Google Scholar] [CrossRef] [PubMed]
- Gawrieh, S.; Noureddin, M.; Loo, N.; Mohseni, R.; Awasty, V.; Cusi, K.; Kowdley, K.V.; Lai, M.; Schiff, E.; Parmar, D.; et al. Saroglitazar, a PPAR-α/γ Agonist, for Treatment of Nonalcoholic Fatty Liver Disease: A Randomized Controlled Double-Blind Phase 2 Trial. Hepatology 2021, 74, 1809–1824. [Google Scholar] [CrossRef]
- Mingrone, G.; van Baar, A.C.; Devière, J.; Hopkins, D.; Moura, E.; Cercato, C.; Rajagopalan, H.; Lopez-Talavera, J.C.; White, K.; Bhambhani, V.; et al. Safety and efficacy of hydrothermal duodenal mucosal resurfacing in patients with type 2 diabetes: The randomised, double-blind, sham-controlled, multicentre REVITA-2 feasibility trial. Gut 2021, 71, 254–264. [Google Scholar] [CrossRef]
- Middleton, M.S.; Van Natta, M.L.; Heba, E.R.; Alazraki, A.; Trout, A.T.; Masand, P.; Brunt, E.M.; Kleiner, D.E.; Doo, E.; Tonascia, J.; et al. Diagnostic accuracy of magnetic resonance imaging hepatic proton density fat fraction in pediatric nonalcoholic fatty liver disease. Hepatology 2017, 67, 858–872. [Google Scholar] [CrossRef] [PubMed] [Green Version]
- Harrison, S.A.; Gawrieh, S.; Roberts, K.; Lisanti, C.J.; Schwope, R.B.; Cebe, K.M.; Paradis, V.; Bedossa, P.; Whitehead, J.M.A.; Labourdette, A.; et al. Prospective evaluation of the prevalence of non-alcoholic fatty liver disease and steatohepatitis in a large middle-aged US cohort. J. Hepatol. 2021, 75, 284–291. [Google Scholar] [CrossRef]
- Leng, W.; Ni, X.; Sun, C.; Lu, T.; Malovannaya, A.; Jung, S.Y.; Huang, Y.; Qiu, Y.; Sun, G.; Holt, M.V.; et al. Proof-of-Concept Workflow for Establishing Reference Intervals of Human Urine Proteome for Monitoring Physiological and Pathological Changes. eBioMedicine 2017, 18, 300–310. [Google Scholar] [CrossRef] [Green Version]
- Li, Y.; Wang, Y.; Liu, H.; Sun, W.; Ding, B.; Zhao, Y.; Chen, P.; Zhu, L.; Li, Z.; Li, N.; et al. Urine proteome of COVID-19 patients. URINE 2020, 2, 1–8. [Google Scholar] [CrossRef] [PubMed]
- Gorden, D.; Myers, D.S.; Ivanova, P.T.; Fahy, E.; Maurya, M.R.; Gupta, S.; Min, J.; Spann, N.J.; McDonald, J.G.; Kelly, S.L.; et al. Biomarkers of NAFLD progression: A lipidomics approach to an epidemic. J. Lipid Res. 2015, 56, 722–736. [Google Scholar] [CrossRef] [Green Version]
- Yu, C.; Xu, C.; Xu, L.; Yu, J.; Miao, M.; Li, Y. Serum proteomic analysis revealed diagnostic value of hemoglobin for nonalcoholic fatty liver disease. J. Hepatol. 2012, 56, 241–247. [Google Scholar] [CrossRef]
- Bell, L.N.; Theodorakis, J.L.; Vuppalanchi, R.; Saxena, R.; Bemis, K.G.; Wang, M.; Chalasani, N. Serum proteomics and biomarker discovery across the spectrum of nonalcoholic fatty liver disease. Hepatology 2010, 51, 111–120. [Google Scholar] [CrossRef] [PubMed] [Green Version]
- Younossi, Z.M.; Baranova, A.; Ziegler, K.; Del Giacco, L.; Schlauch, K.; Born, T.L.; Elariny, H.; Gorreta, F.; VanMeter, A.; Younoszai, A.; et al. A genomic and proteomic study of the spectrum of nonalcoholic fatty liver disease. Hepatology 2005, 42, 665–674. [Google Scholar] [CrossRef] [PubMed]
- Charlton, M.; Viker, K.; Krishnan, A.; Sanderson, S.; Veldt, B.; Kaalsbeek, A.J.; Kendrick, M.; Thompson, G.; Que, F.; Swain, J.; et al. Differential expression of lumican and fatty acid binding protein-1: New insights into the histologic spectrum of nonalcoholic fatty liver disease. Hepatology 2009, 49, 1375–1384. [Google Scholar] [CrossRef] [Green Version]
- Hu, S.; Li, P.; Zhang, R.; Liu, X.; Wei, S. Integrated metabolomics and proteomics analysis reveals energy metabolism disorders in the livers of sleep-deprived mice. J. Proteom. 2021, 245, 104290. [Google Scholar] [CrossRef] [PubMed]
- Eslam, M.; Newsome, P.N.; Sarin, S.K.; Anstee, Q.M.; Targher, G.; Romero-Gomez, M.; Zelber-Sagi, S.; Wong, V.W.-S.; Dufour, J.-F.; Schattenberg, J.M.; et al. A new definition for metabolic dysfunction-associated fatty liver disease: An international expert consensus statement. J. Hepatol. 2020, 73, 202–209. [Google Scholar] [CrossRef] [PubMed]
- Sterling, R.K.; Lissen, E.; Clumeck, N.; Sola, R.; Correa, M.C.; Montaner, J.; Sulkowski, M.S.; Torriani, F.J.; Dieterich, D.T.; Thomas, D.L.; et al. Development of a simple noninvasive index to predict significant fibrosis in patients with HIV/HCV coinfection. Hepatology 2006, 43, 1317–1325. [Google Scholar] [CrossRef] [PubMed]
- Ferraioli, G.; Monteiro, L.B.S. Ultrasound-based techniques for the diagnosis of liver steatosis. World J. Gastroenterol. 2019, 25, 6053–6062. [Google Scholar] [CrossRef]
- Cassinotto, C.; Boursier, J.; de Lédinghen, V.; Lebigot, J.; Lapuyade, B.; Cales, P.; Hiriart, J.B.; Michalak, S.; Bail, B.L.; Cartier, V.; et al. Liver stiffness in nonalcoholic fatty liver disease: A comparison of supersonic shear imaging, FibroScan, and ARFI with liver biopsy. Hepatology 2016, 63, 1817–1827. [Google Scholar] [CrossRef] [PubMed]
- Karlas, T.; Petroff, D.; Sasso, M.; Fan, J.G.; Mi, Y.Q.; de Lédinghen, V.; Kumar, M.; Lupsor-Platon, M.; Han, K.H.; Cardoso, A.C.; et al. Individual patient data meta-analysis of controlled attenuation parameter (CAP) technology for assessing steatosis. J. Hepatol. 2017, 66, 1022–1030. [Google Scholar] [CrossRef]
- Morrissey, J.J.; London, A.N.; Luo, J.; Kharasch, E.D. Urinary Biomarkers for the Early Diagnosis of Kidney Cancer. Mayo Clin. Proc. 2010, 85, 413–421. [Google Scholar] [CrossRef] [Green Version]
- Morrissey, J.J.; Kharasch, E.D. The Specificity of Urinary Aquaporin 1 and Perilipin 2 to Screen for Renal Cell Carcinoma. J. Urol. 2013, 189, 1913–1920. [Google Scholar] [CrossRef] [Green Version]
- Morrissey, J.J.; Mobley, J.; Figenshau, R.S.; Vetter, J.; Bhayani, S.; Kharasch, E.D. Urine Aquaporin 1 and Perilipin 2 Differentiate Renal Carcinomas from Other Imaged Renal Masses and Bladder and Prostate Cancer. Mayo Clin. Proc. 2015, 90, 35–42. [Google Scholar] [CrossRef] [Green Version]
- Cockcroft, D.W.; Gault, H. Prediction of Creatinine Clearance from Serum Creatinine. Nephron 1976, 16, 31–41. [Google Scholar] [CrossRef]
- Troyanskaya, O.G.; Cantor, M.; Sherlock, G.; Brown, P.O.; Hastie, T.; Tibshirani, R.; Botstein, D.; Altman, R.B. Missing value estimation methods for DNA microarrays. Bioinformatics 2001, 17, 520–525. [Google Scholar] [CrossRef] [Green Version]
- Genovese, C.; Wasserman, L. A stochastic process approach to False discovery rates. Gen. Inf. 2003, 64, 479–498. [Google Scholar]
- Kumar, L.; Futschik, M.E. Mfuzz: A software package for soft clustering of microarray data. Bioinformation 2007, 2, 5–7. [Google Scholar] [CrossRef]
- Yu, G.; Wang, L.-G.; Han, Y.; He, Q.-Y. clusterProfiler: An R Package for Comparing Biological Themes Among Gene Clusters. OMICS J. Integr. Biol. 2012, 16, 284–287. [Google Scholar] [CrossRef]
- Virreira Winter, S.; Karayel, O.; Strauss, M.T.; Padmanabhan, S.; Surface, M.; Merchant, K.; Alcalay, R.N.; Mann, M. Urinary proteome profiling for stratifying patients with familial Parkinson’s disease. Embo. Mol. Med. 2021, 13, e13257. [Google Scholar] [CrossRef]
- Willebrords, J.; Pereira, I.V.A.; Maes, M.; Yanguas, S.C.; Colle, I.; Bossche, B.V.D.; Da Silva, T.C.; de Oliveira, C.P.M.S.; Andraus, W.; Alves, V.A.; et al. Strategies, models and biomarkers in experimental non-alcoholic fatty liver disease research. Prog. Lipid Res. 2015, 59, 106–125. [Google Scholar] [CrossRef] [PubMed] [Green Version]
- Zou, Z.-Y.; Fan, J.-G. Incidence of chronic kidney disease in patients with non-alcoholic fatty liver disease. J. Hepatol. 2020, 73, 214–216. [Google Scholar] [CrossRef] [Green Version]
- Mantovani, A.; Petracca, G.; Beatrice, G.; Csermely, A.; Lonardo, A.; Schattenberg, J.M.; Tilg, H.; Byrne, C.D.; Targher, G. Non-alcoholic fatty liver disease and risk of incident chronic kidney disease: An updated meta-analysis. Gut 2020, 71, 156–162. [Google Scholar] [CrossRef]
- Liu, H.; Sun, W.; Zhou, Y.; Griffin, N.; Faulkner, S.; Wang, L. iTRAQ-based quantitative proteomics analysis of Sprague-Dawley rats liver reveals perfluorooctanoic acid-induced lipid metabolism and urea cycle dysfunction. Toxicol. Lett. 2022, 357, 20–32. [Google Scholar] [CrossRef] [PubMed]
- Loomba, R.; Friedman, S.L.; Shulman, G.I. Mechanisms and disease consequences of nonalcoholic fatty liver disease. Cell 2021, 184, 2537–2564. [Google Scholar] [CrossRef] [PubMed]
- Petersen, M.; Madiraju, A.K.; Gassaway, B.; Marcel, M.; Nasiri, A.R.; Butrico, G.; Marcucci, M.J.; Zhang, D.; Abulizi, A.; Zhang, X.-M.; et al. Insulin receptor Thr1160 phosphorylation mediates lipid-induced hepatic insulin resistance. J. Clin. Investig. 2016, 126, 4361–4371. [Google Scholar] [CrossRef] [Green Version]
- Zhao, H.; Tang, M.; Liu, M.; Chen, L. Glycophagy: An emerging target in pathology. Clin. Chim. Acta 2018, 484, 298–303. [Google Scholar] [CrossRef] [PubMed]
- Wesolowski, S.R.; Kasmi, K.C.E.; Jonscher, K.R.; Friedman, J.E. Developmental origins of NAFLD: A womb with a clue. Nat. Rev. Gastroenterol. Hepatol. 2017, 14, 81–96. [Google Scholar] [CrossRef] [Green Version]
- Aigner, E.; Theurl, I.; Haufe, H.; Seifert, M.; Hohla, F.; Scharinger, L.; Stickel, F.; Mourlane, F.; Weiss, G.; Datz, C. Copper Availability Contributes to Iron Perturbations in Human Nonalcoholic Fatty Liver Disease. Gastroenterology 2008, 135, 680–688.e1. [Google Scholar] [CrossRef]
- El-Rayah, E.G.A.; Twomey, P.J.; Wallace, E.M.; McCormick, P.A. Both α-1-antitrypsin Z phenotypes and low caeruloplasmin levels are over-represented in alcohol and nonalcoholic fatty liver disease cirrhotic patients undergoing liver transplant in Ireland. Eur. J. Gastroenterol. Hepatol. 2018, 30, 364–367. [Google Scholar] [CrossRef]
- Corradini, E.; Buzzetti, E.; Dongiovanni, P.; Scarlini, S.; Caleffi, A.; Pelusi, S.; Bernardis, I.; Ventura, P.; Rametta, R.; Tenedini, E.; et al. Ceruloplasmin gene variants are associated with hyperferritinemia and increased liver iron in patients with NAFLD. J. Hepatol. 2021, 75, 506–513. [Google Scholar] [CrossRef]
- Fernández-Real, J.M.; Manco, M. Effects of iron overload on chronic metabolic diseases. Lancet Diabetes Endocrinol. 2014, 2, 513–526. [Google Scholar] [CrossRef]
- Yang, H.; Liu, C.-N.; Wolf, R.M.; Ralle, M.; Dev, S.; Pierson, H.; Askin, F.; Steele, K.E.; Magnuson, T.H.; Schweitzer, M.A.; et al. Obesity is associated with copper elevation in serum and tissues. Metallomics 2019, 11, 1363–1371. [Google Scholar] [CrossRef] [PubMed]
- Meggyesy, P.; Masaldan, S.; Clatworthy, S.; Volitakis, I.; Eyckens, D.; Aston-Mourney, K.; Cater, M. Copper Ionophores as Novel Antiobesity Therapeutics. Molecules 2020, 25, 4957. [Google Scholar] [CrossRef]
- Fujita, H.; Narita, T.; Ito, S. Abnormality in urinary protein excretion in Japanese men with impaired glucose tolerance. Diabetes Care 1999, 22, 823–826. [Google Scholar] [CrossRef] [PubMed]
- Narita, T.; Sasaki, H.; Hosoba, M.; Miura, T.; Yoshioka, N.; Morii, T.; Shimotomai, T.; Koshimura, J.; Fujita, H.; Kakei, M.; et al. Parallel Increase in Urinary Excretion Rates of Immunoglobulin G, Ceruloplasmin, Transferrin, and Orosomucoid in Normoalbuminuric Type 2 Diabetic Patients. Diabetes Care 2004, 27, 1176–1181. [Google Scholar] [CrossRef] [Green Version]
- Ohara, N.; Hanyu, O.; Hirayama, S.; Nakagawa, O.; Aizawa, Y.; Ito, S.; Sone, H. Hypertension increases urinary excretion of immunoglobulin G, ceruloplasmin and transferrin in normoalbuminuric patients with type 2 diabetes mellitus. J. Hypertens. 2014, 32, 432–438. [Google Scholar] [CrossRef]
- Kim, E.J.; Oh, H.Y.; Heo, H.-S.; Hong, J.E.; Jung, S.-J.; Lee, K.W.; Park, J.H.; Hur, C.-G.; Park, J.H.Y. Biological features of core networks that result from a high-fat diet in hepatic and pulmonary tissues in mammary tumour-bearing, obesity-resistant mice. Br. J. Nutr. 2012, 110, 241–255. [Google Scholar] [CrossRef] [Green Version]
- Pickup, J.C.; Mattock, M.B.; Chusney, G.D.; Burt, D. NIDDM as a disease of the innate immune system: Association of acute-phase reactants and interleukin-6 with metabolic syndrome X. Diabetologia 1997, 40, 1286–1292. [Google Scholar] [CrossRef] [Green Version]
- Sun, Y.; Yang, Y.; Qin, Z.; Cai, J.; Guo, X.; Tang, Y.; Wan, J.; Su, D.-F.; Liu, X. The Acute-Phase Protein Orosomucoid Regulates Food Intake and Energy Homeostasis via Leptin Receptor Signaling Pathway. Diabetes 2016, 65, 1630–1641. [Google Scholar] [CrossRef] [PubMed] [Green Version]
- Wang, P.-Y.; Feng, J.-Y.; Zhang, Z.; Chen, Y.; Qin, Z.; Dai, X.-M.; Wei, J.; Hu, B.-H.; Zhang, W.-D.; Sun, Y.; et al. The adipokine orosomucoid alleviates adipose tissue fibrosis via the AMPK pathway. Acta Pharmacol. Sin. 2021, 43, 367–375. [Google Scholar] [CrossRef]


Publisher’s Note: MDPI stays neutral with regard to jurisdictional claims in published maps and institutional affiliations. |
© 2022 by the authors. Licensee MDPI, Basel, Switzerland. This article is an open access article distributed under the terms and conditions of the Creative Commons Attribution (CC BY) license (https://creativecommons.org/licenses/by/4.0/).
Share and Cite
Liu, C.-H.; Zheng, S.; Wang, S.; Wu, D.; Jiang, W.; Zeng, Q.; Wei, Y.; Zhang, Y.; Tang, H. Urine Proteome in Distinguishing Hepatic Steatosis in Patients with Metabolic-Associated Fatty Liver Disease. Diagnostics 2022, 12, 1412. https://doi.org/10.3390/diagnostics12061412
Liu C-H, Zheng S, Wang S, Wu D, Jiang W, Zeng Q, Wei Y, Zhang Y, Tang H. Urine Proteome in Distinguishing Hepatic Steatosis in Patients with Metabolic-Associated Fatty Liver Disease. Diagnostics. 2022; 12(6):1412. https://doi.org/10.3390/diagnostics12061412
Chicago/Turabian StyleLiu, Chang-Hai, Shanshan Zheng, Shisheng Wang, Dongbo Wu, Wei Jiang, Qingmin Zeng, Yi Wei, Yong Zhang, and Hong Tang. 2022. "Urine Proteome in Distinguishing Hepatic Steatosis in Patients with Metabolic-Associated Fatty Liver Disease" Diagnostics 12, no. 6: 1412. https://doi.org/10.3390/diagnostics12061412