Article

Multi-Omics Analyses to Identify FCGBP as a Potential Predictor in Head and Neck Squamous Cell Carcinoma

1
Institute of Biomedical Sciences, National Sun Yat-sen University, Kaohsiung 804, Taiwan
2
Department of Otolaryngology, Head and Neck Surgery, Kaohsiung Veterans General Hospital, Kaohsiung 813, Taiwan
3
School of Medicine, National Yang Ming Chiao Tung University, Taipei 112, Taiwan
4
School of Medicine, Chung Shan Medical University, Taichung 402, Taiwan
5
Department of Medical Education and Research, Kaohsiung Veterans General Hospital, Kaohsiung 813, Taiwan
6
Institute of Precision Medicine, National Sun Yat-sen University, Kaohsiung 804, Taiwan
*
Author to whom correspondence should be addressed.
Diagnostics 2022, 12(5), 1178; https://doi.org/10.3390/diagnostics12051178
Submission received: 23 March 2022 / Revised: 28 April 2022 / Accepted: 5 May 2022 / Published: 9 May 2022
(This article belongs to the Special Issue Advances in Diagnostics of Head and Neck Cancer)

Abstract

:
(Purpose) Previous studies have pointed out the significance of IgG Fc binding protein (FCGBP) in carcinogenesis, cancer progression, and tumor immunity in certain malignancies. However, its prognostic values, molecular interaction, and immune characteristics in the head and neck squamous cell carcinoma (HNSC) remained unclear. (Methods) To evaluate the potential role of the FCGBP gene, we used GEPIA2 and UALCAN platforms to explore the differential levels, survivals, and genetic alteration through cBioPortal (based on The Cancer Genome Atlas dataset). STRING, GeneMania, and TIMER2.0 identified the interacting networks. LinkedOmics performed Gene enrichment analysis, and TISIDB and TIMER2.0 evaluated the role of FCGBP in the tumor microenvironment. (Results) The expression level of FCGBP is lower in cancer tissues. A high FCGBP level is significantly associated with better overall- and disease-specific-survivals, regardless of human papillomavirus infection. Low FCGBP levels correlated to a higher tumor protein p53 (TP53) mutation rate (p = 0.018). FCGBP alteration significantly co-occurred with that of TP53 (q = 0.037). Interacting networks revealed a significant association between FGFBP and trefoil factor 3 (TFF3), a novel prognostic marker in various cancers, at transcriptional and translational levels. Enrichment analyses identified that the top gene sets predominantly related to immune and inflammatory responses. Further investigation found that the FCGBP mRNA level positively correlated to the infiltration rates of B cells, Th17/CD8+ T lymphocytes, T helper follicular cells, mast cells, and expression levels of various immune molecules and immune checkpoints in HNSC. (Conclusions) We found that the FCGBP mRNA level negatively correlated to TP53 mutation status while positively correlated to the TFF3 level. Additionally, FCGBP may regulate the tumor microenvironment. These findings support the FCGBP as a potential biomarker to estimate HNSC prognoses.

1. Introduction

Head and neck squamous cell carcinoma (HNSC) ranks the 7th among cancer-related deaths, with over 890,000 new cases annually worldwide and mortality of approximately 50% [1]. Leading causes of HNSC include alcohol consumption, smoking, and high-risk human papillomavirus (HPV) infection [2]. Although the growing trend in HNSC may vary with ethnicities, the annual incidence of HPV-related HNSC is consistently increasing [2,3]. Cancer behaviors are distinct between HPV-related and HPV-unrelated HNSCs. Overexpression of cyclin-dependent kinase inhibitor 2A (CDKN2A/p16), downregulation of tumor protein p53 (TP53), and inactivation of RB transcription corepressor 1 (RB1), have been characterized in HPV-related HNSC [4]. The underlying molecular mechanisms were identified as HPV oncoprotein E6 ubiquitinate TP53, another oncoprotein E7 eliminated RB1 through proteasomal degradation of RB1 to facilitate cell cycle progression, thereby transactivation of the CDKN2A via E2F proteins releasing from RB1/E2F family transcription factors [4]. In terms of clinical manifestations, HPV-related HNSC significantly correlated with favorable treatment responses after radiotherapy and chemotherapy, leading to a better prognosis [5]. Nevertheless, the overall survival (OS) of HNSC did not improve considerably despite multidisciplinary advances [5]. Consequently, it is essential to explore novel biomarkers for effective therapeutic strategies.
The FCGBP gene encoded a cysteine-rich glycoprotein comprising approximately 5400 amino acid residues, which may bind the Fc portion of the IgG molecule [6]. The mucous epithelia of various organs, including the intestine and colon, gallbladder, salivary gland(s), and cervix uterus, may synthesize FCGBP, thus becoming a constituent of many body fluids [6,7]. Physiologically, FCGBP protects the cells against infections from microorganisms [8]. One speculated mechanism is that FCGBP modulates the innate mucosal immunity to defense by binding the trefoil factor 3 (TFF3) [9]. The pathogenic roles of FCGBP in malignancy were firstly reported for its implication in ulcerative colitis [10], a condition that predisposes to colorectal cancer development [11]. Subsequent investigations have demonstrated the potential importance of FCGBP in several cancers [11,12,13,14,15,16,17]. FCGBP alternative splicing and FCGBP mutations may implicate the pathogenesis of lung cancer [12] and hepato-cholangiocarcinoma [13], respectively. Its protein is abnormally expressed in many malignancies, suggesting the potential role in tumorigenesis. In tissues from prostate adenocarcinoma in human and transgenic mice, FCGBP levels were significantly downregulated [14]. The FCGBP mRNA levels were significantly and differentially expressed in normal thyroid tissues, follicular- and papillary-thyroid carcinomas, with expression levels higher in adenoma and lower in carcinoma compared to that in normal tissues [15]. Moreover, the FCGBP protein served as an independent prognostic factor in gallbladder adenocarcinoma [16] and metastatic colorectal cancer [17]. The FCGBP level was one of the top differentially expressed transcripts between chemosensitiv and chemoresistant tissues [18]. Accordingly, advanced ovarian serous adenocarcinomas applied FCGBP mRNA levels to predict therapy responses [18].
In HNSC-derived cell lines, FCGBP levels increased by overexpressing E6 and decreased after treatment with transforming growth factor-beta (TGFβ) [19]. Similar to the conditions of the gallbladder- [16] and colorectal- [17] cancers, FCGBP may participate in regulating HNSC metastasis through epithelial-mesenchymal transition (EMT) [19]. Despite these findings, whether the FCGBP level affects immune infiltration or contributes to survival in HNSCs remains unclear. Exploring the roles of FCGBP is critical due to the tumor microenvironments’ impact on carcinogenesis and tumor progression [20]. Another concern is that immunotherapy survival advantages in an HNSC subset may be attributable to factors including immune cells, immune mediators, and related pathways [21]. Consequently, we aimed to investigate the FCGBP genetic characterizations on the prognostic significance, the rationale of the impacts of molecular-molecular interaction, and immune features on clinical outcomes of HNSC through bioinformatics analysis.

2. Materials and Methods

2.1. Expression Feature Analysis

We explored the mRNA levels of FCGBP between cancerous and noncancerous tissues using the GEPIA2 platform [22] and evaluated the effects of TP53 mutation and HPV infection statuses on differential FCGBP levels by TIMER2.0 [23] and UALCAN [24]. The correlations between diverse clinical factors and FCGBP levels on The Cancer Genome Atlas (TCGA) dataset were calculated by IBM SPSS Statistics for Windows, version 21 (IBM, Armonk, NY, USA). The abbreviations of different cancer types were based on TCGA Study Abbreviations (TCGA Study Abbreviations|NCI Genomic Data Commons (https://gdc.cancer.gov/, accessed on 22 March 2022). The mass spectrometry proteomic profiles generated by the Clinical Proteomic Tumor Analysis Consortium (CPTAC) were the source for protein expression analyses [25]. UALCAN database examined the correlations between the FCGBP protein level and various clinical factors. Gene/transcript expression levels are presented as log2 [transcripts per million (TPM)] or log2 (TPM + 1) in GEPIA2; log2 RNA-Seq by Expectation-Maximization (RSEM) in TIMER2.0. A p < 0.05 is considered as statically significant.

2.2. Survival Prognosis Analysis

The prognosis analysis of the FCGBP level was conducted in GEPIA2 to generate the survival map and Kaplan-Meier curve for the overall- and disease-specific survival related to the FCGBP level from the TCGA dataset. The expression level in the top 50% (median) was considered the high-FCGBP group. To further test whether the prognostic significance of the FCGBP level was independent of other variables of HNSC, we performed univariate and multivariate Cox regressions analyses. The log-rank test compared the survival rates, with the significance threshold set at p < 0.05. Moreover, TIMER 2.0 generated the survival plots stratified by HPV infection.

2.3. Gene Alteration Analysis

We used the cBioPortal platform [26] to probe the association between different types of mutations and the FCGBP mRNA levels. After identifying the most frequently altered genes with FCGBP alteration, we estimated the genetic co-occurrence of these core genes with FCGBP alterations. Next, we verified the associations of the FCGBP level with the core genes using the “Gene_Corr module” of TIMER2.0. After submission, the correlation curve(s) was generated automatically.

2.4. Molecular Interaction Analysis

We used the STRING database [27] to explore the protein-protein interaction of the FCGBP. We identified significant proteins by intersecting with the FCGBP associated co-expressed genes and then tested their correlation at the mRNA level. GeneMania [28] further validated the association between FCGBP and significant proteins. GeneMania provided information for the co-expression, co-localization, gene functions, and related pathways of appealing genes in addition to the gene-gene interaction.

2.5. Gene Set Enrichment Analysis

We used the LinkedOmics database [29] to download the mRNA dataset of HNSC patients and obtained a total of 517 cases containing whole FCGBP level and clinical features. After identifying 20,163 genes from 520 microarrays, a heat map presented the top 50 positively correlated transcripts to the FCGBP level. The co-expressed genes associated with the FCGBP level were selected for enrichment analysis to reflect the roles of FCGBP. We included a post-processing step targeting Gene Ontology (GO) to identify the most representative significant gene sets for visualization through redundancy reduction and affinity propagation cover. A p < 0.05 determined significantly enriched terms. Gene Set Enrichment Analysis (GSEA) also highlighted the Kyoto Encyclopedia of Genes and Genomes (KEGG) pathways through analyzing a minimum number of genes (size) of 3 and a simulation of 500 within the HNSC dataset.

2.6. Immune Infiltration

First, we analyzed the associations of the FCGBP level with the immunomodulatory transcripts in TISIDB [30], and identified the immune cells with significant infiltrate estimation values correlated to the FCGBP level. The identified immune cells were next validated in TIMER2.0 using the ‘Immune_Gene module’. We selected the immune cells that correlated significantly in the same directions using different algorithms, including TIMER, EPIC, QUANTISEQ, XCELL, MCP-COUNTER, CIBERSORT, and CIBERSORT-ABS. The associations of respective markers of the significant tumor-infiltrating immune cells with the FCGBP level were further explored using the TIMER2.0 correlation module. Finally, we verified the correlations of the FCGBP level and immune-related molecules and immune checkpoints by the TISIDB database and TIMER2.0, respectively. The Spearman correlation test analyzed the associations, and a p-value less than 0.05 indicates statistical significance.

3. Results

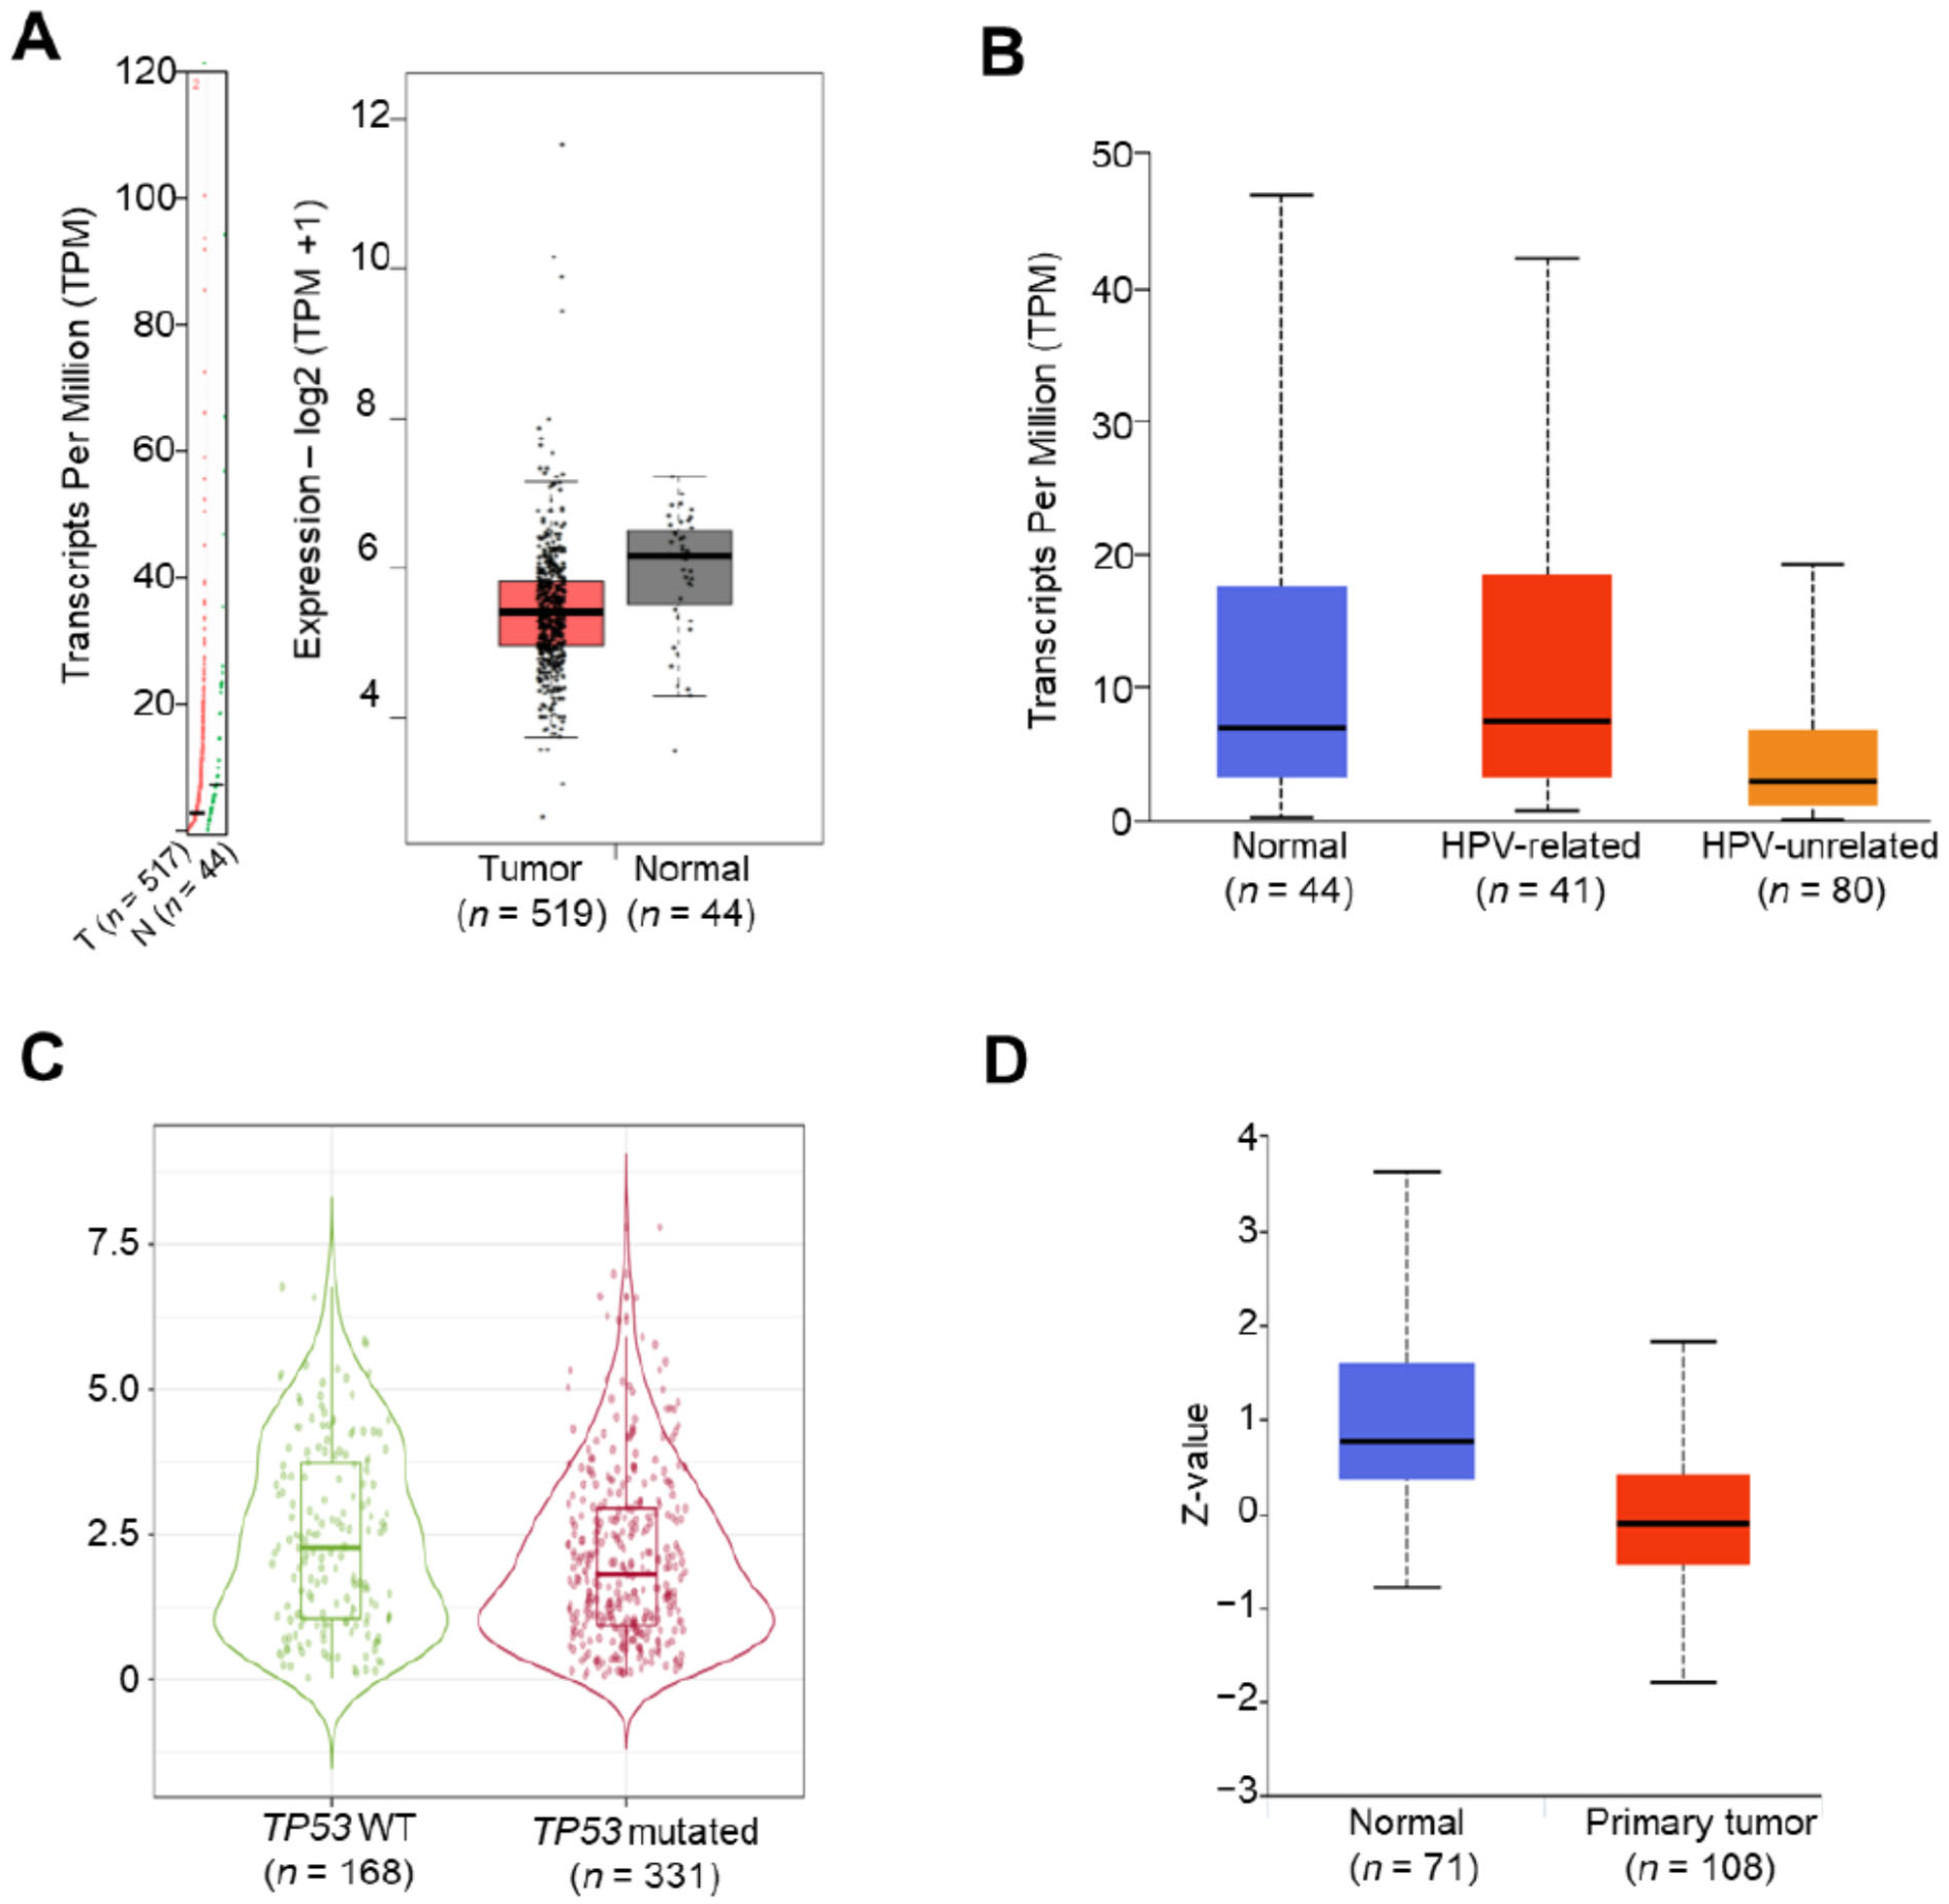
3.1. Downregulation of the FCGBP Level in Head and Neck Squamous Cell Carcinoma

To investigate the potential roles of the FCGBP gene in HNSC, we utilized TCGA dataset in GEPIA2, UALCAN, and TIMER2.0 to evaluate the FCGBP mRNA levels in tumoral and normal tissues. The FCBGP mRNA level from tumors was significantly lower than normal tissues (Figure 1A). However, we did not find a significant difference between HPV-related tumors (n = 41) and normal tissues (n = 44) and the FCGBP mRNA level (p = 5.2 × 10⁻¹, Figure 1B). Table 1 demonstrates the correlations between the FCGBP level and critical clinical factors. By using the median value of FCGBP mRNA level to divide 442 HNSC patients into high- (n = 209) and low- (n = 233) FCGBP groups, we found a significant decrease in FCGBP level from American Joint Committee on Cancer (AJCC) T1/T2 to T3/T4 (p < 1 × 10⁻³) and from stage I to stage IV (p = 1.5 × 10⁻²) in patients with HNSC. Notably, we found a significant difference in FCGBP level between TP53 mutation (n = 331) and wild type (n = 168). Furthermore, the Wilcoxon rank-sum test showed a lower FCGBP level associated with a higher TP53 mutation rate (p = 1.8 × 10⁻², Figure 1C). UALCAN analysis on Clinical Proteomic Tumor Analysis Consortium (CTPAC) also pointed out that the FCGBP protein levels in tumors (n = 108) were lower than those in normal tissues (n = 71) (p = 2.2 × 10⁻⁸, Figure 1D). These findings suggested the downregulation of the FCBGP in HNSC tissues at both transcriptional and translational levels.

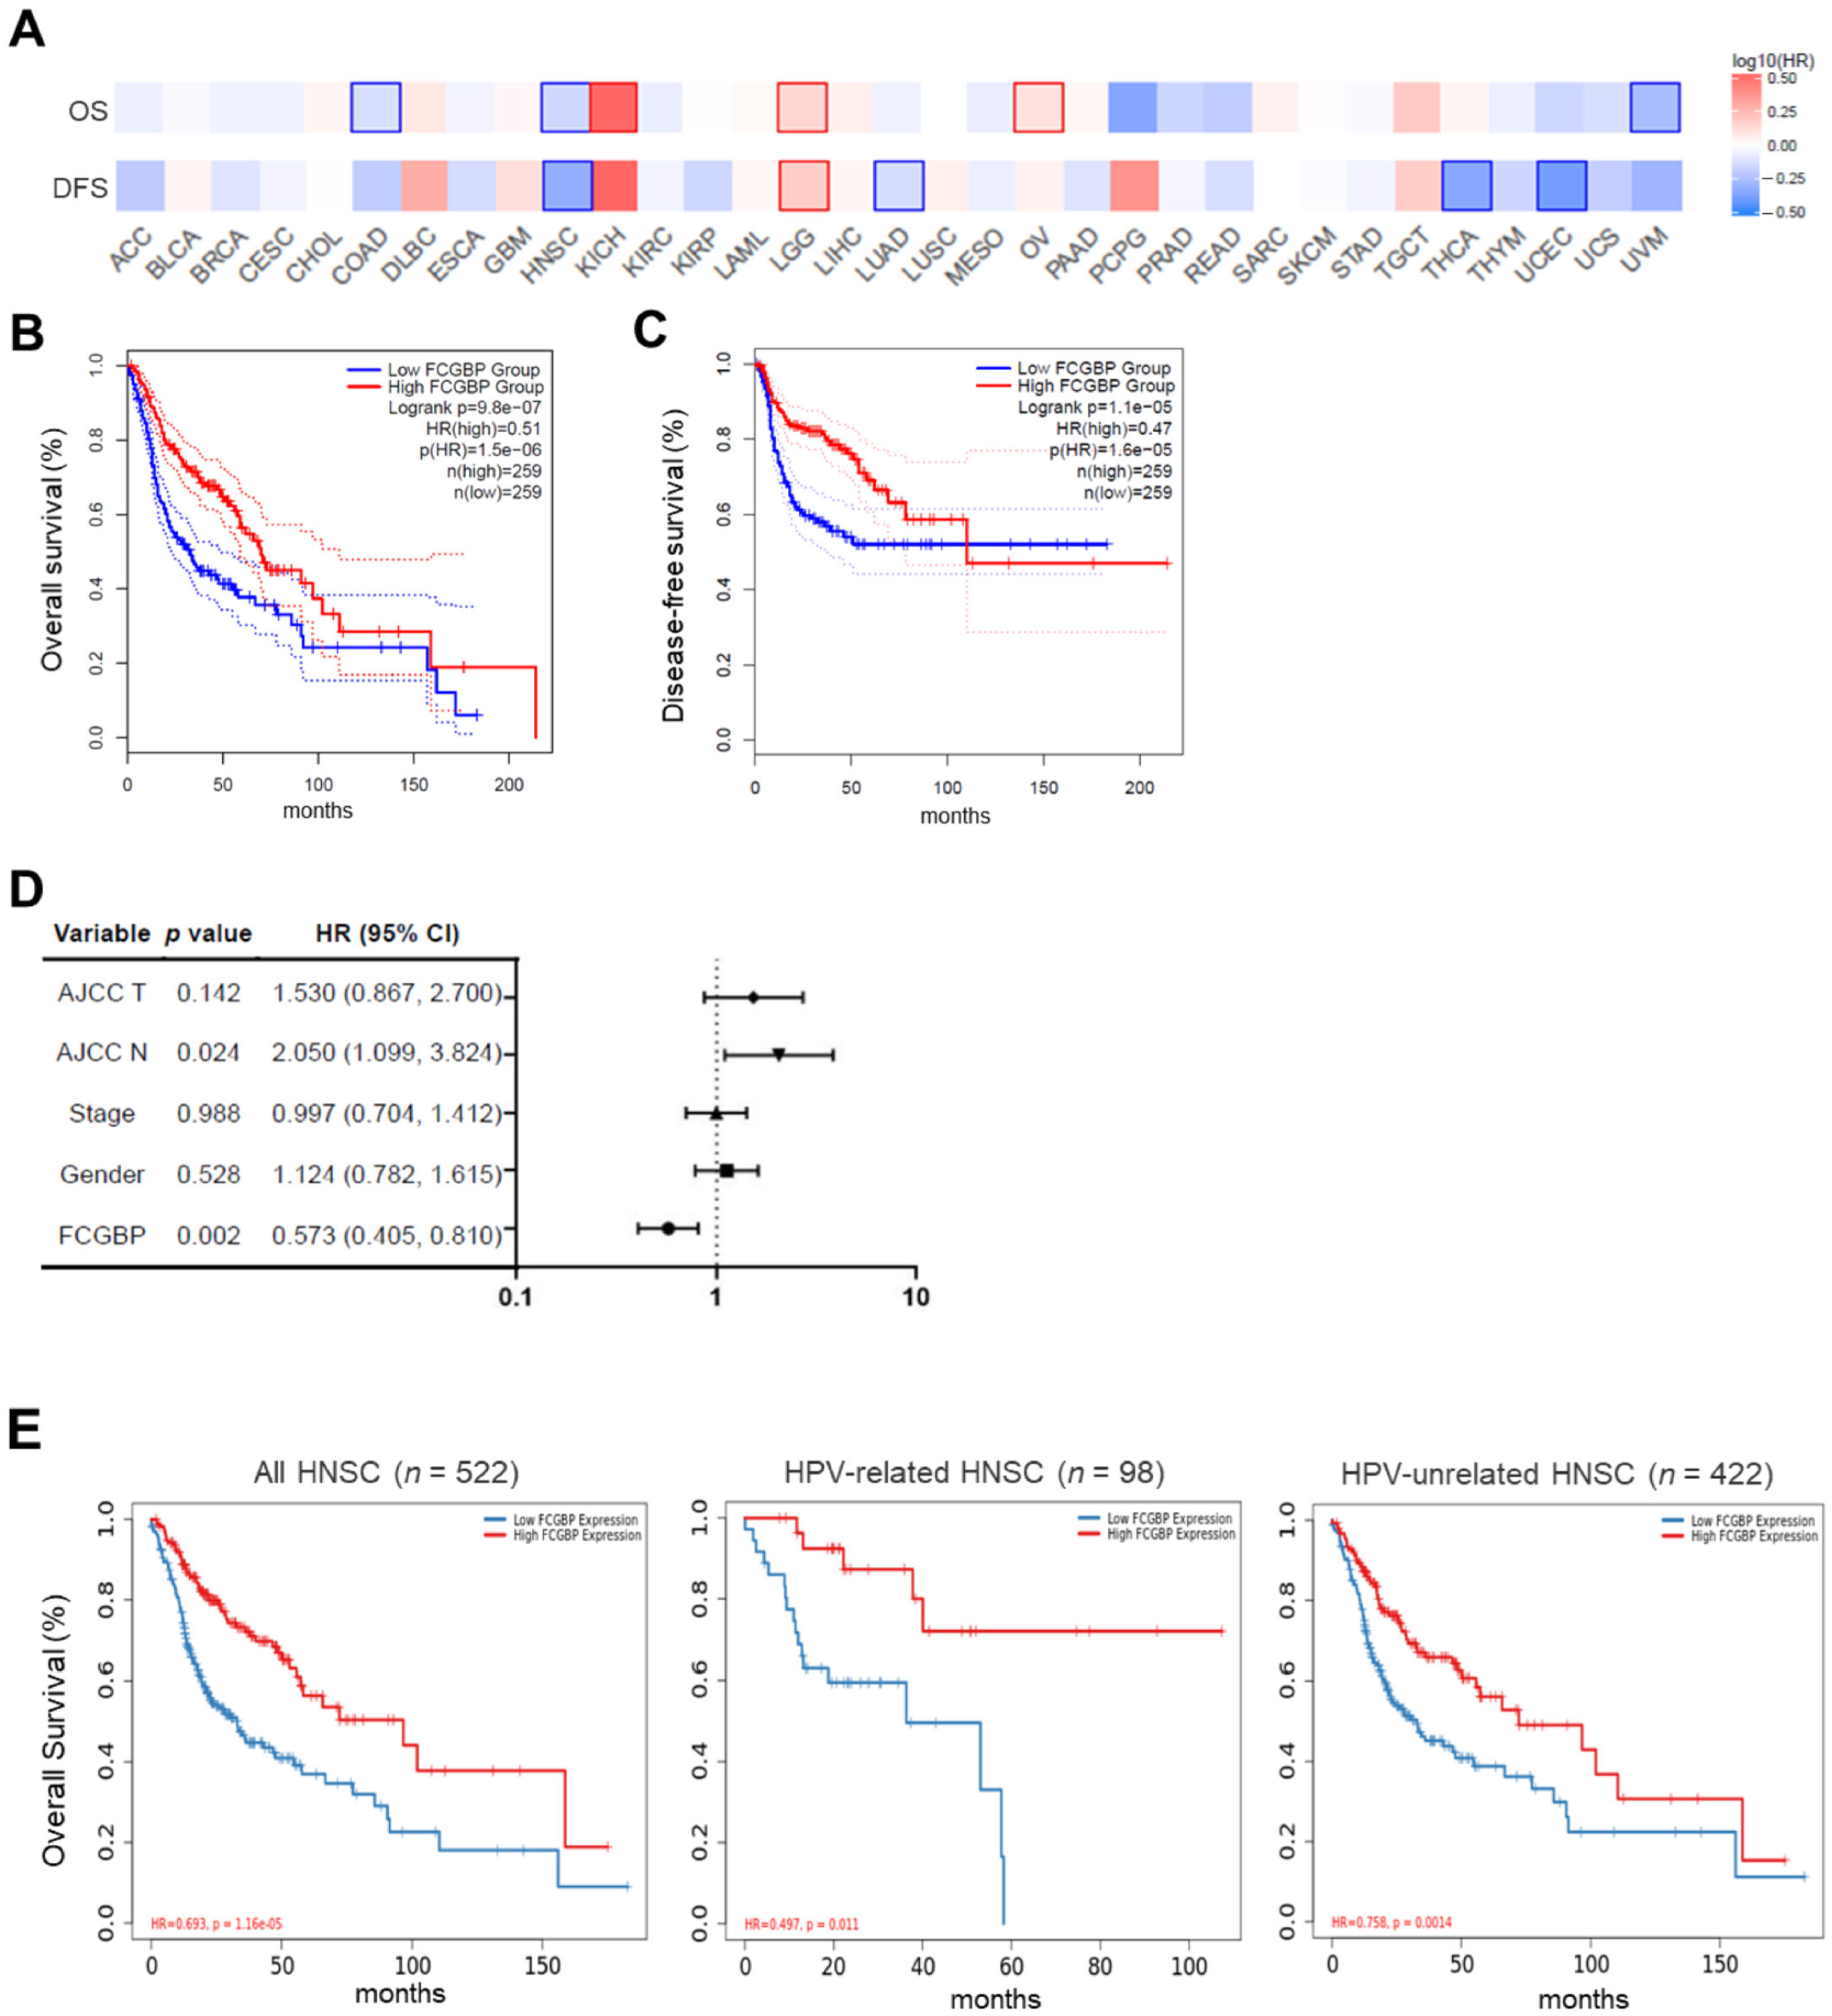
3.2. High FCGBP Level as an Independent Prognostic Factor for Favorable Survival in HNSC

Figure 2A shows the heat map of survivals on various cancers in the pan-TCGA dataset. For HNSC, the Kaplan-Meier curves demonstrated that patients with high FCGBP levels have better overall survival (OS) (hazard ratio [HR) = 0.51, p = 9.8 × 10⁻⁷) and disease-free survival (DFS) (HR = 0.47, p = 1.1 × 10⁻⁵) compared to those with low FCBGP levels (Figure 2B,C). The univariate Cox model identified the high FCGBP level (p = 2 × 10⁻³) as a favorable prognostic factor, and high AJCC N (p = 2.4 × 10⁻²) classification negatively affected OS (Figure 2D). Multivariate analysis revealed that FCGBP level remained a significant prognostic factor, and the results are consistent in both HPV-related (n = 98, HR = 0.49, p = 1.1 × 10⁻²) and HPV-unrelated HNSC (n = 422, HR = 0.75, p = 1.4 × 10⁻³) (Figure 2E). Collectively, the above findings suggested that the FCGBP level may serve as a positive and independent prognostic factor in patients with HNSC.

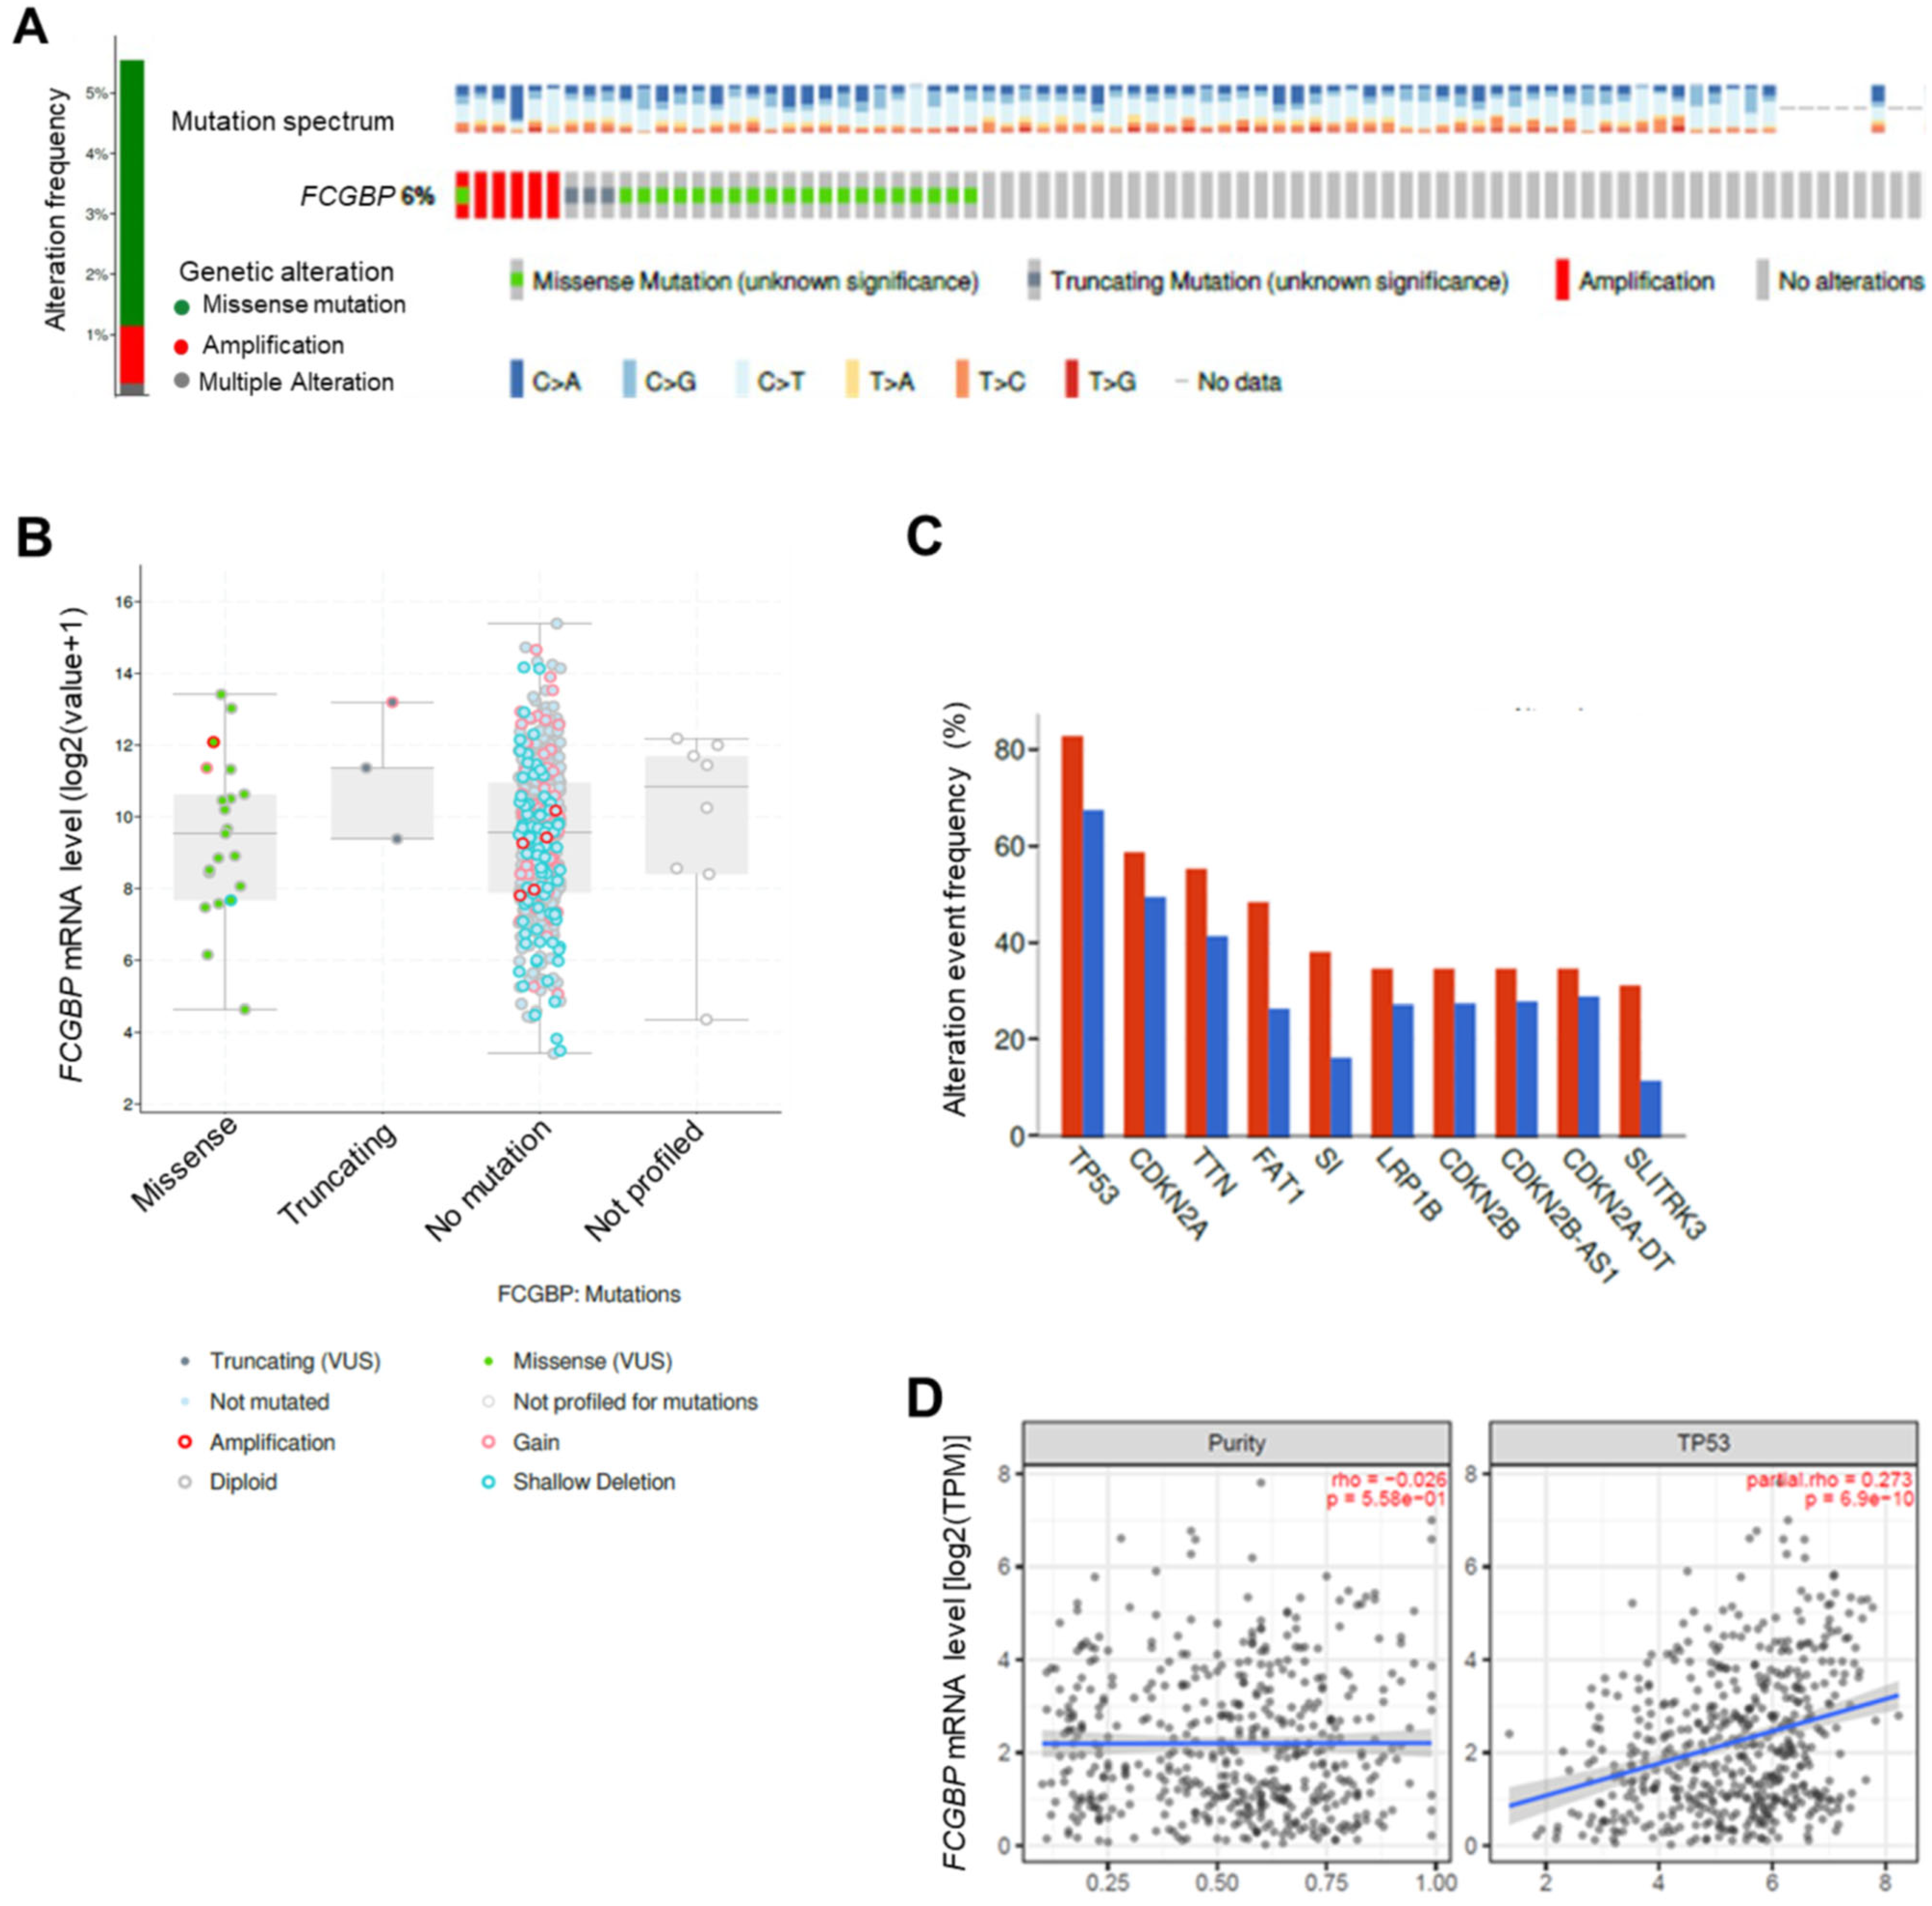
3.3. The FCGBP mRNA Level Positively Correlates to TP53 WT in HNSC Patients

We analyzed genomic alteration of FCGBP in HNSC/TCGA, showing that the alteration rate of the FCGBP gene is 6%, with a mutation rate and amplification rate of 4.4% and 0.96%, respectively (Figure 3A). The FCGBP gene amplification was negatively associated with its mRNA level in HNSC patients (Figure 3B). Further analysis on the most frequently altered genes, which alternated with the FCGBP gene variations, identified TP53, CDKN2A, titin (TTN), FAT atypical cadherin 1 (FAT1), and sucrose-isomaltase (SI), ranked from high to low in frequency (Figure 3C). Among these genes, FCGBP significantly co-occurred with TP53 (q = 3.7 × 10⁻²), SI (q = 1.9E-02), and FAT1 (q = 1.2 × 10⁻²) (Supplementary Table S1). Additional examination on the correlation of the FCGBP mRNA level and co-occurred genes with TIMER2.0 revealed that FCGBP significantly correlated with TP53 mRNA levels in HNSC patients (r = 0.273, p = 6.9 × 10⁻¹⁰) (Figure 3D). Moreover, the FCGBP mRNA level was also positively associated with the levels of essential target transcripts of TP53, including BCL2 binding component 3 (BBC3) (r = 0.169, p = 1.64 × 10⁴), MDM2 proto-oncogene (MDM2) (r = 0.207, p = 3.86 × 10⁶), phorbol-12-myristate-13-acetate-induced protein 1 (PMAIP1) (r = 0.128, p = 4.39 × 10⁻³), RNA binding motif protein 10 (RBM10) (r = 0.226, p = 4.17 × 10⁷), zinc finger matrin-type 3 (ZMAT3) (r = 0.292, p = 3.68 × 10⁻¹¹), and mutL homolog 1 (MLH1) (r = 0.151, p = 7.94 × 10⁻⁴) (Supplementary Figure S1). These findings suggested that a dysregulation of the FCGBP-TP53 axis potentially participates in the pathogenesis of HNSC.

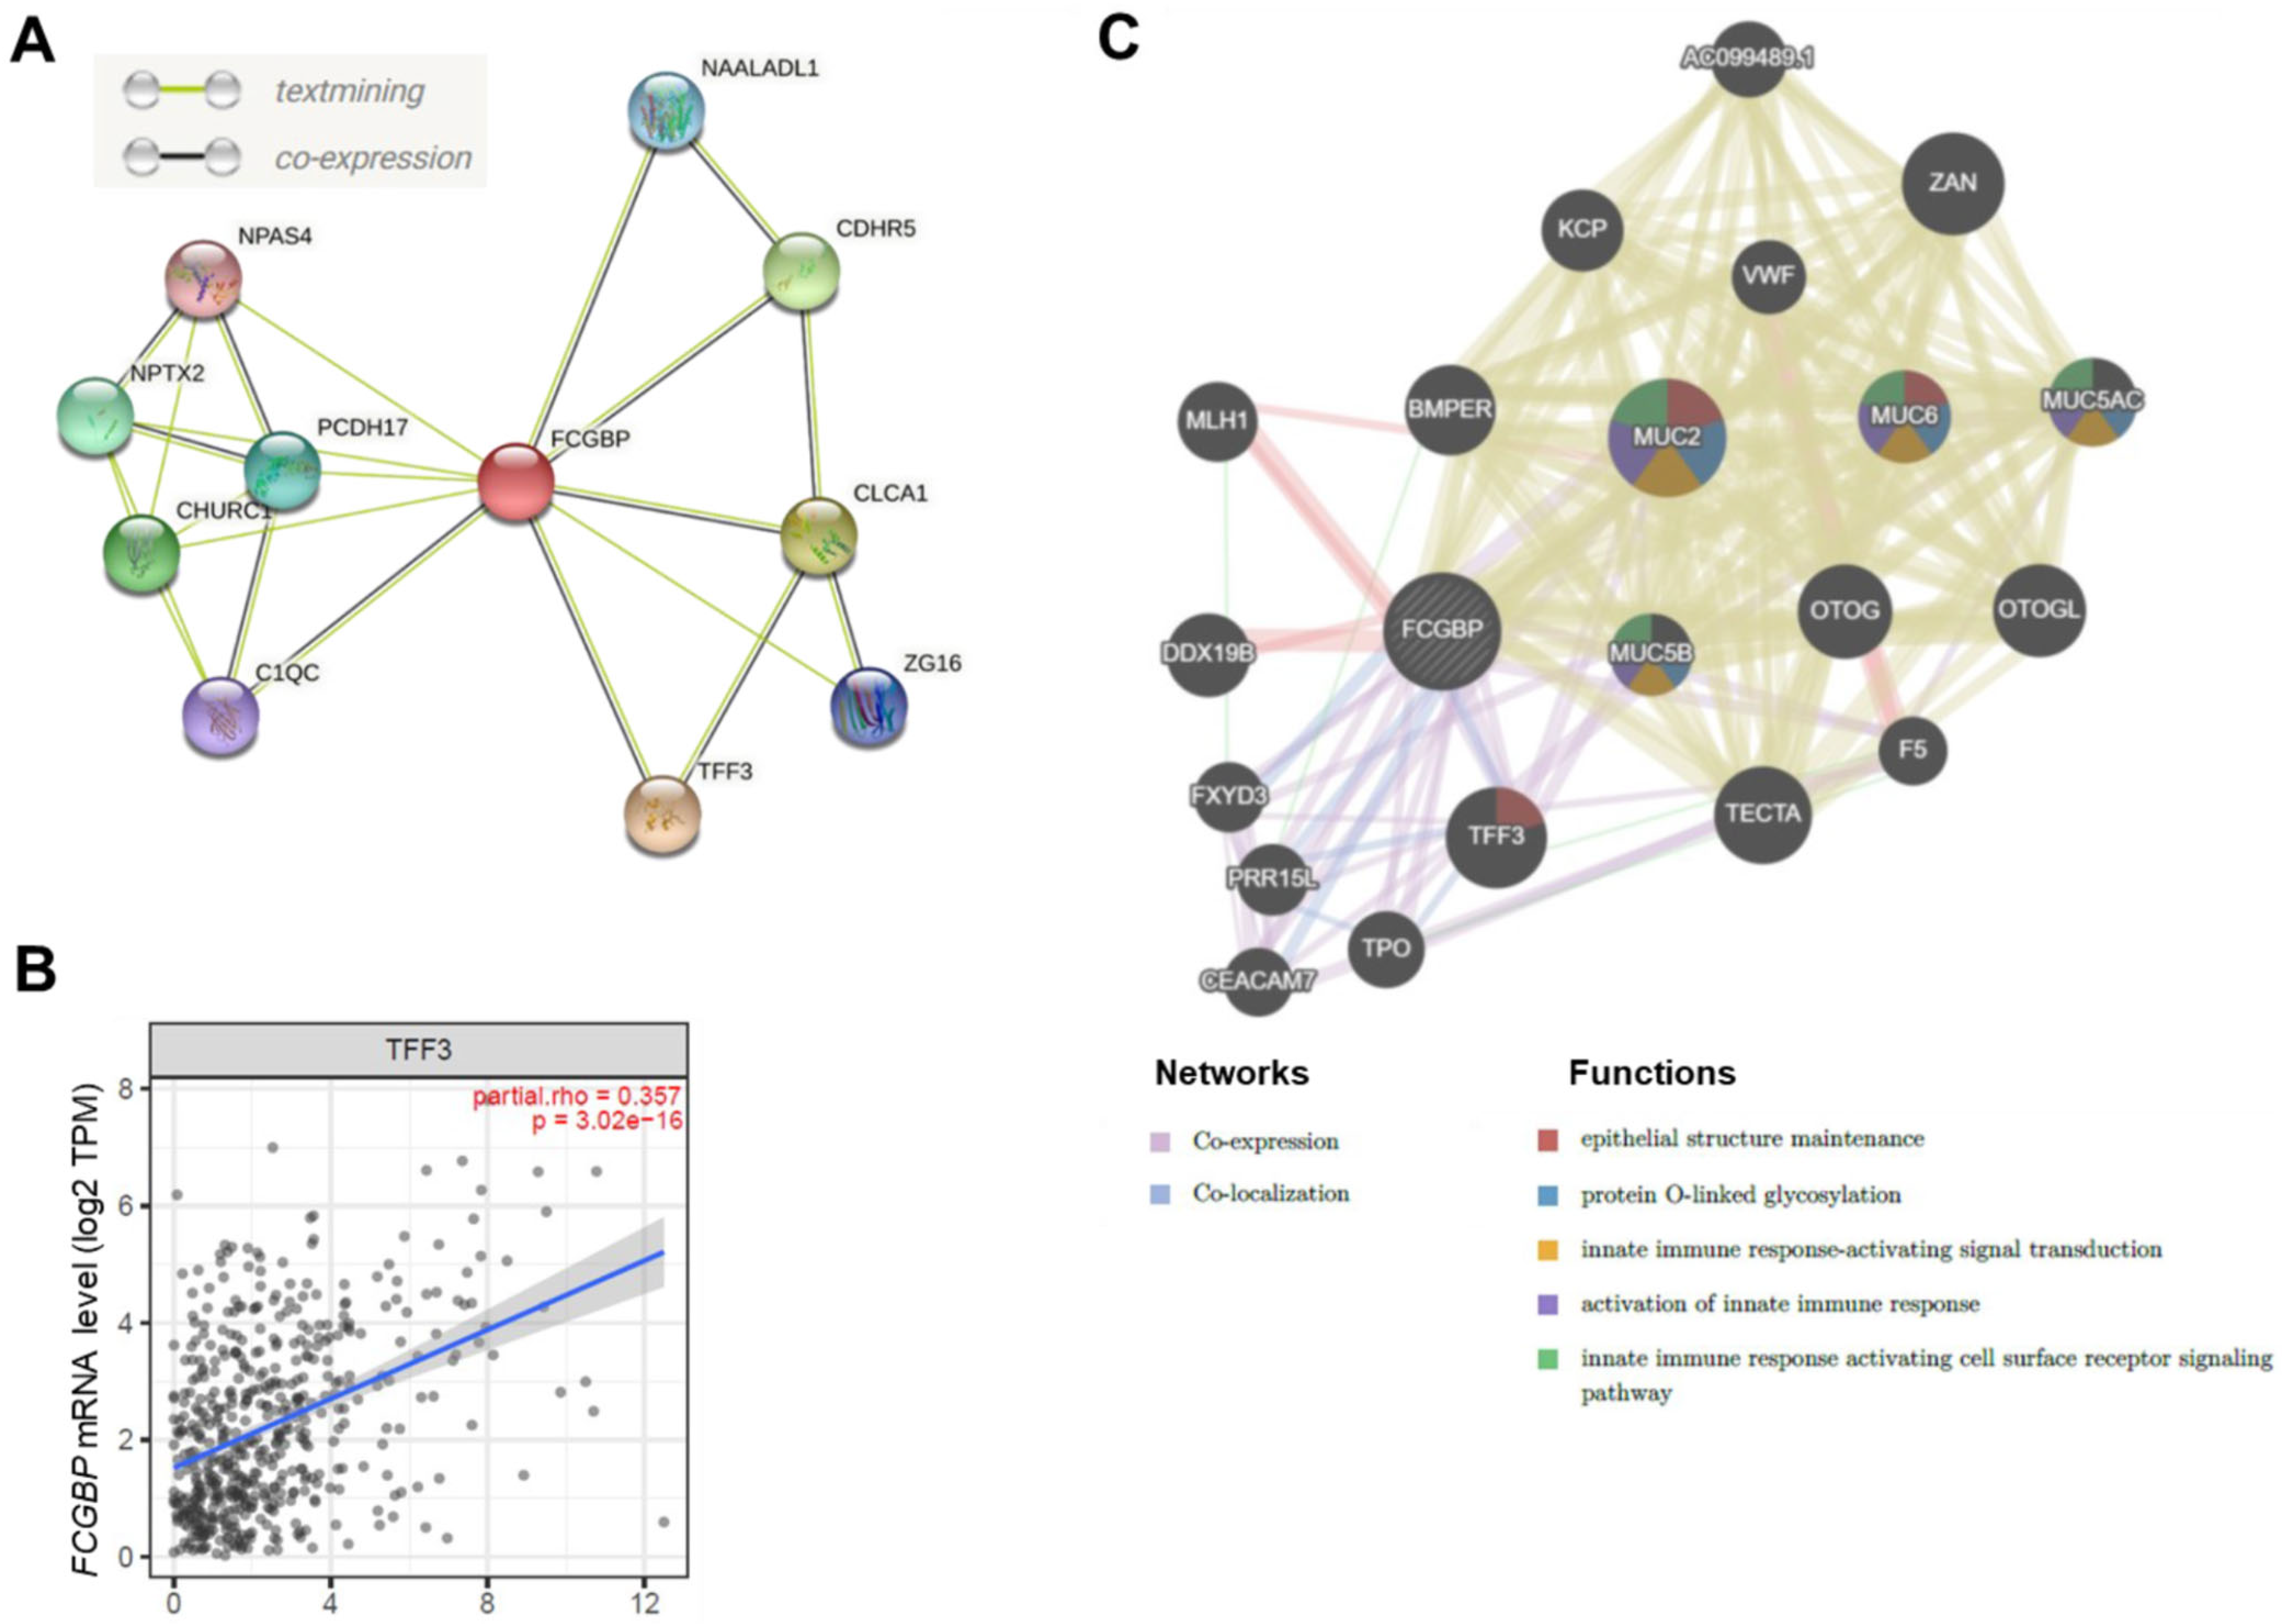
3.4. The FCGBP Correlated with Several Proteins in HNSC Patients

To further explore the interaction between FCGBP and potential proteins in HNSC, we used the STRING database and identified10 proteins that may interact with FCGBP (Figure 4A). Intersecting the corresponding genes of the 10 co-expressed proteins with the FCGBP-associated co-expressed genes identified by LinkedOmics, four [TFF3 (p = 8.27 × 10⁻¹⁷), N-acetylated alpha-linked acidic dipeptidase like 1 (NAALADL1) (p = 6.29 × 10⁻⁸), zymogen granule protein 16 (G16) (p = 4.72 × 10⁻³), and complement C1q C chain (C1QC) (p = 5.93 × 10⁻³)] were found with statistical significance (Supplementary Table S2). We next validated these proteins at the mRNA level by TIMER2.0 and found that all of these were significantly correlated to the FCGBP level (p < 5 × 10⁻³, Supplementary Table S2).
Notably, TFF3 ranks at the top one with a significant correlation (r = 0.357, p = 3.02 × 10⁻¹⁶) (Figure 4B). TFF3 closely interact with epidermal growth factor receptor (EGFR, combined score = 0.983) (Supplementary Table S2) through STRING analysis (Supplementary Figure S2A). In addition, TFF3 downregulation in HNSC tissues, and there is a trend that high-TFF3 is associated with better OS (Supplementary Figure S2B,C). These findings suggest that FCGBP and its co-expression with TFF3 may collectively contribute to a better survival in HNSC. GeneMania further demonstrated that FCGBP co-expressed and co-localized with TFF3 (Figure 4C). Functional analysis of these differentially expressed transcripts revealed that FCGBP may relate to epithelial structure maintenance, protein O-linked glycosylation, and innate immune response (FDR < 0.05, Figure 4C).

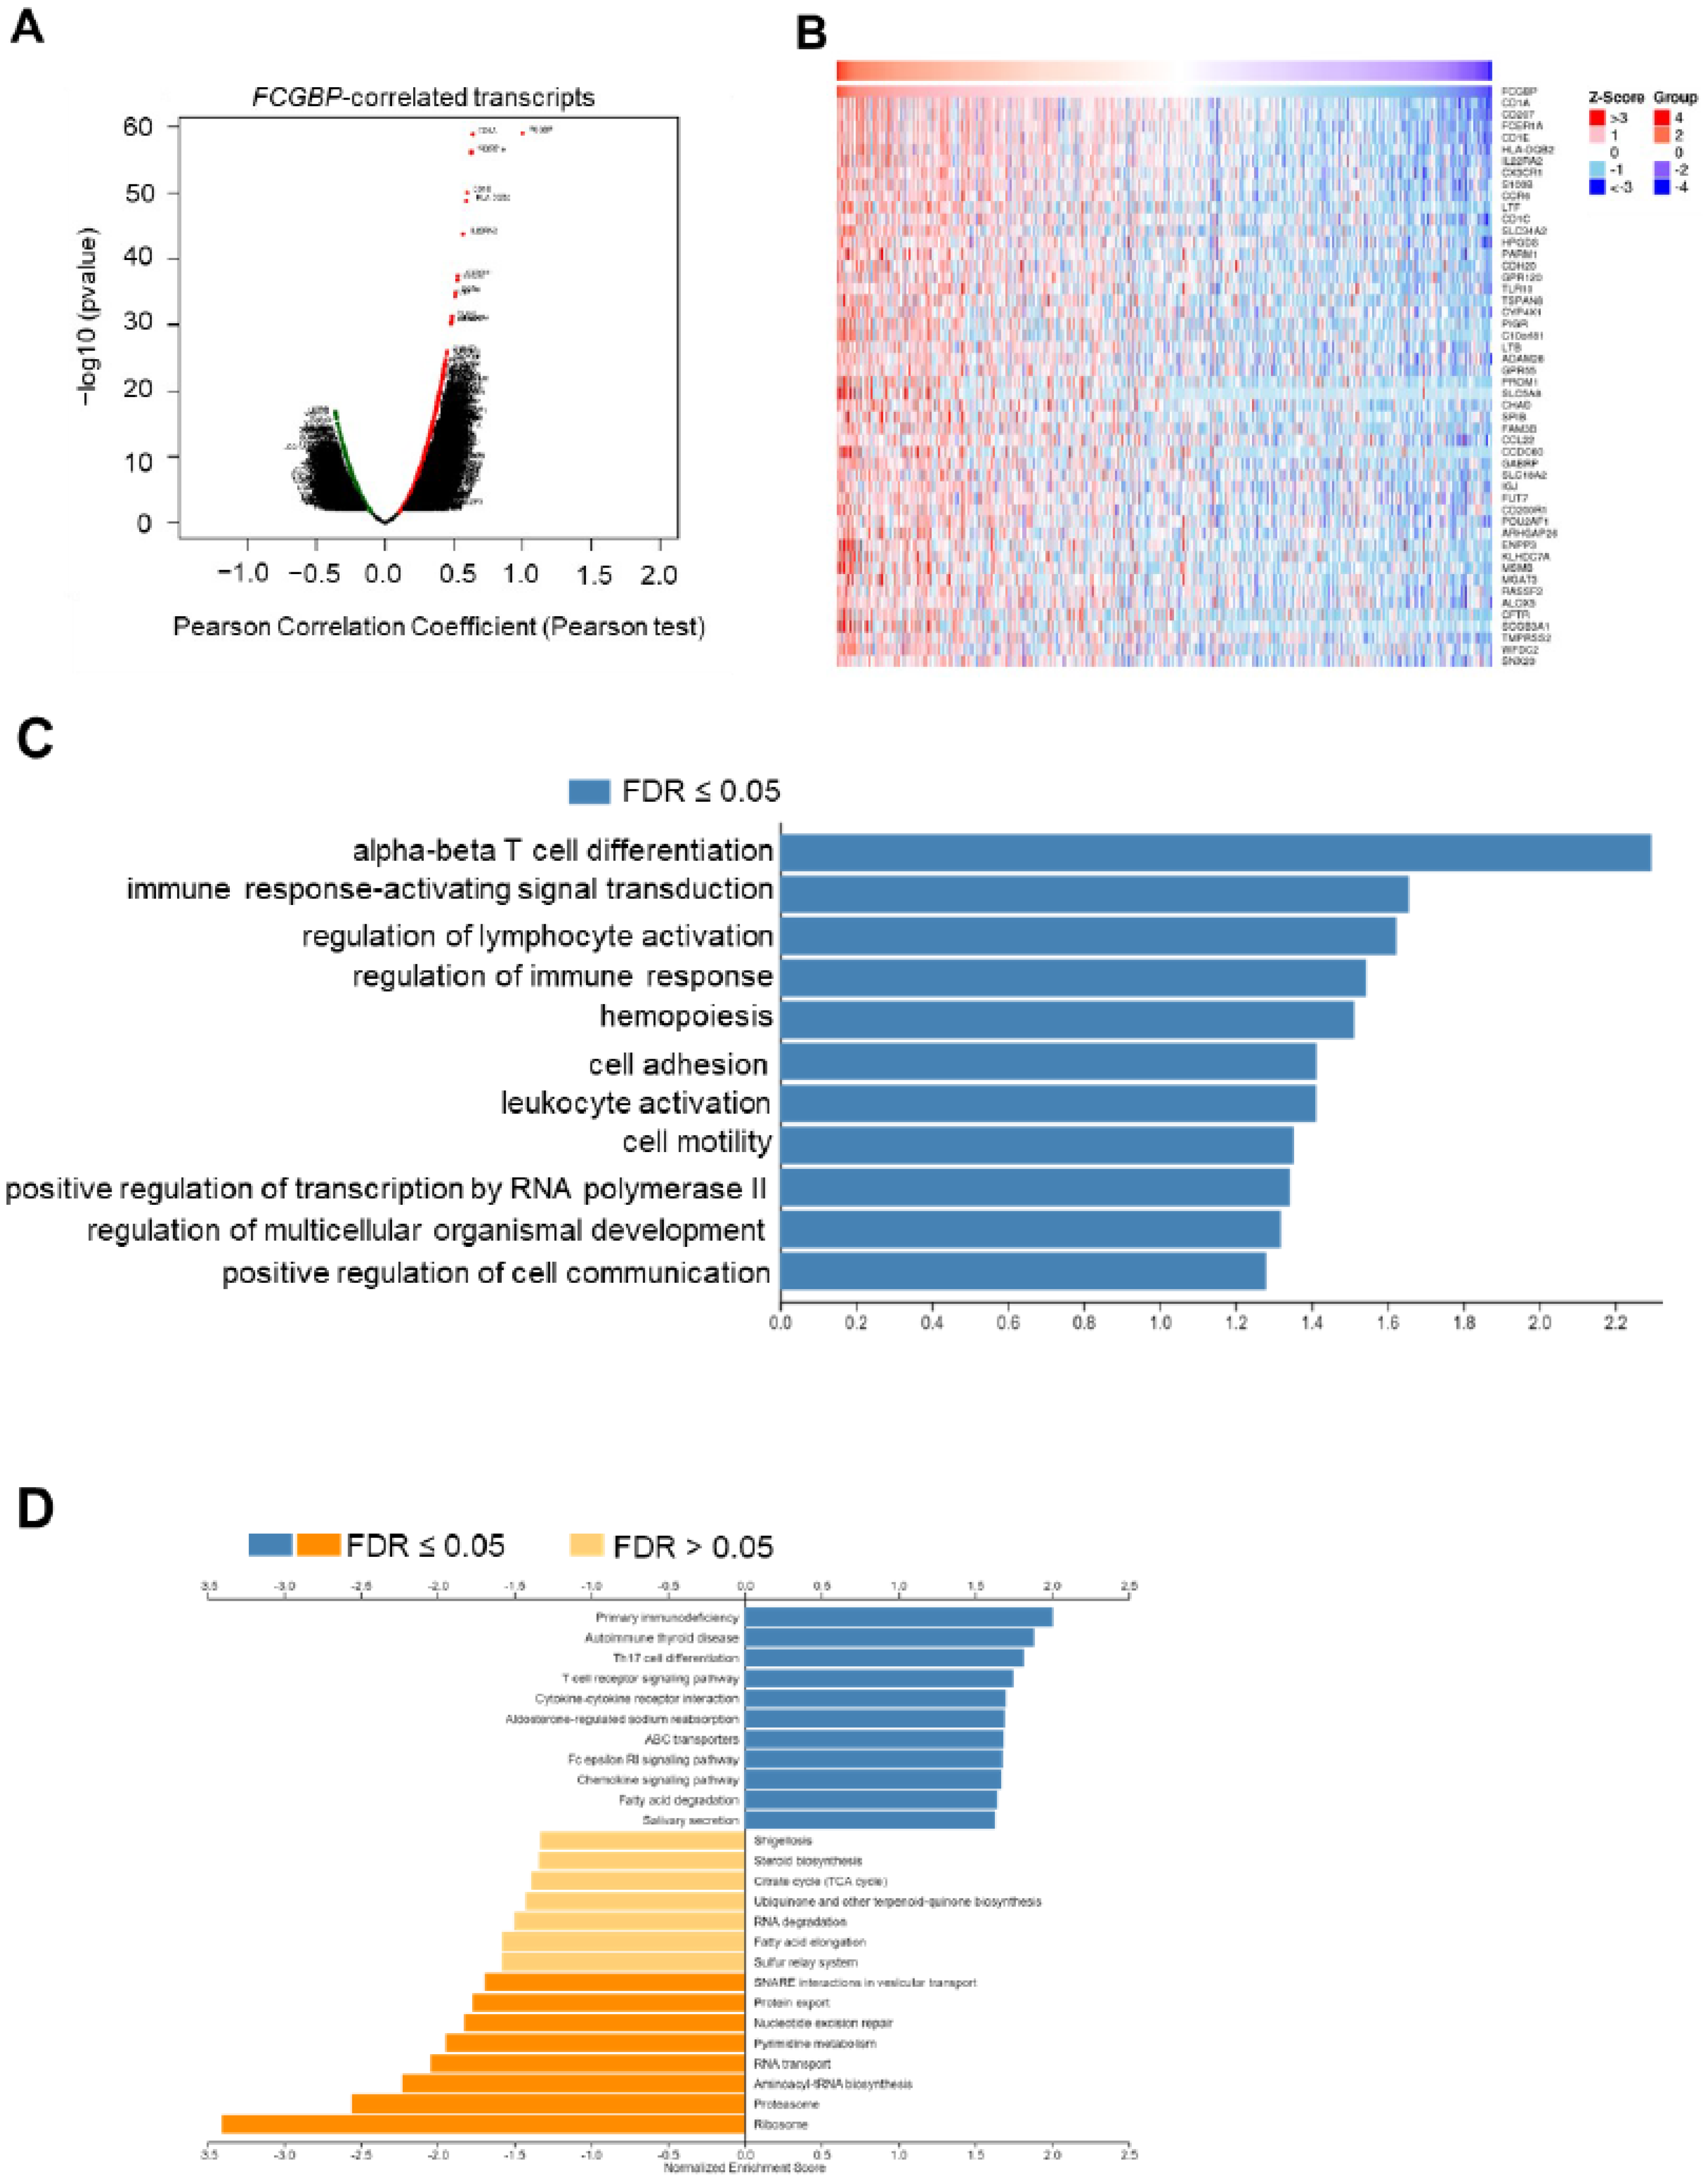
3.5. Functional Enrichment Analysis of FCGBP and Co-Expressed Genes in HNSC

To explore the potential functions and pathways of FCGBP in HNSC, we identified a total of 10,116 significantly correlated genes by the LinkedOmics database shown in volcano plot (p < 0.01 and FDR < 0.01, Figure 5A). Figure 5B shows the top 50 genes which were positively correlated to the FCGBP level. Further functional enrichment of biologic process (Figure 5C) of the GO analysis revealed that the GO function of the co-expressed genes is shown as enriched bar diagrams. The most significant enriched GO term at the biologic process level was ‘alpha-beta T cell differentiation (enrichment ratio = 2.29)’ (Figure 5C). Other GO terms include ‘immune response-activating signal transduction (enrichment ratio = 1.66)’, ‘regulation of lymphocyte activation (enrichment ratio = 1.62)’, and ‘regulation of immune response (enrichment ratio = 1.54)’ (p < 0.05 and FDR < 0.05, Figure 5C). Further GSEA on KEGG pathways showed that the enrichment terms of these co-expressed genes are predominantly involved in immune and inflammatory responses, including ‘Th17 cell differentiation’, ‘T cell receptor signaling pathways’, ‘cytokine-cytokine receptor interaction’, and ‘chemokine signaling pathway’, indicating that the FCGBP may be an immune-related factor in HNSC (FDR < 0.05, Figure 5D).

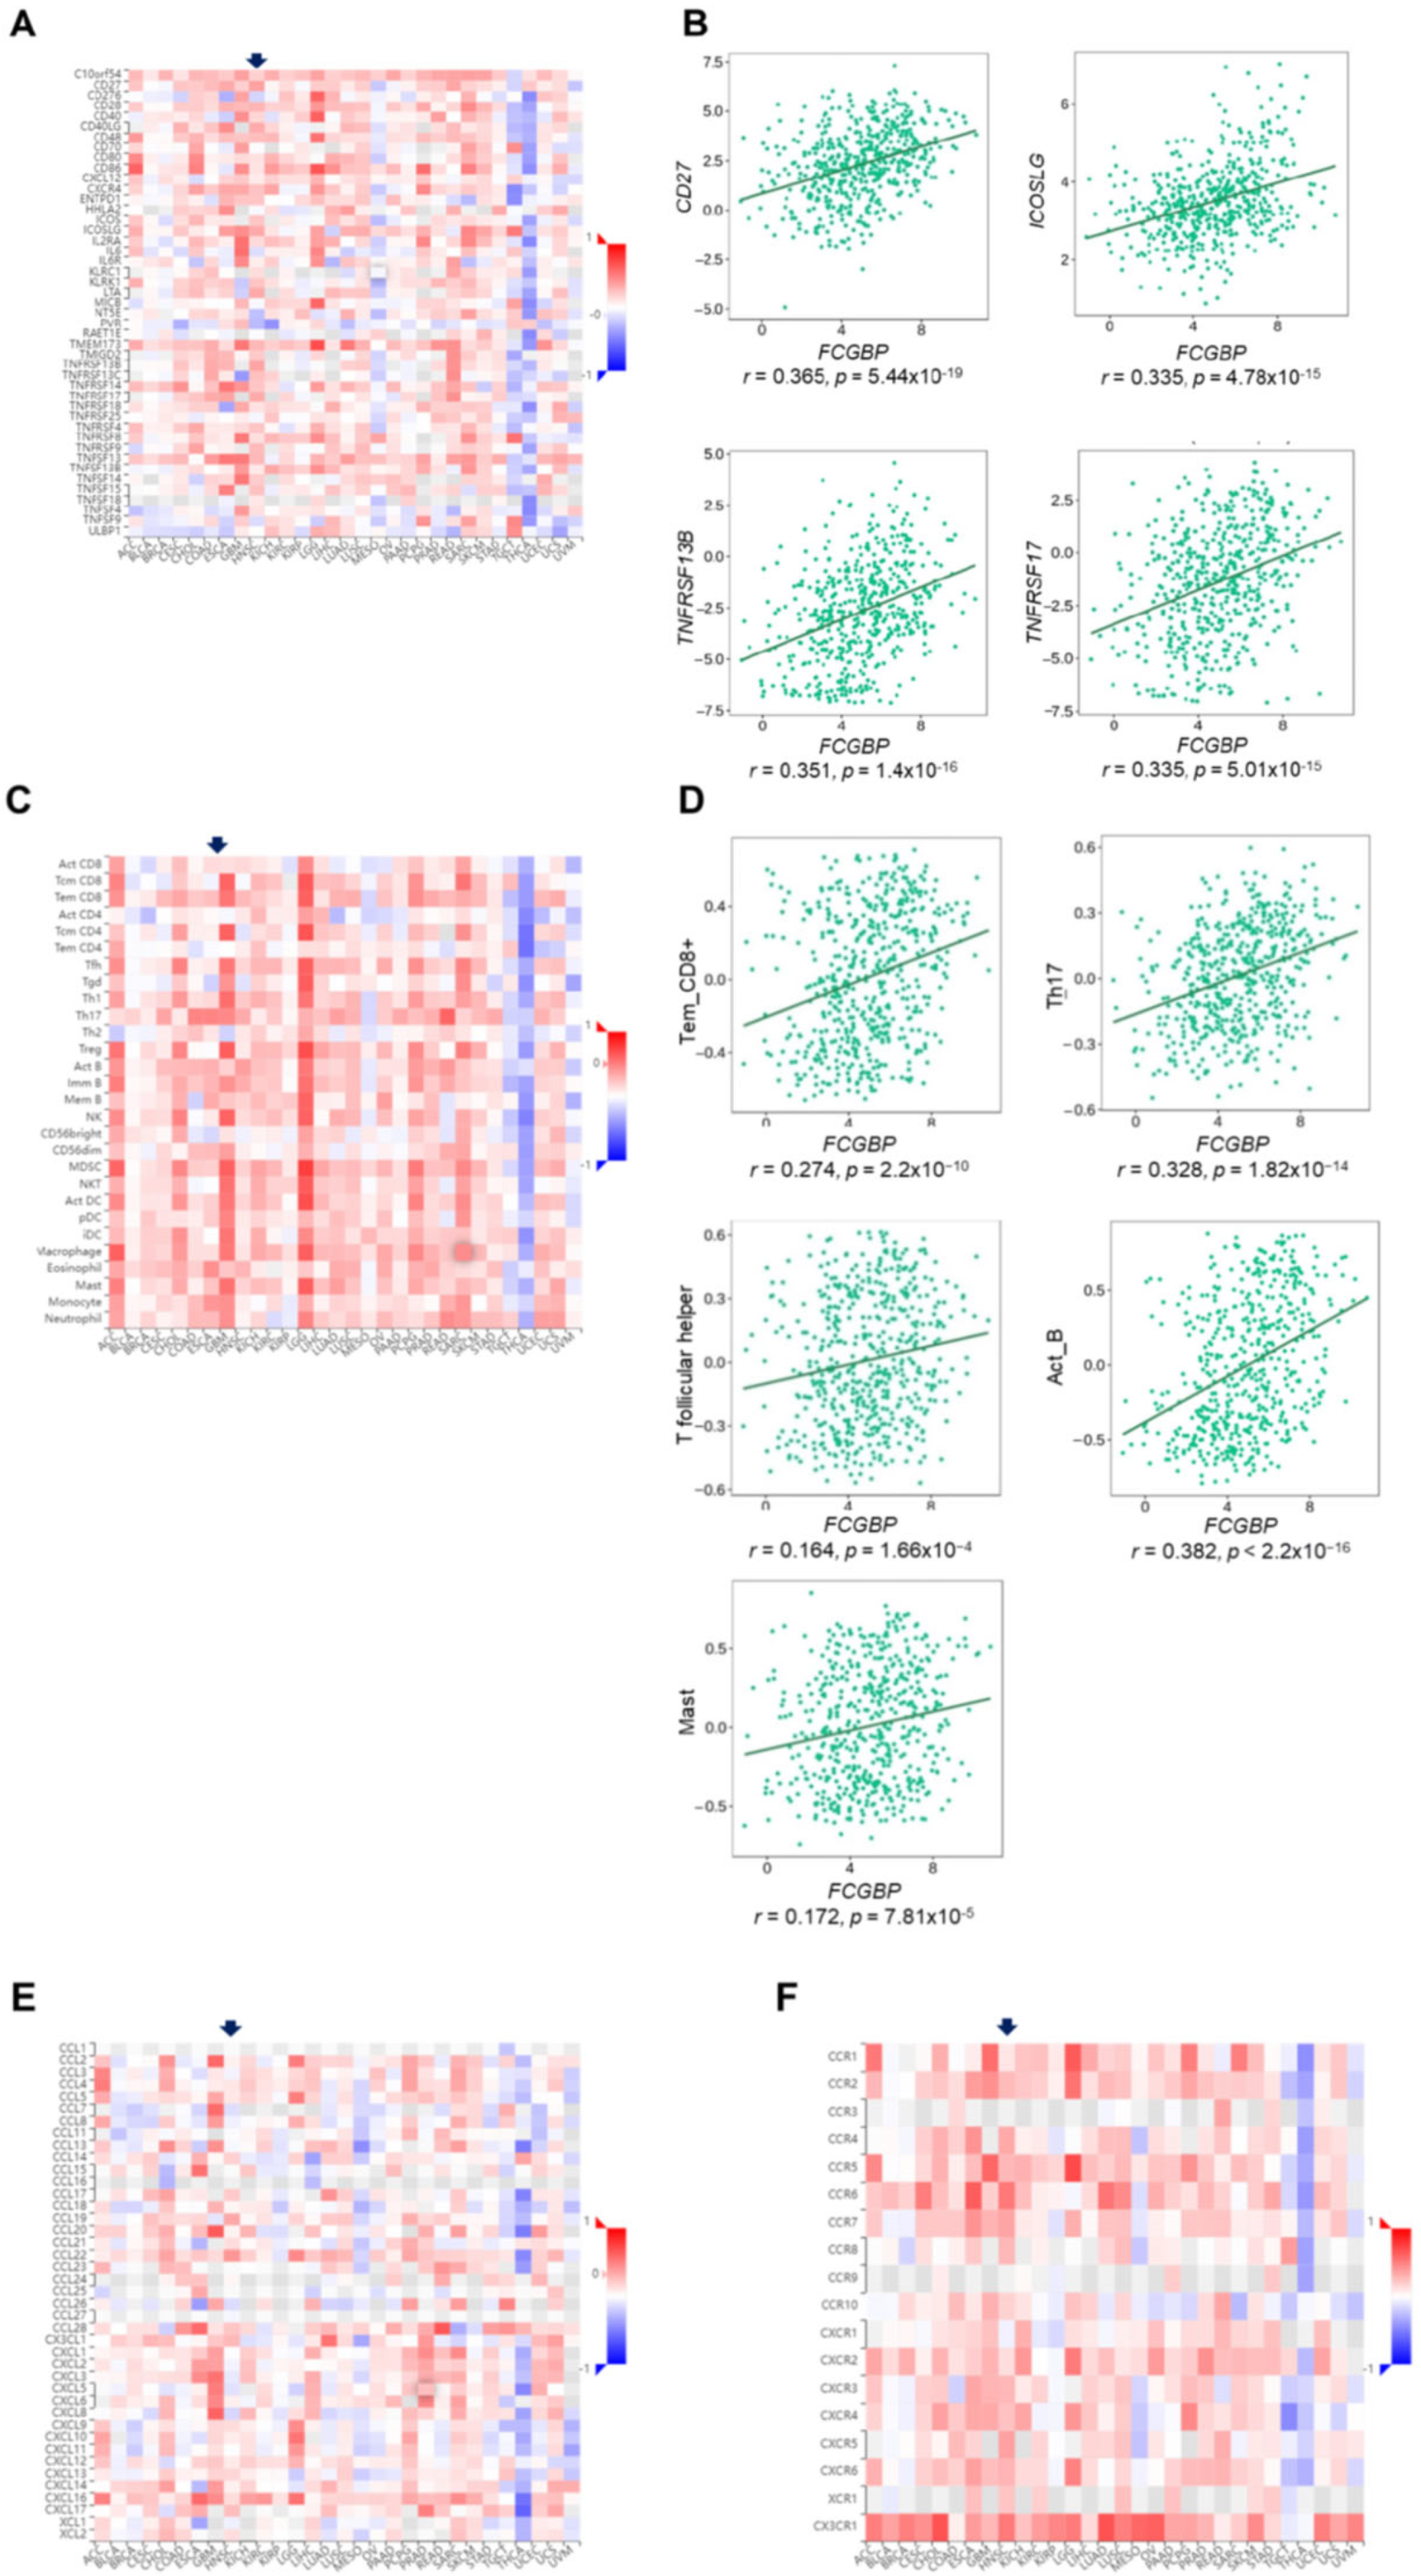
3.6. The FCGBP Level Correlates to Immunomodulators and Immune-Related Molecules, and the Abundance of Infiltration of Immune Cells

We evaluated the association of the FCGBP level and immunomodulators on the TISIDB database. The FCGBP levels positively correlated to immunostimulators across various tumors (Figure 6A). In 522 HNSC, the FCGBP level positively correlated to most stimulators. The top four stimulators are CD27 molecule (CD27) (r = 0.365, p = 5.44 × 10⁻¹⁹), TNF receptor superfamily member 13B (TNFRSF13B) (r = 0.351, p = 1.4 × 10⁻¹⁶), inducible T cell costimulatory ligand (ICOSLG) (r = 0.335, p = 4.78 × 10⁻¹⁵), and TNF receptor superfamily member 17 (TNFRSF17) (r = 0.335, p = 5.01 × 10⁻¹⁵) (Figure 6B). These findings suggested that low FCGBP levels may relate to immune tolerance in HNSC since high FCGBP accompanied with better immune responses.
We next performed a comprehensive screening on the infiltration of immune cells using the TISIDB database (Figure 6C). TIMER2.0 identified the meaningful infiltrated immune cells in the same directions with different algorithms. The FCGBP level correlated with infiltration rates of effector memory CD8+ T cells (Tem_CD8+, r = 0.274, p = 2.2 × 10⁻¹⁰), Type 17 helper cells (Th17, r = 0.328, p = 1.82 × 10⁻¹⁴), T follicular helper cells (Tfh, r = 0.164, p = 1.66 × 10⁻⁴), activated B cells (Act_B, r = 0.382, p < 2.2 × 10⁻¹⁶), and mast cells (Mast, r = 0.172, p = 7.81 × 10⁻⁵) (Figure 6D). To additionally strengthen the role of FCGBP in identified immune cells, we explored the association between the FCGBP level and the respective immune markers. Most markers were strongly associated with the FCGBP level in HNSC (Table 2), suggesting that FCGBP was strongly associated with tumor-infiltrating immune cells in HNSC. Moreover, consistent survival trends for the FCGBP level and involving immune cells existed. The survivals of patients with low infiltration immune cells were worse than those with high infiltration (Supplementary Figure S3).
Further TISIDB analysis on the correlations between the FCGBP level, chemokines, and receptors showed that FCGBP might regulate various immune molecules (Figure 6E,F). The top two molecules and receptors with high correlations were C-C motif chemokine ligand 22 (CCL22) and CCL19, and C-C motif chemokine receptor 6 (CCR6) and C-X3-C motif chemokine receptor 1 (CX3CR1), respectively. These findings further suggest that FCGBP and its co-expressed genes may participate in the immune response of the HNSC tumor microenvironment. In addition, we verified the relationship between FCGBP and immune checkpoints, which revealed that the FCGBP level positively associated with those of CTLA4 (r = 0.295, p = 2.56 × 10⁻¹¹), HAVCR2 (r = 0.225, p = 4.41 × 10⁻⁷), LAG3 (r = 0.162, p = 3.1 × 10⁻⁴), PDCD1 (r = 0.303, p = 6.95 × 10⁻¹²) (Table 2). The differential expression levels of various immune checkpoints with FCGBP expression may suggest the use of immunotherapy.

4. Discussion

This study found that the FCGBP can be used as an independent prognostic factor in head and neck squamous cell carcinoma, regardless of the HPV infection status. One of the potential mechanisms underlying the association of low-FCGBP with poor prognosis was downregulated FCGBP correlated to a higher TP53 mutation rate. Moreover, FCGBP correlates to TFF3, a prognostic biomarker in various cancers, at transcriptional and translational levels. An additional reason for the predictive value of FCGBP is its ability to regulate the immune responses of the HNSC tumor microenvironment, since FCGBP associated co-expressed genes were predominantly enriched in immune responses. Further, FCGBP mRNA level was significantly associated with those of various immune stimulators and immune molecules and regulated the infiltration rates of immune cells.
The potential roles of FCGBP in cancer initiation, progression, and prognoses have been proposed in certain malignancies. FCGBP represents the most under-expressed gene in the TGF-β-induced gallbladder carcinoma-derived cells compared to a normal cell line, suggesting its role in TGFβ-induced EMT to drive metastatic behaviors [16]. However, high FCGBP protein levels in human specimens correlated to increased incidence of metastasis and better OS [16]. Moreover, the FCGBP protein levels in colorectal cancer, were lower in metastatic tissues than in the paired primary tumors, and validated as an independent prognostic factor for metastatic colon cancer [17]. In HNSC, immunohistochemistry demonstrated that the FCGBP protein levels were lower in cancer tissues than noncancerous tissues retrieved from the surgical margin [19]. Similarly, the FCGBP level in cancer tissues is higher in HPV-related than HPV-unrelated HNSC, and these findings are consistent with the prediction by the CTPAC analysis. Further functional analysis validated the effects of FCGBP on HNSC behaviors, whereas its overexpression in FaDu cells and Cal-27 cells decreased proliferation and inhibited EMT. Moreover, both mRNA and protein levels of TGFβ were negatively correlated to FCGBP, and further evidence indicates that FCGBP level decreased by TGFβ treatment and increased by E6 overexpression, suggesting that upregulated FCBGP may contribute to suppression of HNSC [19].
TP53 may play a role in the pathogenesis of FCGBP in HNSC; our results showed that TP53 was the most frequently altered gene with FCGBP alteration, and the tendency for the co-occurred alterations of TP53 and FCGBP is significant. Further evidence strengthened the correlation between FCGBP and TP53 was a significant correlation between FCGBP and TP53 targeted genes, including BBC3, MDM2, PMAIP1, RBM10, ZMAT3 and MLH1. TP53 primarily acts as a tumor suppressor in head and neck cancer. Recent studies have pointed out that, in addition to controlling various cellular processes (e.g., apoptosis, cell cycle, senescence) in response to cellular stress to antagonized malignant progression [31], the TP53-mediated tumor suppression also involved activation of ferroptosis [32], remodeling cancer metabolism [33], inhibition of cellular self-renewal [34], ensuring genomic integrity [35], and maintenance a tumor-suppressive immune response [36]. TP53 may also modulate a target gene network to suppress tumorigenesis [35,37]. Through in vivo shRNA and CRISPR/Cas9 screens, the tumor suppressors ZMAT3 [35,37] and MLH1 [35] were identified as predominant TP53 target effectors to the TP53-mediated tumor suppression program. In our correlation analysis, the FCGBP level positively associated with ZMAT3 and MLH1 irrespective of the HPV status, and these findings may partially explain the inverse relationships of FCGBP level with AJCC T classification and AJCC stage from the perspective of the role of TP53 in HNSC.
Current bioinformatics analysis demonstrated an inverse relationship between TP53 mutation, the most frequently mutated gene (69.3%) in HNSC in the Pan-Cancer Atlas (TCGA), and the FCGBP level. The majority of TP53 mutations are missense mutations, and the most common TP53 mutations occur mainly in the DNA-binding domain to affect DNA binding residues or cause conformational change to prevent DNA binding [38]. The consequence includes the loss of the transcriptional function of wild-type (WT) TP53, dominant-negative activity that mutant TP53 suppresses the ability of WT TP53, and/or gain-of-function that mutant TP53 acquire oncogenic activities independently of WT TP53 [38]. Despite TP53 mutation not necessarily causing attenuation of TP53 activity, a genomic investigation of the TCGA consisting of 279 HNSC patients identified the most significant mutations leading to TP53 inactivation were TP53 (84%) and CDKN2A (57%) in HPV-unrelated HNSC [39]. Of interest, the study identified a subgroup of oral cavity cancer patients with favorable outcomes characterized by reduced copy number alteration in conjugation with inactivating CASP8 mutations and WT TP53 [39]. Further computational analysis of 415 HNSC patients in TCGA otherwise demonstrated TP53 mutation is an independent prognostic factor for reduced overall survival, although the impact is affected by the types of mutations and the localization of the mutation within TP53 [40]. More specific analyses on the transactivation activity of mutant TP53 showing the nonfunctional TP53 mutation is indicative of reduced response to cisplatin and fluorouracil [41]. Accordingly, these findings may suggest that FCGBP downregulation in HNSC predicted worse survivals to a certain extent, especially in the HPV-unrelated HNSC since TP53 is rarely altered in HPV-related HNSC [39].
Another possible mechanism for low FCGBP as an inferior prognostic factor in HNSC is TFF3 might interact with FCGBP. In the genetic network analysis, FCGBP and TFF3 are co-expressed and co-localized, revealing their associations at transcriptional and translational levels. TFF3 is a secretory lectin and represents the predominant TFF peptide of human saliva and esophageal secretions [42,43]. Physiologically, TFF3 may bind FCGBP to form a heterodimer to protect the mucosa by reinforcing innate immunity [9,44]. Interestingly, TFF3 has multifaceted effects from a pre-neoplastic lesion to invasive cancer, and the roles in several cancer subtypes have been extensively discussed [45,46,47]. In colorectal cancer, TFF3 promotes proliferation, invasion, and migration by enhancing CD147–CD44 interaction to activate transcription 3 (STAT3) and prostaglandin G/H synthase 2 (PTGS2) expression [46]. In prostate cancer, TFF3 silencing induced mitochondria-mediated apoptosis, thus suppressing tumor growth and migration [47]. The roles of TFF3 in promoting tumor progression were also well established in breast, cervical, hepatocellular, and gastric cancers and glioblastoma. However, TFF3 contrarily acts as a tumor suppressor in retinoblastoma [45]. Since protein–protein interaction is essential in the molecular mechanisms underlying carcinogenesis and cancer progression and aggressiveness, aberrant FCGBP expression may regulate cancer behaviors by functional interactome linking with TFF3. Our results may potentially rationalize the assumption because TFF3 level, such as FCGBP expression, was reduced in HNSC tissue, and survival decreased in patients with HNSC of downregulated TFF3. Another supporting finding is that FCGBP in thyroid cancer can functionally synergize with TFF3 through genetic co-expression, and thus contributing to poor survival in thyroid cancer patients with low TFF3 level [48].
In addition, FCGBP may participate in the immune response in the tumor microenvironment of HNSC. Our GO analysis results demonstrated that the FCGBP-associated co-expressed genes were primarily enriched in immune and inflammatory responses, including ‘regulation of lymphocyte activation’, ‘regulation of immune response’, and ‘immune response-activating signal transduction’ for GO at the biological process level. Our GSEA results of the KEGG pathway also revealed that the enriched terms are predominantly related to the immune process, including ‘T cell receptor signaling pathways’, ‘cytokine–cytokine receptor interaction’, and ‘chemokine signaling pathways’. Altogether, these findings imply that FCGBP levels may be related to the immune interaction with HNSC. FCGBP may be involved in the tumor microenvironment of HNSC to regulate cancer development because cytokines and chemokines are critical noncellular components of the tumor microenvironment [49].
Further exploration of the association of FCGBP expression with diverse immune molecules and immune-stimulator genes may support the assumption that most of them are significantly correlated to FCGBP level. Thus, we analyzed the composition of tumor-infiltrating immune cells correlating to FCGBP levels in HNSC samples. The FCGBP level was positively associated with infiltration rates of CD8+ T-cell, T17 lymphocyte, B-cell, mast cell, and follicular helper T-cell. The correlation was strengthened with the strong associations of the FCGBP level with those of most of these cells’ type-specific markers irrespective of the HPV infection status. Previous investigations have pointed out that the dense infiltration of the CD8+ T cells within tumor microenvironment confers a favorable prognosis for its antitumor property [50,51], we hypothesized that a low FCGBP level in the tumor tissue might shape the tumor microenvironment in an immune-suppressed state. There is a consistent survival trend between the FCGBP level and immune cell abundance, i.e., the survival is worse in low-abundant immune cells. Consequently, the predictive value of FCGBP, at least, might result from better immune control from the perspective of immune infiltration.
This study has some limitations. First, the study used heterogeneous datasets in different databases; therefore, the analysis by the other platforms may produce inconsistent results. Except for GeneMania and STRING, all other studies used available data from TCGA with different platforms. Because the required raw data for each analysis may be unavailable in the cohort, the total number of HNSC recruited differs by different analyses. Nonetheless, despite the slight difference in recruited samples in each analysis, the overall trend for FCGBP was present. For example, FCGBP was an independent prognostic factor for both HPV-related and HPV-unrelated HNSCs since the HPV status may cause a distinct difference in cancer behaviors of HNSC. Second, although other datasets have validated the findings of TCGA; the results should be extrapolated cautiously to non-primary ethnicities. Third, we explored the role of FCGBP in HNSC from a survival perspective, the effects of chemotherapy and radiation therapy cannot be ignored. Although we can forecast drug sensitivity from bioinformatics prediction, the complexity of treatment, for example, treatment intensity or treatment sequence may make us overestimate or underestimate the role of FCGBP. Future experiments focusing on validating the present predictions are warranted to improve the value of FCGBP application in HNSC.

5. Conclusions

Taken together, FCGBP level was significantly reduced in HNSC tissues, and a high-FCBGP level indicated favorable prognoses. Further analyses demonstrated that FCGBP alteration significantly co-occurred with that of TP53, and FCGBP levels were negatively associated with the TP53 mutation rate. Additionally, FCGBP might interact with TFF3, an essential protein in the pathogenesis of several cancers. With the finding that FCGBP level significantly correlates with infiltration rates of various immune cells and expression levels of immune molecules to possibly regulate the immune response of the tumor microenvironment, FCGBP may be a potential prognostic biomarker in head and neck squamous cell carcinoma. However, further studies are needed to clarify these.

Supplementary Materials

The following are available online at https://www.mdpi.com/article/10.3390/diagnostics12051178/s1, Table S1. Correlations between FCGBP alterations and top altered genes in HNSC patients (n = 522). Table S2. Intersection analysis of interacted proteins with FCGBP and FCGBP-associated co-expressed genes. Figure S1. The correlations between FCGBP and the target genes of TP53. Figure S2. The interacting network, expression levels, and survival analysis of TFF3. Figure S3. Survival analyses by high- and low- levels of FCGBP and infiltration rates of immune cells.

Author Contributions

Conception and design: Y.-H.L., Y.-F.Y., Y.-L.S. Collection and assembly of data: Y.-H.L., Y.-F.Y., Y.-L.S. Data analysis and interpretation: Y.-H.L., Y.-F.Y., Y.-L.S. Manuscript writing: Y.-H.L., Y.-L.S. Final approval of manuscript: Y.-H.L., Y.-F.Y., Y.-L.S. All authors have read and agreed to the published version of the manuscript.

Funding

This study was supported by grants from the Ministry of Science and Technology, Taipei, Taiwan (MOST-110-2314-B-075B-014).

Institutional Review Board Statement

The protocol of this study was approved by the institutional review board of Kaohsiung Veterans General Hospital.

Informed Consent Statement

Not applicable.

Data Availability Statement

The data presented in this study are available on request from the corresponding author.

Conflicts of Interest

The authors declare no conflict of interest.

References

  1. Bray, F.; Ferlay, J.; Soerjomataram, I.; Siegel, R.L.; Torre, L.A.; Jemal, A. Global cancer statistics 2018: GLOBOCAN estimates of incidence and mortality worldwide for 36 cancers in 185 countries. CA Cancer J. Clin. 2018, 68, 394–424. [Google Scholar] [CrossRef] [PubMed] [Green Version]
  2. D’Souza, G.; Westra, W.H.; Wang, S.J.; van Zante, A.; Wentz, A.; Kluz, N.; Rettig, E.; Ryan, W.R.; Ha, P.K.; Kang, H.; et al. Differences in the Prevalence of Human Papillomavirus (HPV) in Head and Neck Squamous Cell Cancers by Sex, Race, Anatomic Tumor Site, and HPV Detection Method. JAMA Oncol. 2017, 3, 169–177. [Google Scholar] [CrossRef] [PubMed]
  3. Grulich, A.E.; Jin, F.; Conway, E.L.; Stein, A.N.; Hocking, J. Cancers attributable to human papillomavirus infection. Sex. Health 2010, 7, 244–252. [Google Scholar] [CrossRef] [PubMed]
  4. Wiest, T.; Schwarz, E.; Enders, C.; Flechtenmacher, C.; Bosch, F.X. Involvement of intact HPV16 E6/E7 gene expression in head and neck cancers with unaltered p53 status and perturbed pRb cell cycle control. Oncogene 2002, 21, 1510–1517. [Google Scholar] [CrossRef] [Green Version]
  5. Rettig, E.M.; D’Souza, G. Epidemiology of head and neck cancer. Surg. Oncol. Clin. N. Am. 2015, 24, 379–396. [Google Scholar] [CrossRef]
  6. Kobayashi, K.; Ogata, H.; Morikawa, M.; Iijima, S.; Harada, N.; Yoshida, T.; Brown, W.R.; Inoue, N.; Hamada, Y.; Ishii, H.; et al. Distribution and partial characterisation of IgG Fc binding protein in various mucin producing cells and body fluids. Gut 2002, 51, 169–176. [Google Scholar] [CrossRef] [Green Version]
  7. Denny, P.; Hagen, F.K.; Hardt, M.; Liao, L.; Yan, W.; Arellanno, M.; Bassilian, S.; Bedi, G.S.; Boontheung, P.; Cociorva, D.; et al. The proteomes of human parotid and submandibular/sublingual gland salivas collected as the ductal secretions. J. Proteome Res. 2008, 7, 1994–2006. [Google Scholar] [CrossRef] [Green Version]
  8. Li, C.; Wang, R.; Su, B.; Luo, Y.; Terhune, J.; Beck, B.; Peatman, E. Evasion of mucosal defenses during Aeromonas hydrophila infection of channel catfish (Ictalurus punctatus) skin. Dev. Comp. Immunol. 2013, 39, 447–455. [Google Scholar] [CrossRef]
  9. Albert, T.K.; Laubinger, W.; Müller, S.; Hanisch, F.G.; Kalinski, T.; Meyer, F.; Hoffmann, W. Human intestinal TFF3 forms disulfide-linked heteromers with the Mucus-Associated FCGBP protein and is released by hydrogen sulfide. J. Proteome Res. 2010, 9, 3108–3117. [Google Scholar] [CrossRef]
  10. Kim, M.; Lee, S.; Yang, S.K.; Song, K.; Lee, I. Differential expression in histologically normal crypts of ulcerative colitis suggests primary crypt disorder. Oncol. Rep. 2006, 16, 663–670. [Google Scholar] [CrossRef] [Green Version]
  11. Risques, R.A.; Lai, L.A.; Himmetoglu, C.; Ebaee, A.; Li, L.; Feng, Z.; Bronner, M.P.; Al-Lahham, B.; Kowdley, K.V.; Lindor, K.D.; et al. Ulcerative colitis-associated colorectal cancer arises in a field of short telomeres, senescence, and inflammation. Cancer Res. 2011, 71, 1669–1679. [Google Scholar] [CrossRef] [PubMed] [Green Version]
  12. Zhou, C.; Chen, H.; Han, L.; Xue, F.; Wang, A.; Liang, Y.J. Screening of genes related to lung cancer caused by smoking with RNA-Seq. Eur. Rev. Med. Pharmacol. Sci. 2014, 18, 117–125. [Google Scholar] [PubMed]
  13. Wang, A.; Wu, L.; Lin, J.; Han, L.; Bian, J.; Wu, Y.; Robson, S.C.; Xue, L.; Ge, Y.; Sang, X.; et al. Whole-exome sequencing reveals the origin and evolution of hepato-cholangiocarcinoma. Nat. Commun. 2018, 9, 894. [Google Scholar] [CrossRef] [PubMed]
  14. Gazi, M.H.; He, M.; Cheville, J.C.; Young, C.Y. Downregulation of IgG Fc binding protein (Fc gammaBP) in prostate cancer. Cancer Biol. Ther. 2008, 7, 70–75. [Google Scholar] [CrossRef] [Green Version]
  15. O’Donovan, N.; Fischer, A.; Abdo, E.M.; Simon, F.; Peter, H.J.; Gerber, H.; Buergi, U.; Marti, U. Differential expression of IgG Fc binding protein (FcgammaBP) in human normal thyroid tissue, thyroid adenomas and thyroid carcinomas. J. Endocrinol. 2002, 174, 517–524. [Google Scholar] [CrossRef] [PubMed] [Green Version]
  16. Xiong, L.; Wen, Y.; Miao, X.; Yang, Z. NT5E and FcGBP as key regulators of TGF-1-induced epithelial-mesenchymal transition (EMT) are associated with tumor progression and survival of patients with gallbladder cancer. Cell Tissue Res. 2014, 355, 365–374. [Google Scholar] [CrossRef] [PubMed] [Green Version]
  17. Yuan, Z.; Zhao, Z.; Hu, H.; Zhu, Y.; Zhang, W.; Tang, Q.; Huang, R.; Gao, F.; Zou, C.; Wang, G.; et al. IgG Fc Binding Protein (FCGBP) is Down-Regulated in Metastatic Lesions and Predicts Survival in Metastatic Colorectal Cancer Patients. Onco Targets Ther. 2021, 14, 967–977. [Google Scholar] [CrossRef]
  18. Choi, C.H.; Choi, J.J.; Park, Y.A.; Lee, Y.Y.; Song, S.Y.; Sung, C.O.; Song, T.; Kim, M.K.; Kim, T.J.; Lee, J.W.; et al. Identification of differentially expressed genes according to chemosensitivity in advanced ovarian serous adenocarcinomas: Expression of GRIA2 predicts better survival. Br. J. Cancer 2012, 107, 91–99. [Google Scholar] [CrossRef]
  19. Wang, Y.; Liu, Y.; Liu, H.; Zhang, Q.; Song, H.; Tang, J.; Fu, J.; Wang, X. FcGBP was upregulated by HPV infection and correlated to longer survival time of HNSCC patients. Oncotarget 2017, 8, 86503–86514. [Google Scholar] [CrossRef]
  20. Chen, S.M.Y.; Krinsky, A.L.; Woolaver, R.A.; Wang, X.; Chen, Z.; Wang, J.H. Tumor immune microenvironment in head and neck cancers. Mol. Carcinog. 2020, 59, 766–774. [Google Scholar] [CrossRef]
  21. Chow, L.Q.M.; Haddad, R.; Gupta, S.; Mahipal, A.; Mehra, R.; Tahara, M.; Berger, R.; Eder, J.P.; Burtness, B.; Lee, S.H.; et al. Antitumor Activity of Pembrolizumab in Biomarker-Unselected Patients with Recurrent and/or Metastatic Head and Neck Squamous Cell Carcinoma: Results from the Phase Ib KEYNOTE-012 Expansion Cohort. J. Clin. Oncol. 2016, 34, 3838–3845. [Google Scholar] [CrossRef] [PubMed]
  22. Tang, Z.; Kang, B.; Li, C.; Chen, T.; Zhang, Z. GEPIA2: An enhanced web server for large-scale expression profiling and interactive analysis. Nucleic Acids Res. 2019, 47, W556–W560. [Google Scholar] [CrossRef] [PubMed] [Green Version]
  23. Li, T.; Fan, J.; Wang, B.; Traugh, N.; Chen, Q.; Liu, J.S.; Li, B.; Liu, X.S. TIMER: A Web Server for Comprehensive Analysis of Tumor-Infiltrating Immune Cells. Cancer Res. 2017, 77, e108–e110. [Google Scholar] [CrossRef] [PubMed] [Green Version]
  24. Chandrashekar, D.S.; Bashel, B.; Balasubramanya, S.A.H.; Creighton, C.J.; Rodriguez, I.P.; Chakravarthi, B.V.S.K.; Varambally, S. UALCAN: A portal for facilitating tumor subgroup gene expression and survival analyses. Neoplasia 2017, 19, 649–658. [Google Scholar] [CrossRef]
  25. Chen, F.; Chandrashekar, D.S.; Varambally, S.; Creighton, C.J. Pan-cancer molecular subtypes revealed by mass-spectrometry-based proteomic characterization of more than 500 human cancers. Nat. Commun. 2019, 10, 5679. [Google Scholar] [CrossRef] [Green Version]
  26. Cerami, E.; Gao, J.; Dogrusoz, U.; Gross, B.E.; Sumer, S.O.; Aksoy, B.A.; Jacobsen, A.; Byrne, C.J.; Heuer, M.L.; Larsson, E.; et al. The cBio cancer genomics portal: An open platform for exploring multidimensional cancer genomics data. Cancer Discov. 2012, 2, 401–404. [Google Scholar] [CrossRef] [Green Version]
  27. Szklarczyk, D.; Gable, A.L.; Lyon, D.; Junge, A.; Wyder, S.; Huerta-Cepas, J.; Simonovic, M.; Doncheva, N.T.; Morris, J.H.; Bork, P.; et al. STRING v11: Protein-protein association networks with increased coverage, supporting functional discovery in genome-wide experimental datasets. Nucleic Acids Res. 2019, 47, 607–613. [Google Scholar] [CrossRef] [Green Version]
  28. Warde-Farley, D.; Donaldson, S.L.; Comes, O.; Zuberi, K.; Badrawi, R.; Chao, P.; Franz, M.; Grouios, C.; Kazi, F.; Lopes, C.T.; et al. The GeneMANIA prediction server: Biological network integration for gene prioritization and predicting gene function. Nucleic Acids Res. 2010, 38, W214–W220. [Google Scholar] [CrossRef]
  29. Vasaikar, S.V.; Straub, P.; Wang, J.; Zhang, B. LinkedOmics: Analyzing multi-omics data within and across 32 cancer types. Nucleic Acids Res. 2018, 46, D956–D963. [Google Scholar] [CrossRef] [Green Version]
  30. Ru, B.; Wong, C.N.; Tong, Y.; Zhong, J.Y.; Zhong, S.S.W.; Wu, W.C.; Chu, K.C.; Wong, C.Y.; Lau, C.Y.; Chen, I.; et al. TISIDB: An integrated repository portal for tumor-immune system interactions. Bioinformatics 2019, 35, 4200–4202. [Google Scholar] [CrossRef]
  31. Vousden, K.H.; Prives, C. P53 and prognosis: New insights and further complexity. Cell 2005, 120, 7–10. [Google Scholar] [PubMed] [Green Version]
  32. Chu, B.; Kon, N.; Chen, D.; Li, T.; Liu, T.; Jiang, L.; Song, S.; Tavana, O.; Gu, W. ALOX12 is required for p53-mediated tumour suppression through a distinct ferroptosis pathway. Nat. Cell Biol. 2019, 21, 579–591. [Google Scholar] [CrossRef] [PubMed]
  33. Morris, J.P., IV; Yashinskie, J.J.; Koche, R.; Chandwani, R.; Tian, S.; Chen, C.C.; Baslan, T.; Marinkovic, Z.S.; Sánchez-Rivera, F.J.; Leach, S.D.; et al. α-Ketoglutarate links p53 to cell fate during tumour suppression. Nature 2019, 573, 595–599. [Google Scholar] [CrossRef] [PubMed]
  34. Spike, B.T.; Wahl, G.M. p53, Stem Cells, and Reprogramming: Tumor Suppression beyond Guarding the Genome. Genes Cancer 2011, 2, 404–419. [Google Scholar] [CrossRef]
  35. Janic, A.; Valente, L.J.; Wakefield, M.J.; Di Stefano, L.; Milla, L.; Wilcox, S.; Yang, H.; Tai, L.; Vandenberg, C.J.; Kueh, A.J.; et al. DNA repair processes are critical mediators of p53-dependent tumor suppression. Nat. Med. 2018, 24, 947–953. [Google Scholar] [CrossRef]
  36. Blagih, J.; Zani, F.; Chakravarty, P.; Hennequart, M.; Pilley, S.; Hobor, S.; Hock, A.K.; Walton, J.B.; Morton, J.P.; Gronroos, E.; et al. Cancer-Specific Loss of p53 Leads to a Modulation of Myeloid and T Cell Responses. Cell Rep. 2020, 30, 481–496. [Google Scholar] [CrossRef]
  37. Bieging-Rolett, K.T.; Kaiser, A.M.; Morgens, D.W.; Boutelle, A.M.; Seoane, J.A.; Van Nostrand, E.L.; Zhu, C.; Houlihan, S.L.; Mello, S.S.; Yee, B.A.; et al. Zmat3 Is a Key Splicing Regulator in the p53 Tumor Suppression Program. Mol. Cell 2020, 80, 452–469. [Google Scholar] [CrossRef]
  38. Zhou, G.; Liu, Z.; Myers, J.N. TP53 Mutations in Head and Neck Squamous Cell Carcinoma and Their Impact on Disease Progression and Treatment Response. J. Cell. Biochem. 2016, 117, 2682–2692. [Google Scholar] [CrossRef] [Green Version]
  39. Cancer Genome Atlas Network. Comprehensive genomic characterization of head and neck squamous cell carcinomas. Nature 2015, 517, 576–582. [Google Scholar] [CrossRef] [Green Version]
  40. Caponio, V.C.A.; Troiano, G.; Adipietro, I.; Zhurakivska, K.; Arena, C.; Mangieri, D.; Mascitti, M.; Cirillo, N.; Lo Muzio, L. Computational analysis of TP53 mutational landscape unveils key prognostic signatures and distinct pathobiological pathways in head and neck squamous cell cancer. Br. J. Cancer 2020, 123, 1302–1314. [Google Scholar] [CrossRef]
  41. Perrone, F.; Bossi, P.; Cortelazzi, B.; Locati, L.; Quattrone, P.; Pierotti, M.A.; Pilotti, S.; Licitra, L. TP53 mutations and pathologic complete response to neoadjuvant cisplatin and fluorouracil chemotherapy in resected oral cavity squamous cell carcinoma. J. Clin. Oncol. 2010, 28, 761–766. [Google Scholar] [CrossRef]
  42. Jagla, W.; Wiede, A.; Hinz, M.; Dietzmann, K.; Gülicher, D.; Gerlach, K.L.; Hoffmann, W. Secretion of TFF-peptides by human salivary glands. Cell Tissue Res. 1999, 298, 161–166. [Google Scholar] [CrossRef] [PubMed]
  43. Kouznetsova, I.; Kalinski, T.; Peitz, U.; Mönkemüller, K.E.; Kalbacher, H.; Vieth, M.; Meyer, F.; Roessner, A.; Malfertheiner, P.; Lippert, H.; et al. Localization of TFF3 peptide in human esophageal submucosal glands and gastric cardia: Differentiation of two types of gastric pit cells along the rostro-caudal axis. Cell Tissue Res. 2007, 328, 365–374. [Google Scholar] [CrossRef] [PubMed]
  44. Hoffmann, W. Trefoil Factor Family (TFF) Peptides and their Different Roles in the Mucosal Innate Immune Defense and More: An Update. Curr. Med. Chem. 2021, 28, 7387–7399. [Google Scholar] [CrossRef]
  45. Jahan, R.; Shah, A.; Kisling, S.G.; Macha, M.A.; Thayer, S.; Batra, S.K.; Kaur, S. Odyssey of trefoil factors in cancer: Diagnostic and therapeutic implications. Biochim. Biophys. Acta (BBA)—Rev. Cancer 2020, 1873, 188362. [Google Scholar] [CrossRef] [PubMed]
  46. Cui, H.Y.; Wang, S.J.; Song, F.; Cheng, X.; Nan, G.; Zhao, Y.; Qian, M.R.; Chen, X.; Li, J.Y.; Liu, F.L.; et al. CD147 receptor is essential for TFF3-mediated signaling regulating colorectal cancer progression. Signal Transduct. Target. Ther. 2021, 6, 268. [Google Scholar] [CrossRef] [PubMed]
  47. Liu, J.; Kim, S.Y.; Shin, S.; Jung, S.H.; Yim, S.H.; Lee, J.Y.; Lee, S.H.; Chung, Y.J. Overexpression of TFF3 is involved in prostate carcinogenesis via blocking mitochondria-mediated apoptosis. Exp. Mol. Med. 2018, 50, 1–11. [Google Scholar] [CrossRef] [Green Version]
  48. Yang, L.; Zhang, X.; Zhang, J.; Liu, Y.; Ji, T.; Mou, J.; Fang, X.; Wang, S.; Chen, J. Low expression of TFF3 in papillary thyroid carcinoma may correlate with poor prognosis but high immune cell infiltration. Future Oncol. 2022, 18, 333–348. [Google Scholar] [CrossRef] [PubMed]
  49. Nisar, S.; Yousuf, P.; Masoodi, T.; Wani, N.A.; Hashem, S.; Singh, M.; Sageena, G.; Mishra, D.; Kumar, R.; Haris, M.; et al. Chemokine-Cytokine Networks in the Head and Neck Tumor Microenvironment. Int. J. Mol. Sci. 2021, 22, 4584. [Google Scholar] [CrossRef]
  50. Fridman, W.H.; Zitvogel, L.; Sautès-Fridman, C.; Kroemer, G. The immune contexture in cancer prognosis and treatment. Nat. Rev. Clin. Oncol. 2017, 14, 717–734. [Google Scholar] [CrossRef]
  51. Gentles, A.J.; Newman, A.M.; Liu, C.L.; Bratman, S.V.; Feng, W.; Kim, D.; Nair, V.S.; Xu, Y.; Khuong, A.; Hoang, C.D.; et al. The prognostic landscape of genes and infiltrating immune cells across human cancers. Nat. Med. 2015, 21, 938–945. [Google Scholar] [CrossRef] [PubMed]
Figure 1. The FCGBP levels in head and neck squamous cell carcinoma (HNSC) patients. (A) Gene Expression Profiling Interactive Analysis 2 (GEPIA2) illustrated the differential expression levels of the FCGBP transcript in tumor and adjacent normal tissues based on HNSC dataset. (B) UALCAN showed the FCGBP levels in normal tissues, HPV-related (n = 41) and HPV-unrelated (n = 80) HNSC. (C) TIMER 2.0 identified the FCGBP levels in HNSC with TP53 wild-type (WT) and mutated, respectively. (D) The protein level of FCGBP in cancer (n = 108) and non-cancerous tissues (n = 71) were shown, based on Clinical Proteomic Tumor Analysis Consortium (CPTAC).
Diagnostics 12 01178 g001
Figure 2. Survival analyses of the FCGBP level in patients with HNSC. (A) Gene Expression Profiling Interactive Analysis 2 (GEPIA2) illustrated the heat maps of the overall survival (OS) and disease-free survival (DFS) across various cancer types. (B,C) Kaplan–Meier analysis showed OS and DFS of HNSC patients with high FCGBP and low FCGBP levels based on the GEPIA2. (D) Univariate Cox analysis reveals the hazard ratios (HR) of different variables. (E) Using multivariate analysis, TIMER 2.0 evaluates the OS for all HNSC, HPV-related, and HPV-unrelated HNSC.
Diagnostics 12 01178 g002
Figure 3. Genetic alterations and correlation analysis on the FCGBP in HNSC patients. (A) cBioPortal showed the FCGBP genetic alterations and mutation frequencies. Different colors indicate dissimilar types of genetic alterations. (B) The relationships between the FCGBP variants and their corresponding mRNA levels (RNA-Seq by Expectation-Maximization: RSEM), batch normalized from Illumina Hiseq_RANSeqV2. (C) The most frequently altered genes with FCGBP alteration in HNSC (n = 523). (D) TIMER2.0 analyzed the correlations between FCGBP mRNA level and tumor purity (left) and TP53 mRNA level (right).
Diagnostics 12 01178 g003
Figure 4. The FCGBP interacted gene/protein networks. (A) The STRING database showed the FCGBP interacted gene/protein network based on text mining and co-expression. (B) TIMER2.0 identified a potential interaction between FCGBP and TTF3 based on co-expression in HNSC patients (n = 522; partial r = 0.357, correlation adjusted by purity; p < 0.001). (C) The GeneMania database showed the gene-gene interaction network. The association between FCGBP and TFF3 based on co-expression and co-localization highlighted the genes with function enriched in epithelial structure maintenance.
Diagnostics 12 01178 g004
Figure 5. The FCGBP-correlated transcripts and enrichment analysis. (A) LinkedOmics showed the volcano map of 20,163 FCGBP co-expressed transcripts in 517 HNSCs by the Pearson correlation analysis (red: positive; green: negative). (B) The heat maps displayed the top 50 transcripts positively correlated to the FCGBP level. (C) The bar diagram demonstrated the co-expressed transcripts with significantly enriched GO (Biological Process) annotations (p < 0.05 and FDR < 0.05). (D) Gene Set Enrichment Analysis (GSEA) showed the enriched KEGG pathways (FDR < 0.05).
Diagnostics 12 01178 g005
Figure 6. TISIDB demonstrates the correlations between HNSC and the FCGBP level and various immunostimulators, chemokines and tumor-infiltrating cells. (A) A heat map with the correlations (r = −1 to +1) between various immunostimulators and the HNSC (arrow) among distinct cancer types. (B) In HNSC patients (n = 522, TCGA), the correlations (r) between the FCGBP level and the CD27, TNFRSF13B, ICOSLG, and TNFRSF17 levels, respectively. (C) Heat maps indicated the correlations (r = −1 to +1) between various infiltration immune cells and the HNSC (arrow) among distinct cancer types. (D) In HNSC 522 patients (TCGA), the correlations (r) between the FCGBP level and abundance of effector memory CD8 T cell (Tem_CD8), type 17 helper cell (Th17), T follicular helper cells (Tfh), activated B cells (Act_B), and mast cells (Mast). (E,F) Heap maps of chemokines, chemokine receptors and the HNSC (arrow) among distinct cancer types.
Diagnostics 12 01178 g006
Table 1. Correlations between clinical factors and the FCGBP mRNA levels.
VariablesFCBGP mRNA Level
LowHighp Value
n = 233n = 209
Gender 1.0
Male170152
Female6357
AJCC 1 T Classification <0.001
T1/T27299
T3/T4161110
AJCC 1 N Classification 0.894
N010697
N1/N2/N3127112
Stage0.015
Stage I720
Stage II3337
Stage III4338
Stage IV150114
1 AJCC: American Joint Committee of Cancer.
Table 2. Associations between FCGBP level and gene markers in tumor-infiltrating immune cells in HNSC by HPV infection status.
Cell TypeMarker1 HNSC (n = 522)2 HPV-Unrelated HNSC (n = 422)HPV-Related HNSC (n = 98)
3 Purity4 NonePurityNonePurityNone
5 Correlationp ValueCorrelationp ValueCorrelationp ValueCorrelationp ValueCorrelationp ValueCorrelationp Value
B
CD190.38***0.38***0.32***0.33***0.37***0.32**
CD79A0.42***0.41***0.35***0.36***0.43***0.37***
CD86 0.19***0.20***0.18***0.19***0.197.13 × 10−20.151.33 × 10−1
CSF1R0.34***0.33***0.32***0.31***0.38***0.33**
Plasma
CD380.11*0.13**0.081.12 × 10−10.096.82 × 10−20.23*0.13**
CXCR40.31***0.32***0.26***0.27***0.34**0.35***
TNFRSF170.37***0.37***0.31***0.32***0.39***0.34***
CD270.41***0.40***0.35***0.35***0.44***0.38***
CD8+ T
CD8A0.28***0.29***0.21***0.23***0.38***0.35***
CD8B0.28***0.29***0.20***0.22***0.40***0.41***
Follicular helper T
IL210.23***0.24***0.16**0.18***0.34**0.32**
BCL60.30***0.28***0.29***0.26***0.251.71 × 10−20.22*
ICOS0.29***0.29***0.25***0.26***0.32**0.32**
CXCR50.42***0.41***0.38***0.38***0.37***0.33***
Th17
STAT30.37***0.37***0.32***0.31***0.50***0.49***
IL-17A0.34***0.34***0.26***0.28***0.49***1.74***
IL-21R0.41***0.40***0.35***0.35***0.48***1.47***
IL-23R0.31***0.31***0.27***0.27***0.38***0.39***
T cell exhaustion
PDCD10.30***0.31***0.22***0.24***0.42***0.39***
CTLA40.30***0.30***0.23***0.25***0.40***0.39***
LAG30.16***0.17***0.096.85 × 10−20.11*0.29**0.28**
HAVCR20.23***0.22***0.18***0.19***0.29**0.23*
1 HNSC: head and neck squamous cell carcinoma, 2 HPV: human papillomavirus, 3 Purity: correlation adjusted by tumor purity; 4 None: correlation without adjustment; 5 Correlation: R value of Spearman’s correlation. * p < 0.05, ** p < 0.01, *** p < 0.001.
Publisher’s Note: MDPI stays neutral with regard to jurisdictional claims in published maps and institutional affiliations.

