
Neutrophile-to-Lymphocyte Ratio (NLR) Identifies Patients with Coronavirus Infectious Disease 2019 (COVID-19) at High Risk for Deterioration and Mortality—A Retrospective, Monocentric Cohort Study

 , ,
, ,
Abstract
:1. Introduction
2. Materials and Methods
2.1. Study Population and Data Collection
2.2. Definitions
2.3. Statistical Analysis
3. Results
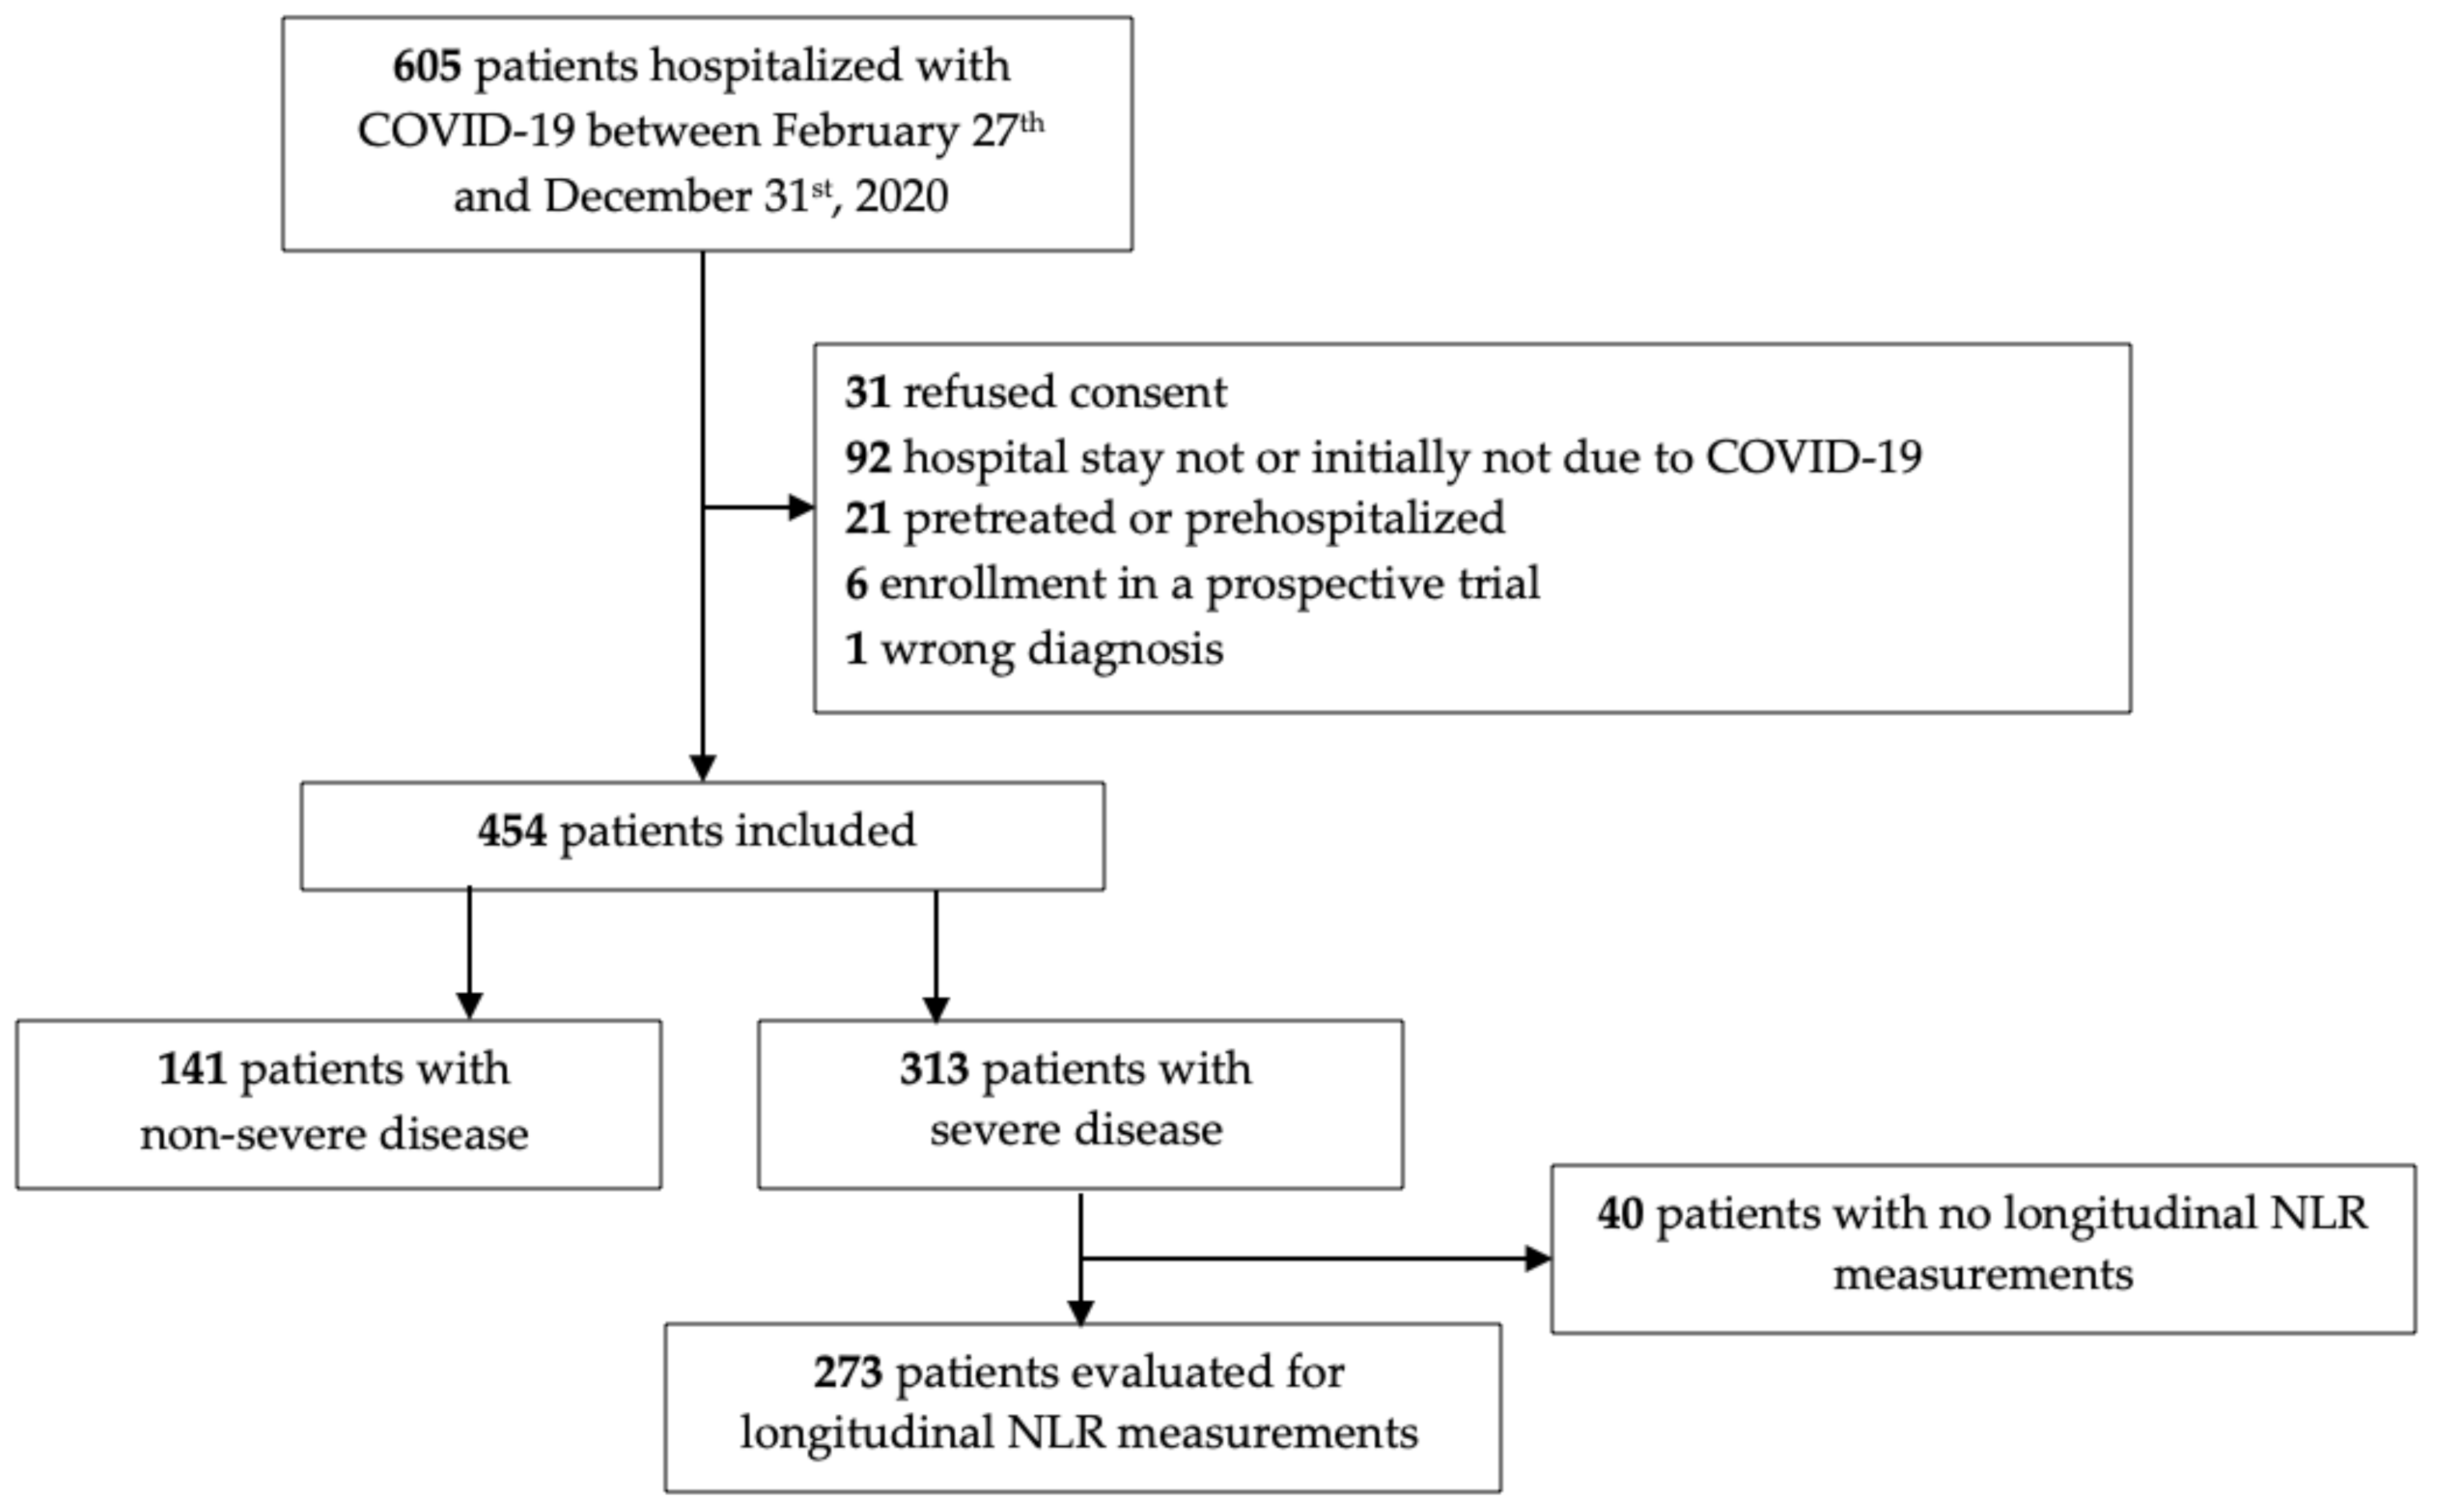
3.1. Cohort
3.2. Demographic and Clinical Phenotypes of COVID-19 Patients
3.3. Association of Laboratory Results with Disease Severity, Unfavorable Outcome, and Mortality
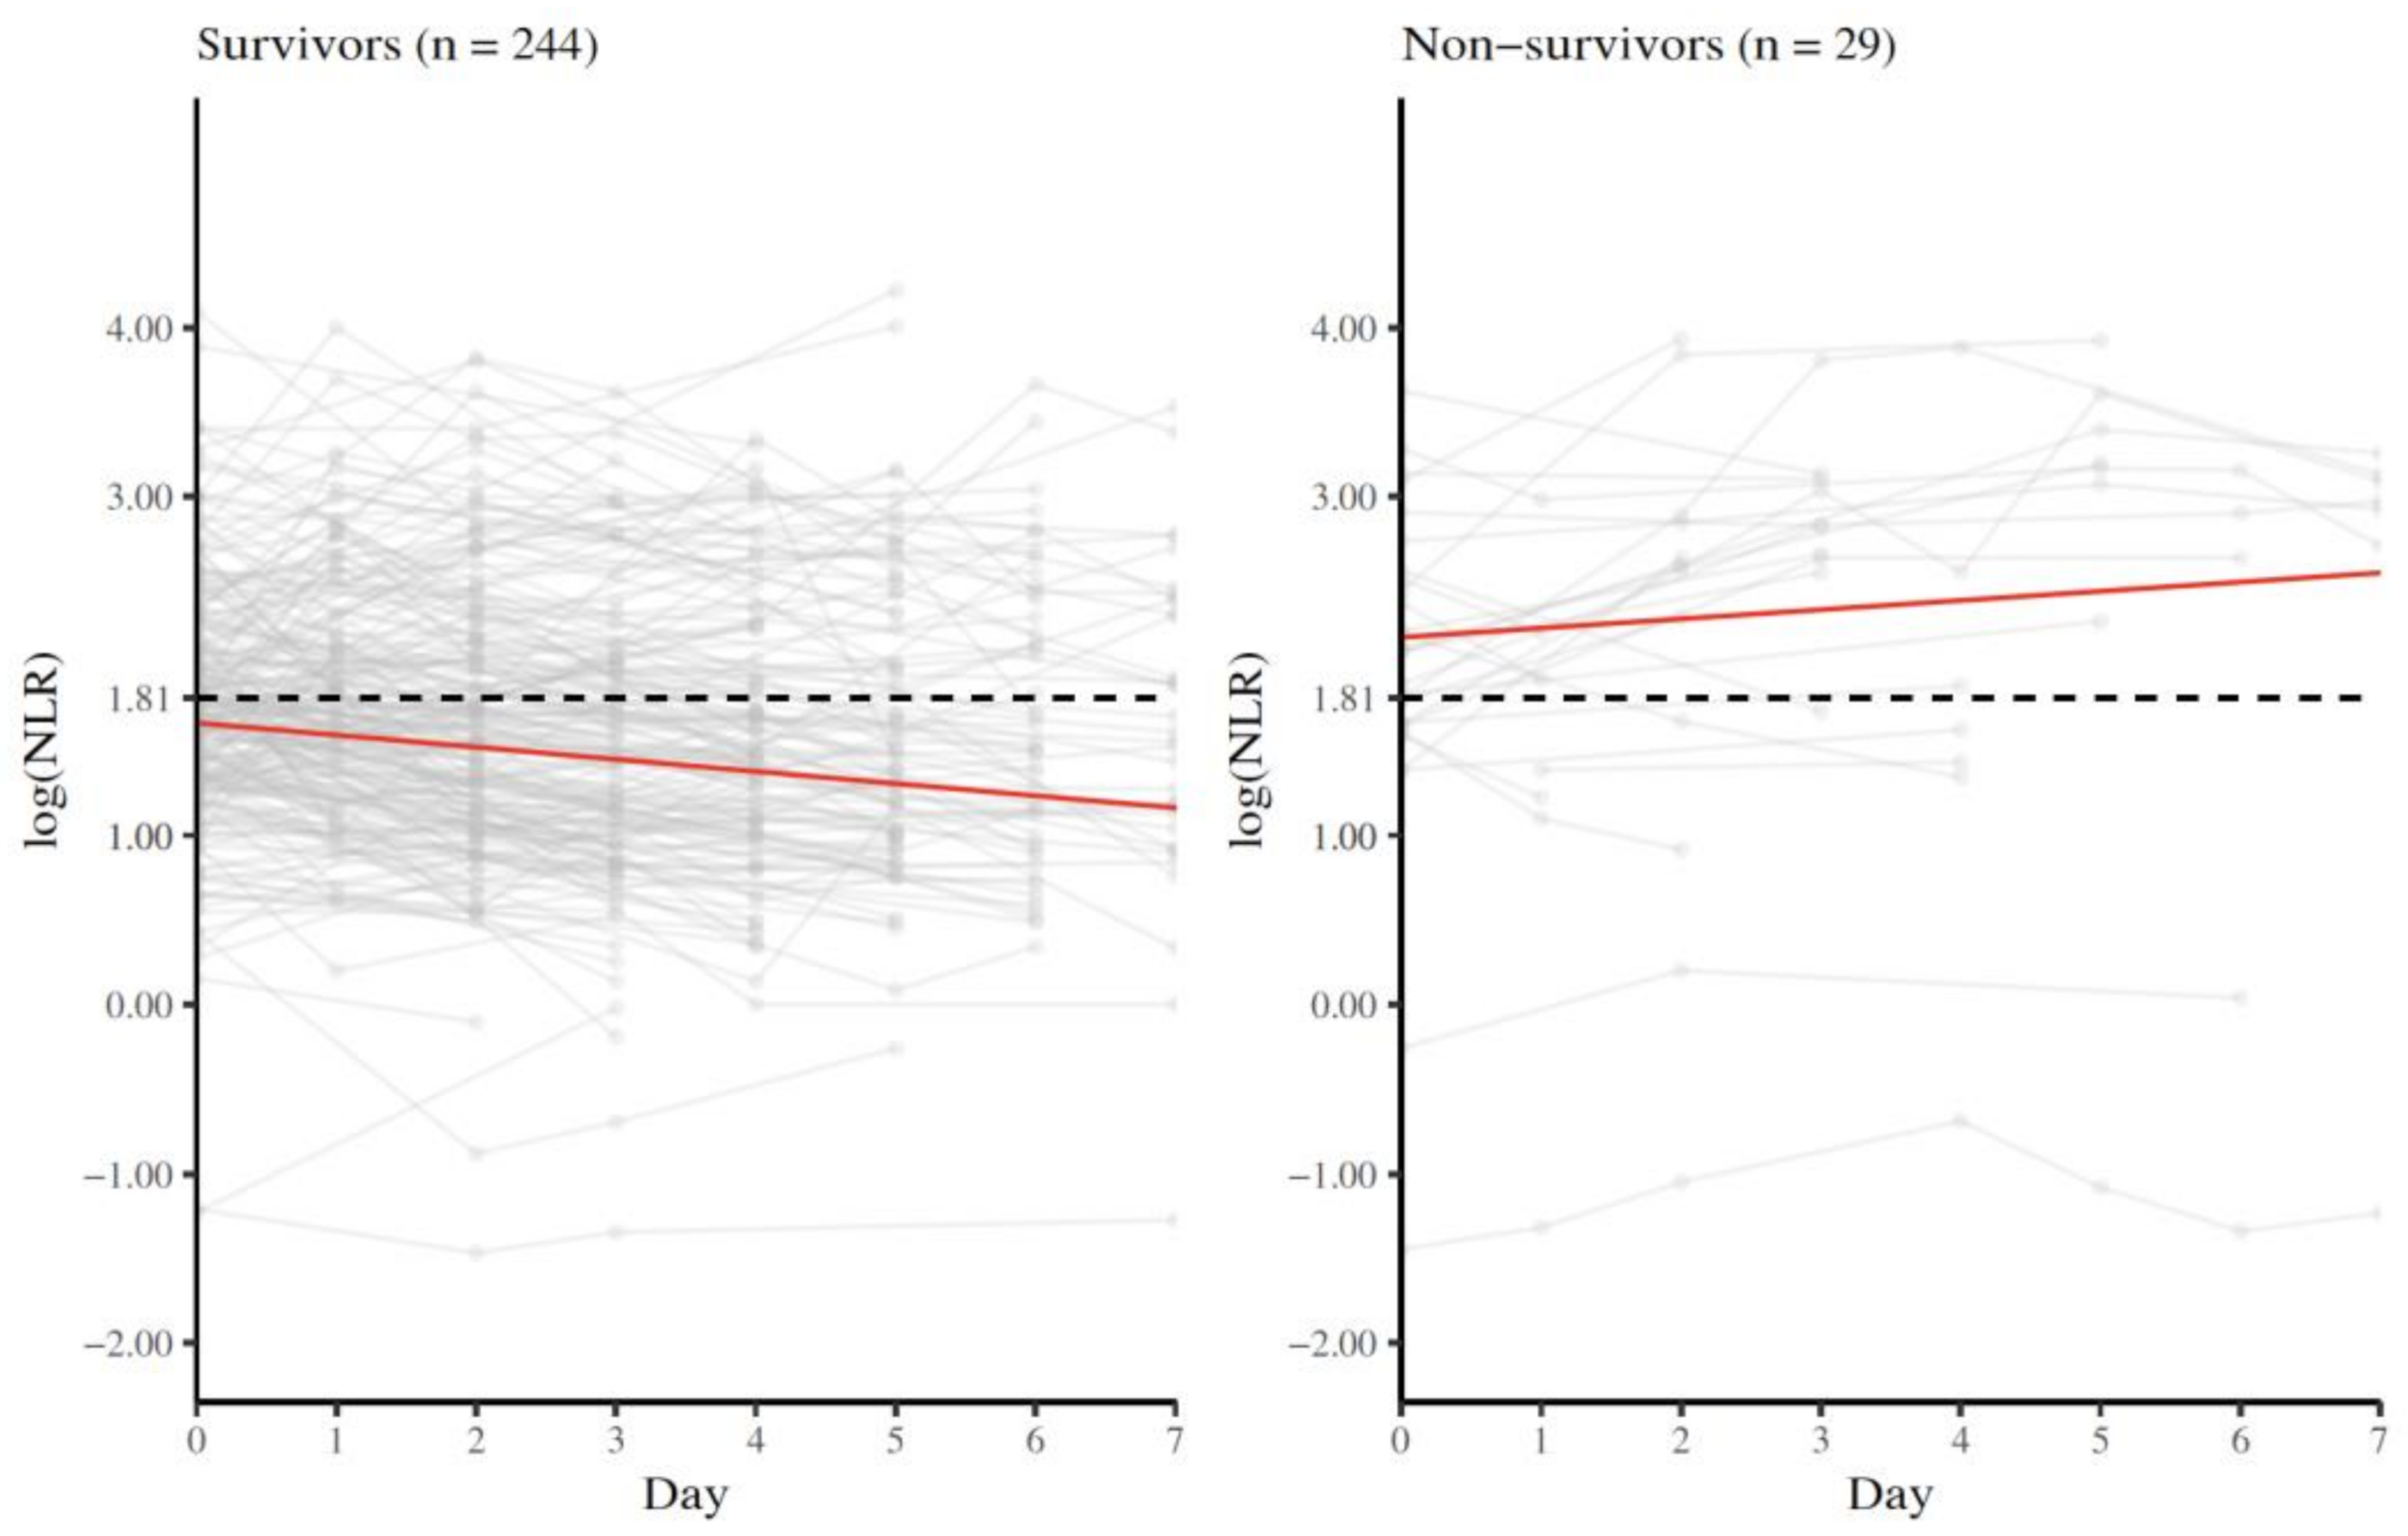
3.4. Longitudinal NLR Measurements
4. Discussion
5. Conclusions
Supplementary Materials
Author Contributions
Funding
Institutional Review Board Statement
Informed Consent Statement
Data Availability Statement
Conflicts of Interest
References
- Li, J.; Huang, D.Q.; Zou, B.; Yang, H.; Hui, W.Z.; Rui, F.; Yee, N.T.S.; Liu, C.; Nerurkar, S.N.; Kai, J.C.Y.; et al. Epidemiology of COVID-19: A systematic review and meta-analysis of clinical characteristics, risk factors, and outcomes. J. Med. Virol. 2021, 93, 1449–1458. [Google Scholar] [CrossRef] [PubMed]
- Petrilli, C.M.; Jones, S.A.; Yang, J.; Rajagopalan, H.; O’Donnell, L.; Chernyak, Y.; Tobin, K.A.; Cerfolio, R.J.; Francois, F.; Horwitz, L.I. Factors associated with hospital admission and critical illness among 5279 people with coronavirus disease 2019 in New York City: Prospective cohort study. BMJ 2020, 369, m1966. [Google Scholar] [CrossRef] [PubMed]
- Gao, Y.-D.; Ding, M.; Dong, X.; Zhang, J.-J.; Azkur, A.K.; Azkur, D.; Gan, H.; Sun, Y.-L.; Fu, W.; Li, W.; et al. Risk factors for severe and critically ill COVID-19 patients: A review. Allergy 2021, 76, 428–455. [Google Scholar] [CrossRef] [PubMed]
- Li, X.; Liu, C.; Mao, Z.; Xiao, M.; Wang, L.; Qi, S.; Zhou, F. Predictive values of neutrophil-to-lymphocyte ratio on disease severity and mortality in COVID-19 patients: A systematic review and meta-analysis. Crit. Care 2020, 24, 647. [Google Scholar] [CrossRef]
- Simadibrata, D.M.; Calvin, J.; Wijaya, A.D.; Ibrahim, N.A.A. Neutrophil-to-lymphocyte ratio on admission to predict the severity and mortality of COVID-19 patients: A meta-analysis. Am. J. Emerg. Med. 2021, 42, 60–69. [Google Scholar] [CrossRef]
- Bastug, A.; Bodur, H.; Erdogan, S.; Gokcinar, D.; Kazancioglu, S.; Kosovali, B.D.; Ozbay, B.O.; Gok, G.; Turan, I.O.; Yilmaz, G.; et al. Clinical and laboratory features of COVID-19: Predictors of severe prognosis. Int. Immunopharmacol. 2020, 88, 106950. [Google Scholar] [CrossRef]
- Sarkar, S.; Kannan, S.; Khanna, P.; Singh, A.K. Role of platelet-to-lymphocyte count ratio (PLR), as a prognostic indicator in COVID-19: A systematic review and meta-analysis. J. Med. Virol. 2022, 94, 211–221. [Google Scholar] [CrossRef]
- Madetko, N.; Migda, B.; Alster, P.; Turski, P.; Koziorowski, D.; Friedman, A. Platelet-to-lymphocyte ratio and neutrophil-tolymphocyte ratio may reflect differences in PD and MSA-P neuroinflammation patterns. Neurol. Neurochir. Pol. 2022. [Google Scholar] [CrossRef]
- Alster, P.; Madetko, N.; Friedman, A. Neutrophil-to-lymphocyte ratio (NLR) at boundaries of Progressive Supranuclear Palsy Syndrome (PSPS) and Corticobasal Syndrome (CBS). Neurol. Neurochir. Pol. 2021, 55, 97–101. [Google Scholar] [CrossRef]
- Mangalesh, S.; Dudani, S. Neutrophil-to-Lymphocyte Ratio for the Prediction of the Presence and Severity of Coronary Artery Disease. Angiology 2022, 00033197221087783. [Google Scholar] [CrossRef]
- Bedel, C.; Selvi, F. Association of Platelet to Lymphocyte and Neutrophil to Lymphocyte Ratios with In-Hospital Mortality in Patients with Type A Acute Aortic Dissection. Braz. J. Cardiovasc. Surg. 2019, 34, 694–698. [Google Scholar] [CrossRef] [PubMed]
- Bedel, C.; Korkut, M.; Selvi, F. New markers in predicting the severity of acute pancreatitis in the emergency department: Immature granulocyte count and percentage. J. Postgrad. Med. 2021, 67, 7–11. [Google Scholar] [CrossRef] [PubMed]
- Diebold, M.; Martinez, A.E.; Adam, K.-M.; Bassetti, S.; Osthoff, M.; Kassi, E.; Steiger, J.; Pargger, H.; Siegemund, M.; Battegay, M.; et al. Temporal trends of COVID-19 related in-hospital mortality and demographics in Switzerland—A retrospective single centre cohort study. Swiss Med. Wkly. 2021, 151, w20572. [Google Scholar] [CrossRef] [PubMed]
- WHO. Clinical Management of Severe Acute Respiratory Infection when Novel Coronavirus (nCoV) Infection is Suspected. Available online: https://www.who.int/publications/i/item/10665-332299 (accessed on 12 January 2020).
- Cai, J.; Li, H.; Zhang, C.; Chen, Z.; Liu, H.; Lei, F.; Qin, J.-J.; Liu, Y.-M.; Zhou, F.; Song, X.; et al. The Neutrophil-to-Lymphocyte Ratio Determines Clinical Efficacy of Corticosteroid Therapy in Patients with COVID-19. Cell Metab. 2021, 33, 258–269.e3. [Google Scholar] [CrossRef] [PubMed]
- Han, D.; Li, R.; Han, Y.; Zhang, R.; Li, J. COVID-19: Insight into the asymptomatic SARS-COV-2 infection and transmission. Int. J. Biol. Sci. 2020, 16, 2803–2811. [Google Scholar] [CrossRef]
- Stevens, J.P.; Dechen, T.; Schwartzstein, R.M.; O’Donnell, C.R.; Baker, K.; Banzett, R.B. Association of dyspnoea, mortality and resource use in hospitalised patients. Eur. Respir. J. 2021, 58, 1902107. [Google Scholar] [CrossRef]
- Cretikos, M.A.; Bellomo, R.; Hillman, K.; Chen, J.; Finfer, S.; Flabouris, A. Respiratory rate: The neglected vital sign. Med. J. Aust. 2008, 188, 657–659. [Google Scholar] [CrossRef]
- Citu, C.; Gorun, F.; Motoc, A.; Sas, I.; Gorun, O.M.; Burlea, B.; Tuta-Sas, I.; Tomescu, L.; Neamtu, R.; Malita, D.; et al. The Predictive Role of NLR, d-NLR, MLR, and SIRI in COVID-19 Mortality. Diagnostics 2022, 12, 122. [Google Scholar] [CrossRef]
- Lippi, G.; Plebani, M.; Henry, B.M. Thrombocytopenia is associated with severe coronavirus disease 2019 (COVID-19) infections: A meta-analysis. Clin. Chim. Acta 2020, 506, 145–148. [Google Scholar] [CrossRef]
- Zong, X.; Gu, Y.; Yu, H.; Li, Z.; Wang, Y. Thrombocytopenia Is Associated with COVID-19 Severity and Outcome: An Updated Meta-Analysis of 5637 Patients with Multiple Outcomes. Lab. Med. 2021, 52, 10–15. [Google Scholar] [CrossRef]
- Lin, B.D.; Hottenga, J.-J.; Abdellaoui, A.; Dolan, C.V.; de Geus, E.J.C.; Kluft, C.; Boomsma, D.I.; Willemsen, G. Causes of variation in the neutrophil–lymphocyte and platelet–lymphocyte ratios: A twin-family study. Biomark. Med. 2016, 10, 1061–1072. [Google Scholar] [CrossRef] [PubMed] [Green Version]
- Roth, S.; M’Pembele, R.; Stroda, A.; Jansen, C.; Buse, G.L.; Boeken, U.; Akhyari, P.; Lichtenberg, A.; Hollmann, M.W.; Huhn, R.; et al. Neutrophil-lymphoycyte-ratio, platelet-lymphocyte-ratio and procalcitonin for early assessment of prognosis in patients undergoing VA-ECMO. Sci. Rep. 2022, 12, 542. [Google Scholar] [CrossRef] [PubMed]
- Karimi, A.; Shobeiri, P.; Kulasinghe, A.; Rezaei, N. Novel Systemic Inflammation Markers to Predict COVID-19 Prognosis. Front. Immunol. 2021, 12, 741061. [Google Scholar] [CrossRef] [PubMed]


| Variable | Overall | Non-Severe | Severe | p-Value | NA (%) |
|---|---|---|---|---|---|
| Demographic Data | |||||
| n (%) | 454 | 141 (31.1) | 313 (68.9) | ||
| Gender | 0.146 | 0.0 | |||
| Male = yes (%) | 291 (64.1) | 83 (58.9) | 208 (66.5) | ||
| Female = yes (%) | 163 (35.9) | 58 (41.1) | 105 (33.5) | ||
| Age (median (min, max)) | 68 (18, 96) | 61 (18, 95) | 69 (22, 96) | 0.001 | 0.0 |
| Age distribution | <0.001 | 0.0 | |||
| 18–44 years (%) | 47 (10.4) | 30 (21.3) | 17 (5.4) | ||
| 45–64 years (%) | 156 (34.4) | 46 (32.6) | 110 (35.1) | ||
| 65–79 years (%) | 155 (34.1) | 40 (28.4) | 115 (36.7) | ||
| ≥80 years (%) | 96 (21.1) | 25 (17.7) | 71 (22.7) | ||
| Symptoms | |||||
| Time between onset of symptoms and hospitalization (days) (median IQR) | 7 (4, 10) | 6 (3, 9) | 7 (4, 10) | 0.028 | 5.1 |
| Cough (%) | 292 (64.3) | 90 (63.8) | 202 (64.5) | 0.968 | 0.0 |
| Fever (%) | 253 (55.7) | 81 (57.4) | 172 (55.0) | 0.694 | 0.0 |
| Headache (%) | 63 (13.9) | 24 (17.0) | 39 (12.5) | 0.248 | 0.0 |
| Chest pain (%) | 64 (14.1) | 20 (14.2) | 44 (14.1) | 1.000 | 0.0 |
| Dyspnea (%) | 215 (47.4) | 48 (34.0) | 167 (53.4) | <0.001 | 0.0 |
| Myalgia, arthralgia, malaise (%) | 264 (58.1) | 83 (58.9) | 181 (57.8) | 0.917 | 0.0 |
| Nasal congestion (%) | 12 (2.6) | 8 (5.7) | 4 (1.3) | 0.017 | 0.0 |
| Gastrointestinal symptoms (%) | 91 (20.0) | 27 (19.1) | 64 (20.4) | 0.847 | 0.0 |
| Sore throat (%) | 28 (6.2) | 10 (7.1) | 18 (5.8) | 0.735 | 0.0 |
| Anosmia (%) | 13 (2.9) | 4 (2.8) | 9 (2.9) | 1.000 | 0.0 |
| Vital signs | |||||
| Systolic blood pressure (mmHg) (median (IQR)) | 138 (123, 153) | 133 (122, 147) | 139 (124, 155) | 0.080 | 2.4 |
| Diastolic blood pressure (mmHg) (median (IQR)) | 76 (66, 84) | 77 (67, 84) | 76 (65, 84) | 0.462 | 2.4 |
| Heart rate (/min.) (median (IQR)) | 88 (77, 100) | 86 (76, 94) | 88 (77, 102) | 0.077 | 1.8 |
| Oxygen saturation (%) without supplemental oxygen (median (IQR)) | 93 (89, 96) | 96 (94, 98) | 91 (88, 94) | <0.001 | 1.8 |
| Respiratory rate (/min.) (median (IQR)) | 23 (18, 28) | 20 (16, 24) | 24 (20, 28) | <0.001 | 11.7 |
| Temperature (°C) (median (IQR)) | 37.7 (37.0, 38.4) | 37.6 (36.9, 38.3) | 37.8 (37.1, 38.4) | 0.123 | 5.1 |
| GCS < 15 (%) | 33 (7.3) | 8 (5.7) | 25 (8.0) | 0.494 | 0.0 |
| Laboratory results | |||||
| NLR (median (IQR)) | 5.3 (3.3, 8.5) | 3.5 (2.2, 6.5) | 6.0 (3.9, 9.7) | <0.001 | 1.3 |
| PLR (median IQR)) | 222.9 (152.3, 334.3) | 194.6 (139.1, 283.0) | 242.4 (156.8, 356.6) | 0.002 | 1.3 |
| Neutrophile granulocytes (109 cells/l) (median (IQR)) | 4.5 (3.0, 6.0) | 3.6 (2.4, 5.0) | 4.8 (3.7, 6.5) | <0.001 | 1.3 |
| Lymphocytes (109 cells/l) (median (IQR)) | 0.9 (0.6, 1.2) | 1.0 (0.7, 1.3) | 0.8 (0.6, 1.1) | <0.001 | 1.3 |
| Platelets (109 cells/l) (median (IQR)) | 185.0 (145.5, 240.8) | 186.5 (148.8, 230.3) | 184.5 (141.8, 244.3) | 0.680 | 0.4 |
| CRP (mg/L) (median (IQR)) | 65.3 (29.2, 120.0) | 31.6 (12.7, 72.3) | 84.8 (45.5, 137.0) | <0.001 | 0.7 |
| Comorbidities | |||||
| Number of comorbidities | 0.001 | 0.0 | |||
| 0 (%) | 126 (27.8) | 54 (38.3) | 72 (23.0) | ||
| 1 (%) | 120 (26.4) | 40 (28.4) | 80 (25.6) | ||
| 2 (%) | 100 (22.0) | 27 (19.1) | 73 (23.3) | ||
| ≥3 (%) | 108 (23.8) | 20 (14.2) | 88 (28.1) | ||
| Arterial hypertension (%) | 225 (49.6) | 59 (41.8) | 166 (53.0) | 0.035 | 0.0 |
| Diabetes mellitus (%) | 119 (26.2) | 24 (17.0) | 95 (30.4) | 0.004 | 0.0 |
| Cardiovascular disease (%) | 137 (30.2) | 35 (24.8) | 102 (32.6) | 0.119 | 0.0 |
| Chronic pulmonary disease (%) | 56 (12.3) | 14 (9.9) | 42 (13.4) | 0.372 | 0.0 |
| Malignant disease (%) | 54 (11.9) | 9 (6.4) | 45 (14.4) | 0.023 | 0.0 |
| eGFR < 30 mL/min (%) | 17 (3.7) | 4 (2.8) | 13 (4.2) | 0.677 | 0.0 |
| Obesity (%) | 103 (22.7) | 21 (14.9) | 82 (26.2) | 0.011 | 0.0 |
| Outcomes | |||||
| Unfavorable outcome = yes (%) | 92 (20.3) | 0 (0.0) | 92 (29.4) | <0.001 | 0.0 |
| No ICU transfer (%) | 380 (83.7) | 141 (100.0) | 239 (76.4) | ||
| ICU transfer (%) | 74 (16.3) | 0 (0.0) | 74 (23.6) | ||
| Without ventilation (%) | 16 (3.5) | 0 (0.0) | 16 (5.1) | ||
| With non-invasive ventilation (%) | 8 (1.8) | 0 (0.0) | 8 (2.6) | ||
| With mechanical ventilation (%) | 47 (10.4) | 0 (0.0) | 47 (15) | ||
| With ECMO (%) | 3 (0.7) | 0 (0.0) | 3 (1.0) | ||
| Death (%) | 43 (9.5) | 0 (0.0) | 43 (13.7) | <0.001 | 0.0 |
| Variable | Overall | Survivor | Non-Survivor | p-Value | NA (%) |
|---|---|---|---|---|---|
| n (%) | 454 | 411 (90.5) | 43 (9.5) | ||
| Gender | 0.326 | 0.0 | |||
| Male = yes (%) | 291 (64.1) | 260 (63.6) | 31 (72.1) | ||
| Female = yes (%) | 163 (35.9) | 151 (36.4) | 12 (27.9) | ||
| Severe = yes (%) | 313 (68.9) | 270 (65.7) | 43 (100.0) | <0.001 | 1.3 |
| NLR (median (IQR)) | 5.3 (3.3, 8.5) | 5.0 (3.2, 8) | 8.2 (6.6, 12.3) | <0.001 | 1.3 |
| PLR (median (IQR)) | 222.9 (152.3, 334.3) | 215.5 (148.9, 331.0) | 268.3 (203.3, 425.0) | 0.008 | 1.3 |
| CRP (mg/L) (median (IQR)) | 65.3 (29.2, 120.0) | 60.8 (27.6, 114.0) | 102.0 (65.9, 150.8) | 0.001 | 0.7 |
| Laboratory Value | Outcome of Interest | Odds Ratio | 95% CI | p-Value |
|---|---|---|---|---|
| log (NLR) | ||||
| Disease severity | 2.56 | 1.97–3.32 | <0.0001 | |
| Age | 1.02 | 1.00–1.03 | 0.014 | |
| Male | 1.42 | 0.99–2.05 | 0.059 | |
| Comorbidities | 2.09 | 1.43–3.06 | 0.0002 | |
| Unfavorable outcome | 2.04 | 1.46–2.91 | <0.0001 | |
| Age | 1.02 | 1.00–1.04 | 0.05 | |
| Male | 1.88 | 1.09–3.34 | 0.027 | |
| Comorbidities | 2.24 | 1.27–4.06 | 0.006 | |
| Mortality | 1.82 | 1.14–2.95 | 0.013 | |
| Age | 1.09 | 1.05–1.13 | <0.0001 | |
| Male | 2.42 | 1.12–5.65 | 0.031 | |
| Comorbidities | 1.13 | 0.52–2.62 | 0.76 | |
| log (PLR) | ||||
| Disease severity | 1.26 | 0.95–1.68 | 0.11 | |
| Age | 1.02 | 1.01–1.04 | 0.0002 | |
| Male | 1.69 | 1.18–2.41 | 0.004 | |
| Comorbidities | 1.94 | 1.33–2.83 | 0.0006 | |
| Unfavorable outcome | 1.16 | 0.79–1.72 | 0.46 | |
| Age | 1.02 | 1.01–1.04 | 0.009 | |
| Male | 2.12 | 1.25–3.72 | 0.007 | |
| Comorbidities | 2.14 | 1.23–3.85 | 0.008 | |
| Mortality | 1.37 | 0.79–2.46 | 0.27 | |
| Age | 1.09 | 1.06–1.13 | <0.0001 | |
| Male | 2.59 | 1.21–6.00 | 0.018 | |
| Comorbidities | 1.15 | 0.53–2.65 | 0.73 | |
| log (neutrophil granulocytes) | ||||
| Disease severity | 3.52 | 2.48–5.00 | <0.0001 | |
| Age | 1.02 | 1.01–1.04 | <0.0001 | |
| Male | 1.48 | 1.03–2.14 | 0.034 | |
| Comorbidities | 1.78 | 1.22–2.61 | 0.003 | |
| Unfavorable outcome | 3.65 | 2.20–6.26 | <0.0001 | |
| Age | 1.03 | 1.01–1.05 | 0.004 | |
| Male | 1.87 | 1.08–3.33 | 0.029 | |
| Comorbidities | 1.92 | 1.09–3.50 | 0.027 | |
| Mortality | 1.98 | 0.99–4.08 | 0.057 | |
| Age | 1.09 | 1.06–1.13 | <0.0001 | |
| Male | 2.45 | 1.14–5.69 | 0.028 | |
| Comorbidities | 1.05 | 0.48–2.44 | 0.9 | |
| log (lymphocytes) | ||||
| Disease severity | 0.63 | 0.45–0.88 | 0.006 | |
| Age | 1.02 | 1.01–1.03 | 0.001 | |
| Male | 1.66 | 1.16–2.38 | 0.006 | |
| Comorbidities | 2.06 | 1.41–3.01 | 0.0002 | |
| Unfavorable outcome | 0.83 | 0.54–1.27 | 0.4 | |
| Age | 1.02 | 1.01–1.04 | 0.012 | |
| Male | 2.11 | 1.24–3.70 | 0.007 | |
| Comorbidities | 2.18 | 1.25–3.92 | 0.007 | |
| Mortality | 0.6 | 0.32–1.10 | 0.11 | |
| Age | 1.09 | 1.05–1.12 | <0.0001 | |
| Male | 2.53 | 1.18–5.87 | 0.022 | |
| Comorbidities | 1.18 | 0.54–2.72 | 0.69 | |
| log (platelets) | ||||
| Disease severity | 0.84 | 0.59–1.20 | 0.35 | |
| Age | 1.02 | 1.01–1.04 | <0.0001 | |
| Male | 1.72 | 1.20–2.46 | 0.003 | |
| Comorbidities | 1.92 | 1.32–2.80 | 0.0007 | |
| Unfavorable outcome | 1 | 0.60–1.78 | 0.99 | |
| Age | 1.03 | 1.01–1.04 | 0.005 | |
| Male | 2.06 | 1.22–3.59 | 0.008 | |
| Comorbidities | 2.14 | 1.23–3.85 | 0.008 | |
| Mortality | 0.83 | 0.41–1.86 | 0.63 | |
| Age | 1.09 | 1.06–1.13 | <0.0001 | |
| Male | 2.37 | 1.13–5.29 | 0.27 | |
| Comorbidities | 1.16 | 0.54–2.67 | 0.71 | |
| CRP | ||||
| Disease severity | 1.01 | 1.01–1.01 | <0.0001 | |
| Age | 1.02 | 1.01–1.03 | 0.0009 | |
| Male | 1.35 | 0.94–1.95 | 0.11 | |
| Comorbidities | 1.81 | 1.23–2.65 | 0.002 | |
| Unfavorable outcome | 1.01 | 1.01–1.01 | <0.0001 | |
| Age | 1.02 | 1.01–1.04 | 0.009 | |
| Male | 1.68 | 0.97–2.99 | 0.067 | |
| Comorbidities | 2 | 1.14–3.66 | 0.19 | |
| Mortality | 1 | 1.00–1.01 | 0.042 | |
| Age | 1.09 | 1.06–1.13 | <0.0001 | |
| Male | 2.15 | 1.01–4.86 | 0.054 | |
| Comorbidities | 1.11 | 0.52–2.56 | 0.79 |
Publisher’s Note: MDPI stays neutral with regard to jurisdictional claims in published maps and institutional affiliations. |
© 2022 by the authors. Licensee MDPI, Basel, Switzerland. This article is an open access article distributed under the terms and conditions of the Creative Commons Attribution (CC BY) license (https://creativecommons.org/licenses/by/4.0/).
Share and Cite
Rose, J.; Suter, F.; Furrer, E.; Sendoel, A.; Stüssi-Helbling, M.; Huber, L.C. Neutrophile-to-Lymphocyte Ratio (NLR) Identifies Patients with Coronavirus Infectious Disease 2019 (COVID-19) at High Risk for Deterioration and Mortality—A Retrospective, Monocentric Cohort Study. Diagnostics 2022, 12, 1109. https://doi.org/10.3390/diagnostics12051109
Rose J, Suter F, Furrer E, Sendoel A, Stüssi-Helbling M, Huber LC. Neutrophile-to-Lymphocyte Ratio (NLR) Identifies Patients with Coronavirus Infectious Disease 2019 (COVID-19) at High Risk for Deterioration and Mortality—A Retrospective, Monocentric Cohort Study. Diagnostics. 2022; 12(5):1109. https://doi.org/10.3390/diagnostics12051109
Chicago/Turabian StyleRose, Jutta, Flurina Suter, Eva Furrer, Ataman Sendoel, Melina Stüssi-Helbling, and Lars C. Huber. 2022. "Neutrophile-to-Lymphocyte Ratio (NLR) Identifies Patients with Coronavirus Infectious Disease 2019 (COVID-19) at High Risk for Deterioration and Mortality—A Retrospective, Monocentric Cohort Study" Diagnostics 12, no. 5: 1109. https://doi.org/10.3390/diagnostics12051109