
Quantum Iterative Reconstruction for Low-Dose Ultra-High-Resolution Photon-Counting Detector CT of the Lung

 , , , , and
Abstract
:1. Introduction
2. Materials and Methods
2.1. Phantom
2.2. Patients
2.3. Data Acquisition
2.4. Image Reconstruction
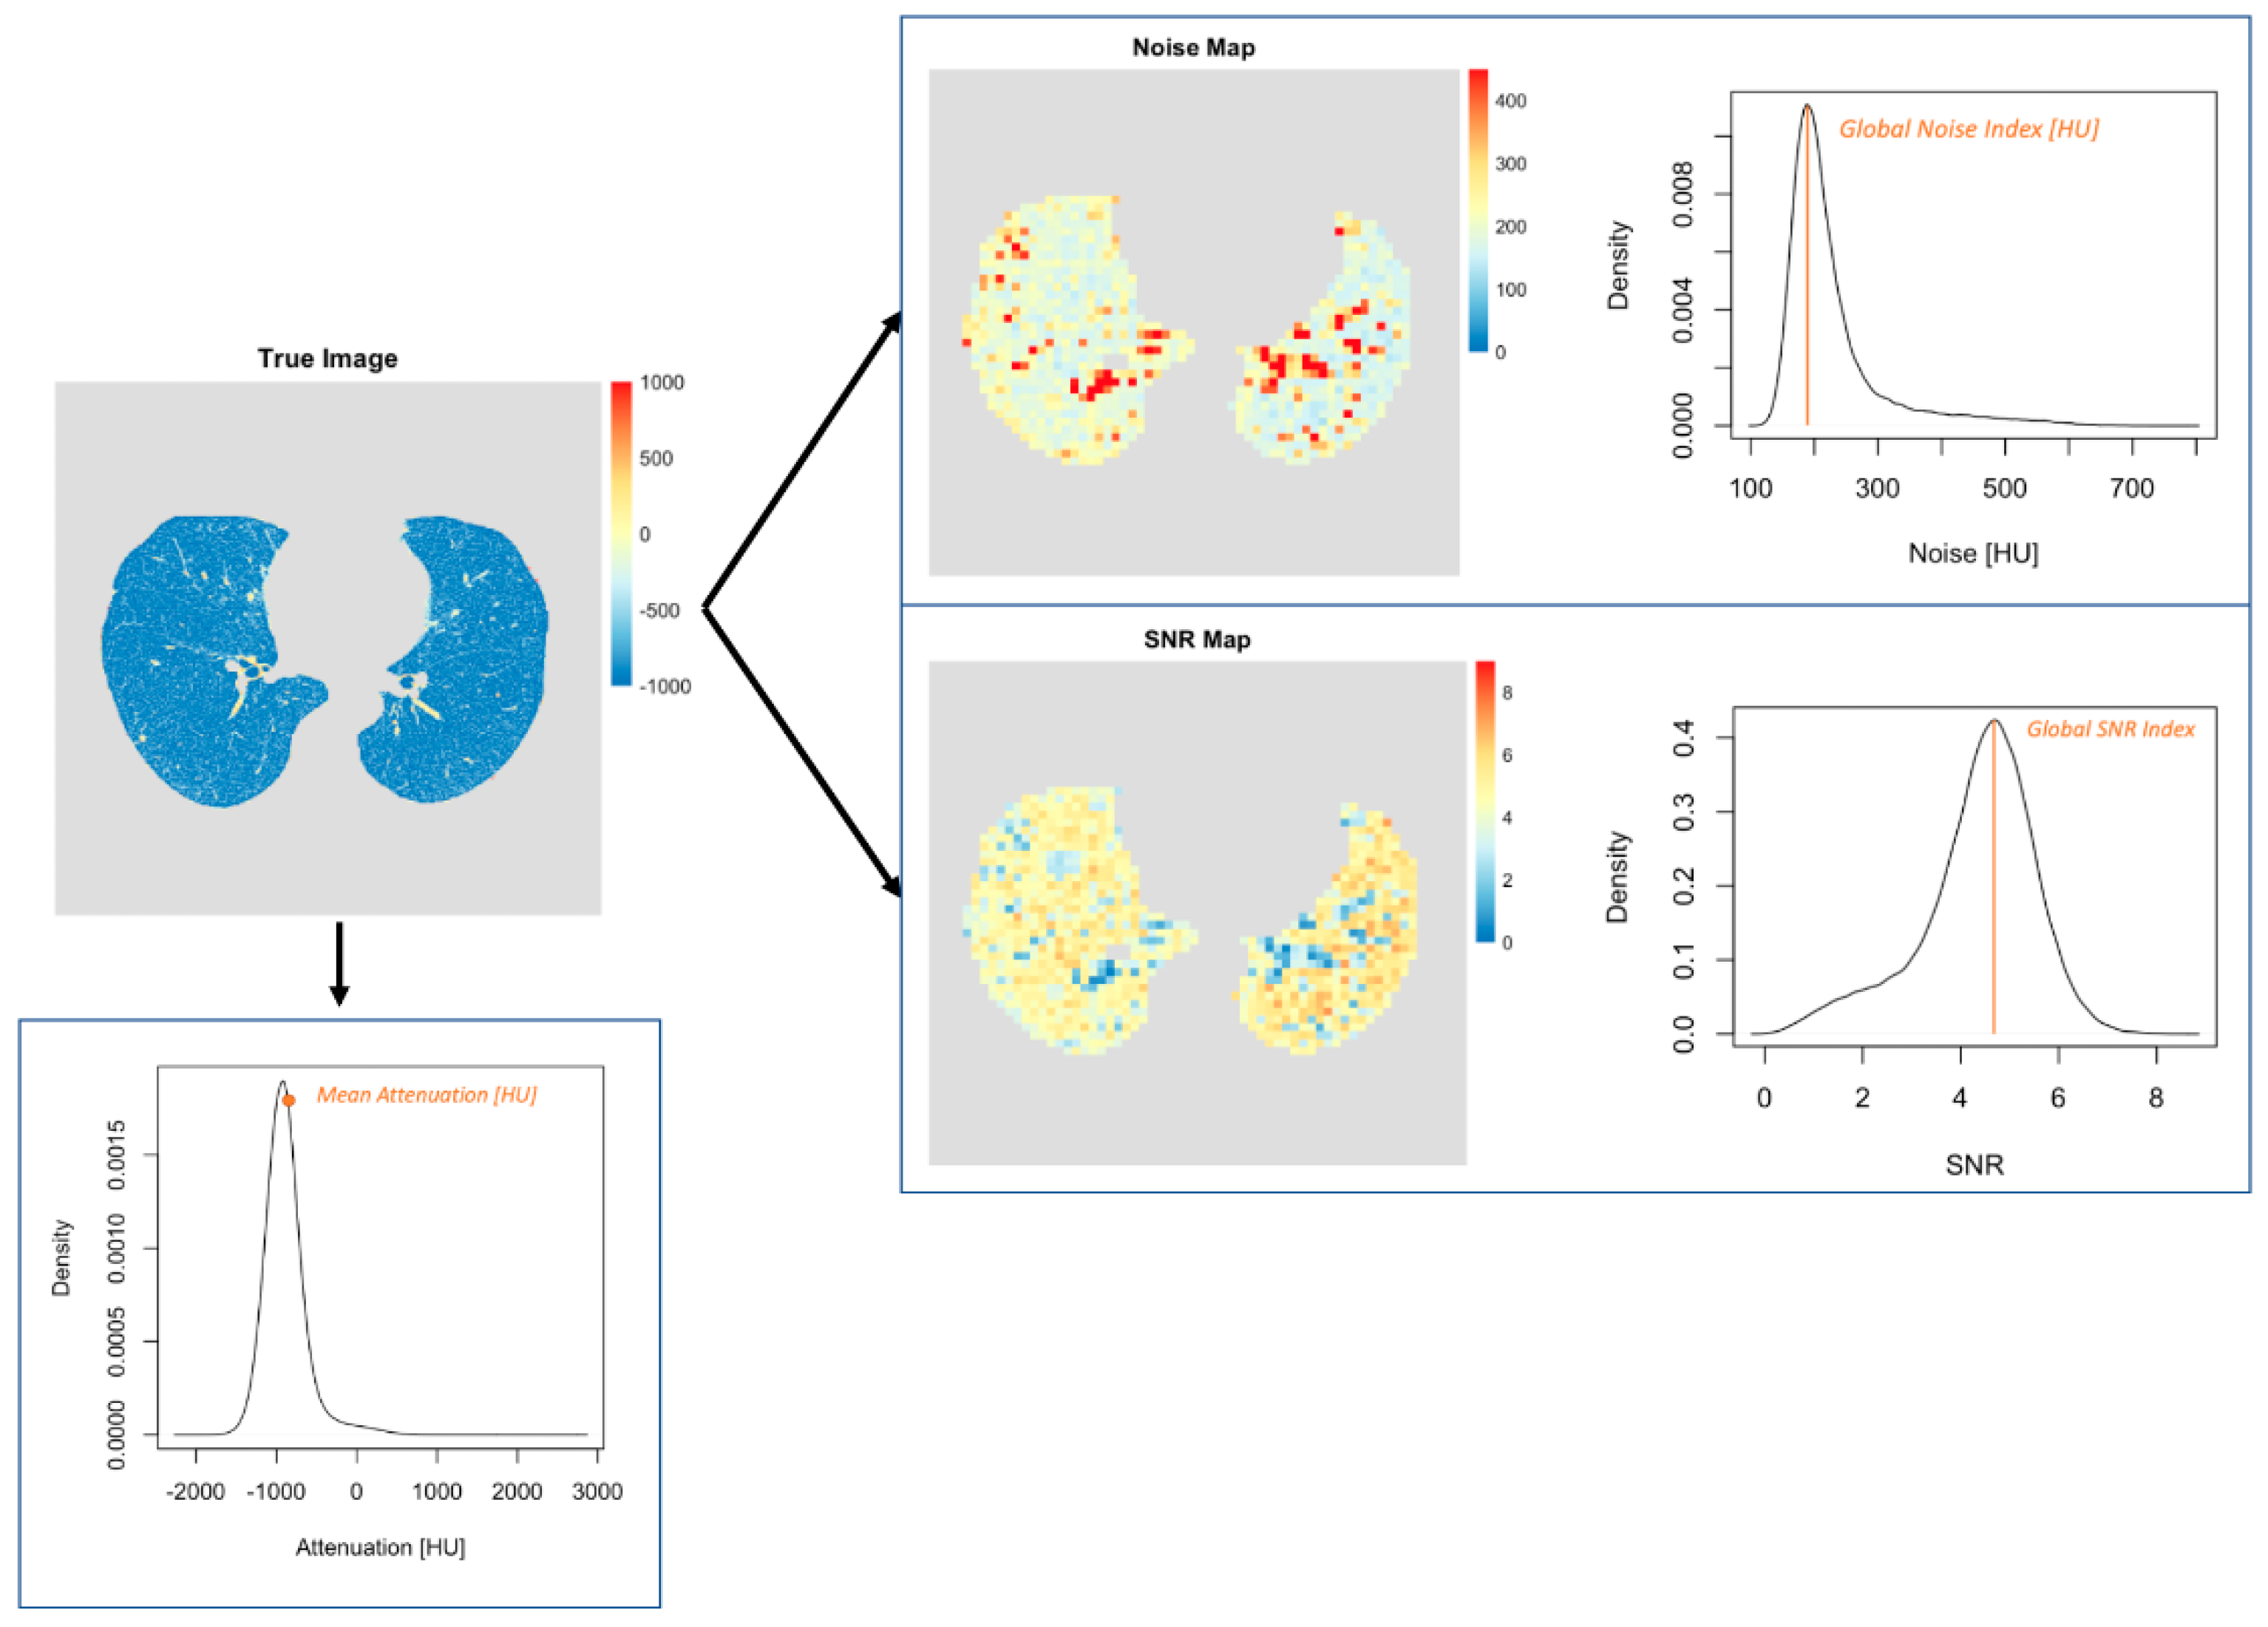
2.5. Quantitative Analysis
2.6. Qualitative Analysis
2.7. Statistical Analysis
3. Results
3.1. Phantom
3.2. Patients
3.2.1. Quantitative Analysis
3.2.2. Qualitative Analysis
4. Discussion
Author Contributions
Funding
Institutional Review Board Statement
Informed Consent Statement
Data Availability Statement
Conflicts of Interest
Abbreviations
References
- Sartoretti, T.; Eberhard, M.; Rüschoff, J.H.; Pietsch, H.; Jost, G.; Nowak, T.; Schmidt, B.; Flohr, T.; Euler, A.; Alkadhi, H. Photon-counting CT with tungsten as contrast medium: Experimental evidence of vessel lumen and plaque visualization. Atherosclerosis 2020, 310, 11–16. [Google Scholar] [CrossRef] [PubMed]
- Yu, Z.; Leng, S.; Li, Z.; Halaweish, A.F.; Kappler, S.; Ritman, E.L.; McCollough, C.H. How Low Can We Go in Radiation Dose for the Data-Completion Scan on a Research Whole-Body Photon-Counting Computed Tomography System. J. Comput. Assist. Tomogr. 2016, 40, 663–670. [Google Scholar] [CrossRef] [PubMed] [Green Version]
- Willemink, M.J.; Persson, M.; Pourmorteza, A.; Pelc, N.J.; Fleischmann, D. Photon-counting CT: Technical Principles and Clinical Prospects. Radiology 2018, 289, 293–312. [Google Scholar] [CrossRef] [PubMed]
- Rajagopal, J.R.; Farhadi, F.; Solomon, J.; Sahbaee, P.; Saboury, B.; Pritchard, W.F.; Jones, E.C.; Samei, E. Comparison of Low Dose Performance of Photon-Counting and Energy Integrating CT. Acad. Radiol. 2020, 28, 1754–1760. [Google Scholar] [CrossRef] [PubMed]
- Nowak, T.; Eberhard, M.; Schmidt, B.; Frey, D.; Distler, O.; Saltybaeva, N.; Alkadhi, H.; Euler, A. Bone Mineral Density Quantification from Localizer Radiographs: Accuracy and Precision of Energy-integrating Detector CT and Photon-counting Detector CT. Radiology 2021, 298, 147–152. [Google Scholar] [CrossRef] [PubMed]
- Zhou, W.; Michalak, G.J.; Weaver, J.M.; Gong, H.; Yu, L.; McCollough, C.H.; Leng, S. A Universal Protocol for Abdominal CT Examinations Performed on a Photon-Counting Detector CT System: A Feasibility Study. Invest Radiol. 2020, 55, 226–232. [Google Scholar] [CrossRef] [PubMed]
- Eberhard, M.; Mergen, V.; Higashigaito, K.; Allmendinger, T.; Manka, R.; Flohr, T.; Schmidt, B.; Euler, A.; Alkadhi, H. Coronary Calcium Scoring with First Generation Dual-Source Photon-Counting CT—First Evidence from Phantom and In-Vivo Scans. Diagnostics 2021, 11, 1708. [Google Scholar] [CrossRef]
- Van der Werf, N.R.; van Gent, M.; Booij, R.; Bos, D.; van der Lugt, A.; Budde, R.P.J.; Greuter, M.J.W.; van Straten, M. Dose Reduction in Coronary Artery Calcium Scoring Using Mono-Energetic Images from Reduced Tube Voltage Dual-Source Photon-Counting CT Data: A Dynamic Phantom Study. Diagnostics 2021, 11, 2192. [Google Scholar] [CrossRef]
- Rotzinger, D.C.; Racine, D.; Becce, F.; Lahoud, E.; Erhard, K.; Si-Mohamed, S.A.; Greffier, J.; Viry, A.; Boussel, L.; Meuli, R.A.; et al. Performance of Spectral Photon-Counting Coronary CT Angiography and Comparison with Energy-Integrating-Detector CT: Objective Assessment with Model Observer. Diagnostics 2021, 11, 2376. [Google Scholar] [CrossRef]
- Leng, S.; Yu, Z.; Halaweish, A.; Kappler, S.; Hahn, K.; Henning, A.; Li, Z.; Lane, J.; Levin, D.L.; Jorgensen, S.; et al. Dose-efficient ultrahigh-resolution scan mode using a photon counting detector computed tomography system. J. Med. Imaging 2016, 3, 043504. [Google Scholar] [CrossRef] [Green Version]
- Rajendran, K.; Voss, B.A.; Zhou, W.; Tao, S.; Delone, D.R.; Lane, J.I.; Weaver, J.M.; Carlson, M.L.; Fletcher, J.G.; McCollough, C.H.; et al. Dose Reduction for Sinus and Temporal Bone Imaging Using Photon-Counting Detector CT With an Additional Tin Filter. Investig. Radiol. 2020, 55, 91–100. [Google Scholar] [CrossRef] [PubMed]
- Klein, L.; Dorn, S.; Amato, C.; Heinze, S.; Uhrig, M.; Schlemmer, H.-P.; Kachelrieß, M.; Sawall, S. Effects of Detector Sampling on Noise Reduction in Clinical Photon-Counting Whole-Body Computed Tomography. Investig. Radiol. 2020, 55, 111–119. [Google Scholar] [CrossRef] [PubMed]
- Higashigaito, K.; Euler, A.; Eberhard, M.; Flohr, T.G.; Schmidt, B.; Alkadhi, H. Contrast-Enhanced Abdominal CT with Clinical Photon-Counting Detector CT: Assessment of Image Quality and Comparison with Energy-Integrating Detector CT. Acad. Radiol. 2021. [Google Scholar] [CrossRef] [PubMed]
- Rajendran, K.; Petersilka, M.; Henning, A.; Shanblatt, E.; Marsh, J.; Thorne, J.; Schmidt, B.; Flohr, T.; Fletcher, J.; McCollough, C.; et al. Full field-of-view, high-resolution, photon-counting detector CT: Technical assessment and initial patient experience. Phys. Med. Biol. 2021, 66, 205019. [Google Scholar] [CrossRef]
- Euler, A.; Higashigaito, K.; Mergen, V.; Sartoretti, T.; Zanini, B.; Schmidt, B.; Flohr, T.; Ulzheimer, S.; Eberhard, M.; Alkadhi, H. High-Pitch Photon-Counting Detector Computed Tomography Angiography of the Aorta: Intraindividual Comparison to Energy-Integrating Detector Computed Tomography at Equal Radiation Dose. Investig. Radiol. 2021, 57, 115–121. [Google Scholar] [CrossRef]
- Meyer, M.; Haubenreisser, H.; Raupach, R.; Schmidt, B.; Lietzmann, F.; Leidecker, C.; Allmendinger, T.; Flohr, T.; Schad, L.R.; Schoenberg, S.O.; et al. Initial results of a new generation dual source CT system using only an in-plane comb filter for ultra-high resolution temporal bone imaging. Eur. Radiol. 2014, 25, 178–185. [Google Scholar] [CrossRef]
- Jungblut, L.; Blüthgen, C.; Polacin, M.; Messerli, M.; Schmidt, B.; Euler, A.; Alkadhi, H.; Frauenfelder, T.; Martini, K. First Performance Evaluation of an Artificial Intelligence-Based Computer-Aided Detection System for Pulmonary Nodule Evaluation in Dual-Source Photon-Counting Detector CT at Different Low-Dose Levels. Investig. Radiol. 2021, 57, 108–114. [Google Scholar] [CrossRef]
- Bartlett, D.J.; Koo, C.W.; Bartholmai, B.J.; Rajendran, K.; Weaver, J.M.; Halaweish, A.F.; Leng, S.; McCollough, C.H.; Fletcher, J.G. High-Resolution Chest Computed Tomography Imaging of the Lungs: Impact of 1024 Matrix Reconstruction and Photon-Counting Detector Computed Tomography. Investig. Radiol. 2019, 54, 129–137. [Google Scholar] [CrossRef]
- Leng, S.; Rajendran, K.; Gong, H.; Zhou, W.; Halaweish, A.F.; Henning, A.; Kappler, S.; Baer, M.; Fletcher, J.; McCollough, C.H. 150-μm Spatial Resolution Using Photon-Counting Detector Computed Tomography Technology: Technical Performance and First Patient Images. Investig. Radiol. 2018, 53, 655–662. [Google Scholar] [CrossRef]
- Willemink, M.J.; Noël, P. The evolution of image reconstruction for CT—From filtered back projection to artificial intelligence. Eur. Radiol. 2018, 29, 2185–2195. [Google Scholar] [CrossRef] [Green Version]
- Mileto, A.; Guimaraes, L.S.; McCollough, C.H.; Fletcher, J.G.; Yu, L. State of the Art in Abdominal CT: The Limits of Iterative Reconstruction Algorithms. Radiology 2019, 293, 491–503. [Google Scholar] [CrossRef] [PubMed]
- Salimi, Y.; Shiri, I.; Akhavanallaf, A.; Mansouri, Z.; Manesh, A.S.; Sanaat, A.; Pakbin, M.; Askari, D.; Sandoughdaran, S.; Sharifipour, E.; et al. Deep learning-based fully automated Z-axis coverage range definition from scout scans to eliminate overscanning in chest CT imaging. Insights Imaging 2021, 12, 1–16. [Google Scholar] [CrossRef] [PubMed]
- Olthof, S.-C.; Reinert, C.; Nikolaou, K.; Pfannenberg, C.; Gatidis, S.; Benkert, T.; Küstner, T.; Krumm, P. Detection of lung lesions in breath-hold VIBE and free-breathing Spiral VIBE MRI compared to CT. Insights Into Imaging 2021, 12, 1–8. [Google Scholar] [CrossRef] [PubMed]
- Baumueller, S.; Winklehner, A.; Karlo, C.; Goetti, R.; Flohr, T.; Russi, E.W.; Frauenfelder, T.; Alkadhi, H. Low-dose CT of the lung: Potential value of iterative reconstructions. Eur. Radiol. 2012, 22, 2597–2606. [Google Scholar] [CrossRef] [Green Version]
- Racine, D.; Becce, F.; Viry, A.; Monnin, P.; Thomsen, B.; Verdun, F.R.; Rotzinger, D.C. Task-based characterization of a deep learning image reconstruction and comparison with filtered back-projection and a partial model-based iterative reconstruction in abdominal CT: A phantom study. Phys. Med. 2020, 76, 28–37. [Google Scholar] [CrossRef]
- Boone, J.M.; Brink, J.A.; Edyvean, S.; Huda, W.; Leitz, W.; McCollough, C.H.; McNitt-Gray, M.F.; Dawson, P.; Deluca, M.L.; Seltzer, M.; et al. Measurements ICoRUa. ICRU Report No. 87: Radiation dose and image-quality assessment in computed tomography. J. ICRU 2012, 12, 1–149. [Google Scholar] [CrossRef]
- Sharp, P.; Barber, D.; Brown, D.; Burgess, A.; Metz, C.; Myers, K.; Taylor, C.J.; Wagner, R.F.; Brooks, R.; Hill, C.R.; et al. Appendix D: Examples of the Application of the Ideal Observer to Medical Imaging. Rep. J. Int. Comm. Radiat. Units Meas. 1996, 28, 53–62. [Google Scholar]
- Sartoretti, T.; Landsmann, A.; Nakhostin, D.; Eberhard, M.; Röeren, C.; Mergen, V.; Higashigaito, K.; Raupach, R.; Alkadhi, H.; Euler, A. Quantum Iterative Reconstruction for Abdominal Photon-counting Detector CT Improves Image Quality. Radiology 2022, 211931. [Google Scholar] [CrossRef]
- Ryan, S.M.; Vestal, B.; Maier, L.A.; Carlson, N.E.; Muschelli, J. Template Creation for High-Resolution Computed Tomography Scans of the Lung in R Software. Acad. Radiol. 2020, 27, e204–e215. [Google Scholar] [CrossRef]
- Christianson, O.; Winslow, J.; Frush, D.; Samei, E. Automated Technique to Measure Noise in Clinical CT Examinations. Am. J. Roentgenol. 2015, 205, W93–W99. [Google Scholar] [CrossRef]
- Haubenreisser, H.; Meyer, M.; Sudarski, S.; Allmendinger, T.; Schoenberg, S.O.; Henzler, T. Unenhanced third-generation dual-source chest CT using a tin filter for spectral shaping at 100 kVp. Eur. J. Radiol. 2015, 84, 1608–1613. [Google Scholar] [CrossRef] [PubMed]
- Rotzinger, D.C.; Racine, D.; Beigelman-Aubry, C.; Alfudhili, K.M.; Keller, N.; Monnin, P.; Verdun, F.R.; Becce, F. Task-Based Model Observer Assessment of a Partial Model-Based Iterative Reconstruction Algorithm in Thoracic Oncologic Multidetector CT. Sci. Rep. 2018, 8, 17734. [Google Scholar] [CrossRef] [PubMed]
- Prakash, P.; Kalra, M.K.; Kambadakone, A.K.; Pien, H.; Hsieh, J.; Blake, M.A.; Sahani, D.V. Reducing Abdominal CT Radiation Dose with Adaptive Statistical Iterative Reconstruction Technique. Investig. Radiol. 2010, 45, 202–210. [Google Scholar] [CrossRef] [PubMed]
- Nishiyama, Y.; Tada, K.; Nishiyama, Y.; Mori, H.; Maruyama, M.; Katsube, T.; Yamamoto, N.; Kanayama, H.; Yamamoto, Y.; Kitagaki, H. Effect of the forward-projected model-based iterative reconstruction solution algorithm on image quality and radiation dose in pediatric cardiac computed tomography. Pediatr. Radiol. 2016, 46, 1663–1670. [Google Scholar] [CrossRef]
- Ichikawa, K.; Kobayashi, T.; Sagawa, M.; Katagiri, A.; Uno, Y.; Nishioka, R.; Matsuyama, J. A phantom study investigating the relationship between ground-glass opacity visibility and physical detectability index in low-dose chest computed tomography. J. Appl. Clin. Med. Phys. 2015, 16, 202–215. [Google Scholar] [CrossRef]
- Laurent, G.; Villani, N.; Hossu, G.; Rauch, A.; Noël, A.; Blum, A.; Teixeira, P.A.G. Full model-based iterative reconstruction (MBIR) in abdominal CT increases objective image quality, but decreases subjective acceptance. Eur. Radiol. 2019, 29, 4016–4025. [Google Scholar] [CrossRef]
- Singh, R.; Digumarthy, S.R.; Muse, V.V.; Kambadakone, A.R.; Blake, M.A.; Tabari, A.; Hoi, Y.; Akino, N.; Angel, E.; Madan, R.; et al. Image Quality and Lesion Detection on Deep Learning Reconstruction and Iterative Reconstruction of Submillisievert Chest and Abdominal CT. Am. J. Roentgenol. 2020, 214, 566–573. [Google Scholar] [CrossRef]
- Karmazyn, B.; Liang, Y.; Ai, H.; Eckert, G.J.; Cohen, M.D.; Wanner, M.R.; Jennings, S.G. Optimization of Hybrid Iterative Reconstruction Level in Pediatric Body CT. Am. J. Roentgenol. 2014, 202, 426–431. [Google Scholar] [CrossRef]
- Nelson, R.C.; Feuerlein, S.; Boll, D.T. New iterative reconstruction techniques for cardiovascular computed tomography: How do they work, and what are the advantages and disadvantages? J. Cardiovasc. Comput. Tomogr. 2011, 5, 286–292. [Google Scholar] [CrossRef]
- Morsbach, F.; Desbiolles, L.; Raupach, R.; Leschka, S.; Schmidt, B.; Alkadhi, H. Noise Texture Deviation: A Measure for Quantifying Artifacts in Computed Tomography Images with Iterative Reconstructions. Investig. Radiol. 2017, 52, 87–94. [Google Scholar] [CrossRef] [Green Version]
- Penha, D.; Pinto, E.; Hochhegger, B.; Monaghan, C.; Marchiori, E.; Taborda-Barata, L.; Irion, K. The impact of lung parenchyma attenuation on nodule volumetry in lung cancer screening. Insights Imaging 2021, 12, 1–9. [Google Scholar] [CrossRef] [PubMed]
- Demb, J.; Chu, P.; Yu, S.; Whitebird, R.; Solberg, L.; Miglioretti, D.L.; Smith-Bindman, R. Analysis of Computed Tomography Radiation Doses Used for Lung Cancer Screening Scans. JAMA Intern. Med. 2019, 179, 1650–1657. [Google Scholar] [CrossRef] [PubMed]
- Kim, J.H.; Yoon, H.J.; Lee, E.; Kim, I.; Cha, Y.K.; Bak, S.H. Validation of Deep-Learning Image Reconstruction for Low-Dose Chest Computed Tomography Scan: Emphasis on Image Quality and Noise. Korean J. Radiol. 2021, 22, 131–138. [Google Scholar] [CrossRef] [PubMed]


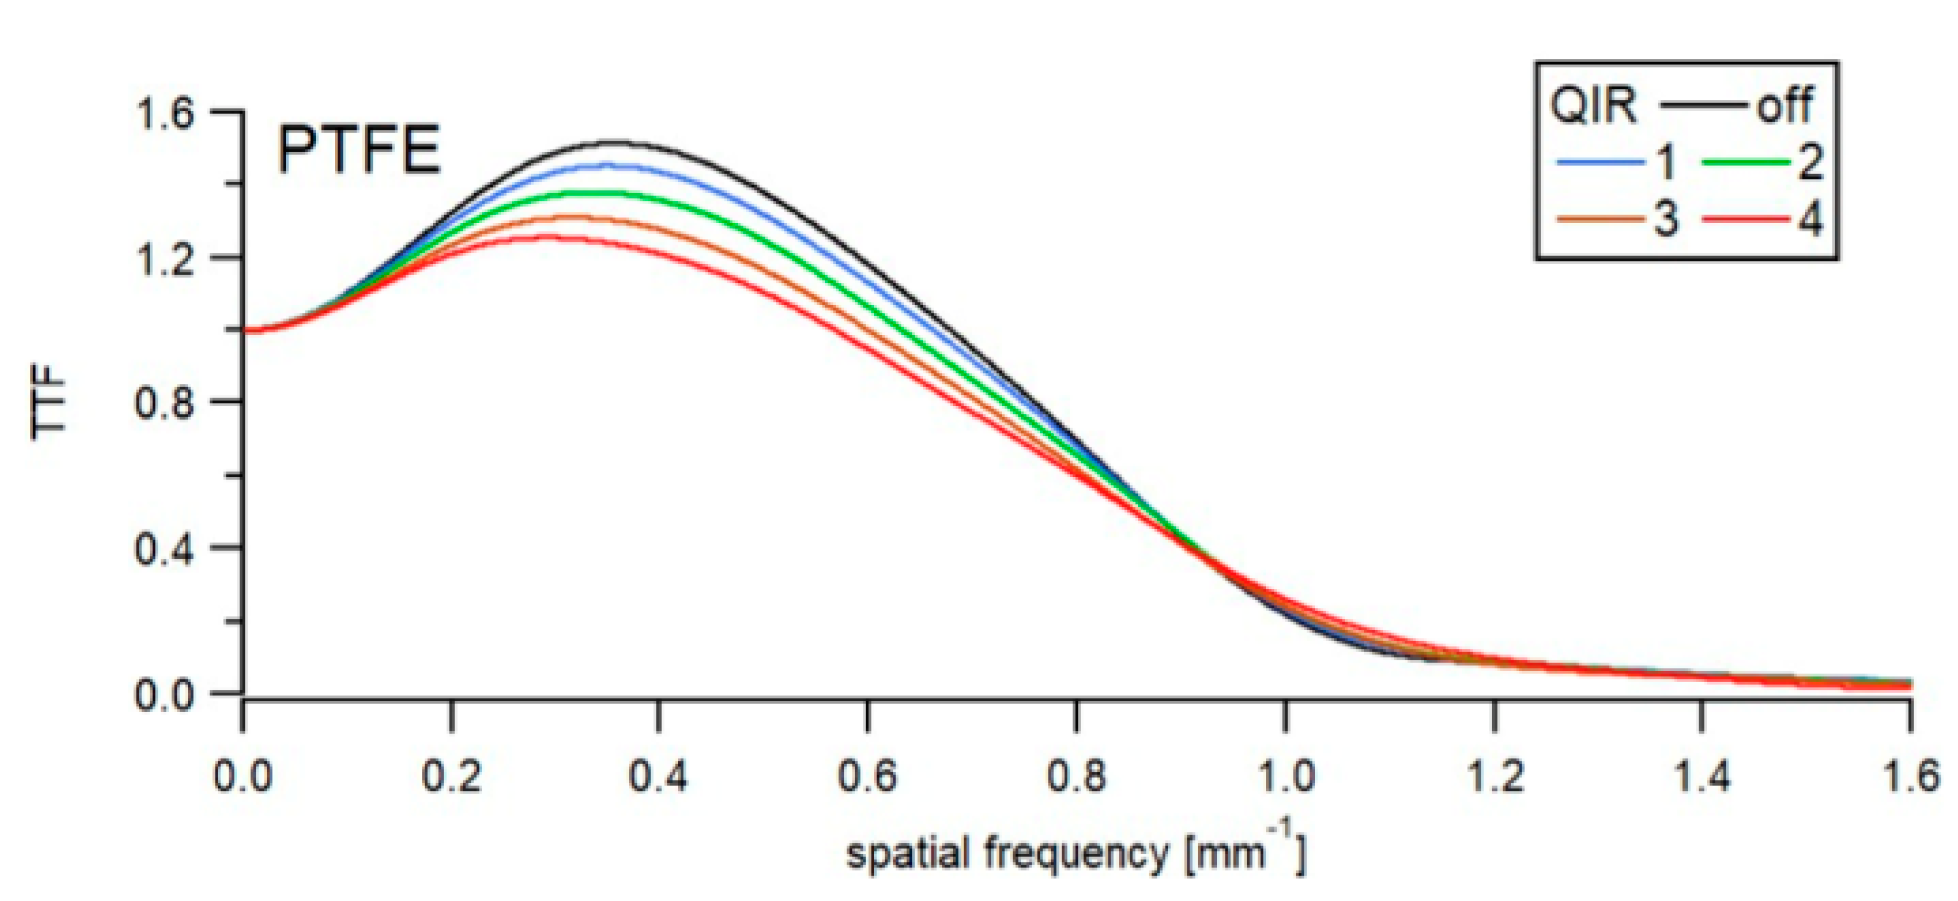
| Algorithm | TTF50 | TTF10 |
|---|---|---|
| QIR 1 | 0 | 2.7 |
| QIR 2 | −0.2 | 3.6 |
| QIR 3 | −1.8 | 2.1 |
| QIR 4 | −2.0 | 6.1 |
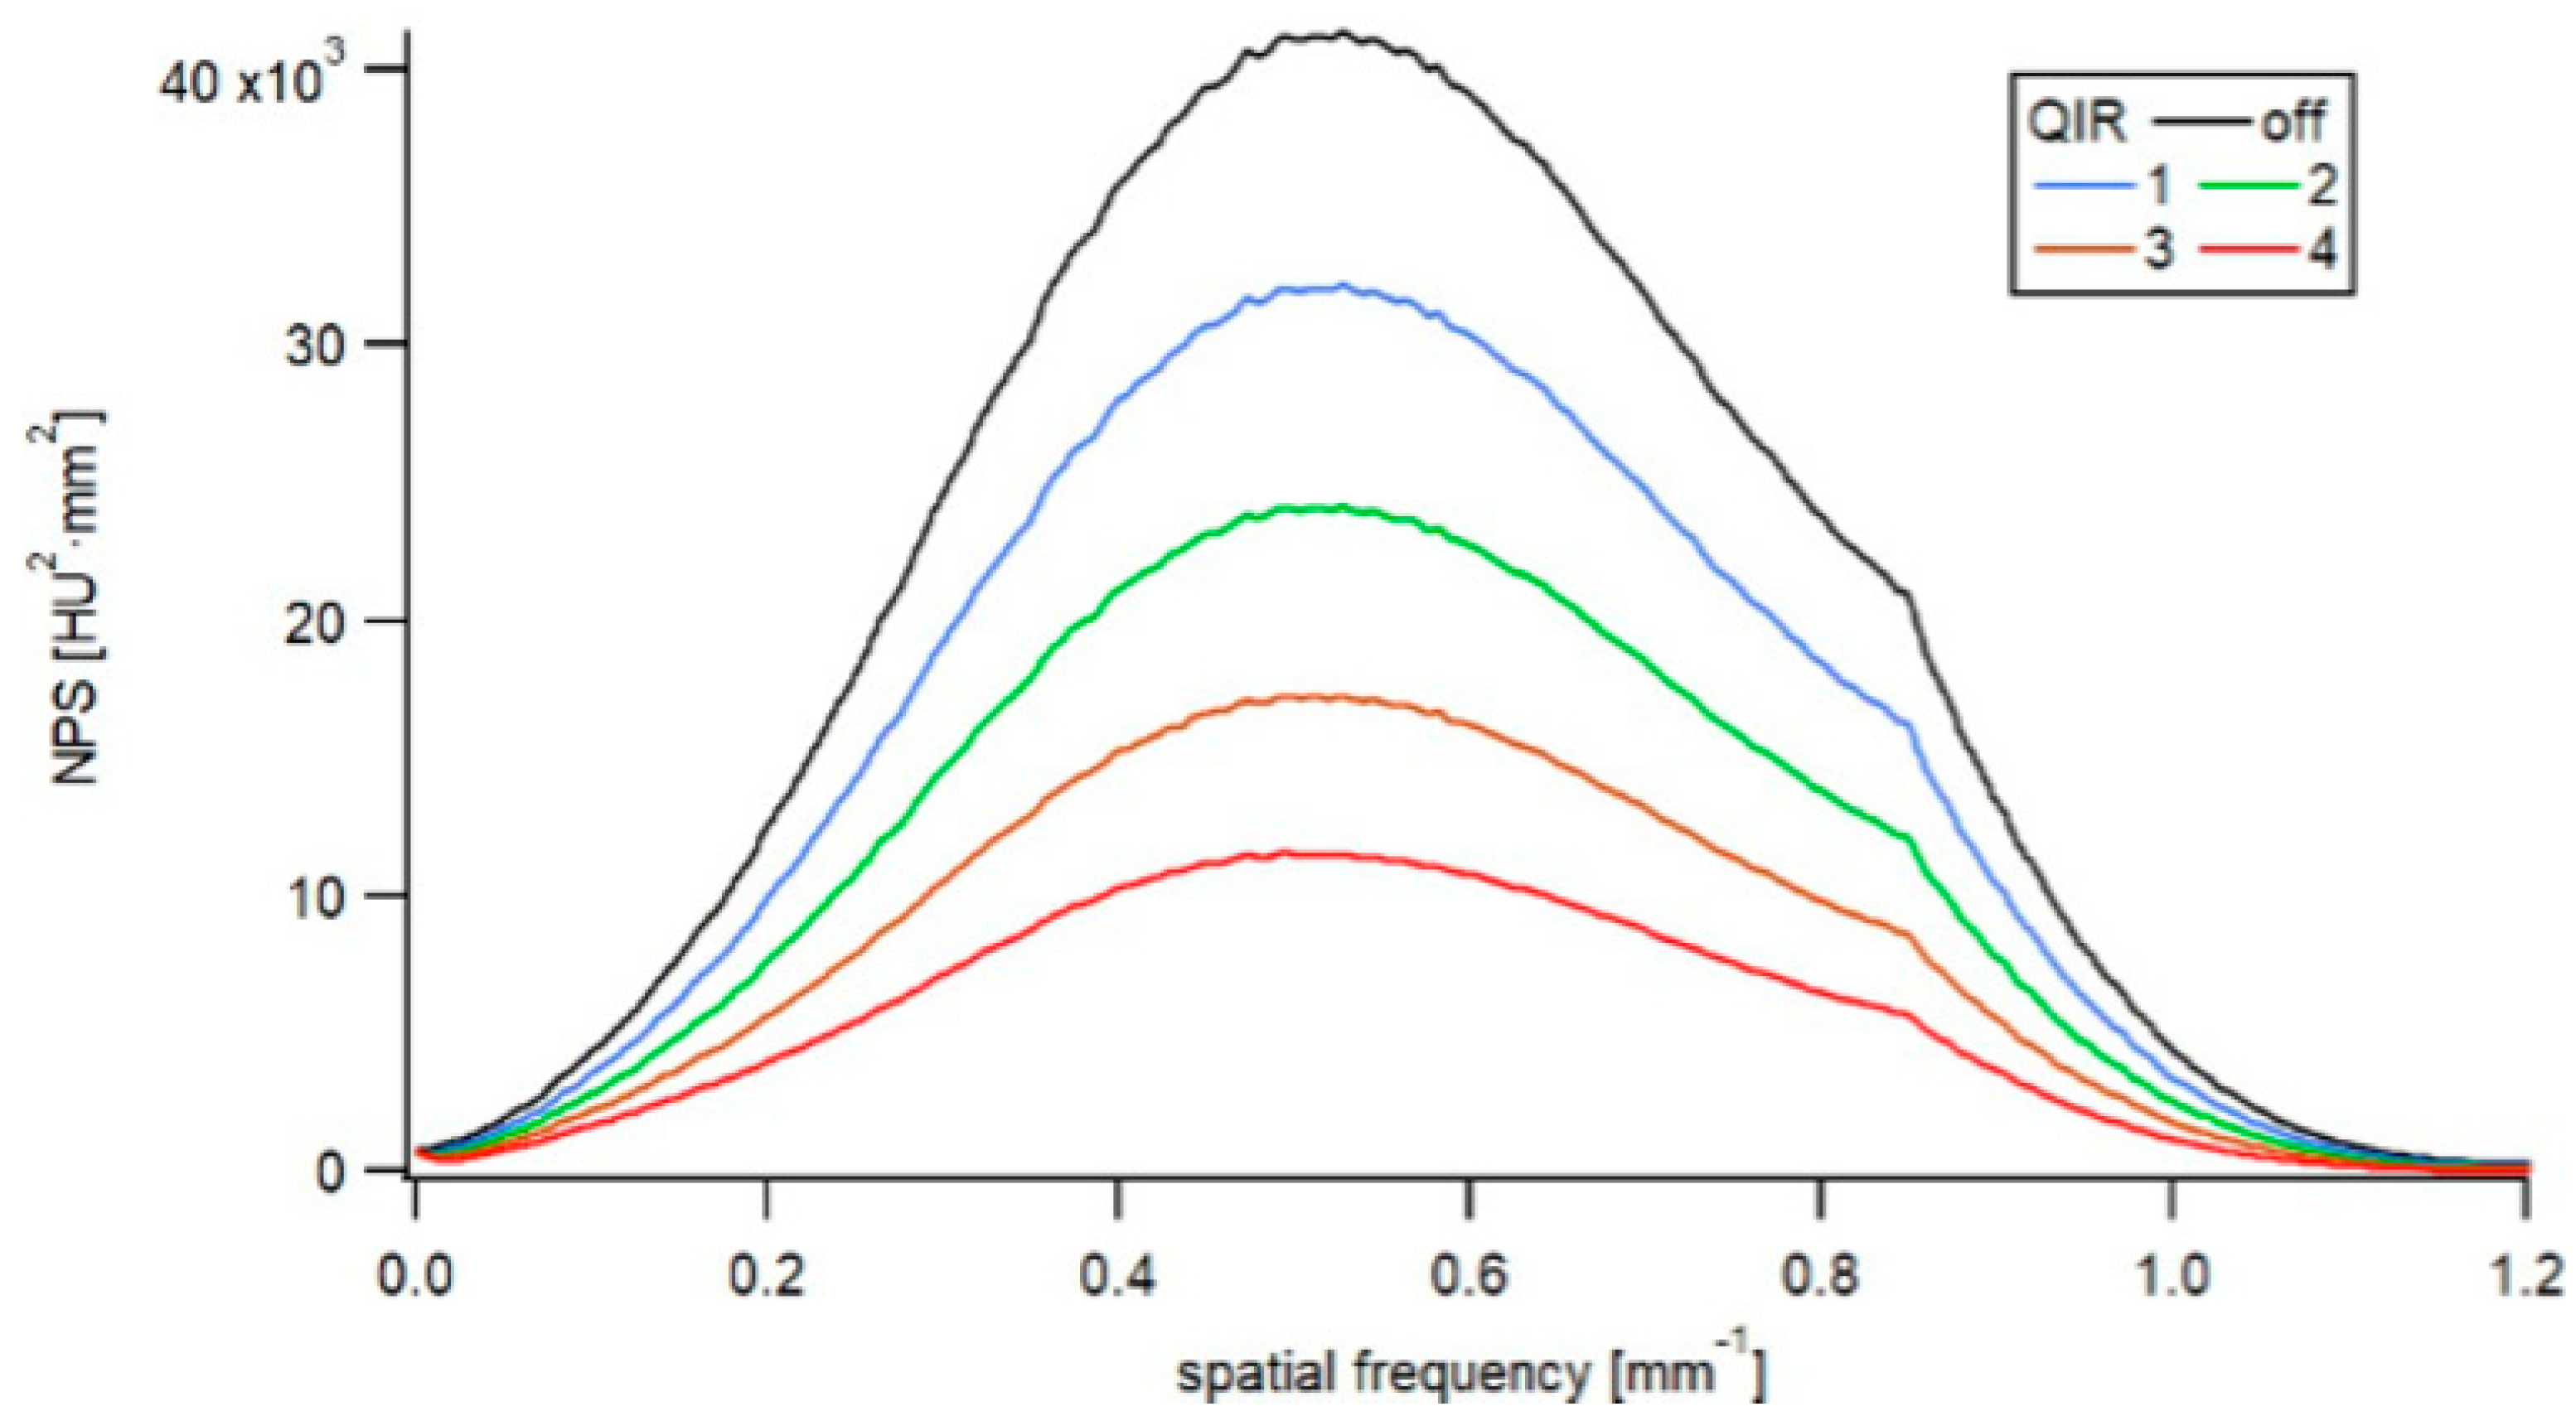
| Algorithm | NPS Peak Frequency Shifts (%) |
|---|---|
| QIR-1 | 0.0 |
| QIR-2 | 0.0 |
| QIR-3 | 0.0 |
| QIR-4 | −6.7 |
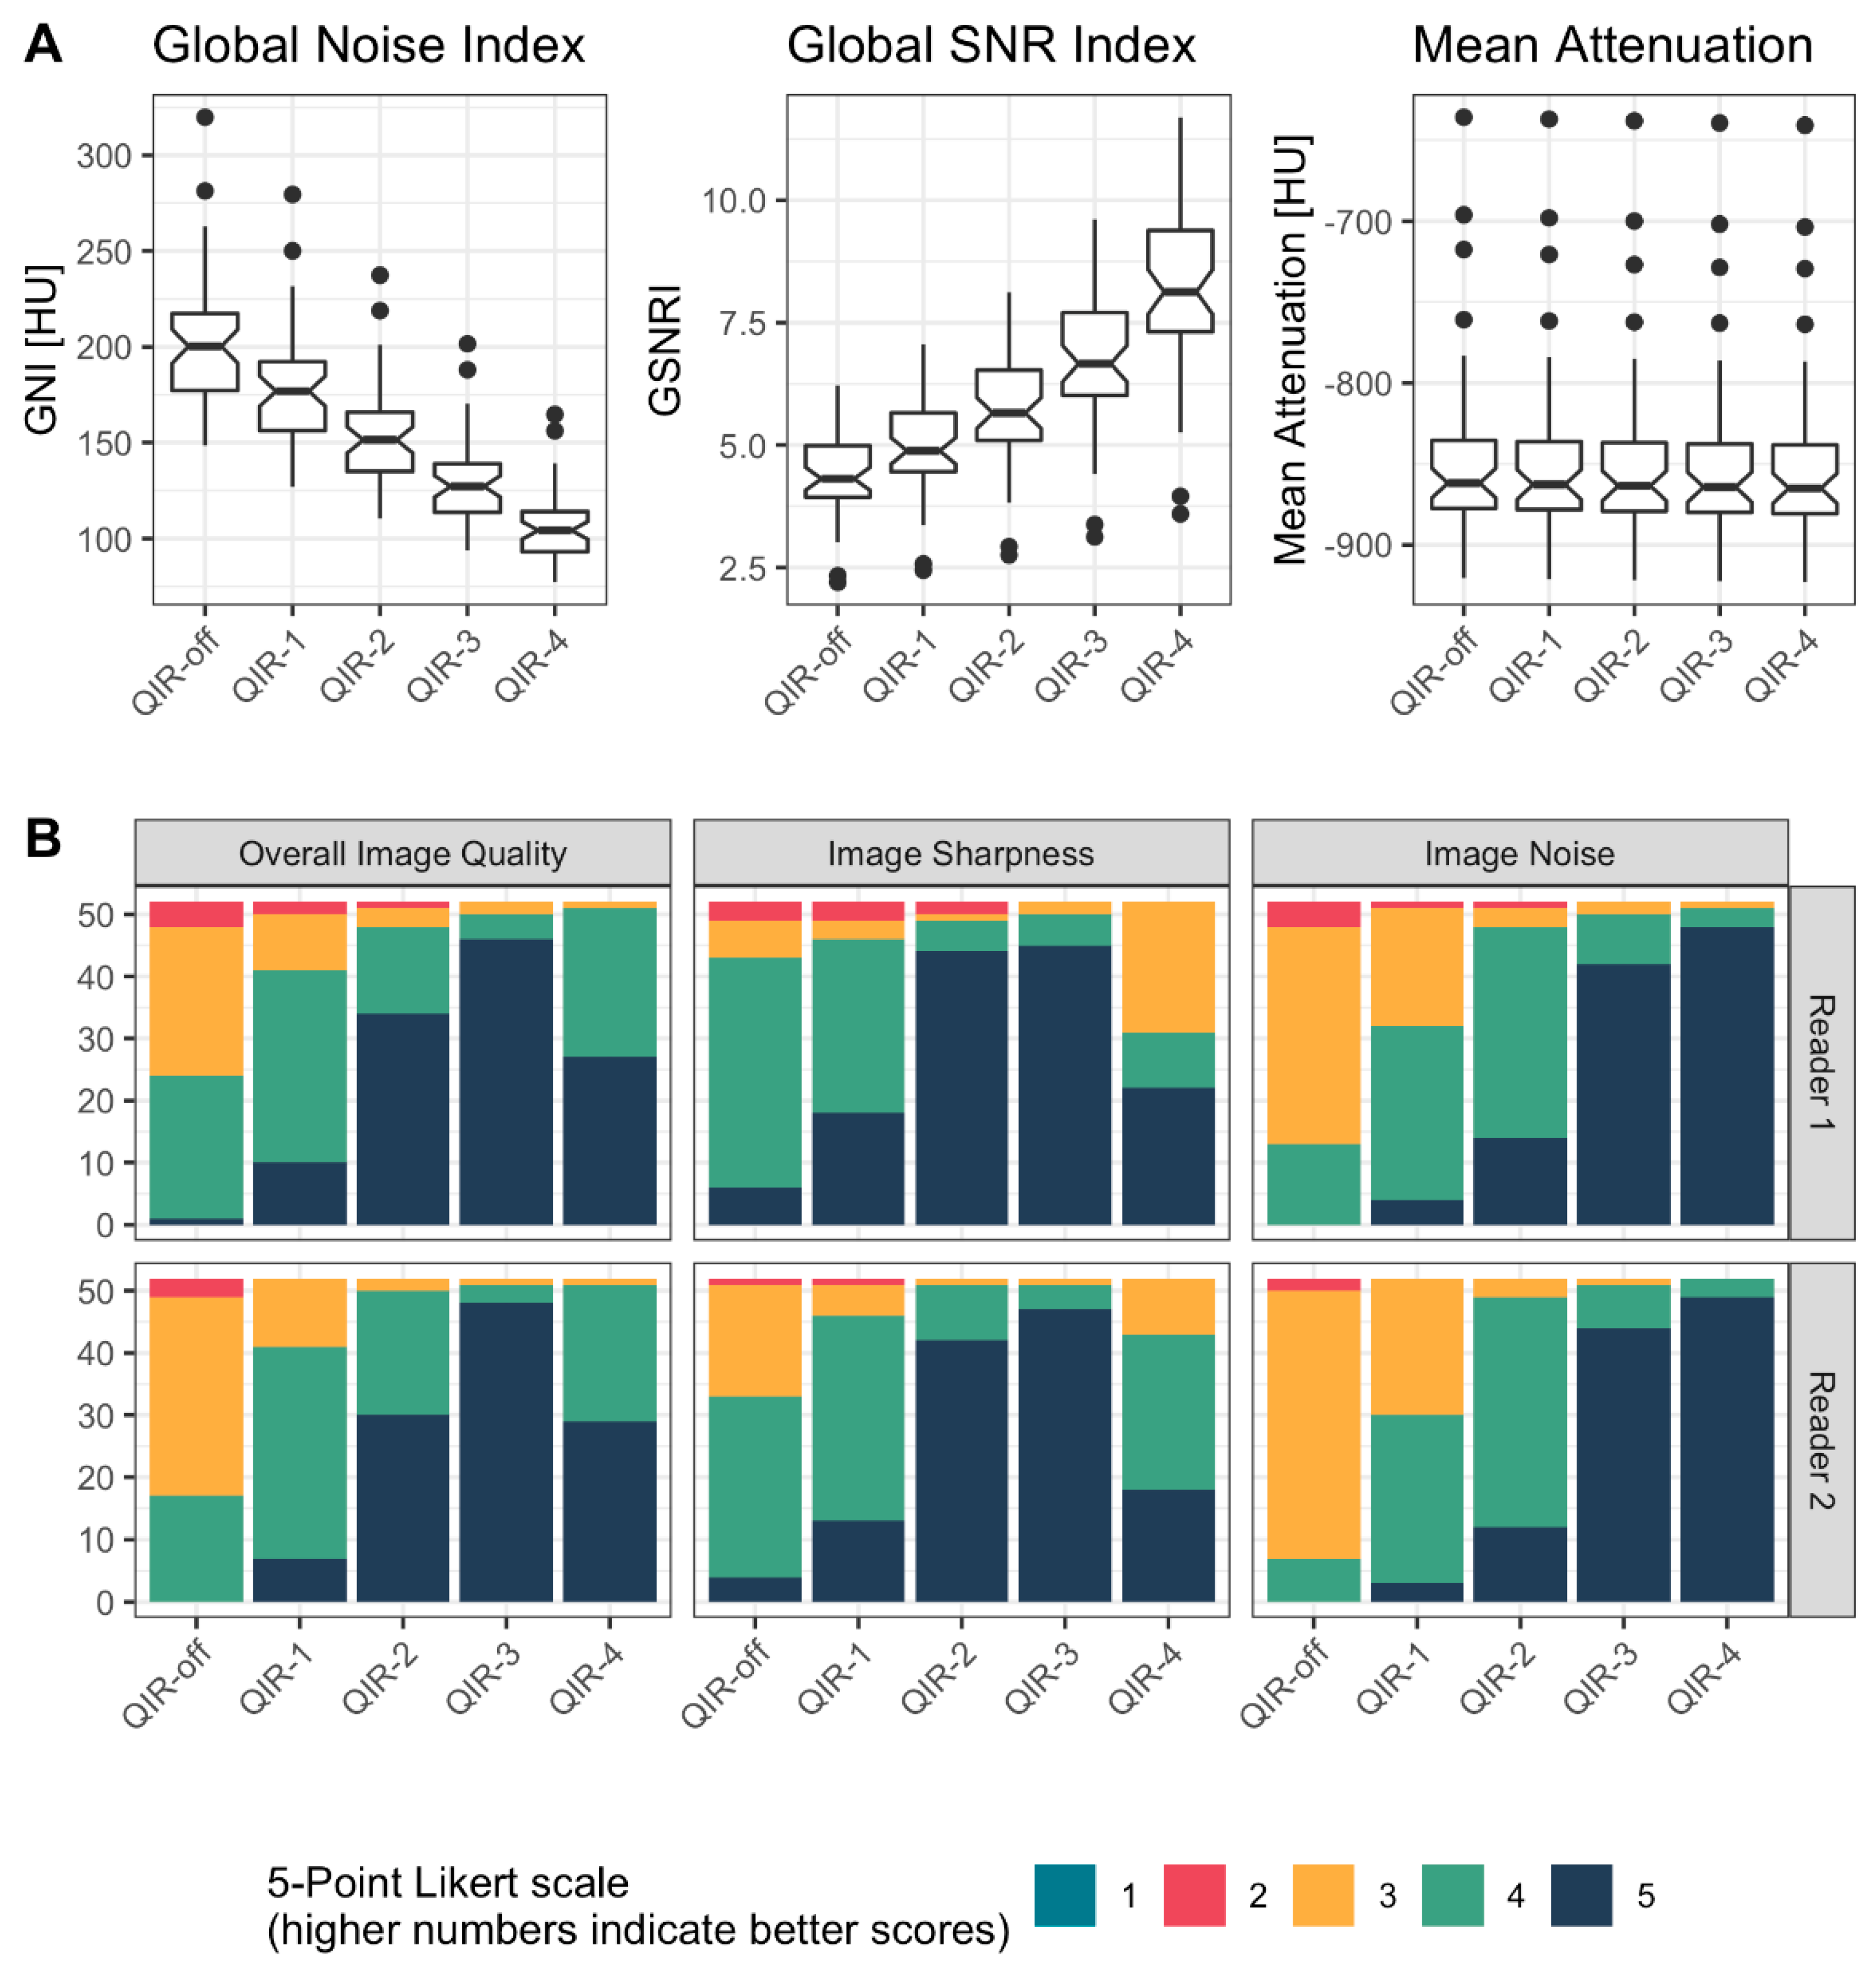
| QIR-Off | QIR-1 | QIR-2 | QIR-3 | QIR-4 | |
|---|---|---|---|---|---|
| Global Noise Index [HU] | 202 ± 34 | 178 ± 30 | 154 ± 26 | 130 ± 22 | 106 ± 18 |
| Global SNR Index | 4.4 ± 0.8 | 5 ± 0.9 | 5.7 ± 1.1 | 6.7 ± 1.3 | 8.2 ± 1.6 |
| Mean Attenuation [HU] | −849 ± 53 | −850 ± 53 | −851 ± 52 | −852 ± 52 | −852 ± 52 |
| Overall Image Quality | R1: 3; [3,4] R2: 3; [3,4] | R1: 4; [4,4] R2: 4; [4,4] | R1: 5; [4,5] R2: 5; [4,5] | R1: 5; [5,5] R2: 5; [5,5] | R1: 5; [4,5] R2: 5; [4,5] |
| Image Sharpness | R1: 4; [4,4] R2: 4; [3,4] | R1: 4; [4,5] R2: 4; [4,4.25] | R1: 5; [5,5] R2: 5; [5,5] | R1: 5; [5,5] R2: 5; [5,5] | R1: 4; [3,5] R2: 4; [4,5] |
| Image Noise | R1: 3; [3,3.25] R2: 3; [3,3] | R1: 4; [3,4] R2: 4; [3,4] | R1: 4; [4,5] R2: 4; [4,4] | R1: 5; [5,5] R2: 5; [5,5] | R1: 5; [5,5] R2: 5; [5,5] |
Publisher’s Note: MDPI stays neutral with regard to jurisdictional claims in published maps and institutional affiliations. |
© 2022 by the authors. Licensee MDPI, Basel, Switzerland. This article is an open access article distributed under the terms and conditions of the Creative Commons Attribution (CC BY) license (https://creativecommons.org/licenses/by/4.0/).
Share and Cite
Sartoretti, T.; Racine, D.; Mergen, V.; Jungblut, L.; Monnin, P.; Flohr, T.G.; Martini, K.; Frauenfelder, T.; Alkadhi, H.; Euler, A. Quantum Iterative Reconstruction for Low-Dose Ultra-High-Resolution Photon-Counting Detector CT of the Lung. Diagnostics 2022, 12, 522. https://doi.org/10.3390/diagnostics12020522
Sartoretti T, Racine D, Mergen V, Jungblut L, Monnin P, Flohr TG, Martini K, Frauenfelder T, Alkadhi H, Euler A. Quantum Iterative Reconstruction for Low-Dose Ultra-High-Resolution Photon-Counting Detector CT of the Lung. Diagnostics. 2022; 12(2):522. https://doi.org/10.3390/diagnostics12020522
Chicago/Turabian StyleSartoretti, Thomas, Damien Racine, Victor Mergen, Lisa Jungblut, Pascal Monnin, Thomas G. Flohr, Katharina Martini, Thomas Frauenfelder, Hatem Alkadhi, and André Euler. 2022. "Quantum Iterative Reconstruction for Low-Dose Ultra-High-Resolution Photon-Counting Detector CT of the Lung" Diagnostics 12, no. 2: 522. https://doi.org/10.3390/diagnostics12020522