
Bone-Metabolism-Related Serum microRNAs to Diagnose Osteoporosis in Middle-Aged and Elderly Women
 , , and
Abstract
:1. Introduction
2. Materials and Methods
2.1. Participants
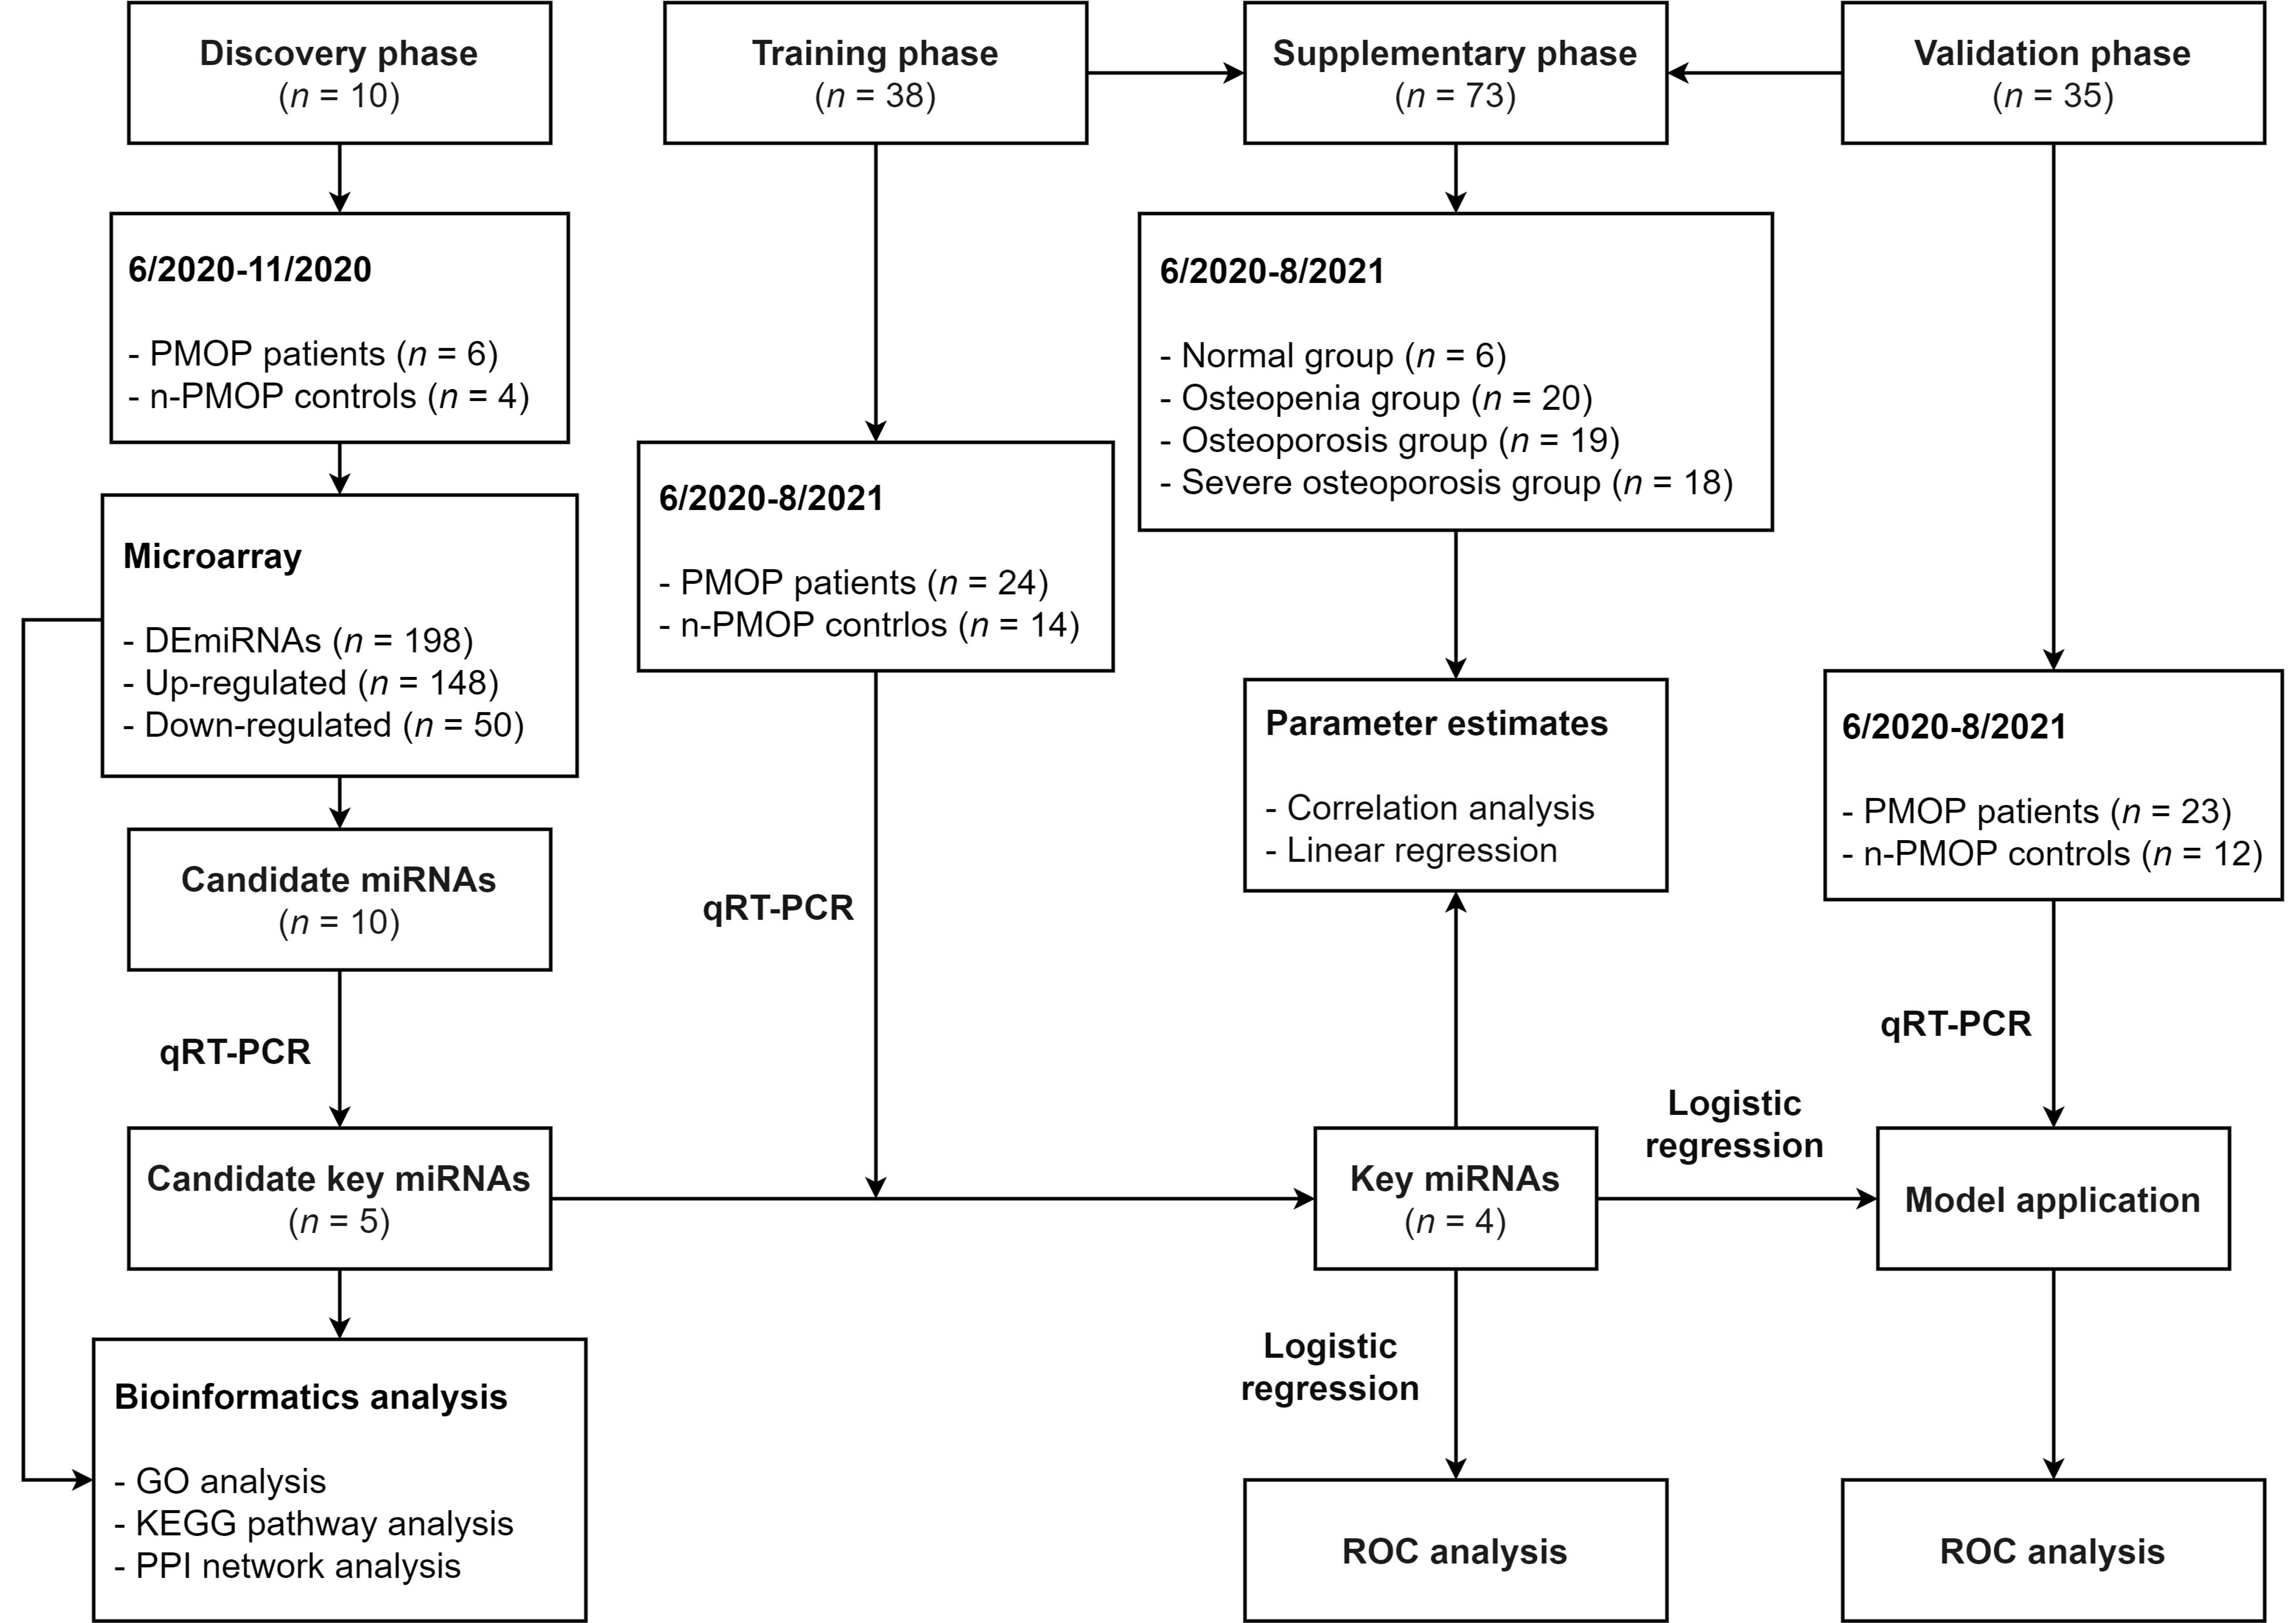
2.2. Study Design
2.3. Anthropometric Measurements
2.4. Biochemical and Immunological Analysis
2.5. RNA Extraction
2.6. Microarray
2.7. qRT–PCR
2.8. Bioinformatics Analysis
2.9. Statistical Analysis
3. Results
3.1. Clinical Characteristics of the Participants
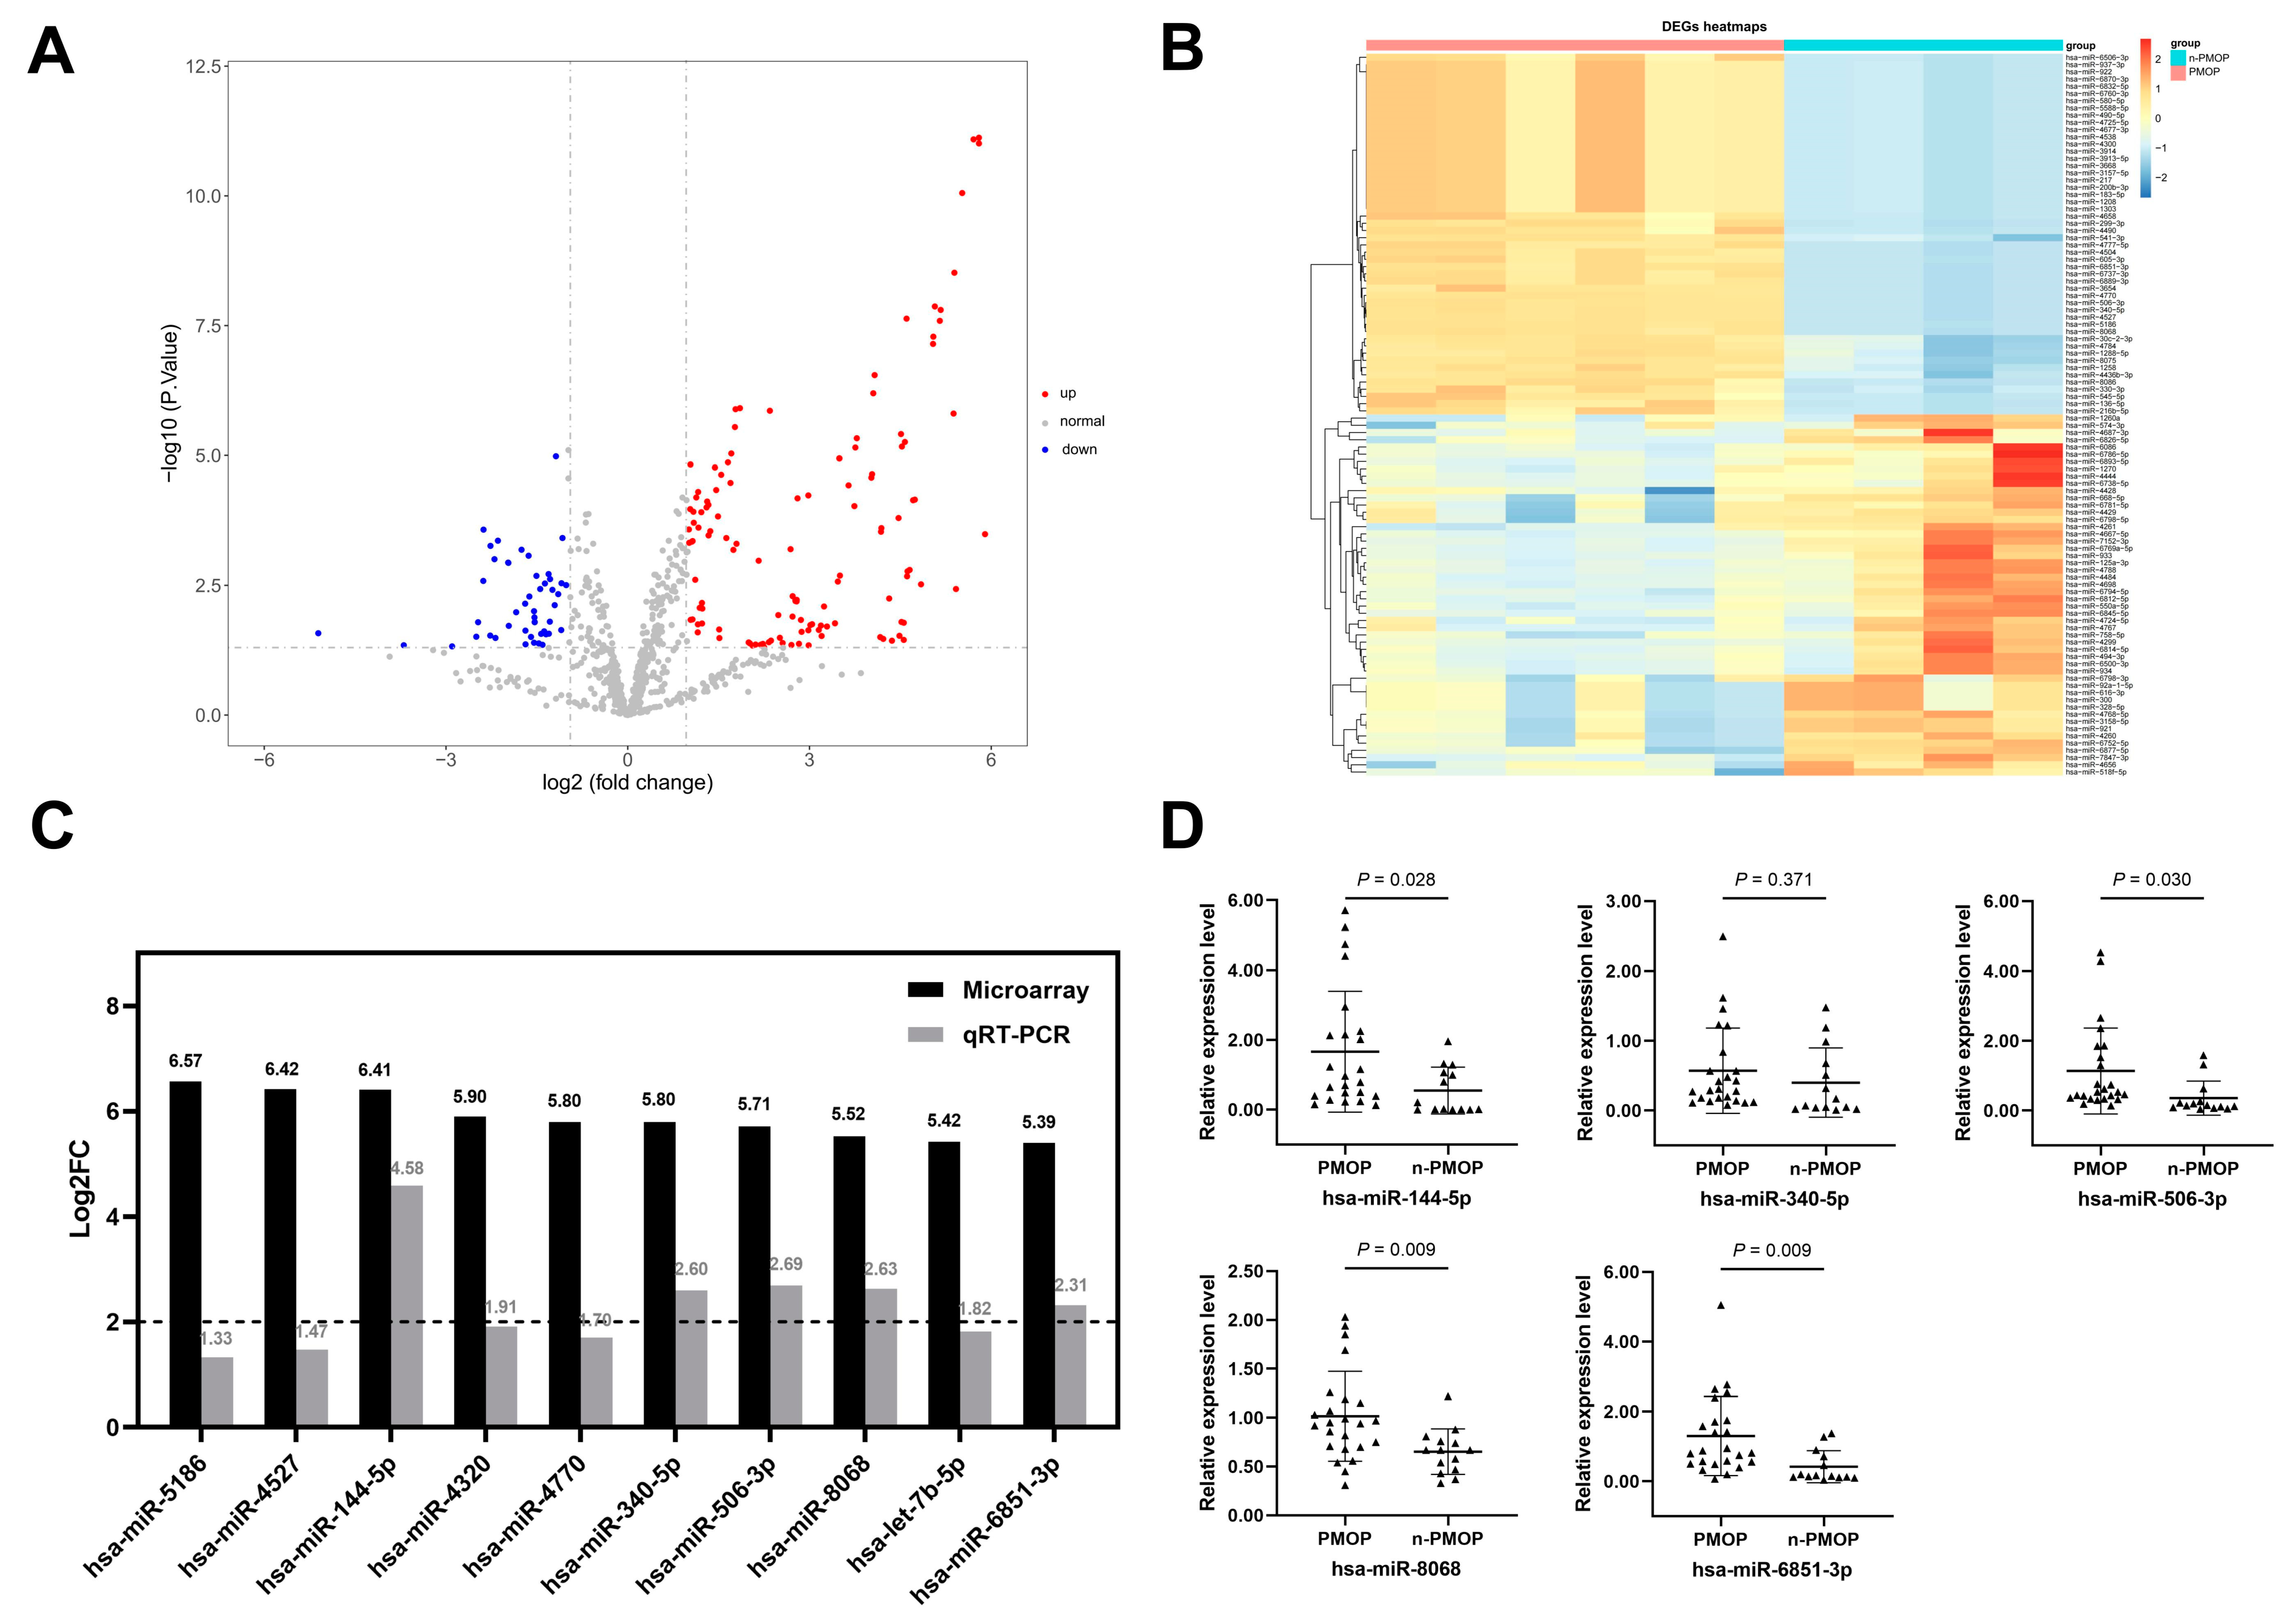
3.2. Screening of Key miRNAs
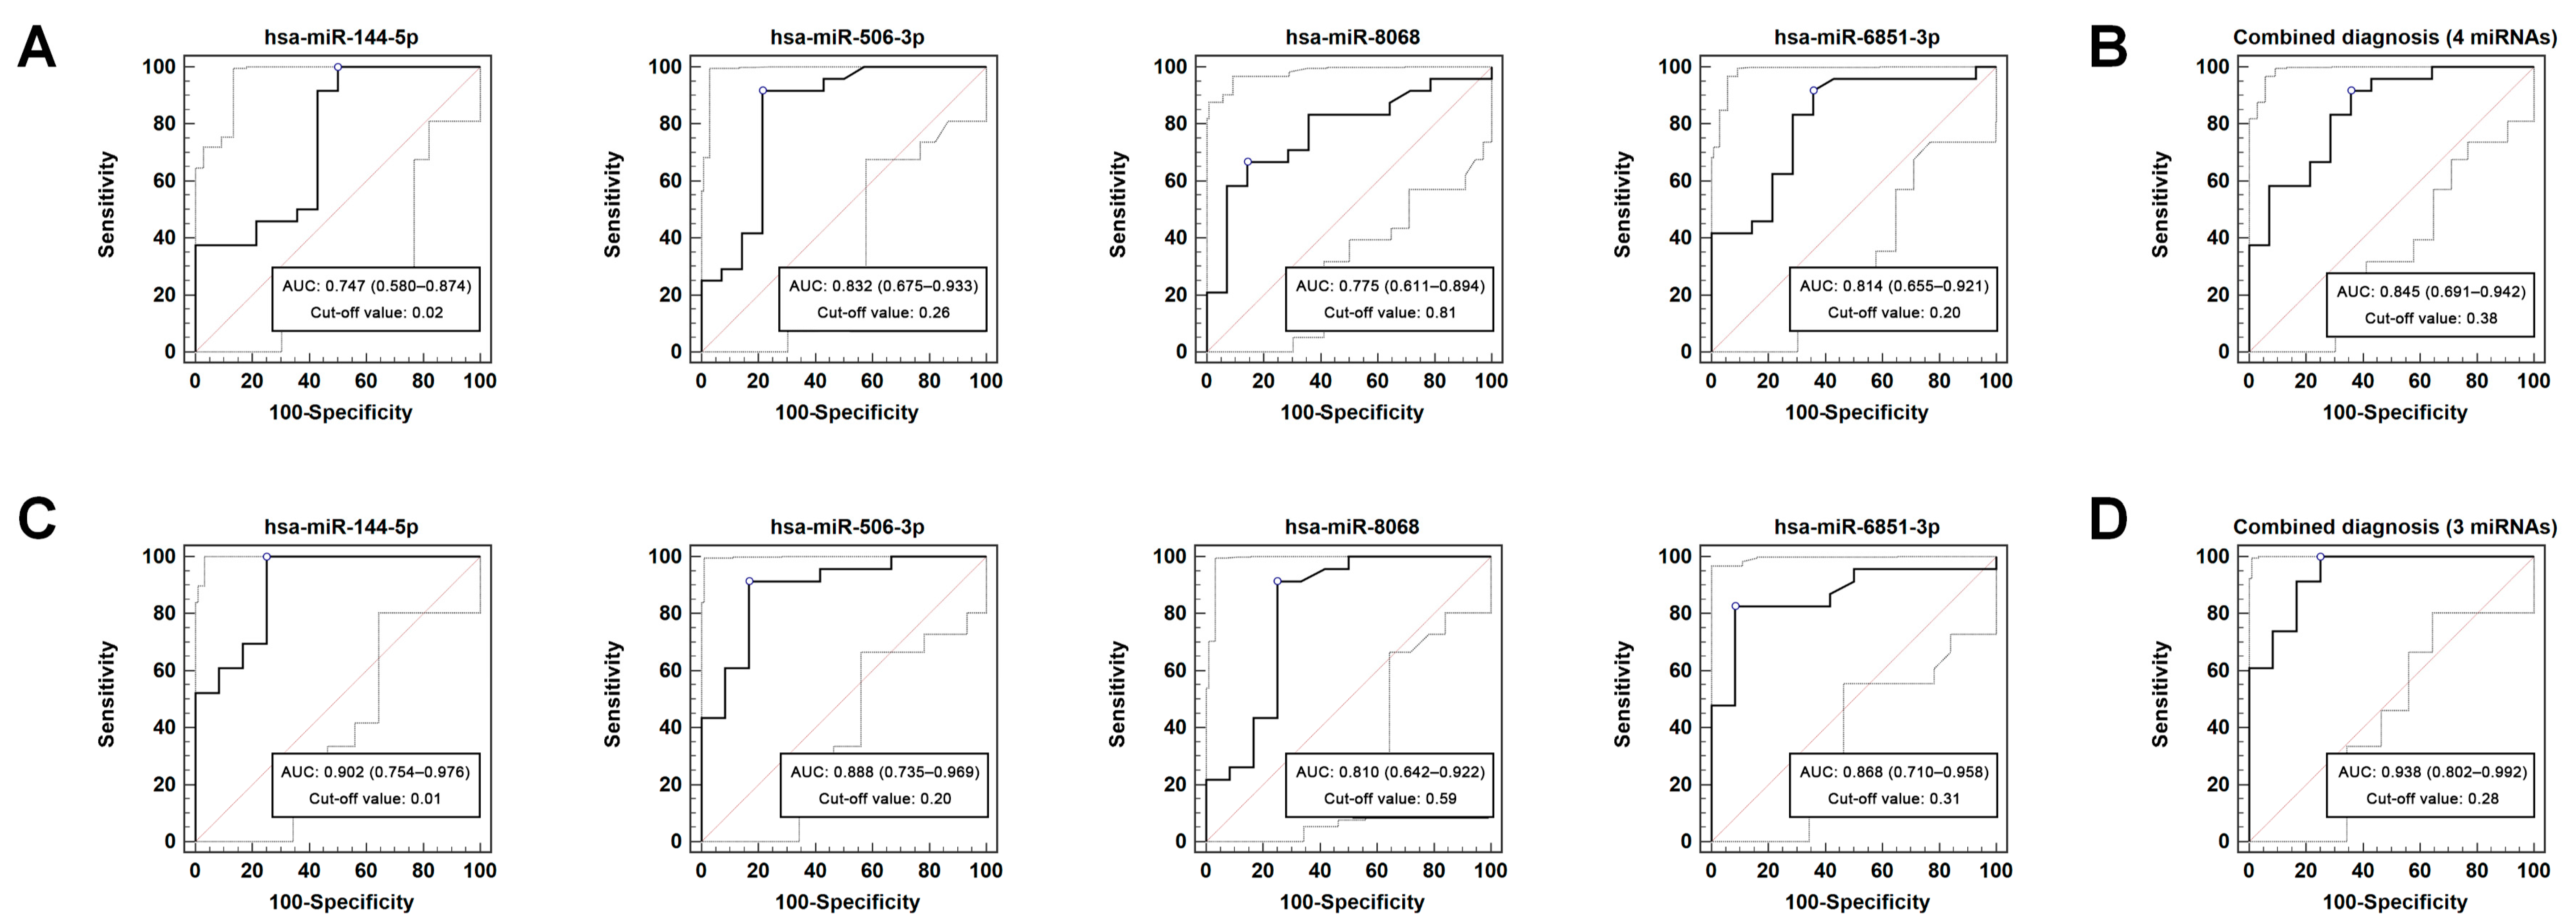
3.3. Diagnostic Performance of DEmiRNAs
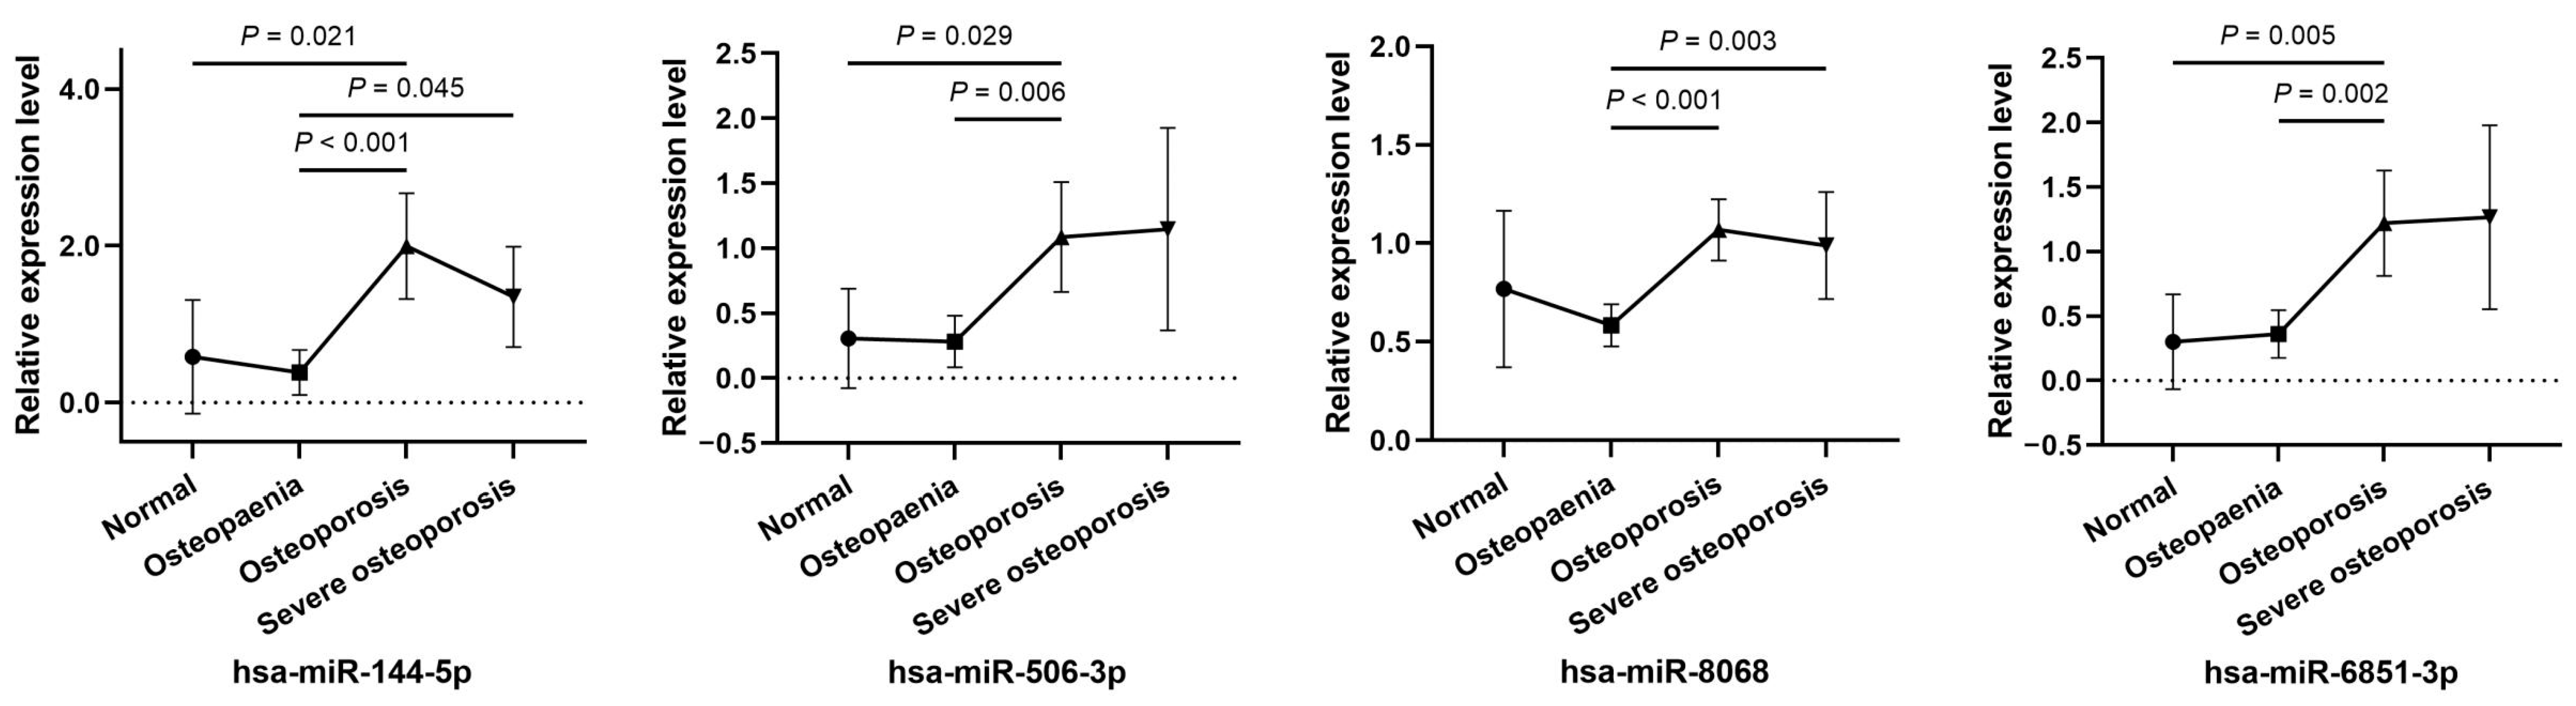
3.4. Relative Expression Levels of Key miRNAs in Different Clinical Stages
3.5. Correlations between Key miRNAs and BMD
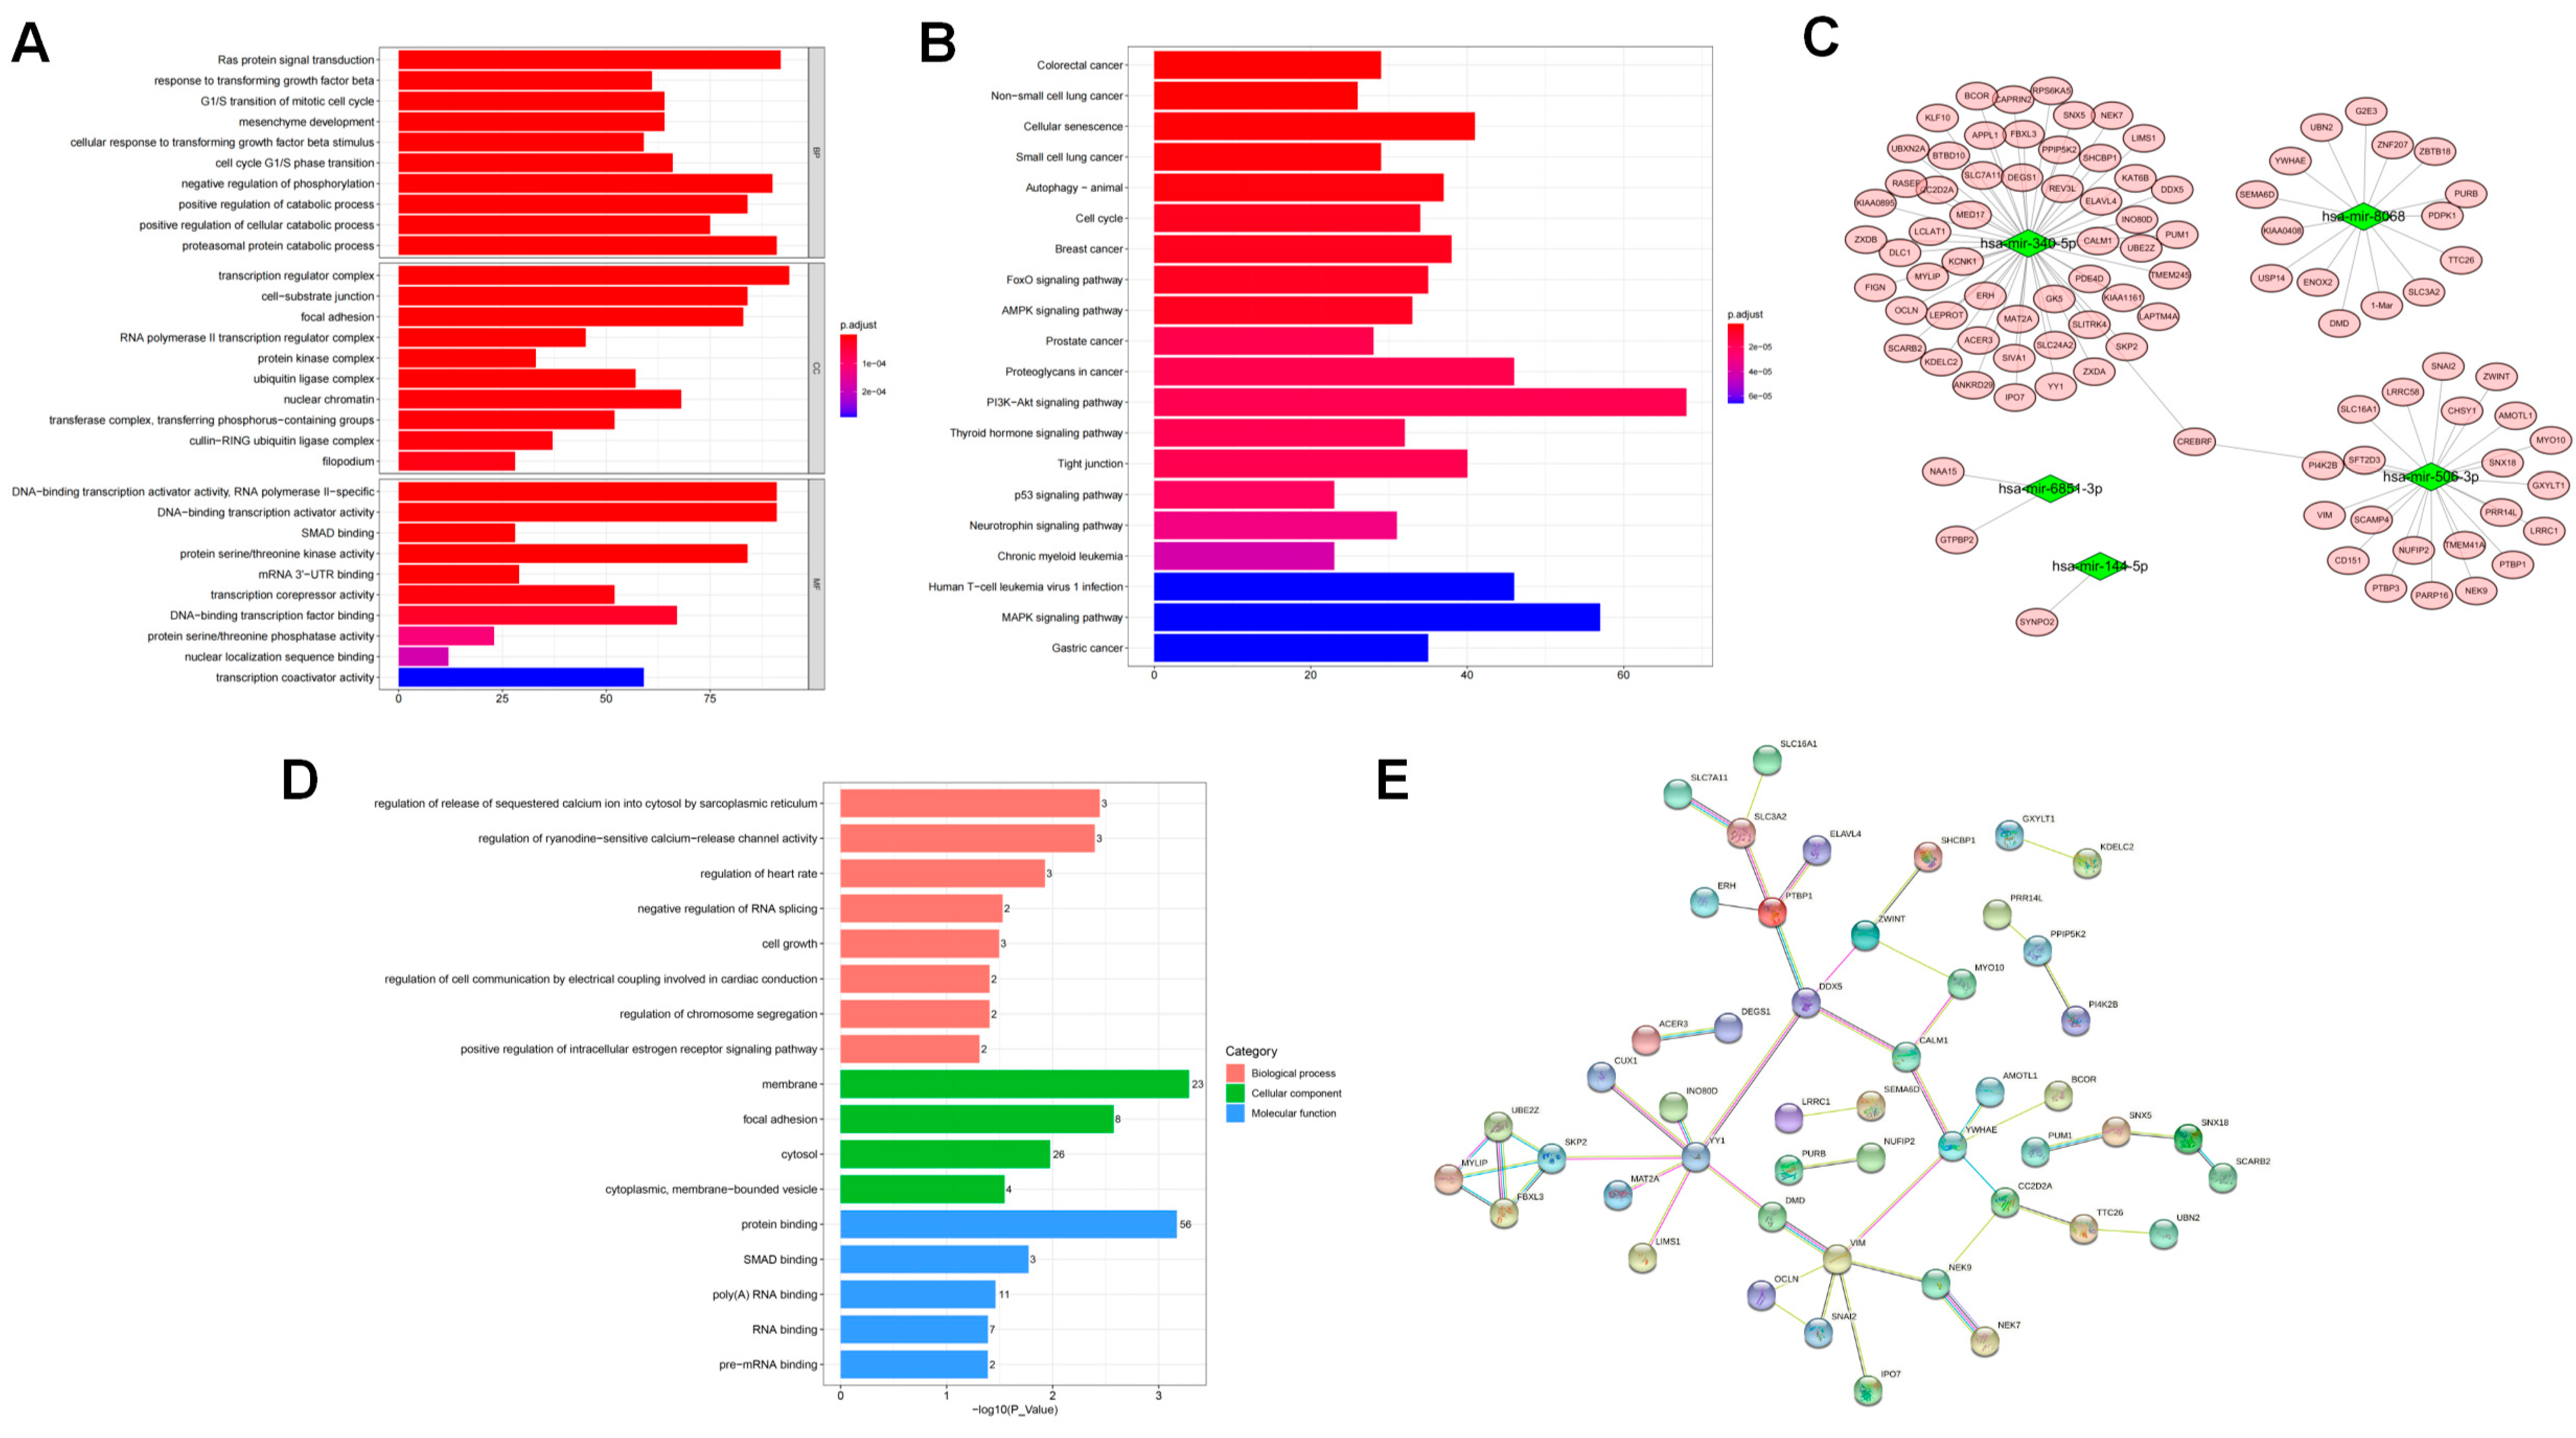
3.6. Target Genes and Pathways Correlated with DEmiRNAs
4. Discussion
5. Conclusions
Supplementary Materials
Author Contributions
Funding
Institutional Review Board Statement
Informed Consent Statement
Data Availability Statement
Acknowledgments
Conflicts of Interest
References
- Black, D.M.; Rosen, C.J. Clinical Practice. Postmenopausal Osteoporosis. N. Engl. J. Med. 2016, 374, 254–262. [Google Scholar] [CrossRef] [PubMed]
- Rachner, T.D.; Khosla, S.; Hofbauer, L.C. Osteoporosis: Now and the future. Lancet 2011, 377, 1276–1287. [Google Scholar] [CrossRef] [Green Version]
- Mo, X.Y.; Zhao, S.L.; Wen, Z.X.; Lin, W.; Chen, Z.P.; Wang, Z.Y.; Huang, C.; Qin, J.; Hao, J.; Chen, B.L. High prevalence of osteoporosis in patients undergoing spine surgery in China. BMC Geriatr. 2021, 21, 361. [Google Scholar] [CrossRef] [PubMed]
- Si, L.; Winzenberg, T.M.; Jiang, Q.; Chen, M.; Palmer, A.J. Projection of osteoporosis-related fractures and costs in China: 2010–2050. Osteoporos Int. 2015, 26, 1929–1937. [Google Scholar] [CrossRef] [PubMed]
- Mithal, A.; Ebeling, P.; Kyer, C.S. The Asia-Pacific Regional Audit: Epidemiology, Costs & Burden of Osteoporosis in 2013. Available online: https://www.-iofbonehealth.org/sites/default/files/media/PDFs/Regional%20Audits/2013-Asia_Pacific_Audit_0_0.pdf (accessed on 28 October 2022).
- Lipiński, P.; Stępień, K.M.; Ciara, E.; Tylki-Szymańska, A.; Jezela-Stanek, A. Skeletal and Bone Mineral Density Features, Genetic Profile in Congenital Disorders of Glycosylation: Review. Diagnostics 2021, 11, 1438. [Google Scholar] [CrossRef] [PubMed]
- Ruaro, B.; Casabella, A.; Paolino, S.; Pizzorni, C.; Alessandri, E.; Seriolo, C.; Botticella, G.; Molfetta, L.; Odetti, P.; Smith, V.; et al. Correlation between bone quality and microvascular damage in systemic sclerosis patients. Rheumatology 2018, 57, 1548–1554. [Google Scholar] [CrossRef] [Green Version]
- Lane, N.E.; Saag, K.; O’Neill, T.J.; Manion, M.; Shah, R.; Klause, U.; Eastell, R. Real-world bone turnover marker use: Impact on treatment decisions and fracture. Osteoporos Int. 2021, 32, 831–840. [Google Scholar] [CrossRef]
- Bauer, D.C. Clinical Use of Bone Turnover Markers. JAMA 2019, 322, 569–570. [Google Scholar] [CrossRef]
- Zhao, S.L.; Mo, X.Y.; Wen, Z.X.; Liu, M.; Chen, Z.P.; Lin, W.; Huang, Z.F.; Chen, B.L. Declining serum bone turnover markers are associated with the short-term positive change of lumbar spine bone mineral density in postmenopausal women. Menopause 2022, 29, 335–343. [Google Scholar] [CrossRef]
- Eastell, R.; Szulc, P. Use of bone turnover markers in postmenopausal osteoporosis. Lancet Diabetes Endocrinol. 2017, 5, 908–923. [Google Scholar] [CrossRef]
- Chen, X.; Ba, Y.; Ma, L.J.; Cai, X.; Yin, Y.; Wang, K.H.; Guo, J.G.; Zhang, Y.J.; Chen, J.N.; Guo, X. Characterization of microRNAs in serum: A novel class of biomarkers for diagnosis of cancer and other diseases. Cell Res. 2008, 18, 997–1006. [Google Scholar] [CrossRef] [PubMed] [Green Version]
- Chen, L.; Heikkinen, L.; Wang, C.L.; Yang, Y.; Sun, H.Y.; Wong, G. Trends in the development of miRNA bioinformatics tools. Brief Bioinform. 2019, 20, 1836–1852. [Google Scholar] [CrossRef] [PubMed] [Green Version]
- Backes, C.; Meese, E.; Keller, A. Specific miRNA Disease Biomarkers in Blood, Serum and Plasma: Challenges and Prospects. Mol. Diagn. Ther. 2016, 20, 509–518. [Google Scholar] [CrossRef] [PubMed]
- Feng, Q.Y.; Zheng, S.; Zheng, J. The emerging role of microRNAs in bone remodeling and its therapeutic implications for osteoporosis. Biosci. Rep. 2018, 38, BSR20180453. [Google Scholar] [CrossRef] [PubMed] [Green Version]
- Bottani, M.; Banfi, G.; Lombardi, G. The Clinical Potential of Circulating miRNAs as Biomarkers: Present and Future Applications for Diagnosis and Prognosis of Age-Associated Bone Diseases. Biomolecules 2020, 10, 589. [Google Scholar] [CrossRef] [PubMed]
- Xia, W.B.; Zhang, Z.L.; Lin, H.; Jin, X.L.; Yu, W.; Fu, Q. Guidelines for the diagnosis and management of primary osteoporosis (2017). Chin. J. Osteoporos. 2019, 25, 281–308. [Google Scholar] [CrossRef]
- Liu, H.S.; Zhu, L.; Liu, B.Y.; Yang, L.; Meng, X.X.; Zhang, W.; Ma, Y.Y.; Xiao, H.S. Genome-wide microRNA profiles identify miR-378 as a serum biomarker for early detection of gastric cancer. Cancer Lett. 2012, 316, 196–203. [Google Scholar] [CrossRef]
- Zalewski, K.; Misiek, M.; Kowalik, A.; Bakuła-Zalewska, E.; Kopczyński, J.; Zielińska, A.; Bidziński, M.; Radziszewski, J.; Góźdź, S.; Kowalewska, M. Normalizers for microRNA quantification in plasma of patients with vulvar intraepithelial neoplasia lesions and vulvar carcinoma. Tumour Biol. 2017, 39, 1010428317717140. [Google Scholar] [CrossRef] [Green Version]
- DeLong, E.R.; DeLong, D.M.; Clarke-Pearson, D.L. Comparing the areas under two or more correlated receiver operating characteristic curves: A nonparametric approach. Biometrics 1988, 44, 837–845. [Google Scholar] [CrossRef]
- Lee, R.C.; Feinbaum, R.L.; Ambros, V. The C. elegans heterochronic gene lin-4 encodes small RNAs with antisense complementarity to lin-14. Cell 1993, 75, 843–854. [Google Scholar] [CrossRef]
- Lewis, B.P.; Burge, C.B.; Bartel, D.P. Conserved seed pairing, often flanked by adenosines, indicates that thousands of human genes are microRNA targets. Cell 2005, 120, 15–20. [Google Scholar] [CrossRef] [PubMed] [Green Version]
- Blondal, T.; Nielsen, J.S.; Baker, A.; Andreasen, D.; Mouritzen, P.; Teilum, M.W.; Dahlsveen, I.K. Assessing sample and miRNA profile quality in serum and plasma or other biofluids. Methods 2013, 59, S1–S6. [Google Scholar] [CrossRef] [PubMed]
- Wang, C.Q.; He, H.L.; Wang, L.; Jiang, Y.; Xu, Y.J. Reduced miR-144-3p expression in serum and bone mediates osteoporosis pathogenesis by targeting RANK. Biochem. Cell Biol. 2018, 96, 627–635. [Google Scholar] [CrossRef] [PubMed] [Green Version]
- Lin, C.J.; Yu, S.T.; Jin, R.Z.; Xiao, Y.; Pan, M.H.; Pei, F.; Zhu, X.J.; Huang, H.R.; Zhang, Z.Y.; Chen, S. Circulating miR-338 Cluster activities on osteoblast differentiation: Potential Diagnostic and Therapeutic Targets for Postmenopausal Osteoporosis. Theranostics 2019, 9, 3780–3797. [Google Scholar] [CrossRef] [PubMed]
- Yavropoulou, M.P.; Anastasilakis, A.D.; Makras, P.; Papatheodorou, A.; Rauner, M.; Hofbauer, L.C.; Tsourdi, E. Serum Profile of microRNAs Linked to Bone Metabolism During Sequential Treatment for Postmenopausal Osteoporosis. J. Clin. Endocrinol. Metab. 2020, 105, dgaa368. [Google Scholar] [CrossRef]
- Kerschan-Schindl, K.; Hackl, M.; Boschitsch, E.; Föger-Samwald, U.; Nägele, O.; Skalicky, S.; Weigl, M.; Grillari, J.; Pietschmann, P. Diagnostic Performance of a Panel of miRNAs (OsteomiR) for Osteoporosis in a Cohort of Postmenopausal Women. Calcif. Tissue Int. 2021, 108, 725–737. [Google Scholar] [CrossRef]
- Mandourah, A.Y.; Ranganath, L.; Barraclough, R.; Vinjamuri, S.; Hof, R.V.; Hamill, S.; Czanner, G.; Dera, A.A.; Wang, D.; Barraclough, D.L. Circulating microRNAs as potential diagnostic biomarkers for osteoporosis. Sci. Rep. 2018, 8, 8421. [Google Scholar] [CrossRef] [Green Version]
- Wang, Y.; Li, L.; Moore, B.T.; Peng, X.H.; Fang, X.; Lappe, J.M.; Recker, R.R.; Xiao, P. MiR-133a in human circulating monocytes: A potential biomarker associated with postmenopausal osteoporosis. PLoS ONE 2012, 7, e34641. [Google Scholar] [CrossRef]
- Morais, M.; Dias, F.; Nogueira, I.; Leão, A.; Gonçalves, N.; Araújo, L.; Granja, S.; Baltazar, F.; Teixeira, A.L.; Medeiros, R. Cancer Cells’ Metabolism Dynamics in Renal Cell Carcinoma Patients’ Outcome: Influence of GLUT-1-Related hsa-miR-144 and hsa-miR-186. Cancers 2021, 13, 1733. [Google Scholar] [CrossRef]
- Lu, M.; Xiong, H.; Xia, Z.K.; Liu, B.; Wu, F.; Zhang, H.X.; Hu, C.H.; Liu, P. circRACGAP1 promotes non-small cell lung cancer proliferation by regulating miR-144-5p/CDKL1 signaling pathway. Cancer Gene Ther. 2021, 28, 197–211. [Google Scholar] [CrossRef]
- Liu, G.M.; Lu, T.C.; Sun, M.L.; Jia, W.Y.; Ji, X.; Luo, Y.G. Ginsenoside Rd Inhibits Glioblastoma Cell Proliferation by Up-Regulating the Expression of miR-144-5p. Biol. Pharm. Bull. 2020, 43, 1534–1541. [Google Scholar] [CrossRef] [PubMed]
- Zhang, D.; Wu, Y.F.; Li, Z.H.; Chen, H.R.; Huang, S.Y.; Jian, C.; Yu, A.X. MiR-144-5p, an exosomal miRNA from bone marrow-derived macrophage in type 2 diabetes, impairs bone fracture healing via targeting Smad1. J. Nanobiotechnology 2021, 19, 226. [Google Scholar] [CrossRef] [PubMed]
- Wang, J.S.; Qiu, C.; Zhang, Z.J.; Wang, G.B.; Li, B.; He, M. MicroRNA-506-3p inhibits osteosarcoma cell proliferation and metastasis by suppressing RAB3D expression. Aging (Albany NY) 2018, 10, 1294–1305. [Google Scholar] [CrossRef]
- Hu, C.Y.; You, P.; Zhang, J.; Zhang, H.; Jiang, N. MiR-506-3p acts as a novel tumor suppressor in prostate cancer through targeting GALNT4. Eur. Rev. Med. Pharmacol. Sci. 2019, 23, 5133–5138. [Google Scholar] [CrossRef] [PubMed]
- Lei, D.; Wang, T. circSYPL1 Promotes the Proliferation and Metastasis of Hepatocellular Carcinoma via the Upregulation of EZH2 Expression by Competing with hsa-miR-506-3p. J. Oncol. 2022, 2022, 2659563. [Google Scholar] [CrossRef] [PubMed]
- Jeong, H.M.; Choi, Y.H.; Lee, S.H.; Lee, K.Y. YY1 represses the transcriptional activity of Runx2 in C2C12 cells. Mol. Cell Endocrinol. 2014, 383, 103–110. [Google Scholar] [CrossRef]
- Kurisaki, K.; Kurisaki, A.; Valcourt, U.; Terentiev, A.A.; Pardali, K.; ten Dijke, P.; Heldin, C.H.; Ericsson, J.; Moustakas, A. Nuclear factor YY1 inhibits transforming growth factor beta- and bone morphogenetic protein-induced cell differentiation. Mol. Cell Biol. 2003, 23, 4494–4510. [Google Scholar] [CrossRef] [Green Version]
- Challa, A.A.; Stefanovic, B. A novel role of vimentin filaments: Binding and stabilization of collagen mRNAs. Mol. Cell Biol. 2011, 31, 3773–3789. [Google Scholar] [CrossRef] [Green Version]
- Lian, N.; Wang, W.G.; Li, L.Z.; Elefteriou, F.; Yang, X.L. Vimentin inhibits ATF4-mediated osteocalcin transcription and osteoblast differentiation. J. Biol. Chem. 2009, 284, 30518–30525. [Google Scholar] [CrossRef] [Green Version]
- Lian, N.; Lin, T.H.; Liu, W.G.; Wang, W.G.; Li, L.Z.; Sun, S.; Nyman, J.S.; Yang, X. Transforming growth factor β suppresses osteoblast differentiation via the vimentin activating transcription factor 4 (ATF4) axis. J. Biol. Chem. 2012, 287, 35975–35984. [Google Scholar] [CrossRef]
- Gu, Y.M.; Jin, Y.H.; Choi, J.K.; Baek, K.H.; Yeo, C.Y.; Lee, K.Y. Protein kinase A phosphorylates and regulates dimerization of 14-3-3 epsilon. FEBS Lett. 2006, 580, 305–310. [Google Scholar] [CrossRef] [PubMed] [Green Version]
- Priam, S.; Bougault, C.; Houard, X.; Gosset, M.; Salvat, C.; Berenbaum, F.; Jacques, C. Identification of soluble 14-3-3ε as a novel subchondral bone mediator involved in cartilage degradation in osteoarthritis. Arthritis Rheum. 2013, 65, 1831–1842. [Google Scholar] [CrossRef] [PubMed]
- Rivero, G.; Aldana, A.A.; Lopez, Y.R.F.; Liverani, L.; Boccacini, A.R.; Bustos, D.M.; Abraham, G.A. 14-3-3ε protein-immobilized PCL-HA electrospun scaffolds with enhanced osteogenicity. J. Mater. Sci. Mater. Med. 2019, 30, 99. [Google Scholar] [CrossRef] [PubMed]


| Variable | Reference Range | Discovery Set (n = 10) | Training Set (n = 38) | Validation Set (n = 35) | ||||||
|---|---|---|---|---|---|---|---|---|---|---|
| PMOP (n = 6) | n-PMOP (n = 4) | p | PMOP (n = 24) | n-PMOP (n = 14) | p | PMOP (n = 23) | n-PMOP (n = 12) | p | ||
| Age (years) | - | 74.3 ± 6.8 | 70.0 ± 8.2 | 0.387 | 66.5 ± 7.6 | 63.1 ± 6.3 | 0.158 | 67.5 ± 8.8 | 58.3 ± 8.1 | 0.005 |
| BMI (g/cm2) | - | 24.8 ± 3.6 | 25.2 ± 2.8 | 0.850 | 22.7 ± 3.7 | 24.2 ± 2.7 | 0.181 | 21.9 ± 3.1 | 23.6 ± 2.6 | 0.113 |
| Age at menopause (years) | - | 52.3 ± 2.1 | 52.8 ± 1.9 | 0.755 | 51.8 ± 3.8 | 51.9 ± 4.0 | 0.985 | 51.4 ± 3.7 | 52.1 ± 3.2 | 0.588 |
| Menopausal duration (years) | - | 22.0 ± 6.1 | 17.3 ± 8.5 | 0.331 | 14.8 ± 7.8 | 11.2 ± 6.5 | 0.162 | 16.0 ± 8.5 | 6.3 ± 6.1 | 0.001 |
| LS 1–4 BMD (T-score) | - | −2.2 ± 0.7 | −1.1 ± 1.4 | 0.121 | −2.9 ± 1.2 | −1.2 ± 1.0 | <0.001 | −3.0 ± 1.1 | −0.8 ± 0.7 | <0.001 |
| TH BMD (T-score) | - | −2.1 ± 0.3 | −1.5 ± 0.6 | 0.078 | −2.3 ± 0.7 | −1.3 ± 0.9 | 0.001 | −2.6 ± 0.9 | −1.0 ± 0.7 | <0.001 |
| FN BMD (T-score) | - | −2.7 ± 0.5 | −1.9 ± 0.4 | 0.035 | −2.7 ± 0.6 | −1.5 ± 0.8 | <0.001 | −2.9 ± 0.7 | −1.5 ± 0.7 | <0.001 |
| LS 1–4 BMD (g/cm2) | - | 0.843 ± 0.072 | 1.010 ± 0.219 | 0.113 | 0.760 ± 0.135 | 0.970 ± 0.124 | <0.001 | 0.757 ± 0.128 | 0.992 ± 0.097 | <0.001 |
| TH BMD (g/cm2) | - | 0.699 ± 0.042 | 0.790 ± 0.066 | 0.027 | 0.685 ± 0.097 | 0.808 ± 0.121 | 0.001 | 0.639 ± 0.109 | 0.850 ± 0.090 | <0.001 |
| FN BMD (g/cm2) | - | 0.610 ± 0.057 | 0.717 ± 0.035 | 0.010 | 0.617 ± 0.069 | 0.746 ± 0.093 | <0.001 | 0.586 ± 0.086 | 0.751 ± 0.081 | <0.001 |
| 25(OH)D (ng/mL) | >25 | 29.7 ± 10.2 | 29.3 ± 5.9 | 0.944 | 23.1 ± 7.5 | 22.6 ± 8.6 | 0.836 | 24.4 ± 9.2 | 26.3 ± 4.8 | 0.509 |
| N-MID (ng/mL) | 14–46 | 22.47 ± 4.63 | 21.25 ± 9.23 | 0.785 | 20.30 ± 8.73 | 16.36 ± 6.96 | 0.158 | 17.87 ± 9.13 | 19.12 ± 5.58 | 0.667 |
| P1NP (ng/mL) | 0.00–36.40 | 53.50 ± 17.17 | 34.33 ± 9.26 | 0.078 | 49.01 ± 20.15 | 49.37 ± 31.90 | 0.967 | 57.20 ± 35.58 | 67.29 ± 31.51 | 0.415 |
| β-CTX (ng/mL) | ≤1.008 | 0.397 ± 0.135 | 0.338 ± 0.057 | 0.368 | 0.618 ± 0.467 | 0.438 ± 0.268 | 0.197 | 0.616 ± 0.538 | 0.621 ± 0.248 | 0.978 |
| UA (μmol/L) | 140–360 | 334.2 ± 76.6 | 330.3 ± 88.7 | 0.942 | 297.6 ± 89.8 | 299.0 ± 64.5 | 0.960 | 306.7 ± 68.7 | 303.5 ± 113.9 | 0.917 |
| ALP (U/L) | 0–110 | 76.5 ± 12.6 | 72.5 ± 8.2 | 0.593 | 84.3 ± 35.2 | 73.3 ± 36.8 | 0.367 | 90.5 ± 29.6 | 74.7 ± 16.0 | 0.095 |
| Calcium (mmol/L) | 2.10–2.60 | 2.10 ± 0.13 | 2.35 ± 0.06 | 0.006 | 2.28 ± 0.16 | 2.24 ± 0.19 | 0.508 | 2.28 ± 0.16 | 2.22 ± 0.17 | 0.301 |
| Phosphorus (mmol/L) | 0.97–1.62 | 1.12 ± 0.17 | 1.23 ± 0.21 | 0.398 | 1.16 ± 0.21 | 1.14 ± 0.19 | 0.699 | 1.17 ± 0.16 | 1.18 ± 0.19 | 0.796 |
| Variable | AUC (95% CI) | p | Sensitivity (95% CI) | Specificity (95% CI) | PPV (95% CI) | NPV (95% CI) |
|---|---|---|---|---|---|---|
| Numbers of miRNA: 1 | ||||||
| hsa-miR-144-5p | 0.902 (0.754–0.976) | <0.001 | 100.0 (85.2–100.0) | 75.0 (42.8–94.5) | 88.5 (69.8–97.6) | 100.0 (66.4–100.0) |
| hsa-miR-506-3p | 0.888 (0.735–0.969) | <0.001 | 91.3 (72.0–98.9) | 83.3 (51.6–97.9) | 91.3 (72.0–98.9) | 83.3 (51.6–97.9) |
| hsa-miR-8068 | 0.810 (0.642–0.922) | <0.001 | 91.3 (72.0–98.9) | 75.0 (42.8–94.5) | 87.5 (67.6–97.3) | 81.8 (48.2–97.7) |
| hsa-miR-6851-3p | 0.868 (0.710–0.958) | <0.001 | 82.6 (61.2–95.0) | 91.7 (61.5–99.8) | 95.0 (75.1–99.9) | 73.3 (44.9–92.2) |
| Numbers of miRNA: 2 | ||||||
| hsa-miR-144-5p + hsa-miR-506-3p | 0.917 (0.773–0.983) | <0.001 | 100.0 (85.2–100.0) | 75.0 (42.8–94.5) | 88.5 (69.8–97.6) | 100.0 (66.4–100.0) |
| hsa-miR-144-5p + hsa-miR-8068 | 0.899 (0.749–0.975) | <0.001 | 100.0 (85.2–100.0) | 75.0 (42.8–94.5) | 88.5 (69.8–97.6) | 100.0 (66.4–100.0) |
| hsa-miR-144-5p + hsa-miR-6851-3p | 0.928 (0.787–0.988) | <0.001 | 91.3 (72.0–98.9) | 83.3 (51.6–97.9) | 91.3 (72.0–98.9) | 83.3 (51.6–97.9) |
| hsa-miR-506-3p + hsa-miR-8068 | 0.917 (0.773–0.983) | <0.001 | 100.0 (85.2–100.0) | 75.0 (42.8–94.5) | 88.5 (69.8–97.6) | 100.0 (66.4–100.0) |
| hsa-miR-506-3p + hsa-miR-6851-3p | 0.891 (0.740–0.971) | <0.001 | 82.6 (61.2–95.0) | 91.7 (61.5–99.8) | 95.0 (75.1–99.9) | 73.3 (44.9–92.2) |
| hsa-miR-8068 + hsa-miR-6851-3p | 0.924 (0.782–0.986) | <0.001 | 95.7 (78.1–99.9) | 75.0 (42.8–94.5) | 88.0 (68.8–97.5) | 90.0 (55.5–99.7) |
| Numbers of miRNA: 3 | ||||||
| hsa-miR-144-5p + hsa-miR-506-3p + hsa-miR-8068 | 0.917 (0.773–0.983) | <0.001 | 100.0 (85.2–100.0) | 75.0 (42.8–94.5) | 88.5 (69.8–97.6) | 100.0 (66.4–100.0) |
| hsa-miR-144-5p + hsa-miR-506-3p + hsa-miR-6851-3p | 0.938 (0.802–0.992) | <0.001 | 100.0 (85.2–100.0) | 75.0 (42.8–94.5) | 88.5 (69.8–97.6) | 100.0 (66.4–100.0) |
| hsa-miR-506-3p + hsa-miR-8068 + hsa-miR-6851-3p | 0.913 (0.768–0.981) | <0.001 | 95.7 (78.1–99.9) | 75.0 (42.8–94.5) | 88.0 (68.8–97.5) | 90.0 (55.5–99.7) |
| hsa-miR-144-5p + hsa-miR-8068 + hsa-miR-6851-3p | 0.935 (0.797–0.990) | <0.001 | 100.0 (85.2–100.0) | 75.0 (42.8–94.5) | 88.5 (69.8–97.6) | 100.0 (66.4–100.0) |
| Numbers of miRNA: 4 | ||||||
| hsa-miR-144-5p + hsa-miR-506-3p + hsa-miR-8068 + hsa-miR-6851-3p | 0.928 (0.787–0.988) | <0.001 | 100.0 (85.2–100.0) | 75.0 (42.8–94.5) | 88.5 (69.8–97.6) | 100.0 (66.4–100.0) |
| Variable | LS 1–4 | TH | FN | |||
|---|---|---|---|---|---|---|
| Simple | Partial | Simple | Partial | Simple | Partial | |
| hsa-miR-144-5p | −0.230 | −0.311 ** | −0.230 | −0.343 ** | −0.265 * | −0.391 ** |
| hsa-miR-506-3p | −0.267 * | −0.316 ** | −0.207 | −0.261 * | −0.245 * | −0.310 ** |
| hsa-miR-8068 | −0.257 * | −0.263 * | −0.190 | −0.181 | −0.212 | −0.207 |
| hsa-miR-6851-3p | −0.357 ** | −0.383 ** | −0.248 * | −0.265 * | −0.276 * | −0.301 * |
| Variable | LS 1–4 | TH | FN | ||||||||||||
|---|---|---|---|---|---|---|---|---|---|---|---|---|---|---|---|
| B (95% CI) | β | t | p | R2 | B (95% CI) | β | t | p | R2 | B (95% CI) | β | t | p | R2 | |
| Model 1 | |||||||||||||||
| hsa-miR-144-5p | −0.017 (−0.044, 0.010) | −0.156 | −1.268 | 0.209 | 0.187 | −0.016 (−0.039, 0.007) | −0.182 | −1.405 | 0.165 | 0.096 | −0.015 (−0.033, 0.003) | −0.207 | −1.617 | 0.110 | 0.114 |
| hsa-miR-506-3p | 0.091 (−0.001, 0.183) | 0.630 | 1.979 | 0.052 | 0.035 (−0.043, 0.114) | 0.300 | 0.894 | 0.374 | 0.021 (−0.042, 0.083) | 0.217 | 0.654 | 0.515 | |||
| hsa-miR-8068 | −0.022 (−0.134, 0.090) | −0.061 | −0.394 | 0.695 | −0.006 (−0.102, 0.089) | −0.021 | −0.128 | 0.898 | −0.002 (−0.078, 0.075) | −0.006 | −0.039 | 0.969 | |||
| hsa-miR-6851-3p | −0.128 (−0.220, −0.036) | −0.851 | −2.774 | 0.007 | −0.055 (−0.134, 0.024) | −0.451 | −1.395 | 0.168 | −0.040 (−0.103, 0.023) | −0.403 | −1.259 | 0.212 | |||
| Model 2 | |||||||||||||||
| Age | 0.011 (0.001, 0.020) | 0.550 | 2.223 | 0.030 | 0.412 | 0.008 (0.001, 0.015) | 0.498 | 2.161 | 0.035 | 0.490 | 0.006 (0.000, 0.012) | 0.465 | 2.044 | 0.045 | 0.503 |
| Menopausal duration | −0.016 (−0.026, −0.006) | −0.808 | −3.272 | 0.002 | −0.015 (−0.022, −0.008) | −0.928 | −4.036 | <0.001 | −0.012 (−0.018, −0.006) | −0.933 | −4.116 | <0.001 | |||
| N-MID | 0.002 (−0.002, 0.006) | 0.098 | 0.921 | 0.360 | 0.002 (−0.001, 0.006) | 0.149 | 1.499 | 0.139 | 0.001 (−0.001, 0.004) | 0.087 | 0.889 | 0.377 | |||
| ALP | −0.001 (−0.002, 0.000) | −0.237 | −2.236 | 0.029 | −0.001 (-0.002, 0.000) | −0.220 | −2.234 | 0.029 | −0.001 (−0.001, 0.000) | −0.196 | −2.016 | 0.048 | |||
| Phosphorus | 0.030 (−0.154, 0.214) | 0.034 | 0.326 | 0.746 | 0.114 (−0.025, 0.253) | 0.160 | 1.638 | 0.106 | 0.075 (−0.036, 0.186) | 0.130 | 1.345 | 0.183 | |||
| hsa-miR-144-5p | −0.029 (−0.054, −0.004) | −0.265 | −2.357 | 0.022 | −0.027 (−0.045, −0.008) | −0.301 | −2.876 | 0.005 | −0.023 (−0.038, −0.008) | −0.324 | −3.131 | 0.003 | |||
| hsa-miR-506-3p | 0.067 (−0.018, 0.152) | 0.465 | 1.578 | 0.120 | 0.014 (−0.050, 0.078) | 0.120 | 0.436 | 0.665 | 0.001 (−0.051, 0.052) | 0.007 | 0.024 | 0.981 | |||
| hsa-miR-8068 | 0.000 (−0.100, 0.101) | 0.001 | 0.006 | 0.995 | 0.021 (−0.056, 0.097) | 0.070 | 0.538 | 0.592 | 0.021 (−0.040, 0.082) | 0.087 | 0.681 | 0.499 | |||
| hsa-miR-6851-3p | −0.097 (−0.182, −0.012) | −0.645 | −2.275 | 0.026 | −0.031 (−0.096, 0.033) | −0.256 | −0.968 | 0.337 | −0.017 (−0.069, 0.034) | −0.177 | −0.678 | 0.500 | |||
| Gene | Degree | Gene | Degree |
|---|---|---|---|
| YY1 | 7 | UBE2Z | 3 |
| VIM | 6 | MYLIP | 3 |
| YWHAE | 5 | FBXL3 | 3 |
| SKP2 | 4 | ZWINT | 3 |
| PTBP1 | 4 | NEK9 | 3 |
| DDX5 | 4 | CC2D2A | 3 |
| SLC3A2 | 3 | CALM1 | 3 |
Publisher’s Note: MDPI stays neutral with regard to jurisdictional claims in published maps and institutional affiliations. |
© 2022 by the authors. Licensee MDPI, Basel, Switzerland. This article is an open access article distributed under the terms and conditions of the Creative Commons Attribution (CC BY) license (https://creativecommons.org/licenses/by/4.0/).
Share and Cite
Zhao, S.-L.; Wen, Z.-X.; Mo, X.-Y.; Zhang, X.-Y.; Li, H.-N.; Cheung, W.-H.; Fu, D.; Zhang, S.-H.; Wan, Y.; Chen, B.-L. Bone-Metabolism-Related Serum microRNAs to Diagnose Osteoporosis in Middle-Aged and Elderly Women. Diagnostics 2022, 12, 2872. https://doi.org/10.3390/diagnostics12112872
Zhao S-L, Wen Z-X, Mo X-Y, Zhang X-Y, Li H-N, Cheung W-H, Fu D, Zhang S-H, Wan Y, Chen B-L. Bone-Metabolism-Related Serum microRNAs to Diagnose Osteoporosis in Middle-Aged and Elderly Women. Diagnostics. 2022; 12(11):2872. https://doi.org/10.3390/diagnostics12112872
Chicago/Turabian StyleZhao, Sheng-Li, Zhen-Xing Wen, Xiao-Yi Mo, Xiao-Yan Zhang, Hao-Nan Li, Wing-Hoi Cheung, Dan Fu, Shi-Hong Zhang, Yong Wan, and Bai-Ling Chen. 2022. "Bone-Metabolism-Related Serum microRNAs to Diagnose Osteoporosis in Middle-Aged and Elderly Women" Diagnostics 12, no. 11: 2872. https://doi.org/10.3390/diagnostics12112872