
A Semi-Supervised Machine Learning Approach in Predicting High-Risk Pregnancies in the Philippines

 ,
,  ,
,
Abstract
:1. Introduction
2. Related Studies
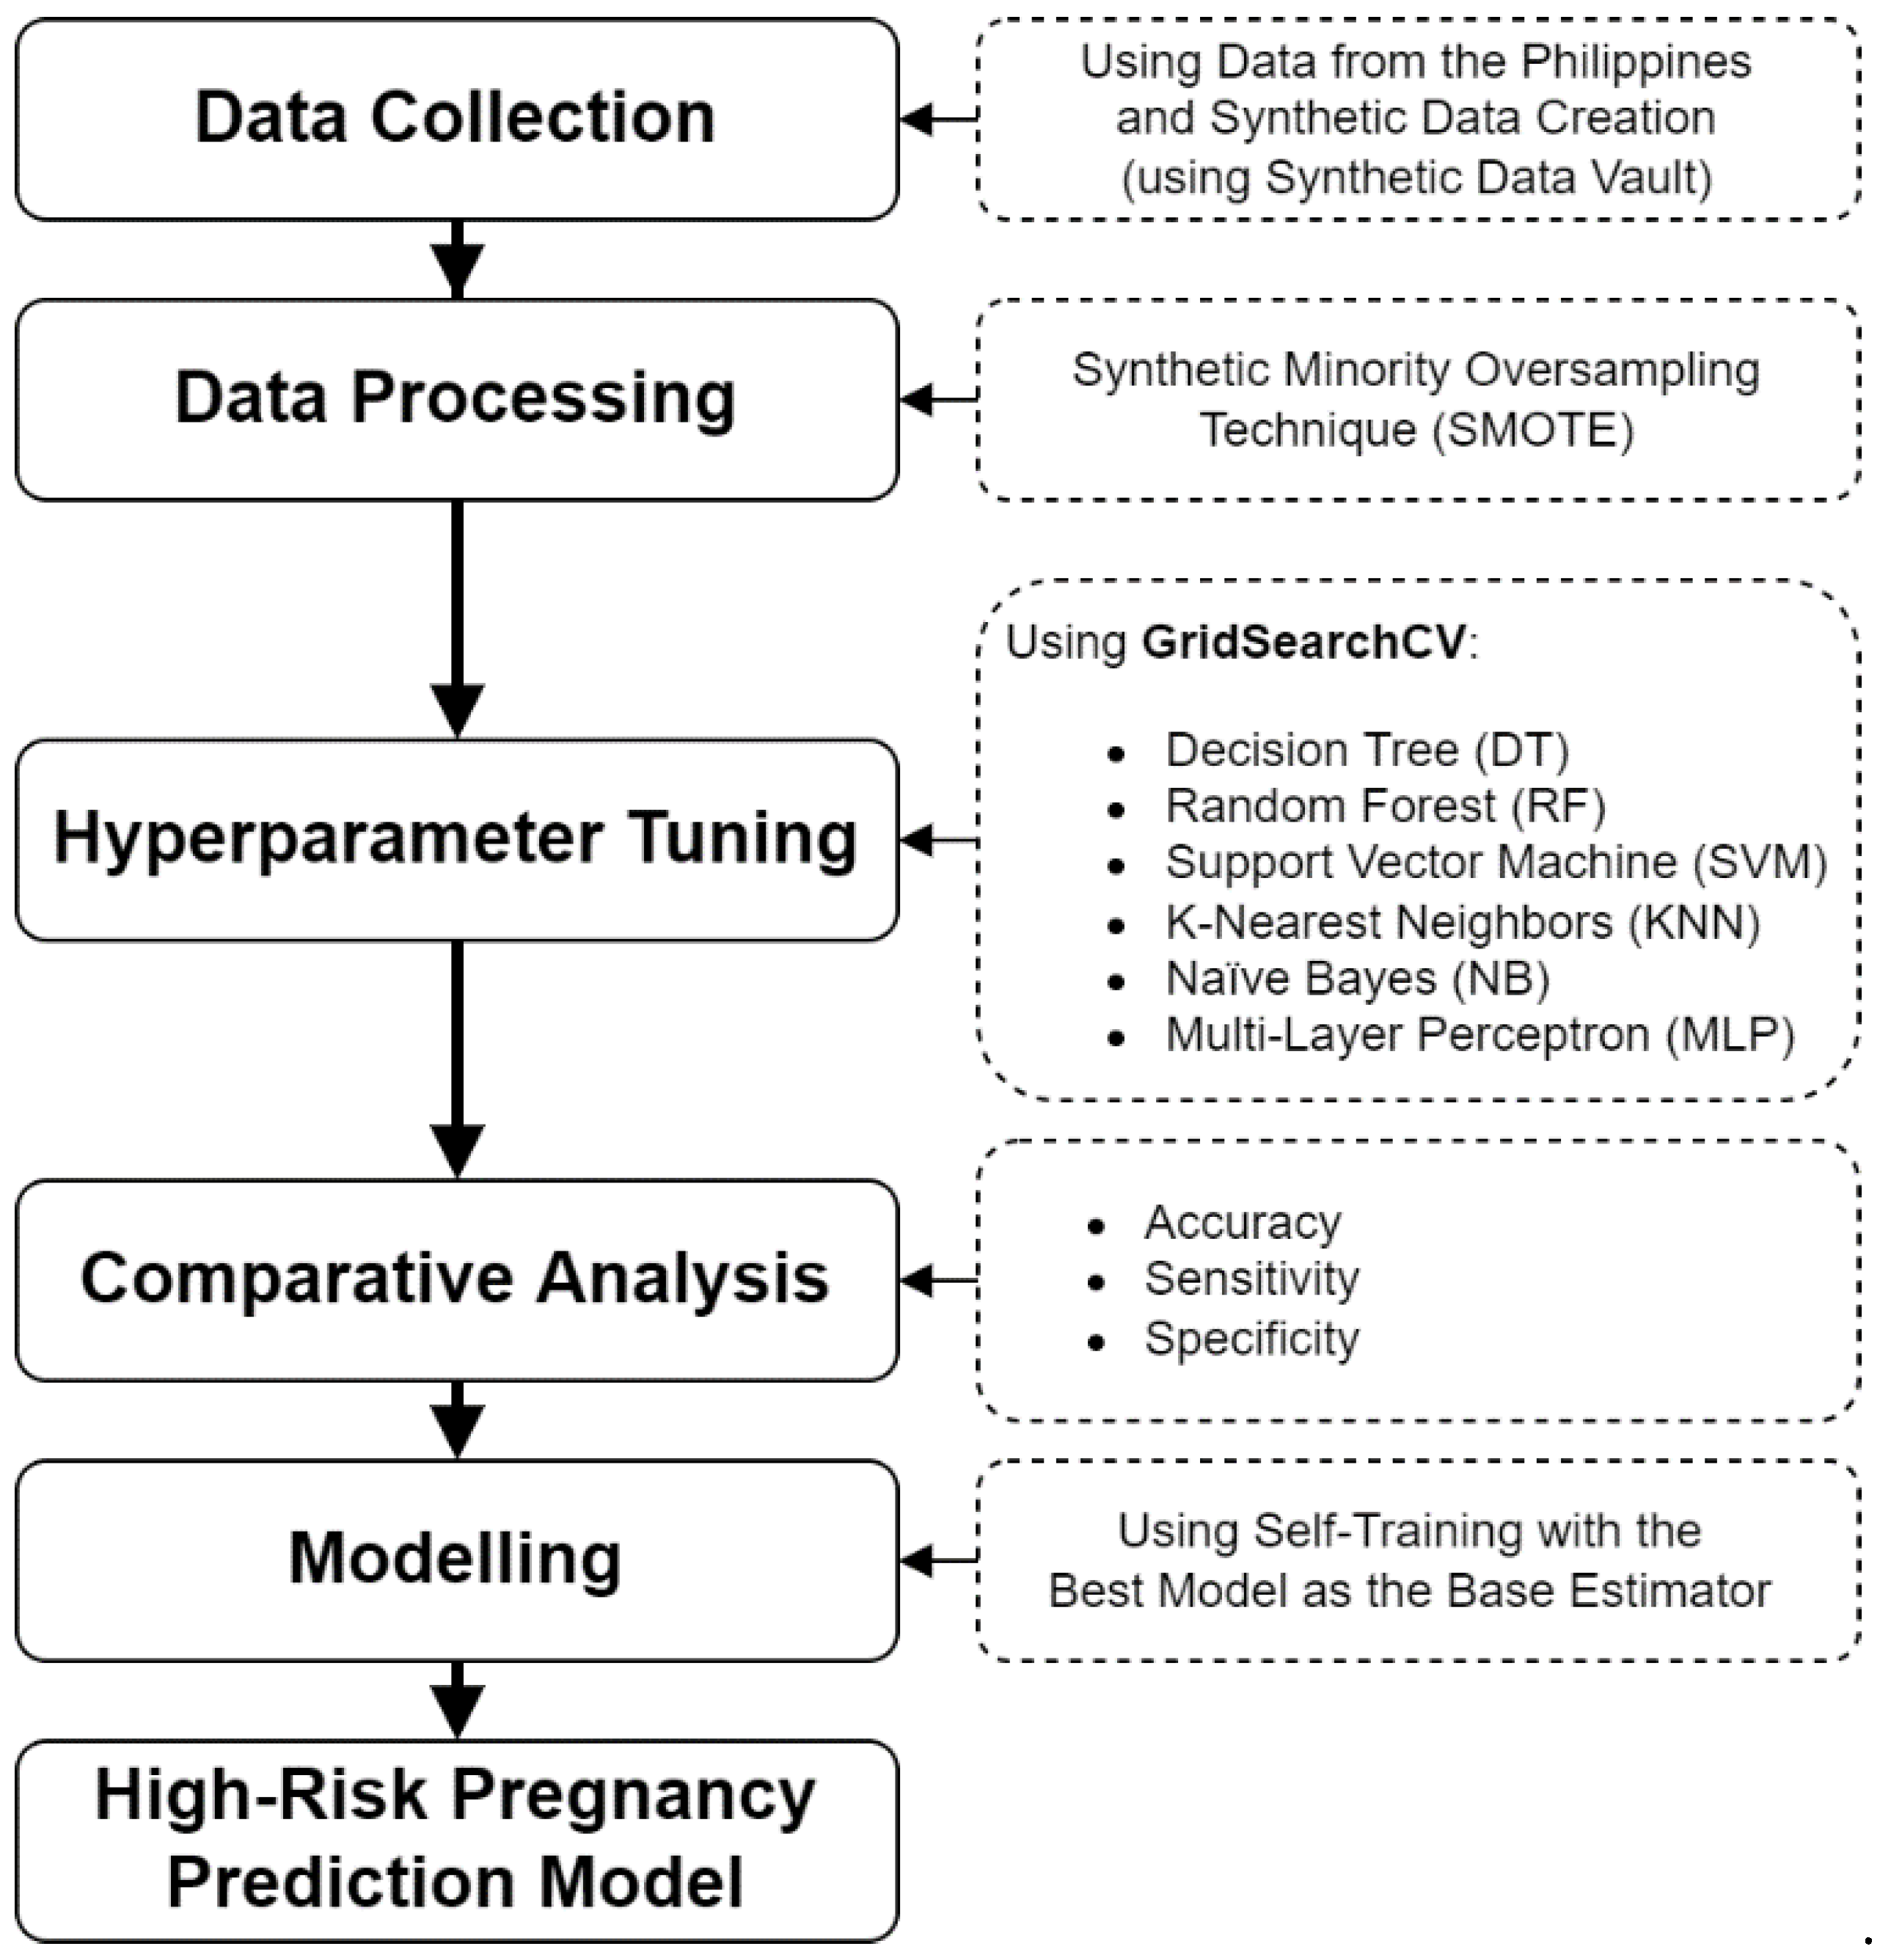
3. Methodology
3.1. Data Collection
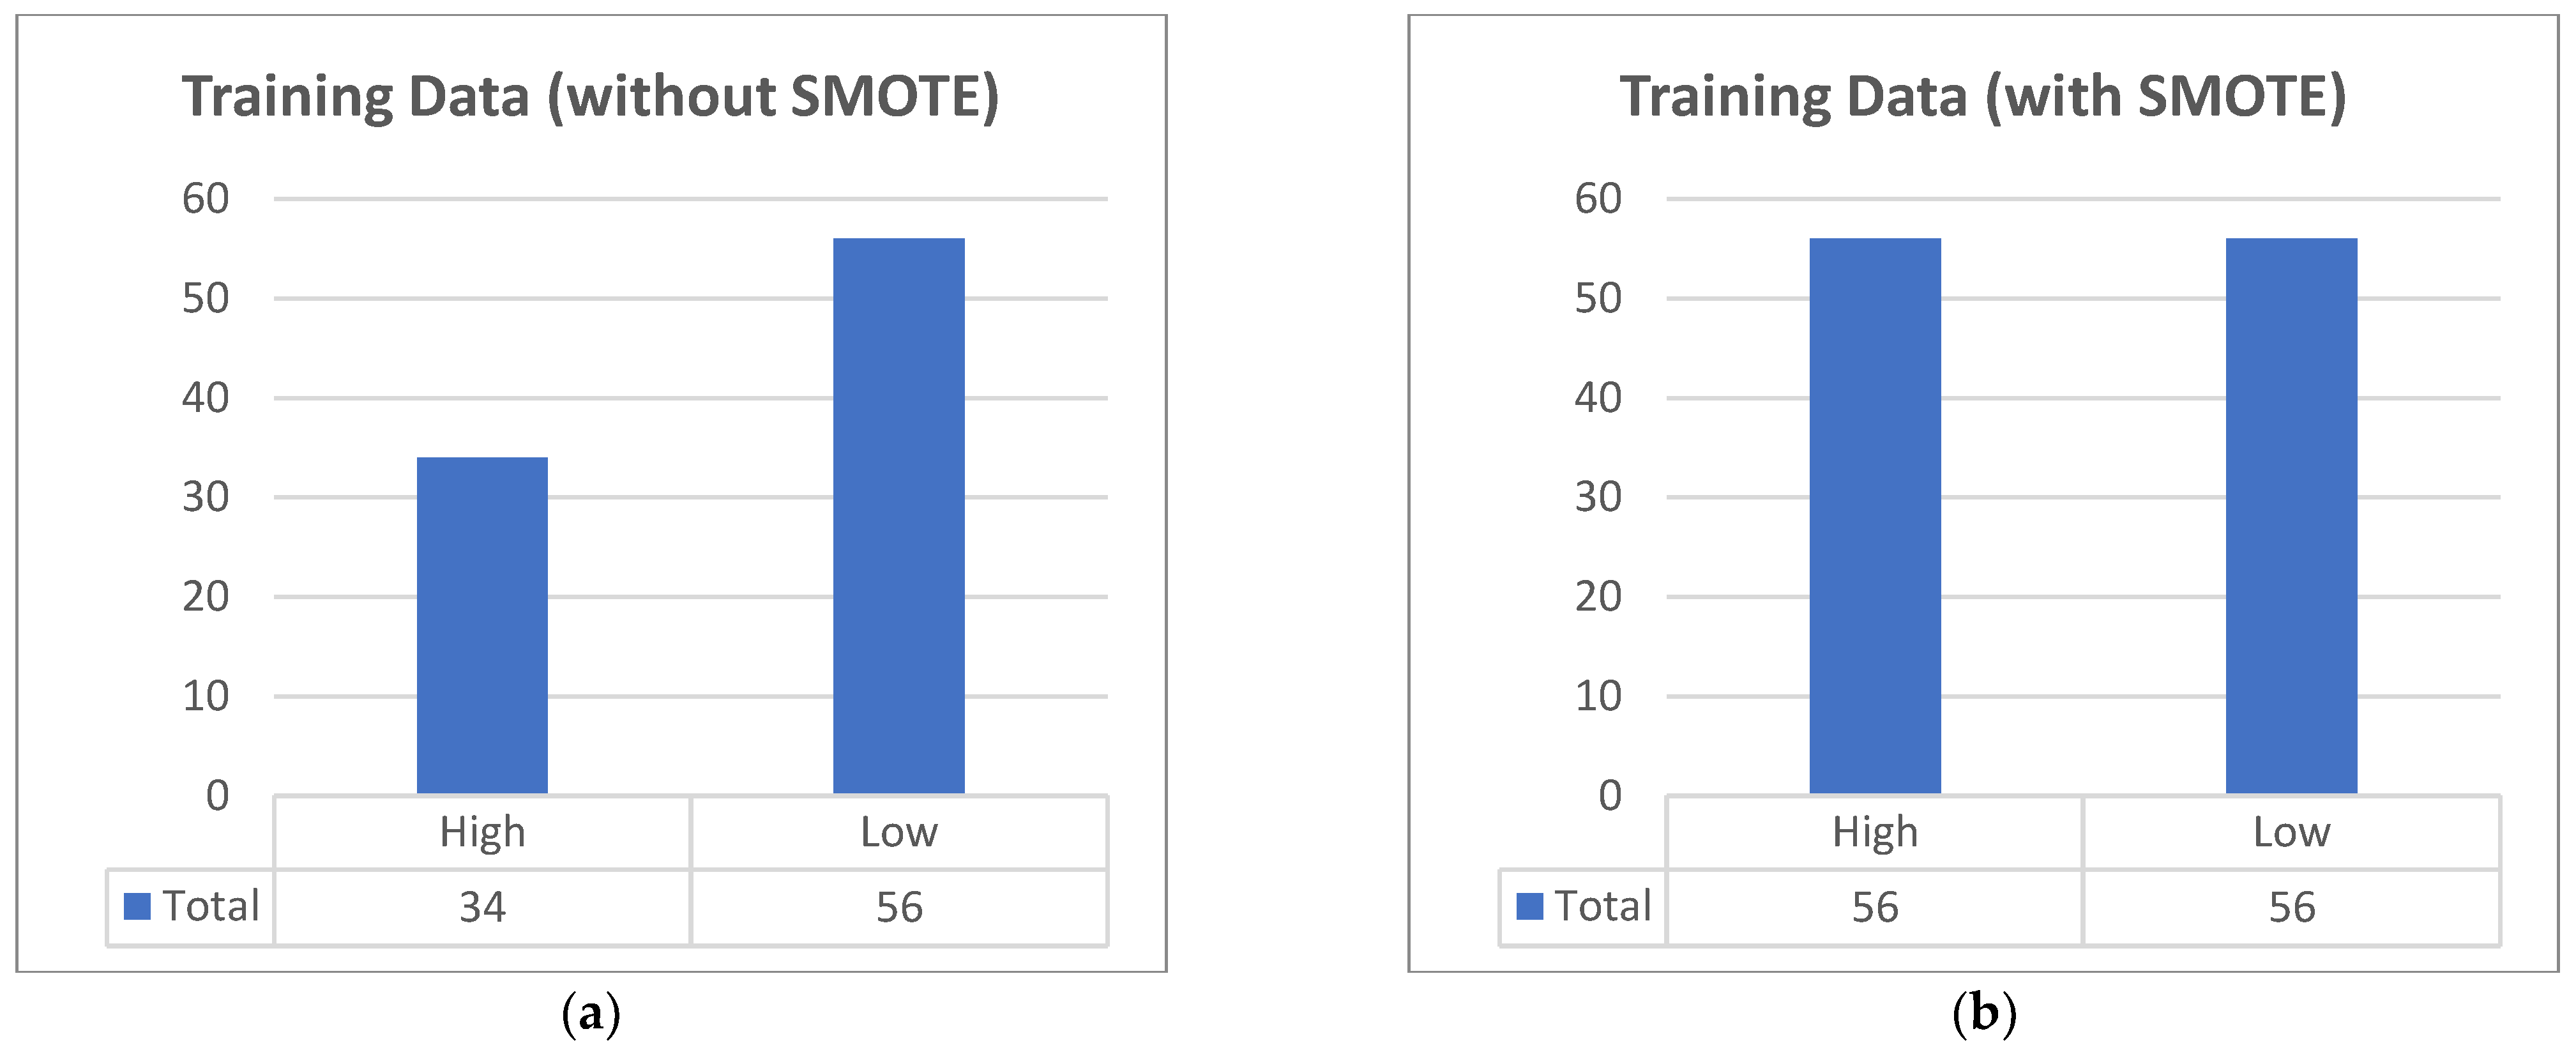
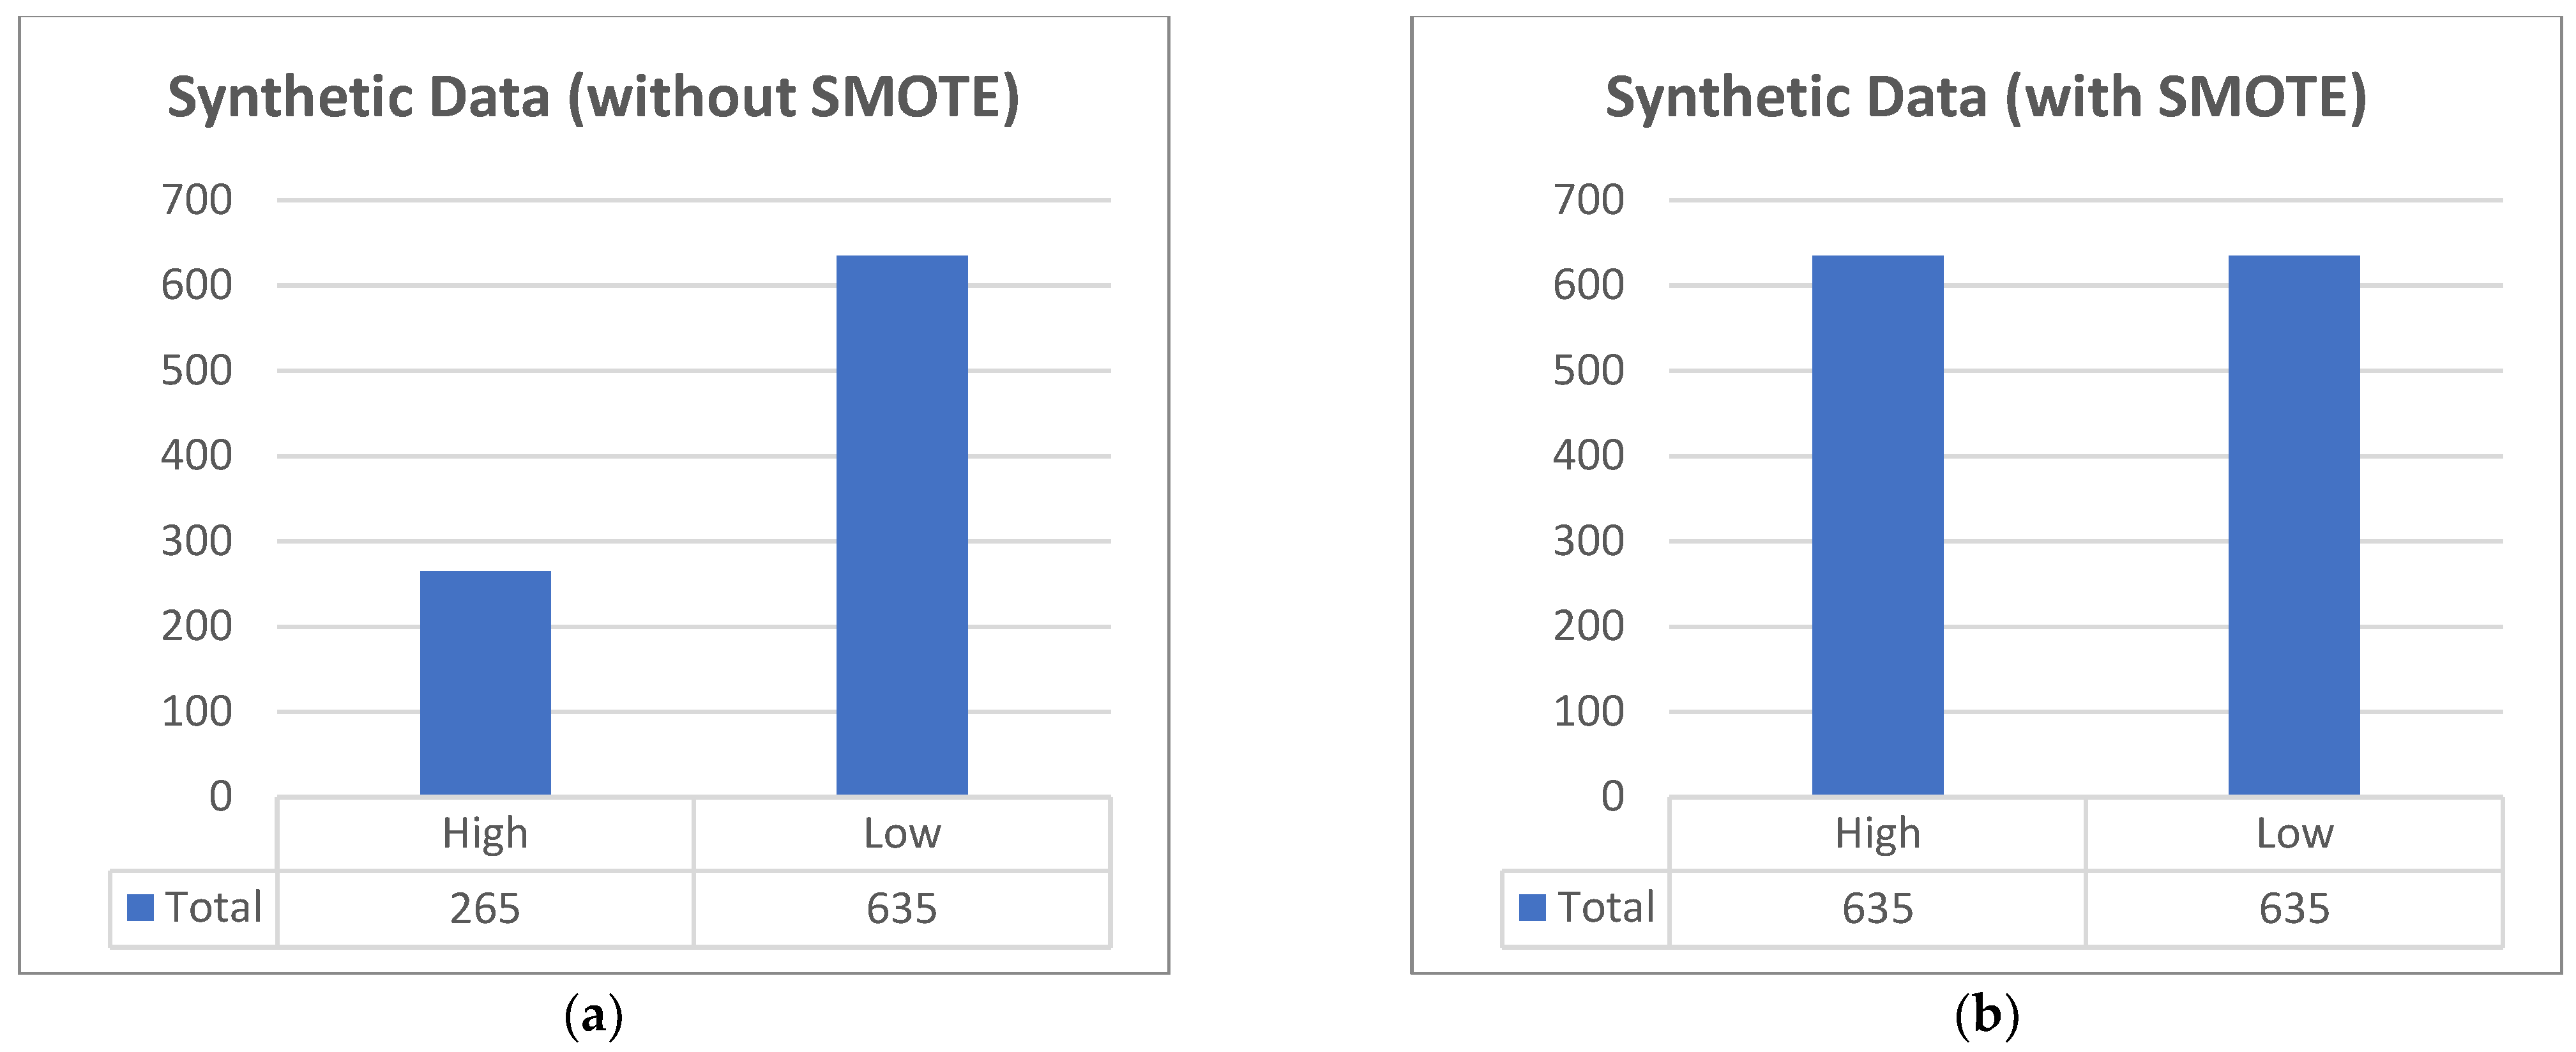
3.2. Data Processing
3.3. Hyperparameter Tuning
3.3.1. Decision Tree (DT)
3.3.2. Random Forest (RF)
3.3.3. Support Vector Machine (SVM)
3.3.4. K-Nearest Neighbors (KNN)
3.3.5. Naïve Bayes (NB)
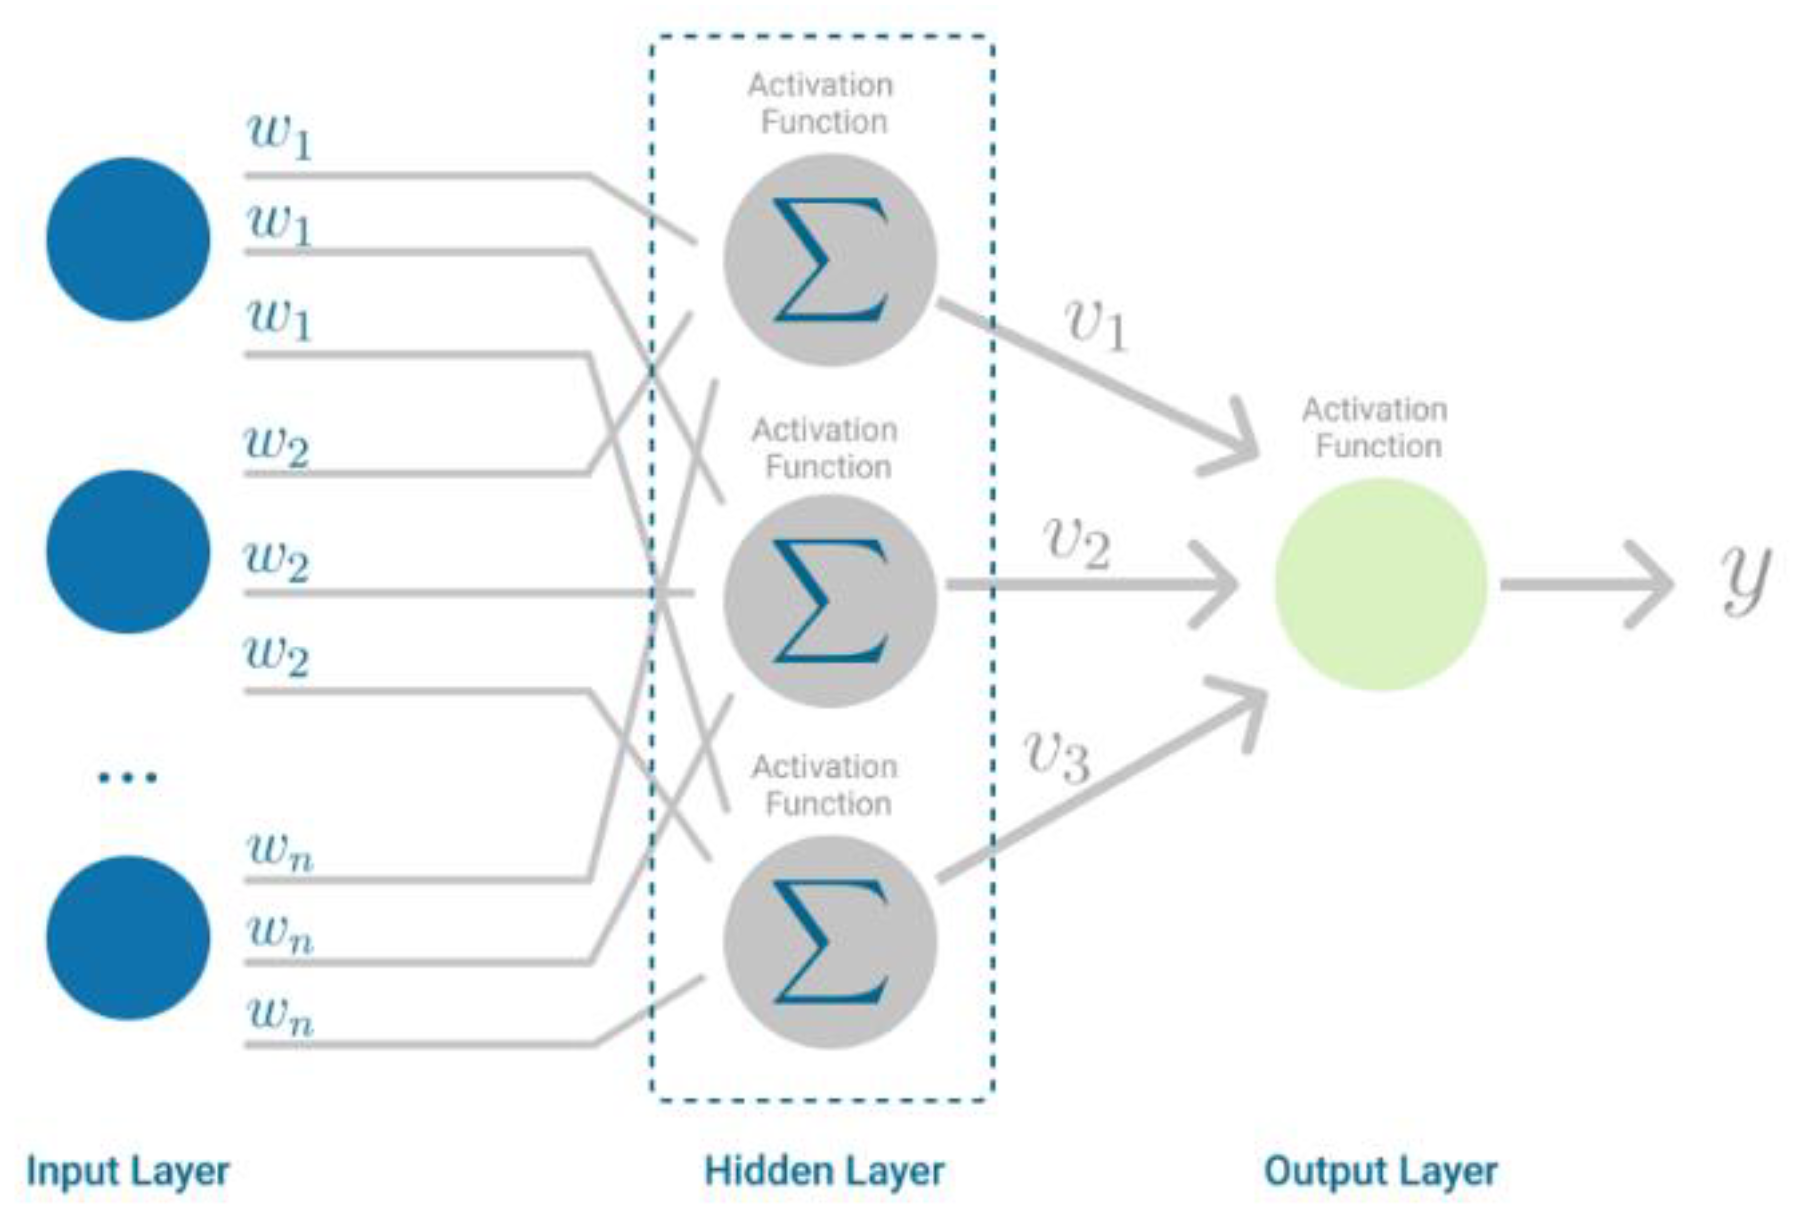
3.3.6. Multilayer Perceptron (MLP)
3.4. Comparative Analysis
3.4.1. Accuracy
3.4.2. Sensitivity
3.4.3. Specificity
3.5. Modeling
4. Results
4.1. Results of Hyperparameter Tuning
4.1.1. Decision Tree (DT)
4.1.2. Random Forest (RF)
4.1.3. Support Vector Machine (SVM)
4.1.4. K-Nearest Neighbors (KNN)
4.1.5. Naïve Bayes (NB)
4.1.6. Multilayer Perceptron (MLP)
4.2. Comparative Analysis Results
4.3. Self-Training Model Performance Result
5. Discussion
6. Conclusions
Author Contributions
Funding
Institutional Review Board Statement
Informed Consent Statement
Data Availability Statement
Acknowledgments
Conflicts of Interest
References
- World Health Organization. Maternal Health. Available online: https://www.who.int/health-topics/maternal-health#tab=tab_3 (accessed on 19 September 2022).
- World Health Organization. Maternal Mortality. Available online: https://www.who.int/en/news-room/fact-sheets/detail/maternal-mortality (accessed on 19 September 2022).
- Cleveland Clinic. High-Risk Pregnancy. 14 December 2021. Available online: https://my.clevelandclinic.org/health/diseases/22190-high-risk-pregnancy (accessed on 15 September 2022).
- US National Institutes of Health. What is a High-Risk Pregnancy? 31 January 2017. Available online: https://www.nichd.nih.gov/health/topics/pregnancy/conditioninfo/high-risk (accessed on 15 September 2022).
- Macrohon, J.J.E.; Balan, A.K.D.; Fuentes, G.S.; de Goma, J.C. Development of a Maternal Health System for Remote Areas. In Proceedings of the 2019 3rd International Conference on Software and e-Business (ICSEB), Tokyo, Japan, 9–11 December 2019. [Google Scholar]
- Macrohon, J.J.E.; Villavicencio, C.N.; Inbaraj, X.A.; Jeng, J.-H. A Semi-Supervised Approach to Sentiment Analysis of Tweets during the 2022 Philippine Presidential Election. Information 2022, 13, 484. [Google Scholar] [CrossRef]
- Tricomi, P.P.; Tarahomi, S.; Cattai, C.; Martini, F.; Conti, M. Are We All in a Truman Show? Spotting Instagram Crowdturfing through Self-Training. arXiv 2022, arXiv:2206.12904. [Google Scholar]
- Villavicencio, C.N.; Macrohon, J.J.E.; Inbaraj, X.A.; Jeng, J.-H.; Hsieh, J.-G. COVID-19 Prediction Applying Supervised Machine Learning Algorithms with Comparative Analysis Using WEKA. Algorithms 2021, 14, 201. [Google Scholar] [CrossRef]
- Kim, B.; Moon, J.Y.; Shin, J.Y.; Jeon, H.R.; Oh, S.Y.; Kim, S.Y. Effect of smartphone app-based health care intervention for health management of high-risk mothers: A study protocol for a randomized controlled trial. Trials 2022, 23, 486. [Google Scholar] [CrossRef] [PubMed]
- Fredriksson, A.; Fulcher, I.R.; Russell, A.L.; Li, T.; Tsai, Y.-T.; Seif, S.S.; Mpembeni, R.N.; Hedt-Gauthier, B. Machine learning for maternal health: Predicting delivery location in a community health worker program in Zanzibar. Front. Digit. Health 2022, 4, 855236. [Google Scholar] [CrossRef] [PubMed]
- Oprescu, A.M.; Miró-Amarante, G.; García-Díaz, L.; Rey, V.E.; Chimenea-Toscano, A.; Martínez-Martínez, R.; Romero-Ternero, M.C. Towards a data collection methodology for Responsible Artificial Intelligence in health: A prospective and qualitative study in pregnancy. Inf. Fusion 2022, 83–84, 53–78. [Google Scholar] [CrossRef]
- Gómez-Jemes, L.; Oprescu, A.; Chimenea-Toscano, Á.; García-Díaz, L.; Romero-Ternero, M. Machine Learning to Predict Pre-Eclampsia and Intrauterine Growth Restriction in Pregnant Women. Electronics 2022, 11, 3240. [Google Scholar] [CrossRef]
- Clark, R.R.S.; Hou, J. Three machine learning algorithms and their utility in exploring risk factors associated with primary cesarean section in low-risk women: A methods paper. Res. Nurs. Health 2022, 44, 559–570. [Google Scholar] [CrossRef] [PubMed]
- Montella, E.; Ferraro, A.; Sperlì, G.; Triassi, M.; Santini, S.; Improta, G. Predictive Analysis of Healthcare-Associated Blood Stream Infections in the Neonatal Intensive Care Unit Using Artificial Intelligence: A Single Center Study. Int. J. Environ. Res. Public Health 2022, 19, 2498. [Google Scholar] [CrossRef] [PubMed]
- Liew, A.; Lee, C.C.; Subramaniam, V.; Lan, B.L.; Tan, M. Comprehensive study of semi-supervised learning for DNA methylation-based supervised classification of central nervous system tumors. J. Magn. Reson. Imaging 2022, 23, 223. [Google Scholar]
- Lakshmi, B.I.T.; Nandini, R. A study on C.5 Decision Tree Classification Algorithm for Risk Predictions during Pregnancy. Procedia Technol. 2016, 24, 1542–1549. [Google Scholar] [CrossRef] [Green Version]
- Akbulut, A.; Ertugrul, E.; Topcu, V. Fetal health status prediction based on maternal clinical history using machine learning techniques. Comput. Methods Programs Biomed. 2018, 163, 87–100. [Google Scholar] [CrossRef] [PubMed]
- Bautista, J.M.; Quiwa, Q.A.I.; Reyes, R.S. Machine Learning Analysis for Remote Prenatal Care. In Proceedings of the IEEE Region 10 Conference (Tencon), Osaka, Tokyo, 16–19 November 2020. [Google Scholar]
- Ahmed, M.; Kashem, M.A. IoT Based Risk Level Prediction Model For Maternal Health Care In The Context Of Bangladesh. In Proceedings of the 2020 2nd International Conference on Sustainable Technologies for Industry 4.0 (STI), Dhaka, Bangladesh, 19–20 December 2020. [Google Scholar]
- Tidy, C. Gravidity and Parity Definitions: Implications in Risk Assessment. 21 January 2019. Available online: https://patient.info/doctor/gravidity-and-parity-definitions-and-their-implications-in-risk-assessment (accessed on 15 September 2022).
- Hernandez, M.; Epelde, G.; Beristain, A.; Álvarez, R.; Molina, C.; Larrea, X.; Alberdi, A.; Timoleon, M.; Bamidis, P.; Konstantinidis, E. Incorporation of Synthetic Data Generation Techniques within a Controlled Data Processing Workflow in the Health and Wellbeing Domain. Electronics 2022, 11, 812. [Google Scholar] [CrossRef]
- Chauhan, N.S. Decision Tree Algorithm, Explained. 9 February 2022. Available online: https://www.kdnuggets.com/2020/01/decision-tree-algorithm-explained.html (accessed on 19 September 2022).
- Yiu, T. Understanding Random Forest. 12 June 2019. Available online: https://towardsdatascience.com/understanding-random-forest-58381e0602d2 (accessed on 19 September 2022).
- Pupale, R. Support Vector Machines(SVM)—An Overview. 16 June 2018. Available online: https://towardsdatascience.com/https-medium-com-pupalerushikesh-svm-f4b42800e989 (accessed on 19 September 2022).
- IBM K-Nearest Neighbors Algorithm. Available online: https://www.ibm.com/topics/knn (accessed on 19 September 2022).
- Raschka, S. STAT 479: Machine Learning. 2018. Available online: https://sebastianraschka.com/pdf/lecture-notes/stat479fs18/02_knn_notes.pdf (accessed on 19 September 2022).
- Chauhan, N.S. Naïve Bayes Algorithm: Everything You Need to Know. 8 April 2022. Available online: https://www.kdnuggets.com/2020/06/naive-bayes-algorithm-everything.html (accessed on 19 September 2022).
- Bento, C. Multilayer Perceptron Explained with a Real-Life Example and Python Code: Sentiment Analysis. 21 September 2021. Available online: https://towardsdatascience.com/multilayer-perceptron-explained-with-a-real-life-example-and-python-code-sentiment-analysis-cb408ee93141 (accessed on 19 September 2022).
- Sci-Kit Learn 1.14. Semi-Supervised Learning. 2017. Available online: https://scikit-learn.org/stable/modules/semi_supervised.html (accessed on 19 September 2022).
- Villavicencio, C.N.; Macrohon, J.J.E.; Inbaraj, X.A.; Jeng, J.-H.; Hsieh, J.-G. Development of a Machine Learning Based Web Application for Early Diagnosis of COVID-19 Based on Symptoms. Diagnostics 2022, 12, 821. [Google Scholar] [CrossRef] [PubMed]


| Study | Machine Learning Algorithms | Best Algorithm | Accuracy Obtained | Reference |
|---|---|---|---|---|
| Lakshmi, et al. | J48 DT | J48 DT | 71.30% | [16] |
| Akbulut, et al. | AP, BDT, BPM, DF, DJ, L-DSVM, LR, NN, SVM | DF | 89.50% | [17] |
| Bautista, et al. | DT, RFDT, KNN, SVM | RFDT | 90.00% | [18] |
| Ahmed, et al. | DT, RF, SVM, SMO, LR, NB, IBk, LMT | DT | 97.00% | [19] |
| Proposed Method | DT, RF, KNN, SVM, NB, MLP | DT with Self-Training | 97.01% |
| Attribute | Type | Description |
|---|---|---|
| Age | Nominal | Age (in years) when the woman is pregnant. |
| Gravida | Nominal | The number of times a woman has been pregnant [20]. |
| Parity | Nominal | The number of times a woman has given birth with a gestational age of 24 weeks or more, regardless of whether the child was born alive or was stillborn [20]. |
| Height | Nominal | Head-to-toe measurement in centimeters (cm). |
| Weight | Nominal | Body mass measurement in kilograms (kg). |
| Trimester | Nominal | The stage (out of three trimesters) during the pregnancy in which the woman visited the health center. |
| Visits | Nominal | Number of times the woman visited the health center. |
| Risk Level | Class Label | Classified as either high-risk or low-risk pregnancy. |
| Attribute | Type | Value |
|---|---|---|
| Age (years) | Total | 90 |
| Mean | 26.87 | |
| Minimum | 15 | |
| Maximum | 45 | |
| Gravida | Mean | 3 |
| Minimum | 1 | |
| Maximum | 5 | |
| Parity | Mean | 2 |
| Minimum | 0 | |
| Maximum | 4 | |
| Height (cm) | Mean | 154.99 |
| Minimum | 140.5 | |
| Maximum | 190 | |
| Weight (kg) | Mean | 56.9 |
| Minimum | 39 | |
| Maximum | 88 | |
| Visits | Mean | 3 |
| Minimum | 1 | |
| Maximum | 5 |
| No. | Criterion | Min Samples in the Node | Maximum Depth | Score | Ranking |
|---|---|---|---|---|---|
| 1 | entropy | 5 | 10 | 90.08 | 1 |
| 2 | entropy | 5 | 5 | 90.08 | 1 |
| 3 | entropy | 5 | 20 | 90.08 | 1 |
| 4 | entropy | 10 | 5 | 89.17 | 4 |
| 5 | entropy | 10 | 3 | 89.17 | 4 |
| 6 | entropy | 10 | 2 | 89.17 | 4 |
| 7 | entropy | 5 | 2 | 89.17 | 4 |
| 8 | entropy | 10 | 10 | 89.17 | 4 |
| 9 | gini | 5 | 10 | 89.17 | 4 |
| 10 | gini | 5 | 5 | 89.17 | 4 |
| No. | Criterion | Min Samples | Max Depth | No. of Estimators | Bootstrap | Score | Ranking |
|---|---|---|---|---|---|---|---|
| 1 | entropy | 5 | 10 | 200 | True | 93.71 | 1 |
| 2 | entropy | 5 | 5 | 300 | False | 93.71 | 1 |
| 3 | entropy | 5 | 5 | 100 | False | 93.71 | 1 |
| 4 | gini | 5 | 5 | 200 | True | 93.71 | 1 |
| 5 | entropy | 5 | 20 | 300 | True | 93.71 | 1 |
| 6 | gini | 5 | 10 | 100 | True | 92.80 | 6 |
| 7 | gini | 5 | 10 | 200 | True | 92.80 | 6 |
| 8 | gini | 5 | 10 | 100 | False | 92.80 | 6 |
| 9 | entropy | 5 | 10 | 100 | True | 92.80 | 6 |
| 10 | entropy | 5 | 5 | 200 | False | 92.80 | 6 |
| No. | C | Degree | Kernel | Gamma | Score | Ranking |
|---|---|---|---|---|---|---|
| 1 | 5 | 3 | Radial Basis Function | 0.1 | 97.27 | 1 |
| 2 | 5 | 1 | Radial Basis Function | 0.1 | 97.27 | 1 |
| 3 | 2 | 2 | Radial Basis Function | 0.1 | 97.27 | 1 |
| 4 | 2 | 1 | Radial Basis Function | 0.1 | 97.27 | 1 |
| 5 | 2 | 3 | Radial Basis Function | 0.1 | 97.27 | 1 |
| 6 | 5 | 2 | Radial Basis Function | 0.1 | 97.27 | 1 |
| 7 | 10 | 2 | Radial Basis Function | 0.1 | 96.36 | 7 |
| 8 | 10 | 1 | Radial Basis Function | 0.1 | 96.36 | 7 |
| 9 | 10 | 3 | Radial Basis Function | 0.1 | 96.36 | 7 |
| 10 | 1 | 2 | Radial Basis Function | 0.1 | 95.45 | 10 |
| No. | Metric | Neighbors | Weights | Score | Ranking |
|---|---|---|---|---|---|
| 1 | cosine | 7 | distance | 95.53 | 1 |
| 2 | manhattan | 5 | distance | 95.45 | 2 |
| 3 | l1 | 9 | distance | 95.45 | 2 |
| 4 | cityblock | 5 | distance | 95.45 | 2 |
| 5 | cityblock | 9 | distance | 95.45 | 2 |
| 6 | l1 | 5 | distance | 95.45 | 2 |
| 7 | manhattan | 9 | distance | 95.45 | 2 |
| 8 | l2 | 3 | distance | 94.62 | 8 |
| 9 | euclidean | 3 | distance | 94.62 | 8 |
| 10 | nan_euclidean | 3 | distance | 94.62 | 8 |
| No. | Var Smoothing | Score | Ranking |
|---|---|---|---|
| 1 | 0.151991 | 83.79 | 1 |
| 2 | 0.123285 | 83.79 | 1 |
| 3 | 0.1 | 83.79 | 1 |
| 4 | 0.065793 | 82.88 | 4 |
| 5 | 0.081113 | 82.88 | 4 |
| 6 | 0.015199 | 80.30 | 6 |
| 7 | 0.018738 | 80.30 | 6 |
| 8 | 0.008111 | 80.30 | 6 |
| 9 | 0.035112 | 80.15 | 9 |
| 10 | 0.187382 | 80.15 | 9 |
| No. | Hidden Layer Sizes | Activation | Solver | Alpha | Learning Rate | Score | Ranking |
|---|---|---|---|---|---|---|---|
| 1 | (50, 100, 50) | tanh | adam | 0.0001 | constant | 98.18 | 1 |
| 2 | (50, 100, 50) | tanh | adam | 0.0001 | adaptive | 98.18 | 1 |
| 3 | (50, 50, 50) | relu | adam | 0.0001 | constant | 97.35 | 3 |
| 4 | (50, 100, 50) | tanh | adam | 0.05 | constant | 97.95 | 3 |
| 5 | (50, 50, 50) | tanh | adam | 0.0001 | constant | 97.27 | 5 |
| 6 | (50, 50, 50) | tanh | adam | 0.05 | constant | 96.44 | 6 |
| 7 | (100,) | tanh | adam | 0.05 | adaptive | 95.53 | 7 |
| 8 | (100,) | tanh | adam | 0.05 | constant | 95.53 | 7 |
| 9 | (50, 50, 50) | relu | adam | 0.05 | adaptive | 95.53 | 7 |
| 10 | (100,) | tanh | adam | 0.0001 | adaptive | 95.53 | 7 |
| Algorithm | Accuracy | Sensitivity | Specificity |
|---|---|---|---|
| Decision Tree | 93.70% | 90.05% | 97.37% |
| Random Forest | 90.29% | 94.24% | 86.32% |
| Support Vector Machine | 90.81% | 94.24% | 87.37% |
| K-Nearest Neighbors | 84.25% | 87.43% | 81.05% |
| Naïve Bayes | 72.18% | 67.02% | 77.37% |
| Multilayer Perceptron | 91.86% | 91.10% | 92.63% |
| Decision Tree with Self-Training | Predicted High Risk | Predicted Low Risk | Recall |
|---|---|---|---|
| Actual High Risk | 609 | 26 | 95.91% |
| Actual Low Risk | 12 | 623 | 98.11% |
| Precision | 98.07% | 95.99% |
Publisher’s Note: MDPI stays neutral with regard to jurisdictional claims in published maps and institutional affiliations. |
© 2022 by the authors. Licensee MDPI, Basel, Switzerland. This article is an open access article distributed under the terms and conditions of the Creative Commons Attribution (CC BY) license (https://creativecommons.org/licenses/by/4.0/).
Share and Cite
Macrohon, J.J.E.; Villavicencio, C.N.; Inbaraj, X.A.; Jeng, J.-H. A Semi-Supervised Machine Learning Approach in Predicting High-Risk Pregnancies in the Philippines. Diagnostics 2022, 12, 2782. https://doi.org/10.3390/diagnostics12112782
Macrohon JJE, Villavicencio CN, Inbaraj XA, Jeng J-H. A Semi-Supervised Machine Learning Approach in Predicting High-Risk Pregnancies in the Philippines. Diagnostics. 2022; 12(11):2782. https://doi.org/10.3390/diagnostics12112782
Chicago/Turabian StyleMacrohon, Julio Jerison E., Charlyn Nayve Villavicencio, X. Alphonse Inbaraj, and Jyh-Horng Jeng. 2022. "A Semi-Supervised Machine Learning Approach in Predicting High-Risk Pregnancies in the Philippines" Diagnostics 12, no. 11: 2782. https://doi.org/10.3390/diagnostics12112782