
Predictive Value of Cardiac Magnetic Resonance for Left Ventricular Remodeling of Patients with Acute Anterior Myocardial Infarction

 ,
,
Abstract
:1. Introduction
2. Patients and Methods
2.1. Study Population and Data Collection
2.2. Definition of LVR
2.3. CMR Technique
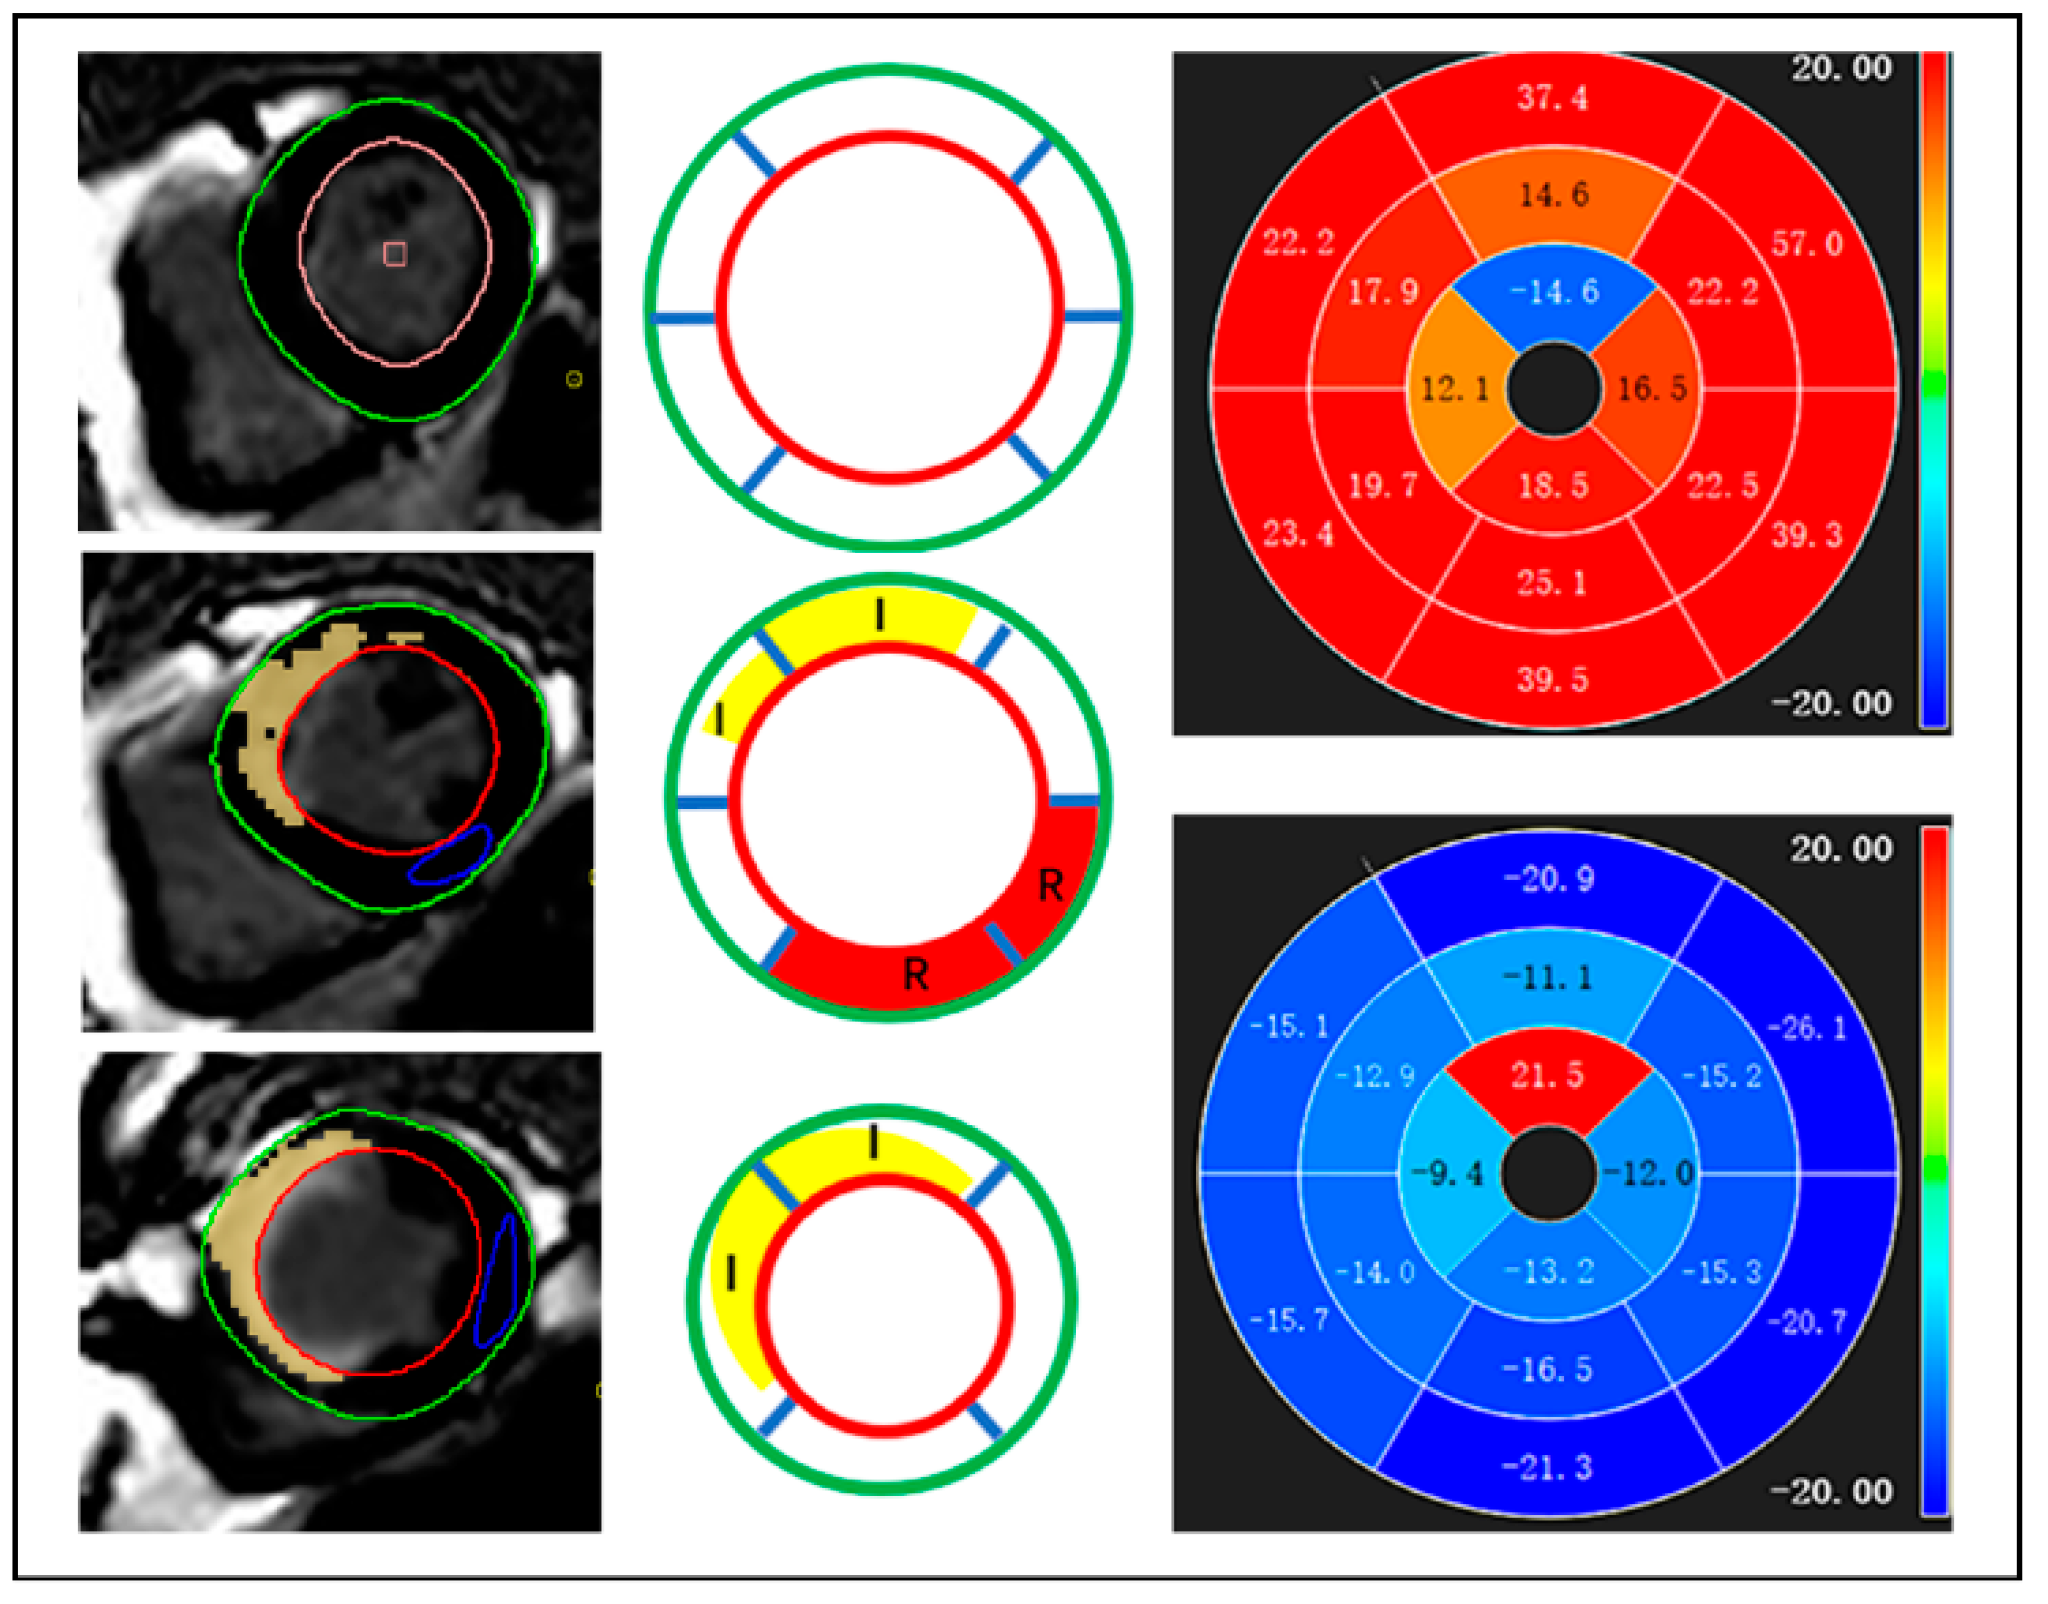
2.4. CMR Analysis
2.5. Angiographic Assessments
2.6. Reproducibility Analysis
2.7. Statistical Analysis
3. Results
3.1. Patient Characteristics
3.2. CMR Parameter Analysis
3.3. Cardiovascular Outcomes
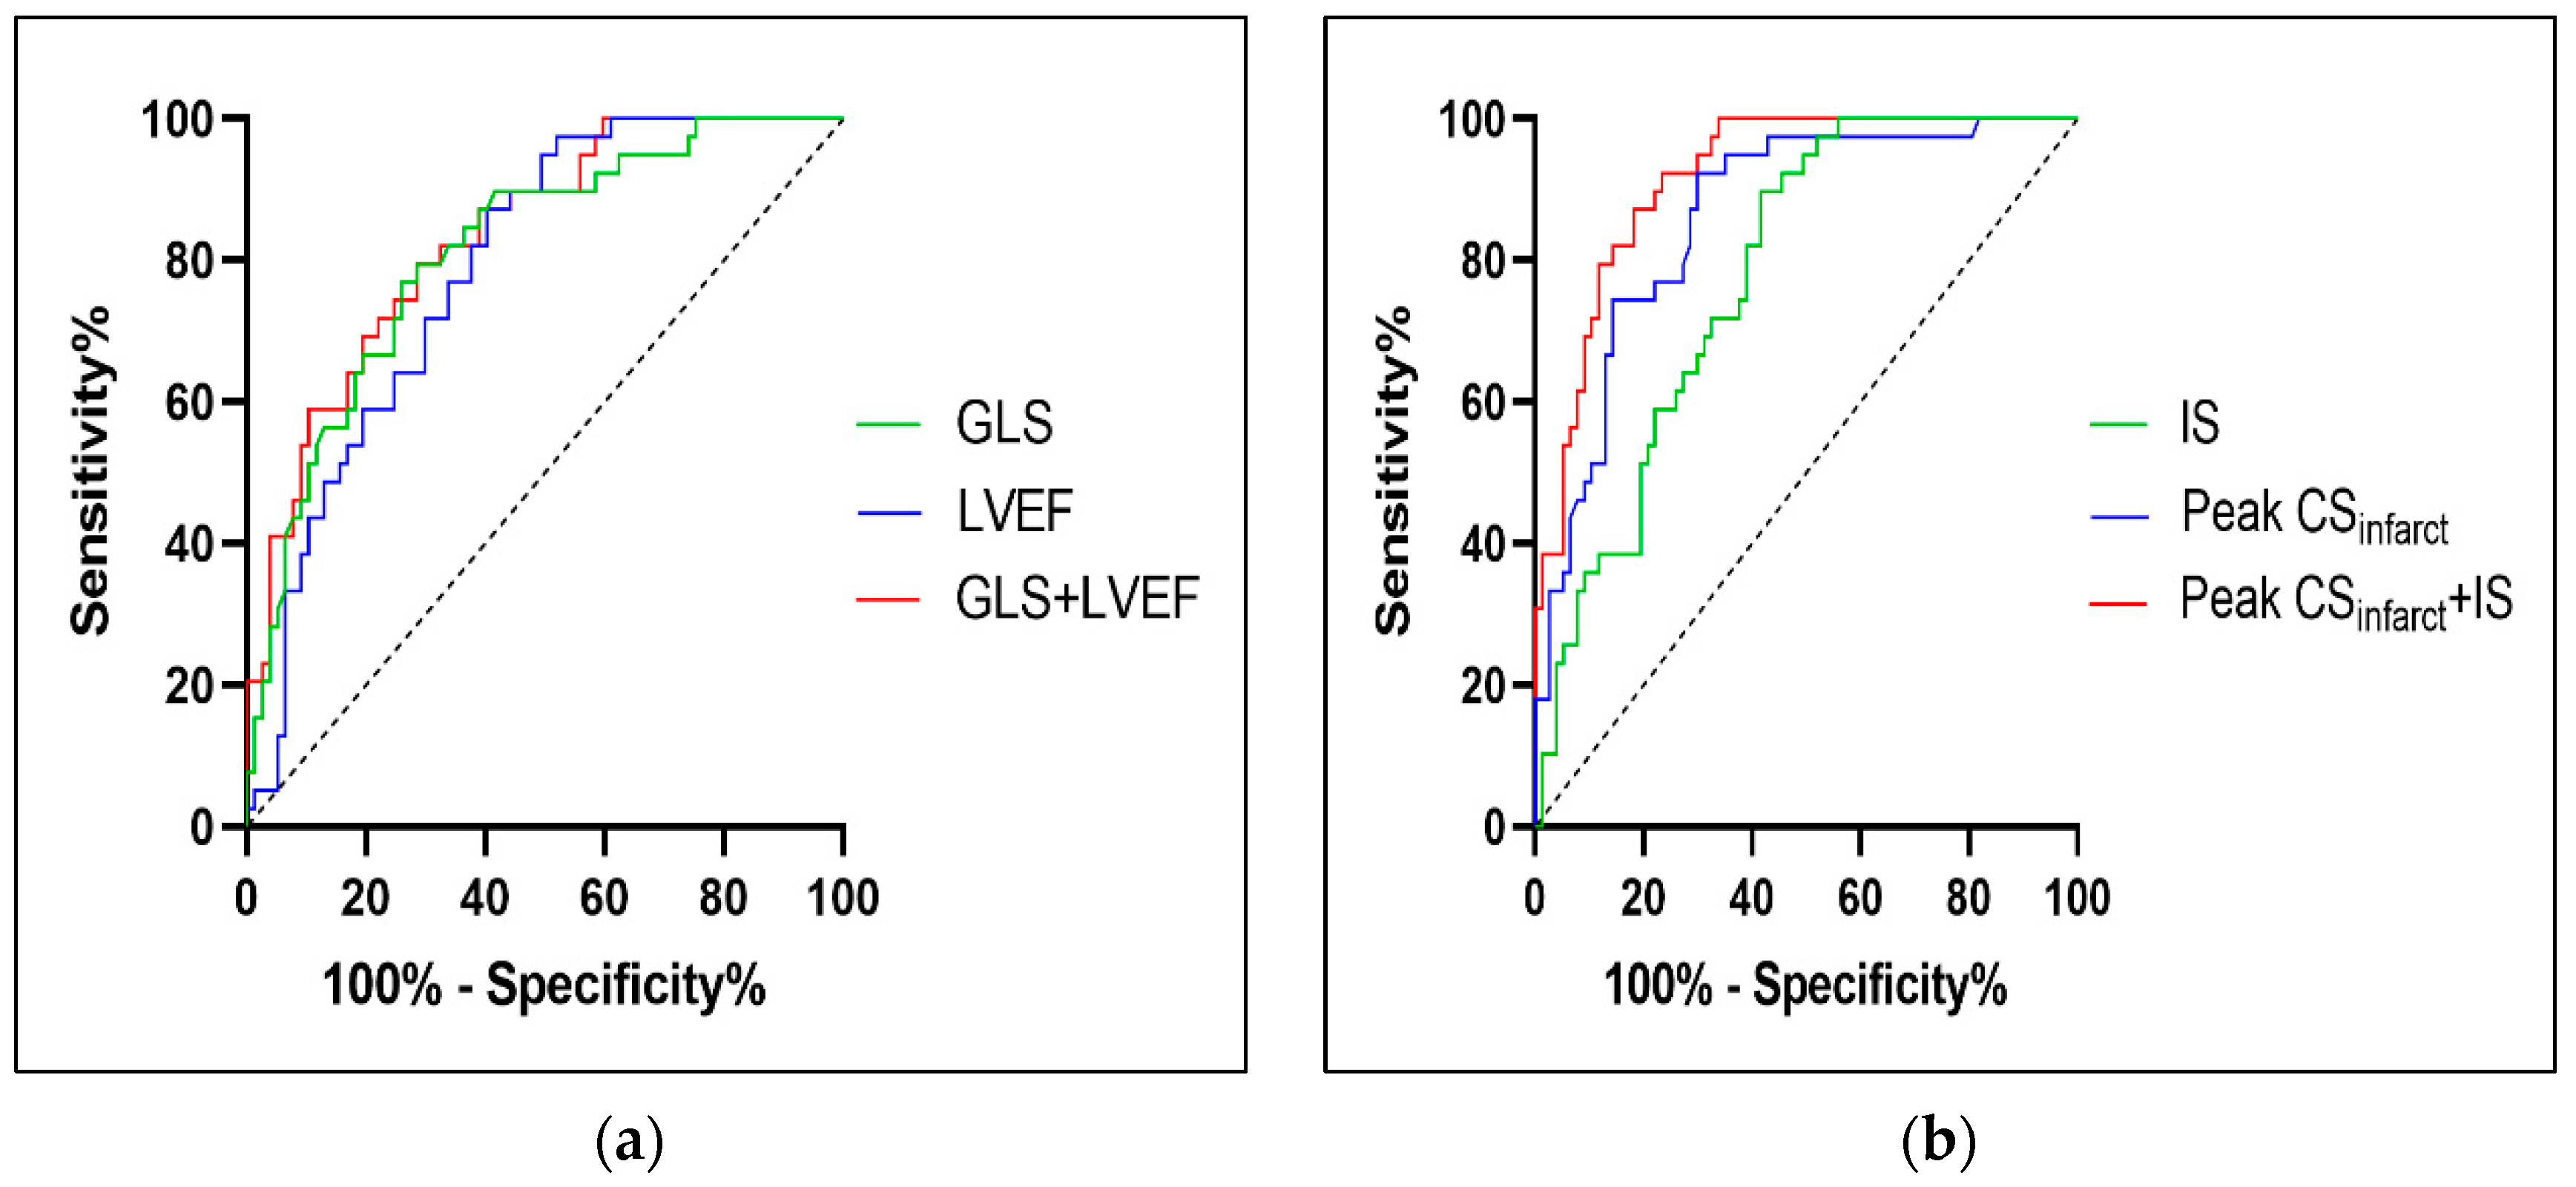
3.4. ROC Curve Analysis of the Risk Score Model
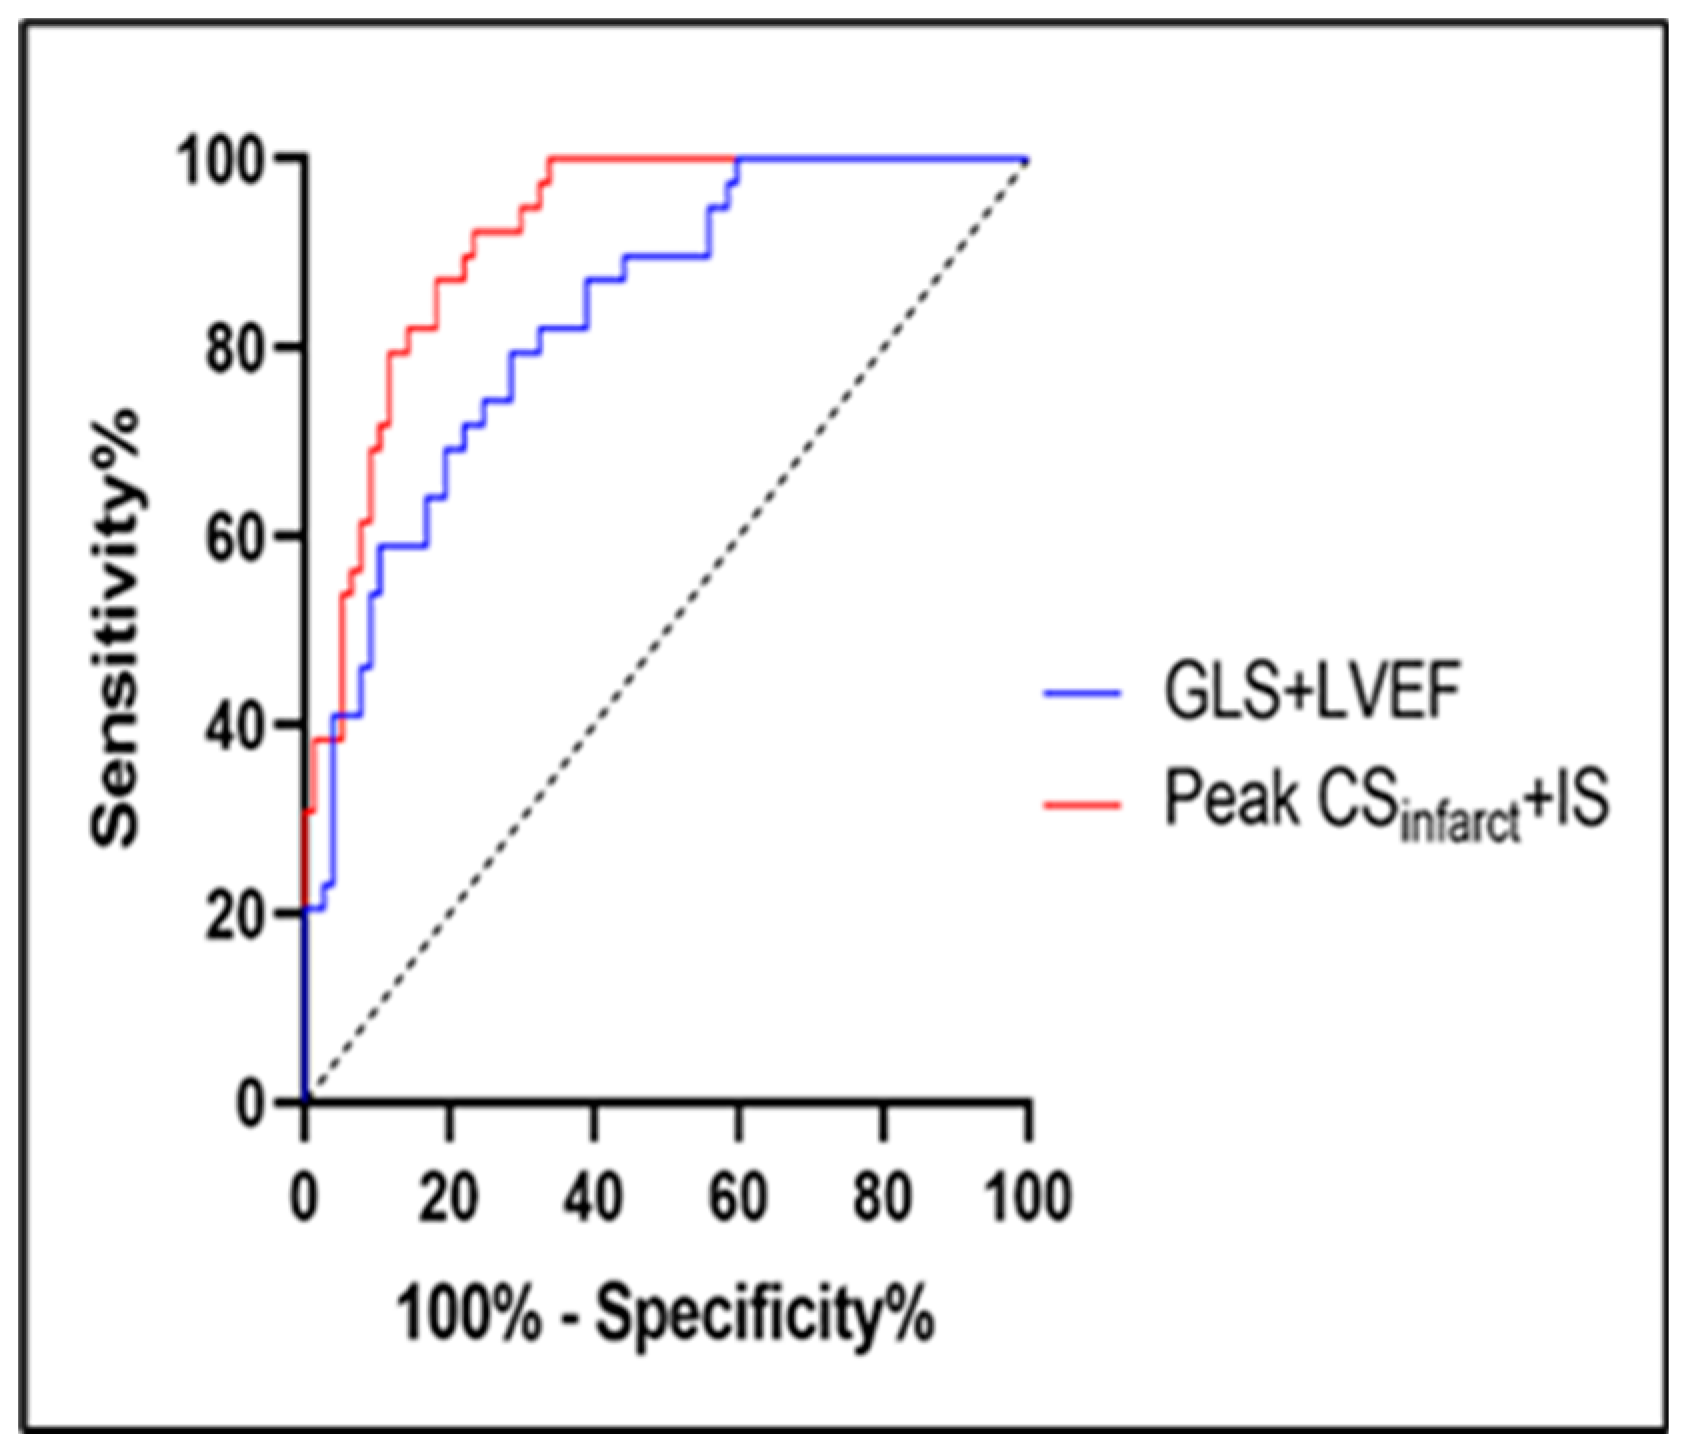
3.5. Incremental Effects of Global and Regional Parameters
3.6. Reproducibility
4. Discussion
5. Limitations
6. Conclusions
Supplementary Materials
Author Contributions
Funding
Institutional Review Board Statement
Informed Consent Statement
Data Availability Statement
Conflicts of Interest
References
- Szummer, K.; Wallentin, L.; Lindhagen, L.; Alfredsson, J.; Erlinge, D.; Held, C.; James, S.; Kellerth, T.; Lindahl, B.; Ravn-Fischer, A.; et al. Improved outcomes in patients with ST-elevation myocardial infarction during the last 20 years are related to implementation of evidence-based treatments: Experiences from the SWEDEHEART registry 1995–2014. Eur. Heart J. 2017, 38, 3056–3065. [Google Scholar] [CrossRef] [Green Version]
- Masci, P.G.; Ganame, J.; Francone, M.; Desmet, W.; Lorenzoni, V.; Iacucci, I.; Barison, A.; Carbone, I.; Lombardi, M.; Agati, L.; et al. Relationship between location and size of myocardial infarction and their reciprocal influences on post-infarction left ventricular remodelling. Eur. Heart J. 2011, 32, 1640–1648. [Google Scholar] [CrossRef] [Green Version]
- Granger, C.B.; Goldberg, R.J.; Dabbous, O.; Pieper, K.S.; Eagle, K.A.; Cannon, C.P.; Van de Werf, F.; Avezum, A.; Goodman, S.G.; Flather, M.D.; et al. Predictors of Hospital Mortality in the Global Registry of Acute Coronary Events. Arch. Intern. Med. 2003, 163, 2345–2353. [Google Scholar] [CrossRef] [Green Version]
- Morrow, D.A.; Antman, E.M.; Charlesworth, A.; Cairns, R.; Murphy, S.A.; de Lemos, J.A.; Giugliano, R.P.; McCabe, C.H.; Braunwald, E. TIMI Risk Score for ST-Elevation Myocardial Infarction: A Convenient, Bedside, Clinical Score for Risk Assessment at Presentation. Circulation 2000, 102, 2031–2037. [Google Scholar] [CrossRef] [Green Version]
- Pontone, G.; Guaricci, A.I.; Andreini, D.; Ferro, G.; Guglielmo, M.; Baggiano, A.; Fusini, L.; Muscogiuri, G.; Lorenzoni, V.; Mushtaq, S.; et al. Prognostic Stratification of Patients With ST-Segment–Elevation Myocardial Infarction (PROSPECT). Circ. Cardiovasc. Imaging 2017, 10, e006428. [Google Scholar] [CrossRef] [Green Version]
- Ibanez, B.; Aletras, A.H.; Arai, A.E.; Arheden, H.; Bax, J.; Berry, C.; Bucciarelli-Ducci, C.; Croisille, P.; Dall’Armellina, E.; Dharmakumar, R.; et al. Cardiac MRI Endpoints in Myocardial Infarction Experimental and Clinical Trials: JACC Scientific Expert Panel. J. Am. Coll. Cardiol. 2019, 74, 238–256. [Google Scholar] [CrossRef]
- Reindl, M.; Eitel, I.; Reinstadler, S.J. Role of Cardiac Magnetic Resonance to Improve Risk Prediction following Acute ST-elevation Myocardial Infarction. J. Clin. Med. 2020, 9, 1041. [Google Scholar] [CrossRef] [Green Version]
- Solomon, S.D.; Skali, H.; Anavekar, N.S.; Bourgoun, M.; Barvik, S.; Ghali, J.K.; Warnica, J.W.; Khrakovskaya, M.; Arnold, J.M.O.; Schwartz, Y.; et al. Changes in Ventricular Size and Function in Patients Treated With Valsartan, Captopril, or Both After Myocardial Infarction. Circulation 2005, 111, 3411–3419. [Google Scholar] [CrossRef] [Green Version]
- Ibanez, B.; James, S.; Agewall, S.; Antunes, M.J.; Bucciarelli-Ducci, C.; Bueno, H.; Caforio, A.L.P.; Crea, F.; Goudevenos, J.A.; Halvorsen, S.; et al. 2017 ESC Guidelines for the management of acute myocardial infarction in patients presenting with ST-segment elevation. Eur. Heart J. 2018, 39, 119–177. [Google Scholar] [CrossRef] [Green Version]
- Holzknecht, M.; Reindl, M.; Tiller, C.; Reinstadler, S.J.; Lechner, I.; Pamminger, M.; Schwaiger, J.P.; Klug, G.; Bauer, A.; Metzler, B.; et al. Global longitudinal strain improves risk assessment after ST-segment elevation myocardial infarction: A comparative prognostic evaluation of left ventricular functional parameters. Clin. Res. Cardiol. 2021, 110, 1599–1611. [Google Scholar] [CrossRef]
- Bulluck, H.; Carberry, J.; Carrick, D.; McCartney, P.J.; Maznyczka, A.M.; Greenwood, J.P.; Maredia, N.; Chowdhary, S.; Gershlick, A.H.; Appleby, C.; et al. A Noncontrast CMR Risk Score for Long-Term Risk Stratification in Reperfused ST-Segment Elevation Myocardial Infarction. JACC Cardiovasc. Imaging 2022, 15, 431–440. [Google Scholar] [CrossRef]
- Stiermaier, T.; Jobs, A.; de Waha, S.; Fuernau, G.; Pöss, J.; Desch, S.; Thiele, H.; Eitel, I. Optimized Prognosis Assessment in ST-Segment–Elevation Myocardial Infarction Using a Cardiac Magnetic Resonance Imaging Risk Score. Circ. Cardiovasc. Imaging 2017, 10, e006774. [Google Scholar] [CrossRef] [Green Version]
- Legallois, D.; Hodzic, A.; Alexandre, J.; Dolladille, C.; Saloux, E.; Manrique, A.; Roule, V.; Labombarda, F.; Milliez, P.; Beygui, F. Definition of left ventricular remodelling following ST-elevation myocardial infarction: A systematic review of cardiac magnetic resonance studies in the past decade. Heart Fail. Rev. 2022, 27, 37–48. [Google Scholar] [CrossRef]
- Thygesen, K.; Alpert, J.S.; Jaffe, A.S.; Simoons, M.L.; Chaitman, B.R.; White, H.D.; Thygesen, K.; Alpert, J.S.; White, H.D.; Jaffe, A.S.; et al. Third universal definition of myocardial infarction. Eur. Heart J. 2012, 33, 2551–2567. [Google Scholar] [CrossRef] [Green Version]
- Gao, C.; Tao, Y.; Pan, J.; Shen, C.; Zhang, J.; Xia, Z.; Wan, Q.; Wu, H.; Gao, Y.; Shen, H.; et al. Evaluation of elevated left ventricular end diastolic pressure in patients with preserved ejection fraction using cardiac magnetic resonance. Eur. Radiol. 2019, 29, 2360–2368. [Google Scholar] [CrossRef]
- Bondarenko, O.; Beek, A.M.; Hofman, M.B.M.; Kühl, H.P.; Twisk, J.W.R.; Van Dockum, W.G.; Visser, C.A.; Van Rossum, A.C. Standardizing the Definition of Hyperenhancement in the Quantitative Assessment of Infarct Size and Myocardial Viability Using Delayed Contrast-Enhanced CMR. J. Cardiovasc. Magn. Reson. 2005, 7, 481–485. [Google Scholar] [CrossRef]
- Gao, C.; Gao, Y.; Hang, J.; Wei, M.; Li, J.; Wan, Q.; Tao, Y.; Wu, H.; Xia, Z.; Shen, C.; et al. Strain parameters for predicting the prognosis of non-ischemic dilated cardiomyopathy using cardiovascular magnetic resonance tissue feature tracking. J. Cardiovasc. Magn. Reson. 2021, 23, 21. [Google Scholar] [CrossRef]
- Lange, T.; Stiermaier, T.; Backhaus, S.J.; Boom, P.C.; Kowallick, J.T.; de Waha-Thiele, S.; Lotz, J.; Kutty, S.; Bigalke, B.; Gutberlet, M.; et al. Functional and prognostic implications of cardiac magnetic resonance feature tracking-derived remote myocardial strain analyses in patients following acute myocardial infarction. Clin. Res. Cardiol. 2021, 110, 270–280. [Google Scholar] [CrossRef]
- Sheehan, F.H.; Braunwald, E.; Canner, P.; Dodge, H.T.; Gore, J.; Van Natta, P.; Passamani, E.R.; Williams, D.O.; Zaret, B. The effect of intravenous thrombolytic therapy on left ventricular function: A report on tissue-type plasminogen activator and streptokinase from the Thrombolysis in Myocardial Infarction (TIMI Phase I) trial. Circulation 1987, 75, 817–829. [Google Scholar] [CrossRef] [Green Version]
- Prabhu, S.D.; Frangogiannis, N.G. The Biological Basis for Cardiac Repair After Myocardial Infarction. Circ. Res. 2016, 119, 91–112. [Google Scholar] [CrossRef]
- Liehn, E.A.; Postea, O.; Curaj, A.; Marx, N. Repair after Myocardial Infarction, between Fantasy and Reality: The Role of Chemokines. J. Am. Coll. Cardiol. 2011, 58, 2357–2362. [Google Scholar] [CrossRef] [Green Version]
- The Multicenter Postinfarction Research Group Risk Stratification and Survival after Myocardial Infarction. N. Engl. J. Med. 1983, 309, 331–336. [CrossRef]
- Curtis, J.P.; Sokol, S.I.; Wang, Y.; Rathore, S.S.; Ko, D.T.; Jadbabaie, F.; Portnay, E.L.; Marshalko, S.J.; Radford, M.J.; Krumholz, H.M. The association of left ventricular ejection fraction, mortality, and cause of death in stable outpatients with heart failure. J. Am. Coll. Cardiol. 2003, 42, 736–742. [Google Scholar] [CrossRef] [Green Version]
- Reindl, M.; Tiller, C.; Holzknecht, M.; Lechner, I.; Eisner, D.; Riepl, L.; Pamminger, M.; Henninger, B.; Mayr, A.; Schwaiger, J.P.; et al. Global longitudinal strain by feature tracking for optimized prediction of adverse remodeling after ST-elevation myocardial infarction. Clin. Res. Cardiol. 2021, 110, 61–71. [Google Scholar] [CrossRef]
- Altiok, E.; Tiemann, S.; Becker, M.; Koos, R.; Zwicker, C.; Schroeder, J.; Kraemer, N.; Schoth, F.; Adam, D.; Friedman, Z.; et al. Myocardial Deformation Imaging by Two-Dimensional Speckle-Tracking Echocardiography for Prediction of Global and Segmental Functional Changes after Acute Myocardial Infarction: A Comparison with Late Gadolinium Enhancement Cardiac Magnetic Resonance. J. Am. Soc. Echocardiogr. 2014, 27, 249–257. [Google Scholar] [CrossRef]
- Ben Driss, A.; Lepage, C.B.D.; Sfaxi, A.; Hakim, M.; Elhadad, S.; Tabet, J.Y.; Salhi, A.; Carreira, V.B.; Hattab, M.; Meurin, P.; et al. Strain predicts left ventricular functional recovery after acute myocardial infarction with systolic dysfunction. Int. J. Cardiol. 2020, 307, 1–7. [Google Scholar] [CrossRef]
- Mangion, K.; Carrick, D.; Carberry, J.; Mahrous, A.; McComb, C.; Oldroyd, K.G.; Eteiba, H.; Lindsay, M.; McEntegart, M.; Hood, S.; et al. Circumferential Strain Predicts Major Adverse Cardiovascular Events Following an Acute ST-Segment–Elevation Myocardial Infarction. Radiology 2019, 290, 329–337. [Google Scholar] [CrossRef]
- Buss, S.J.; Krautz, B.; Hofmann, N.; Sander, Y.; Rust, L.; Giusca, S.; Galuschky, C.; Seitz, S.; Giannitsis, E.; Pleger, S.; et al. Prediction of functional recovery by cardiac magnetic resonance feature tracking imaging in first time ST-elevation myocardial infarction. Comparison to infarct size and transmurality by late gadolinium enhancement. Int. J. Cardiol. 2015, 183, 162–170. [Google Scholar] [CrossRef] [Green Version]
- Torres, W.M.; Jacobs, J.; Doviak, H.; Barlow, S.C.; Zile, M.; Shazly, T.; Spinale, F.G. Regional and temporal changes in left ventricular strain and stiffness in a porcine model of myocardial infarction. Am. J. Physiol. Circ. Physiol. 2018, 315, H958–H967. [Google Scholar] [CrossRef]


| All (n = 116) | Non-LVR (n = 77) | LVR (n = 39) | p-Value | |
|---|---|---|---|---|
| Age, year | 58.22 ± 12.30 | 56.96 ± 12.95 | 60.72 ± 10.62 | 0.121 |
| Male, n (%) | 100 (86.20) | 67 (87.00) | 33(84.60) | 0.724 |
| BMI, kg/m2 | 23.52 ± 4.24 | 23.07 ± 4.87 | 24.40 ± 2.44 | 0.110 |
| Heat rate, bpm | 72.75 ± 8.57 | 72.26 ± 8.25 | 73.72 ± 9.20 | 0.389 |
| Pain to balloon time, h | 11.12 (7.13,15.20) | 10.67 (7.51,14.56) | 12.02 (5.75,16.20) | 0.916 |
| CHD risk factors, n (%) | ||||
| Smoking | 65 (56.00) | 43 (54.80) | 22 (56.40) | 0.954 |
| Hypertension | 59 (50.90) | 39 (50.60) | 20 (51.30) | 0.949 |
| Hyperlipidemia | 44 (37.9) | 29 (37.70) | 15 (38.50) | 0.933 |
| Diabetes | 53 (45.70) | 34 (44.20) | 19 (48.70) | 0.641 |
| Killip classification on admission, n (%) | 0.122 | |||
| 1 | 95 (81.90) | 67 (87.00) | 28 (71.80) | |
| 2 | 16 (13.80) | 8 (10.40) | 8 (20.50) | |
| 3–4 | 5 (4.30) | 2 (2.60) | 3 (7.70) | |
| Peak hs-cTnI, ug/L | 48.15 ± 28.08 | 38.40 ± 26.30 | 67.40 ± 20.74 | <0.001 |
| Peak pro-BNP, ng/L | 799.30 (476.00,1796.50) | 724.30 (427.35,1628.00) | 1066.00 (561.10,2400.50) | 0.168 |
| TIMI flow pre-PPCI, n (%) | 0.943 | |||
| 0 | 71 (61.20) | 46 (59.70) | 25 (64.10) | |
| 1–2 | 28 (24.20) | 19 (24.70) | 9 (23.10) | |
| 3 | 17 (14.70) | 12 (15.60) | 5 (12.80) | |
| TIMI flow post-PPCI, n (%) | 0.123 | |||
| 0–2 | 11 (9.50) | 5 (6.50) | 6 (15.40) | |
| 3 | 105 (90.5) | 72 (93.50) | 33 (84.60) | |
| Medication, n (%) | ||||
| Statin | 101 (87.10) | 66 (85.70) | 35 (89.70) | 0.541 |
| β-blocker | 110 (94.80) | 73 (94.80) | 37 (94.90) | 0.988 |
| ACEI/ARB | 54 (46.60) | 35 (45.50) | 19 (48.70) | 0.739 |
| Diuretic | 54 (46.60) | 34 (44.20) | 20 (51.30) | 0.467 |
| ARNI | 31 (26.70) | 18 (23.40) | 13 (33.30) | 0.252 |
| Nitrates | 36 (31.00) | 24 (31.20) | 12 (30.80) | 0.965 |
| All (n = 116) | Non-LVR (n = 77) | LVR (n = 39) | p-Value | |
|---|---|---|---|---|
| LVEDV, mL | 155.46 ± 32.95 | 156.15 ± 36.17 | 154.12 ± 25.79 | 0.756 |
| LVESV, mL | 83.84 ± 21.36 | 81.15 ± 22.22 | 89.15 ± 18.69 | 0.056 |
| LVEF, % | 46.32 ± 6.35 | 48.34 ± 5.87 | 42.31 ± 5.32 | <0.001 |
| GLS, % | −10.15 ± 3.13 | −11.26 ± 2.58 | −7.96 ± 2.98 | <0.001 |
| GCS, % | −14.09 ± 3.58 | −15.10 ± 3.28 | −12.08 ± 3.35 | <0.001 |
| GRS, % | 20.36 ± 5.42 | 21.03 ± 5.80 | 19.05 ± 4.38 | 0.063 |
| Peak ,% | −7.34 ± 3.88 | −8.98 ± 3.42 | −4.09 ± 2.43 | <0.001 |
| Peak ,% | −17.10 ± 3.39 | −17.00 ± 3.20 | −17.32 ± 3.78 | 0.634 |
| Peak ,% | 11.61 ± 6.52 | 14.17 ± 6.14 | 6.57 ± 3.73 | <0.001 |
| Peak ,% | 27.60 ± 7.01 | 27.78 ± 6.67 | 27.26 ± 7.73 | 0.710 |
| IS, %LVMM | 20.24 ± 8.91 | 17.30 ± 8.75 | 26.05 ± 5.91 | <0.001 |
| Parameters | Univariate Analysis | Multivariate Analysis | ||
|---|---|---|---|---|
| OR (95%CI) | p-Value | OR (95%CI) | p-Value | |
| Sex, n (%) | ||||
| Male | Reference | |||
| Female | 1.218 (0.386, 3.575) | 0.724 | ||
| Age, year | 1.026 (0.994, 1.062) | 0.122 | ||
| BMI, kg/m2 | 1.103 (0.989, 1.260) | 0.116 | ||
| HR, bpm | 1.020 (0.975, 1.069) | 0.386 | ||
| Pain to balloon time, h | 1.006 (0.949, 1.065) | 0.839 | ||
| CHD risk factors, n (%) | ||||
| Hypertension | 1.026 (0.474,2.226) | 0.949 | ||
| Hyperlipidemia | 1.034 (0.463,2.277) | 0.933 | ||
| Smoker | 1.023 (0.471,2.242) | 0.954 | ||
| Diabetes | 1.201 (0.553,2.610) | 0.641 | ||
| Killip classification on admission, n (%) | ||||
| 1 | Reference | |||
| 2 | 2.393 (0.806, 7.132) | 0.112 | ||
| 3–4 | 3.569 (0.566, 28.381) | 0.174 | ||
| TIMI flow post-PPCI | ||||
| 0–2 | 2.618 (0.739,9.678) | 0.133 | ||
| 3 | Reference | |||
| Peak pro-BNP, ng/L | 1.000 (0.999,1.000) | 0.523 | ||
| Peak hs-cTnI, ug/L | 1.045 (1.027,1.067) | <0.001 | ||
| CMR parameters | ||||
| LVEF, mL | 0.839 (0.771,0.903) | <0.001 | 0.882 (0.777, 0.990) | 0.038 |
| GLS, % | 1.634 (1.354,2.043) | <0.001 | 1.347 (1.031,1.818) | 0.039 |
| GCS, % | 1.339 (1.168,1.572) | <0.001 | ||
| GRS, % | 0.931 (0.861,1.003) | 0.062 | ||
| Peak , % | 1.873 (1.499,2.419) | <0.001 | 1.726 (1.365, 2.354) | <0.001 |
| Peak , % | 0.972 (0.865,1.090) | 0.631 | ||
| Peak , % | 0.694 (0.582,0.794) | <0.001 | ||
| Peak , % | 0.989 (0.935,1.046) | 0.707 | ||
| IS, %LVMM | 1.156 (1.090,1.241) | <0.001 | 1.098 (1.016,1.202) | 0.027 |
Publisher’s Note: MDPI stays neutral with regard to jurisdictional claims in published maps and institutional affiliations. |
© 2022 by the authors. Licensee MDPI, Basel, Switzerland. This article is an open access article distributed under the terms and conditions of the Creative Commons Attribution (CC BY) license (https://creativecommons.org/licenses/by/4.0/).
Share and Cite
Ma, W.; Li, X.; Gao, C.; Gao, Y.; Liu, Y.; Kang, S.; Pan, J. Predictive Value of Cardiac Magnetic Resonance for Left Ventricular Remodeling of Patients with Acute Anterior Myocardial Infarction. Diagnostics 2022, 12, 2780. https://doi.org/10.3390/diagnostics12112780
Ma W, Li X, Gao C, Gao Y, Liu Y, Kang S, Pan J. Predictive Value of Cardiac Magnetic Resonance for Left Ventricular Remodeling of Patients with Acute Anterior Myocardial Infarction. Diagnostics. 2022; 12(11):2780. https://doi.org/10.3390/diagnostics12112780
Chicago/Turabian StyleMa, Wenkun, Xinni Li, Chengjie Gao, Yajie Gao, Yuting Liu, Sang Kang, and Jingwei Pan. 2022. "Predictive Value of Cardiac Magnetic Resonance for Left Ventricular Remodeling of Patients with Acute Anterior Myocardial Infarction" Diagnostics 12, no. 11: 2780. https://doi.org/10.3390/diagnostics12112780