
Measurement and Modeling of the Optical Properties of Adipose Tissue in the Terahertz Range: Aspects of Disease Diagnosis
 , , , , , and
Abstract
:1. Introduction
2. Materials and Methods
2.1. Materials
2.2. Methods of Measurement
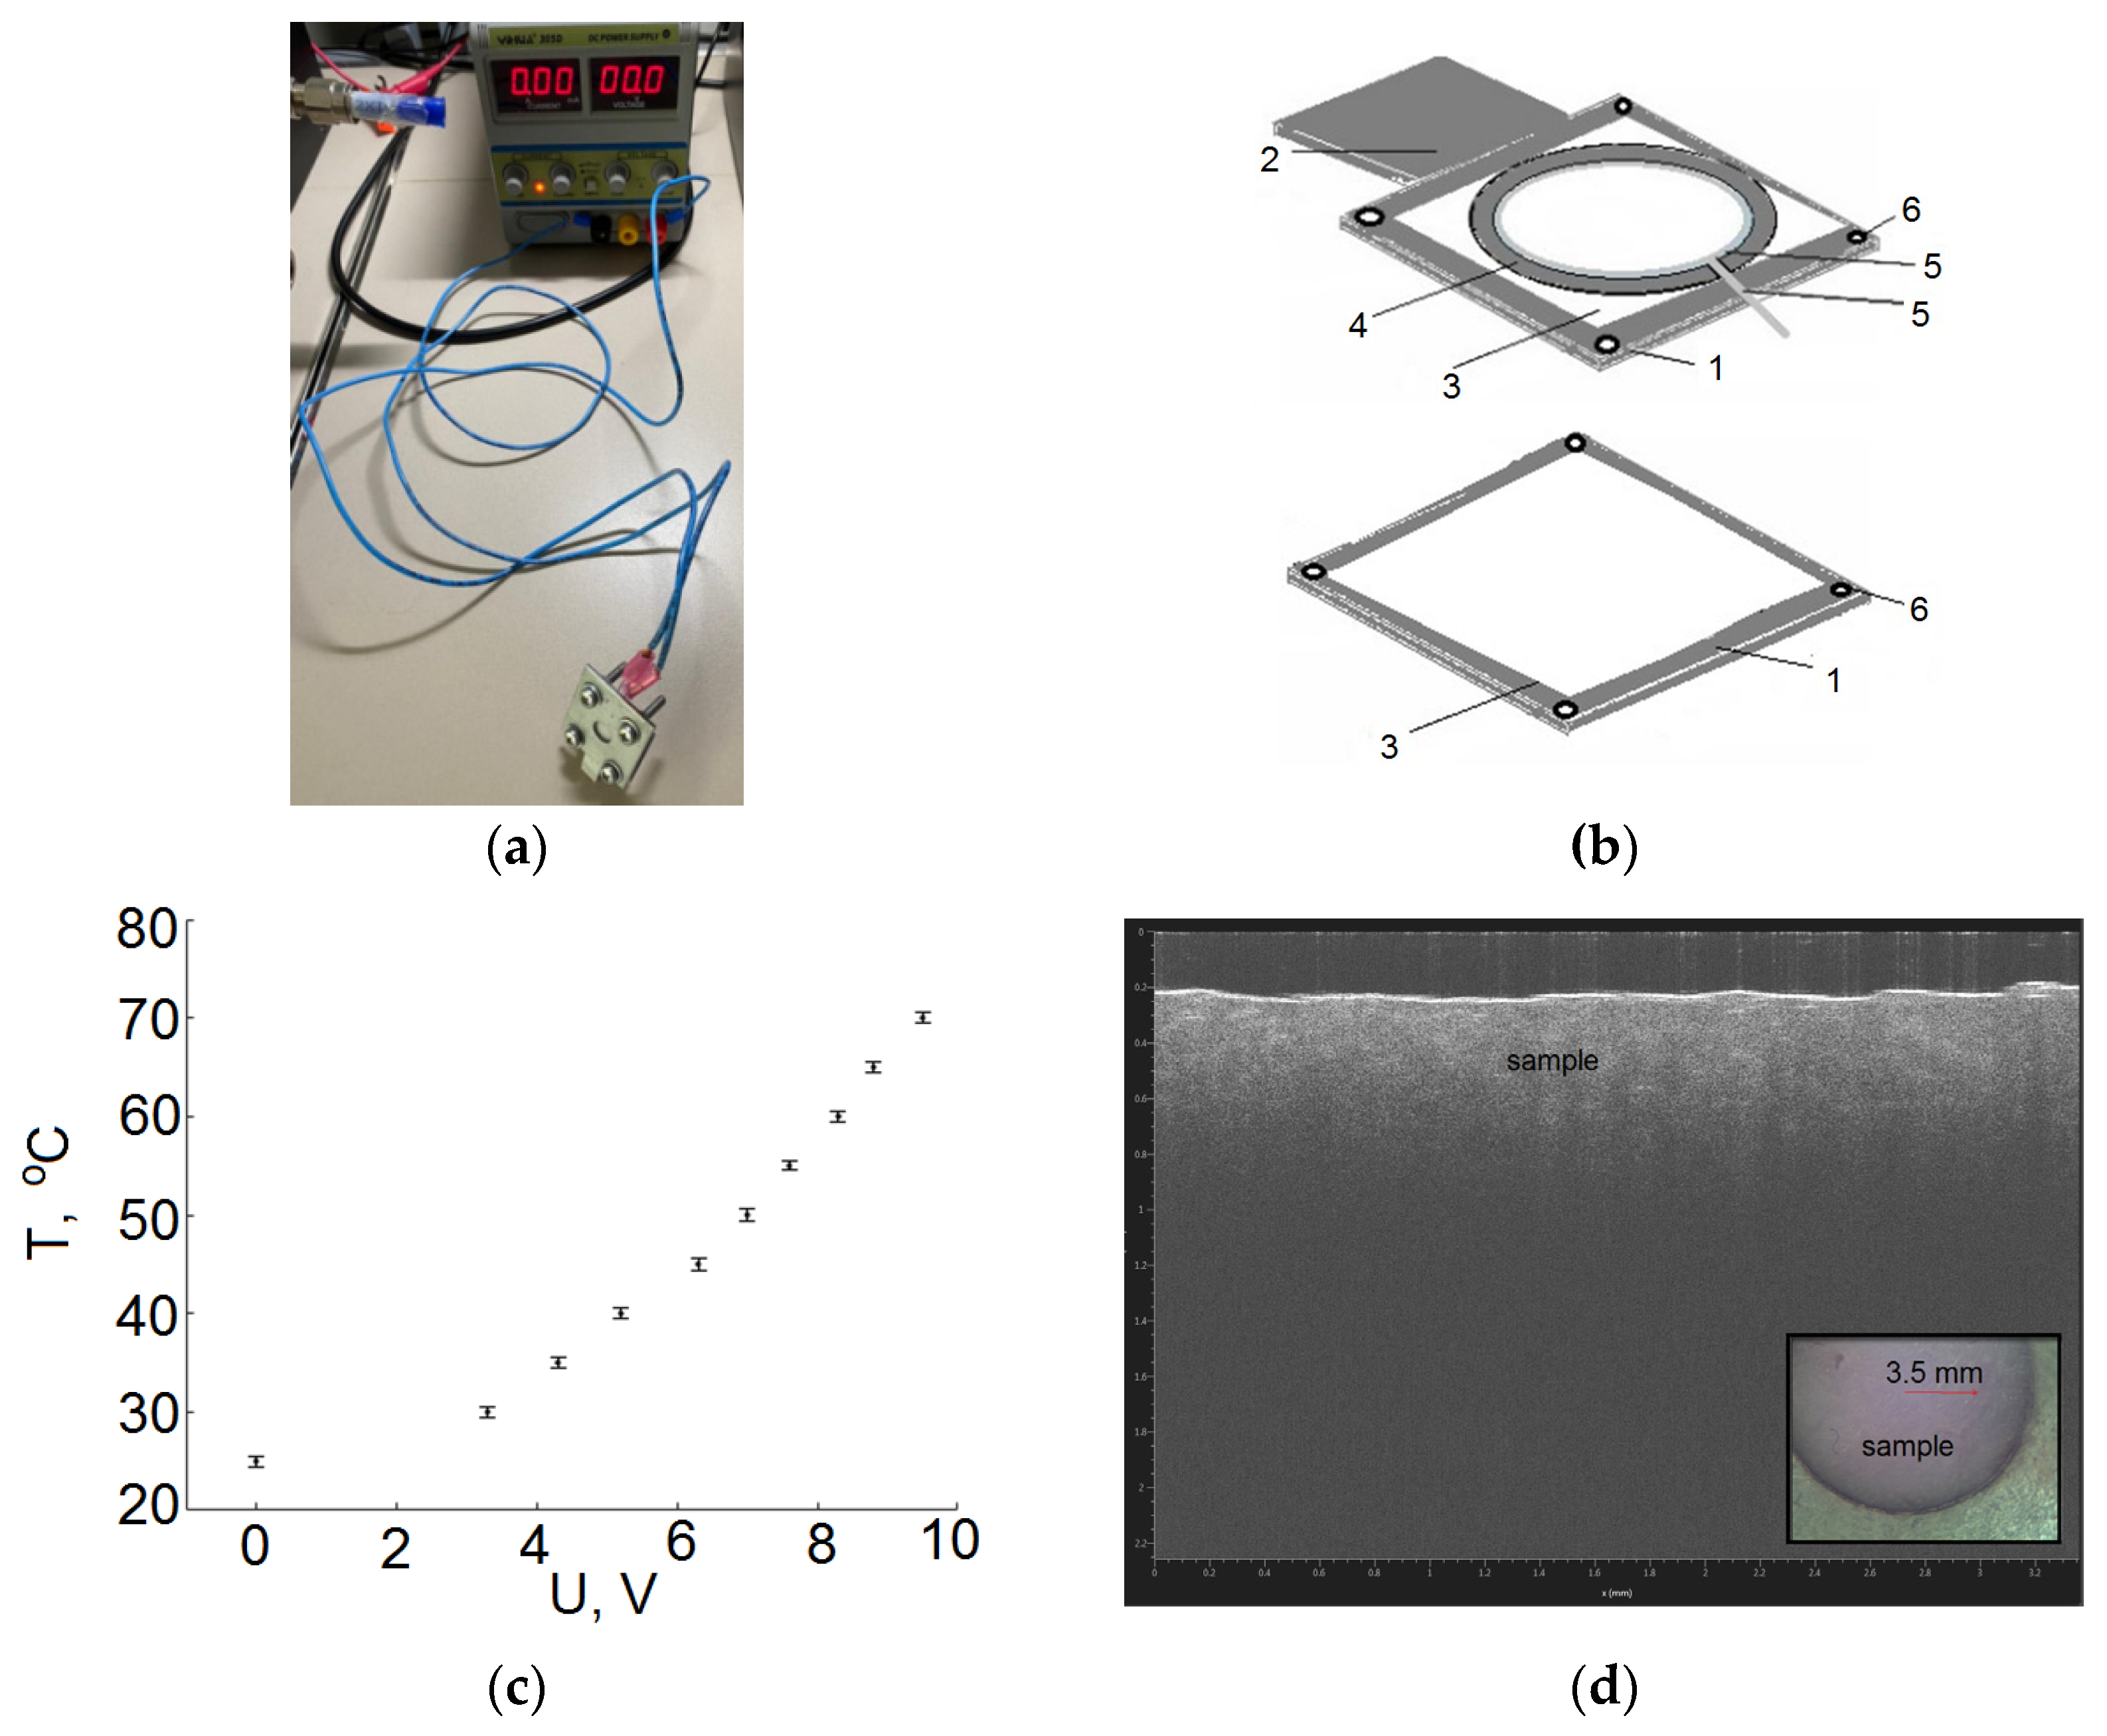
- The THz spectrum was measured at room temperature at 4 points with a vertical and horizontal step of 0.4 mm. This was performed by moving the cuvette by means of a stepper motor.
- Voltage was applied to raise the temperature by 5 °C according to the calibration curve (Figure 1c). Time was kept for more than 2 min. The THz spectrum was recorded at 4 points with a vertical and horizontal step of 0.4 mm.
- The voltage was raised, and the next temperature point was taken.
2.3. Methods of Modelling
3. Results
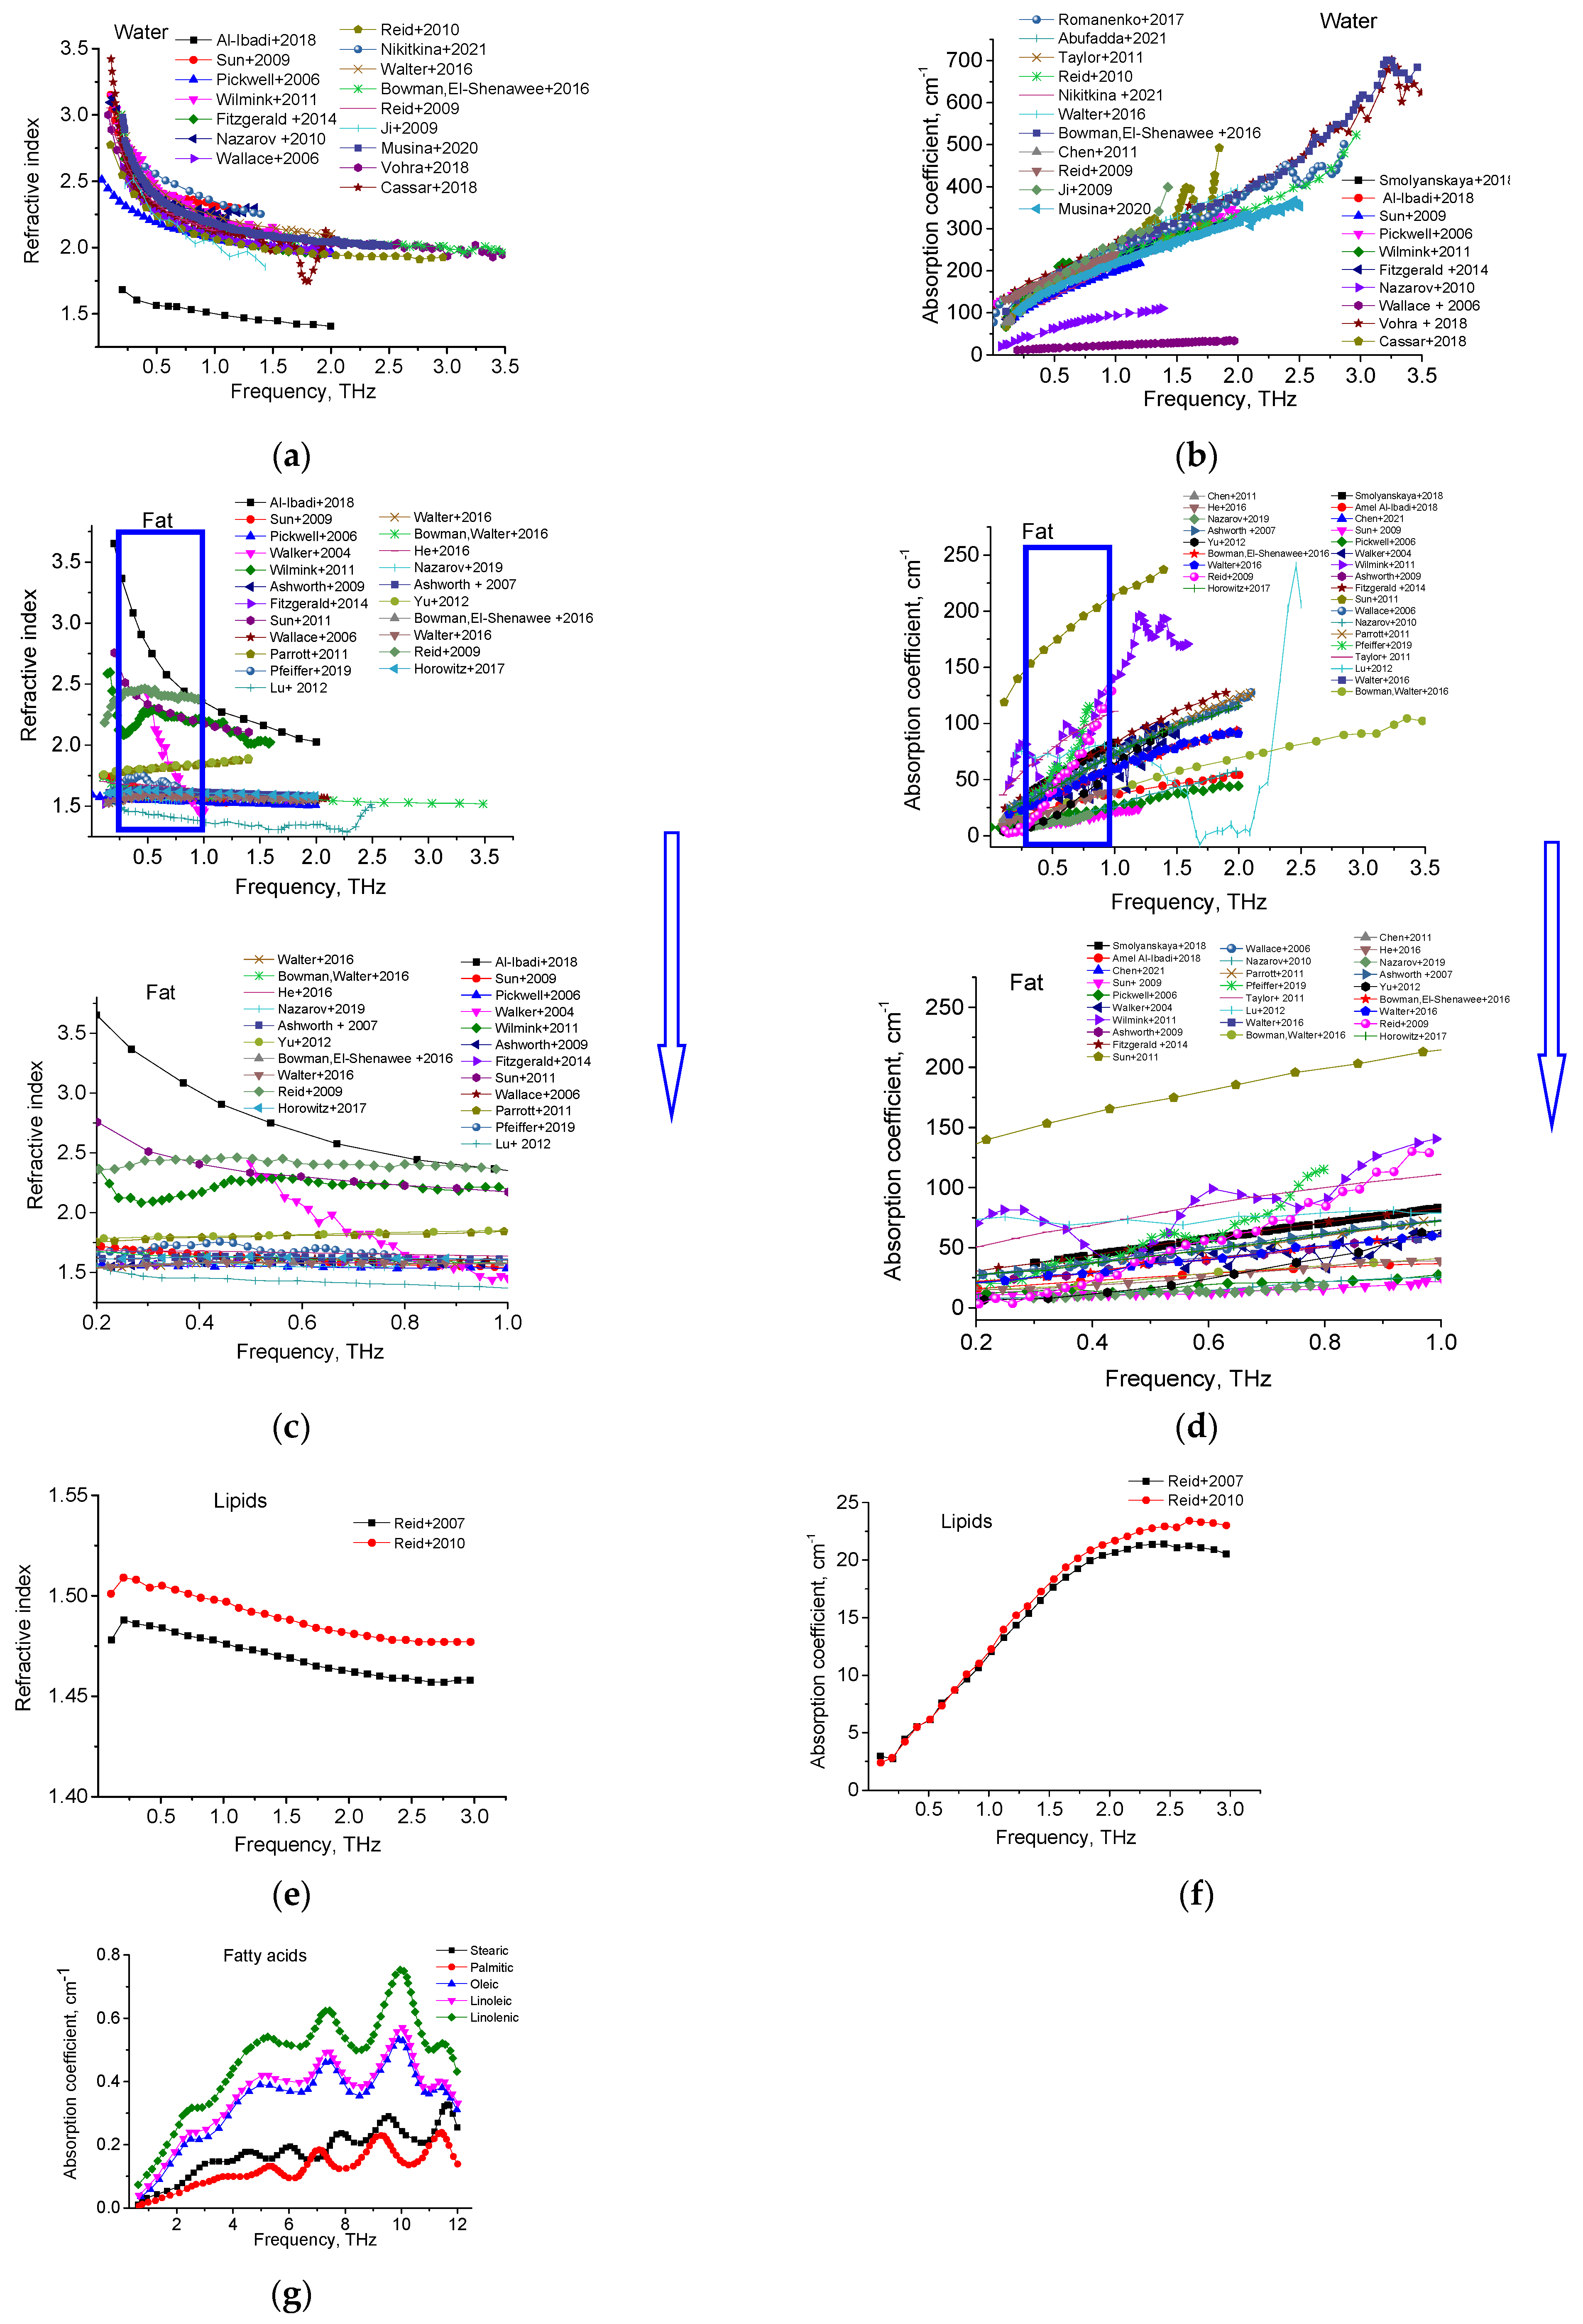
3.1. Review of the Optical Properties of Water, Lipids and Fatty Acids in the THz Range
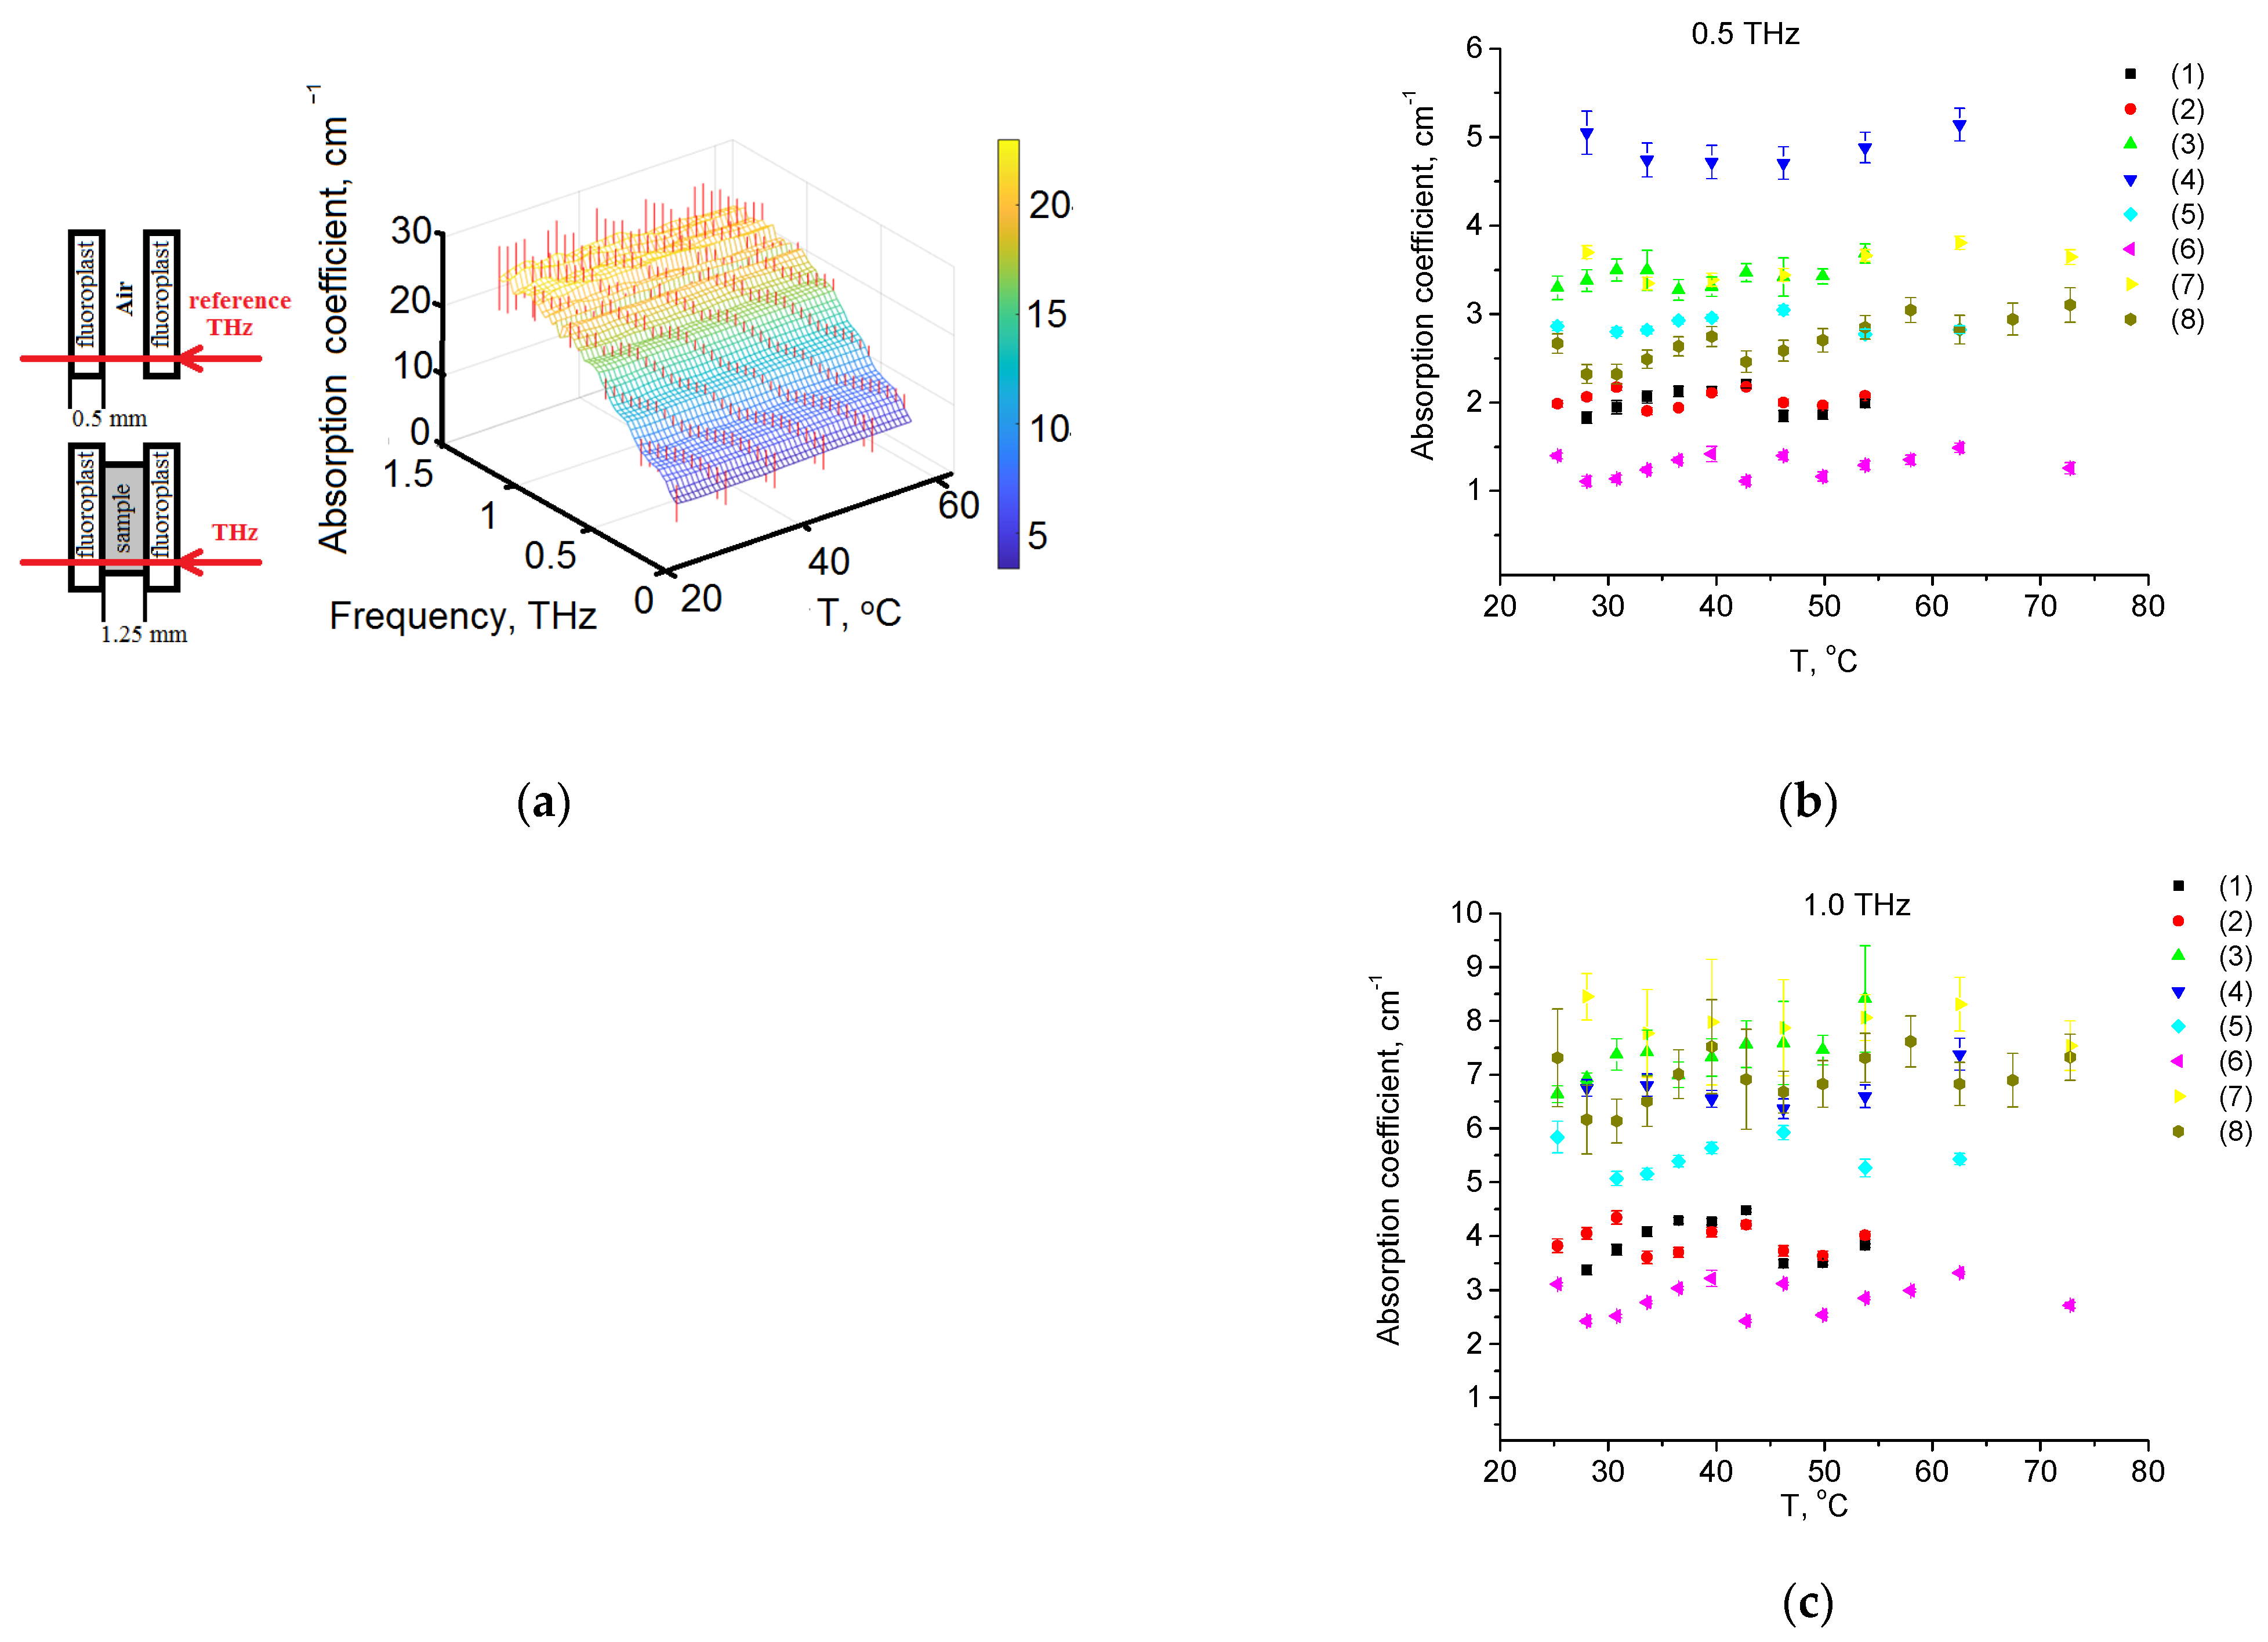
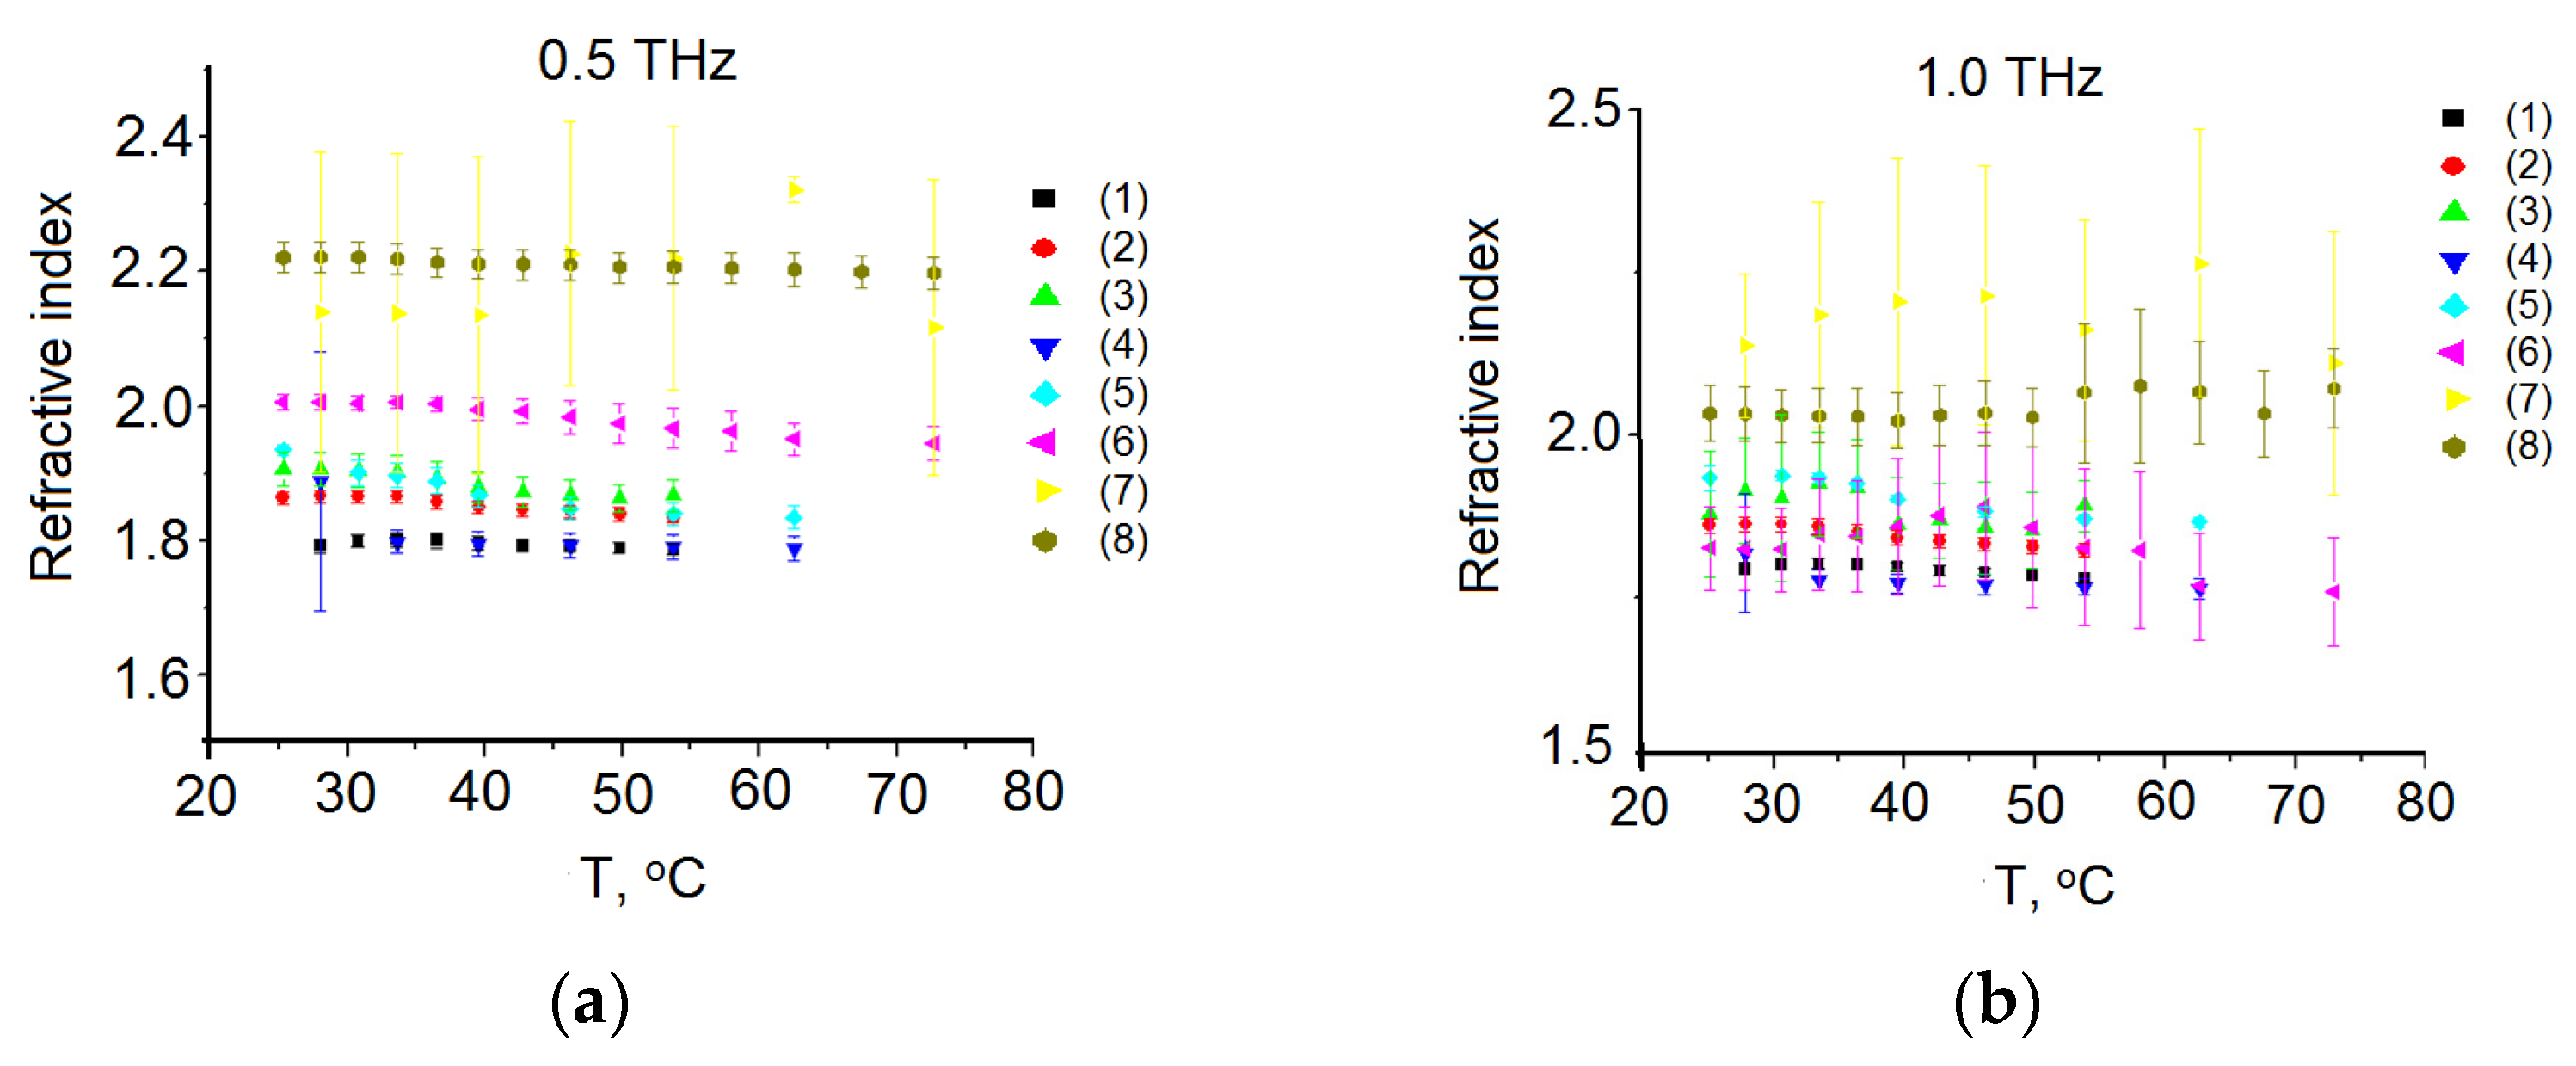
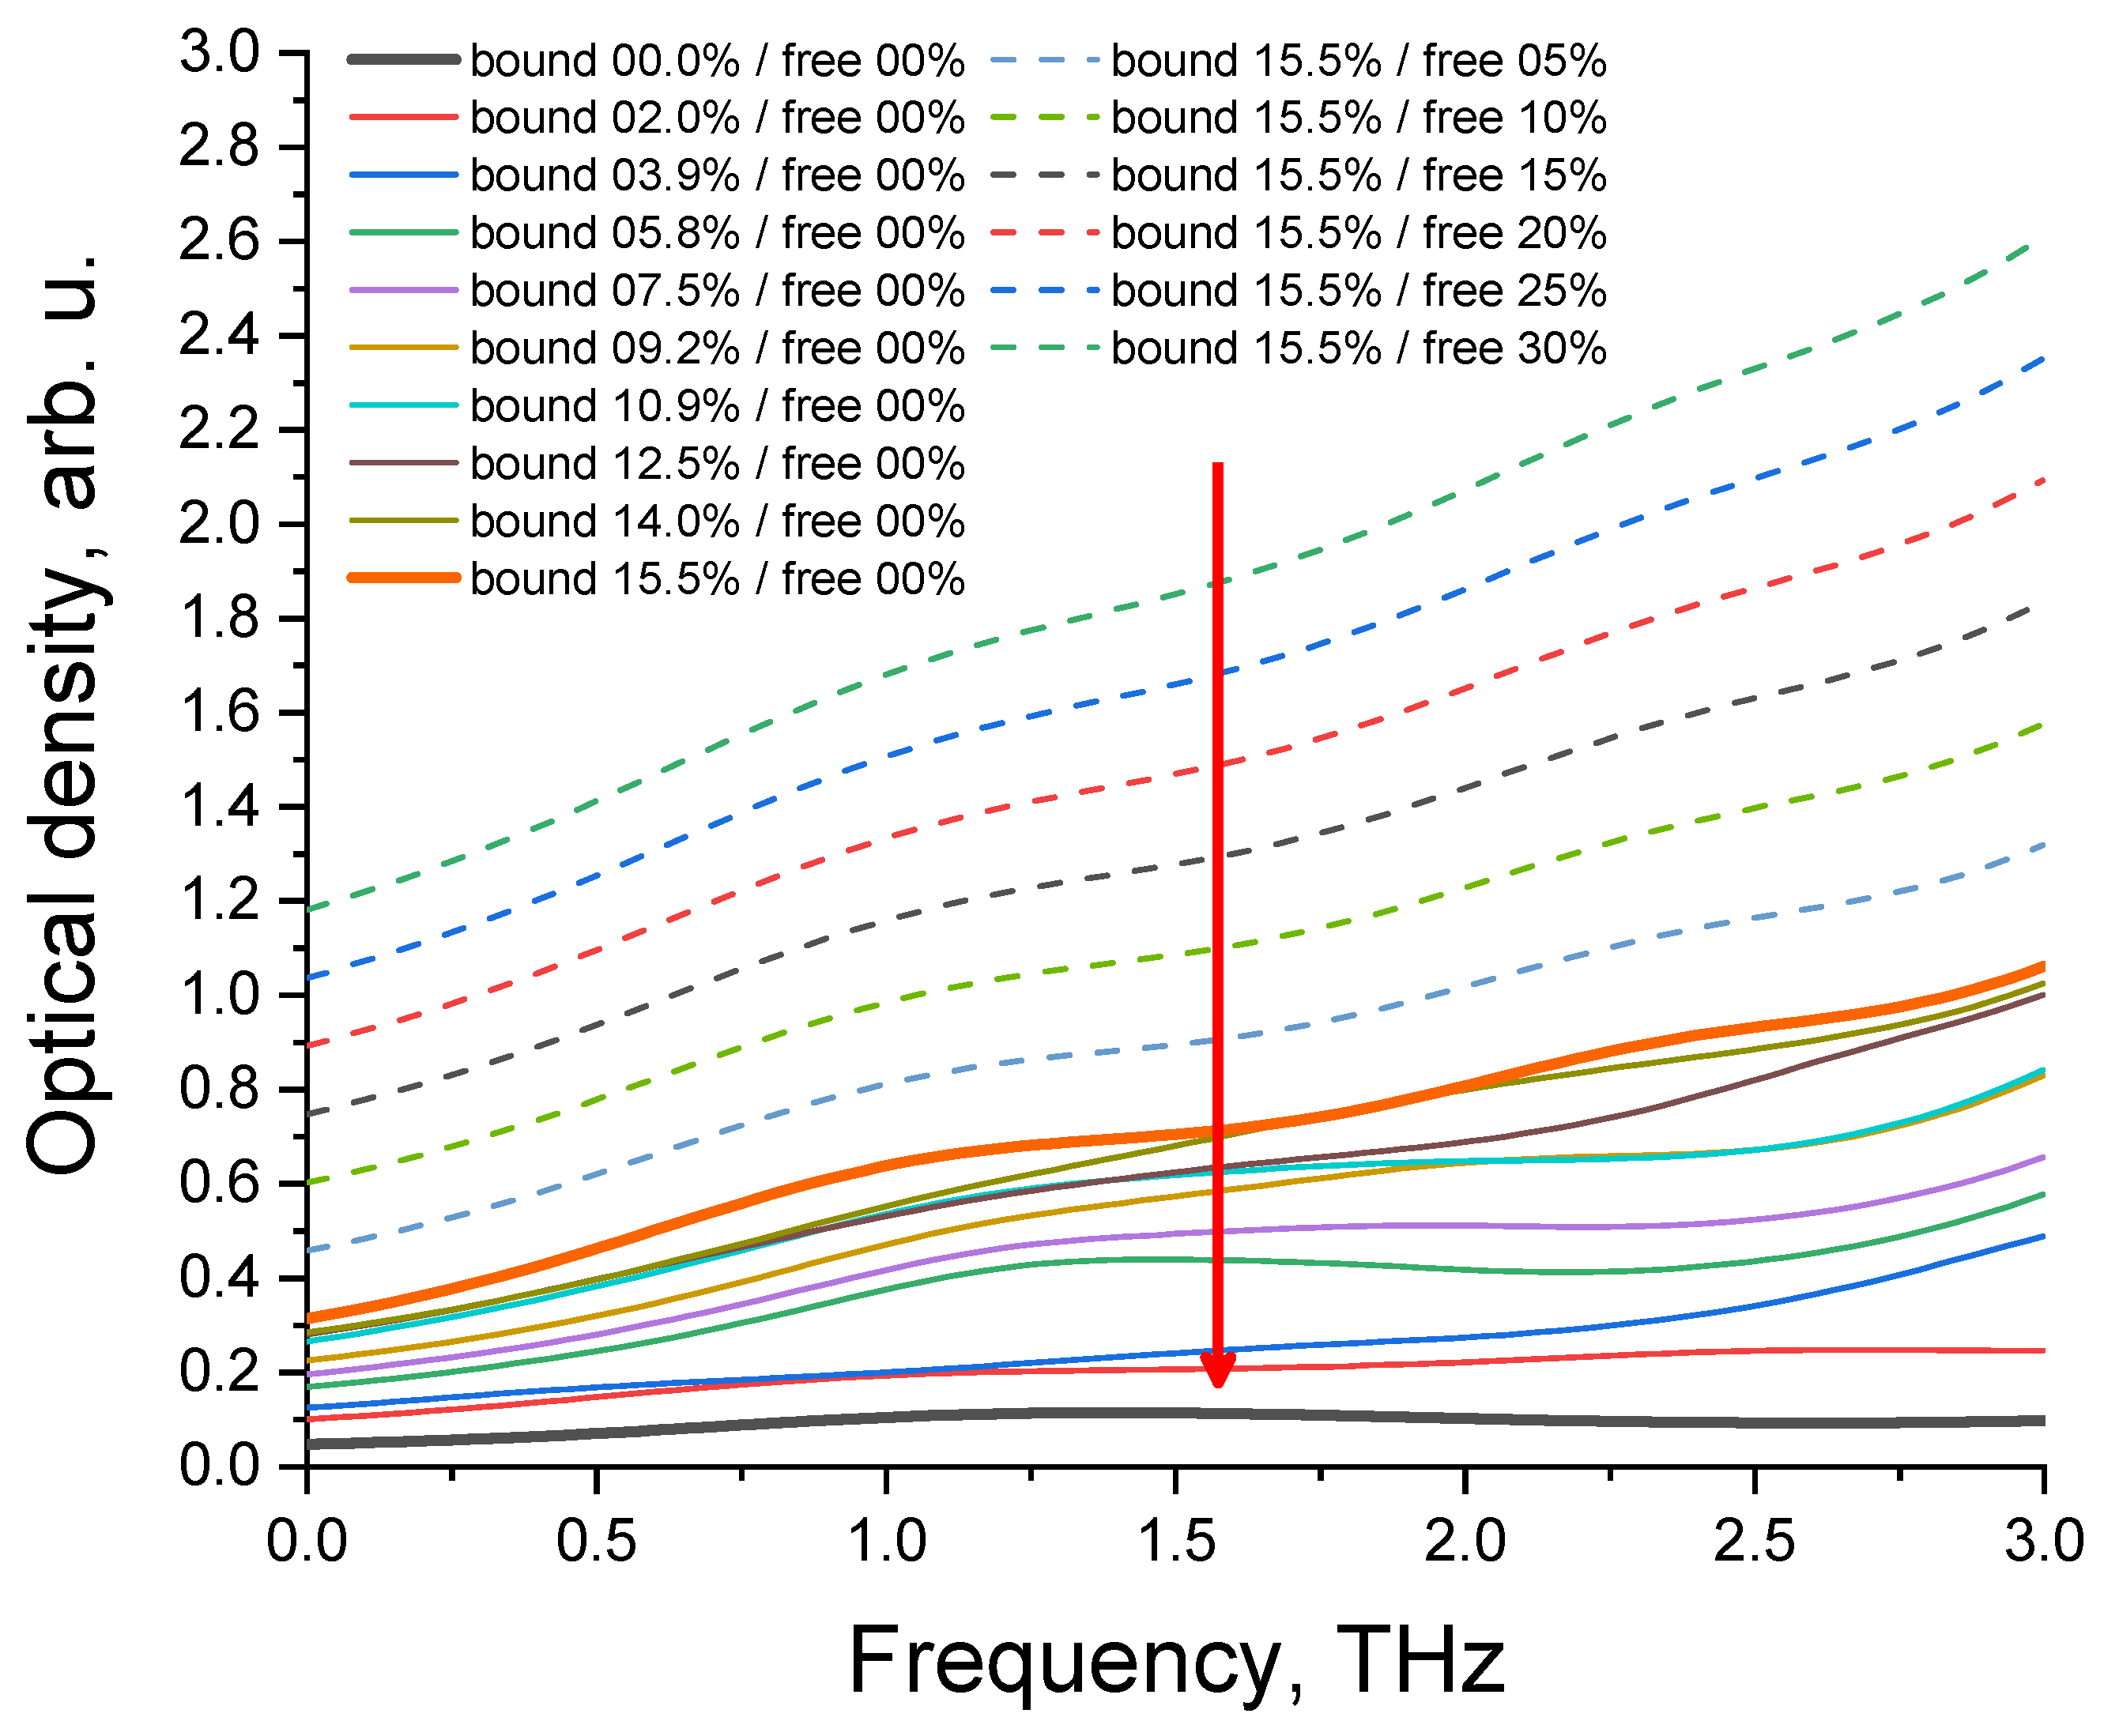
3.2. Experimental Data
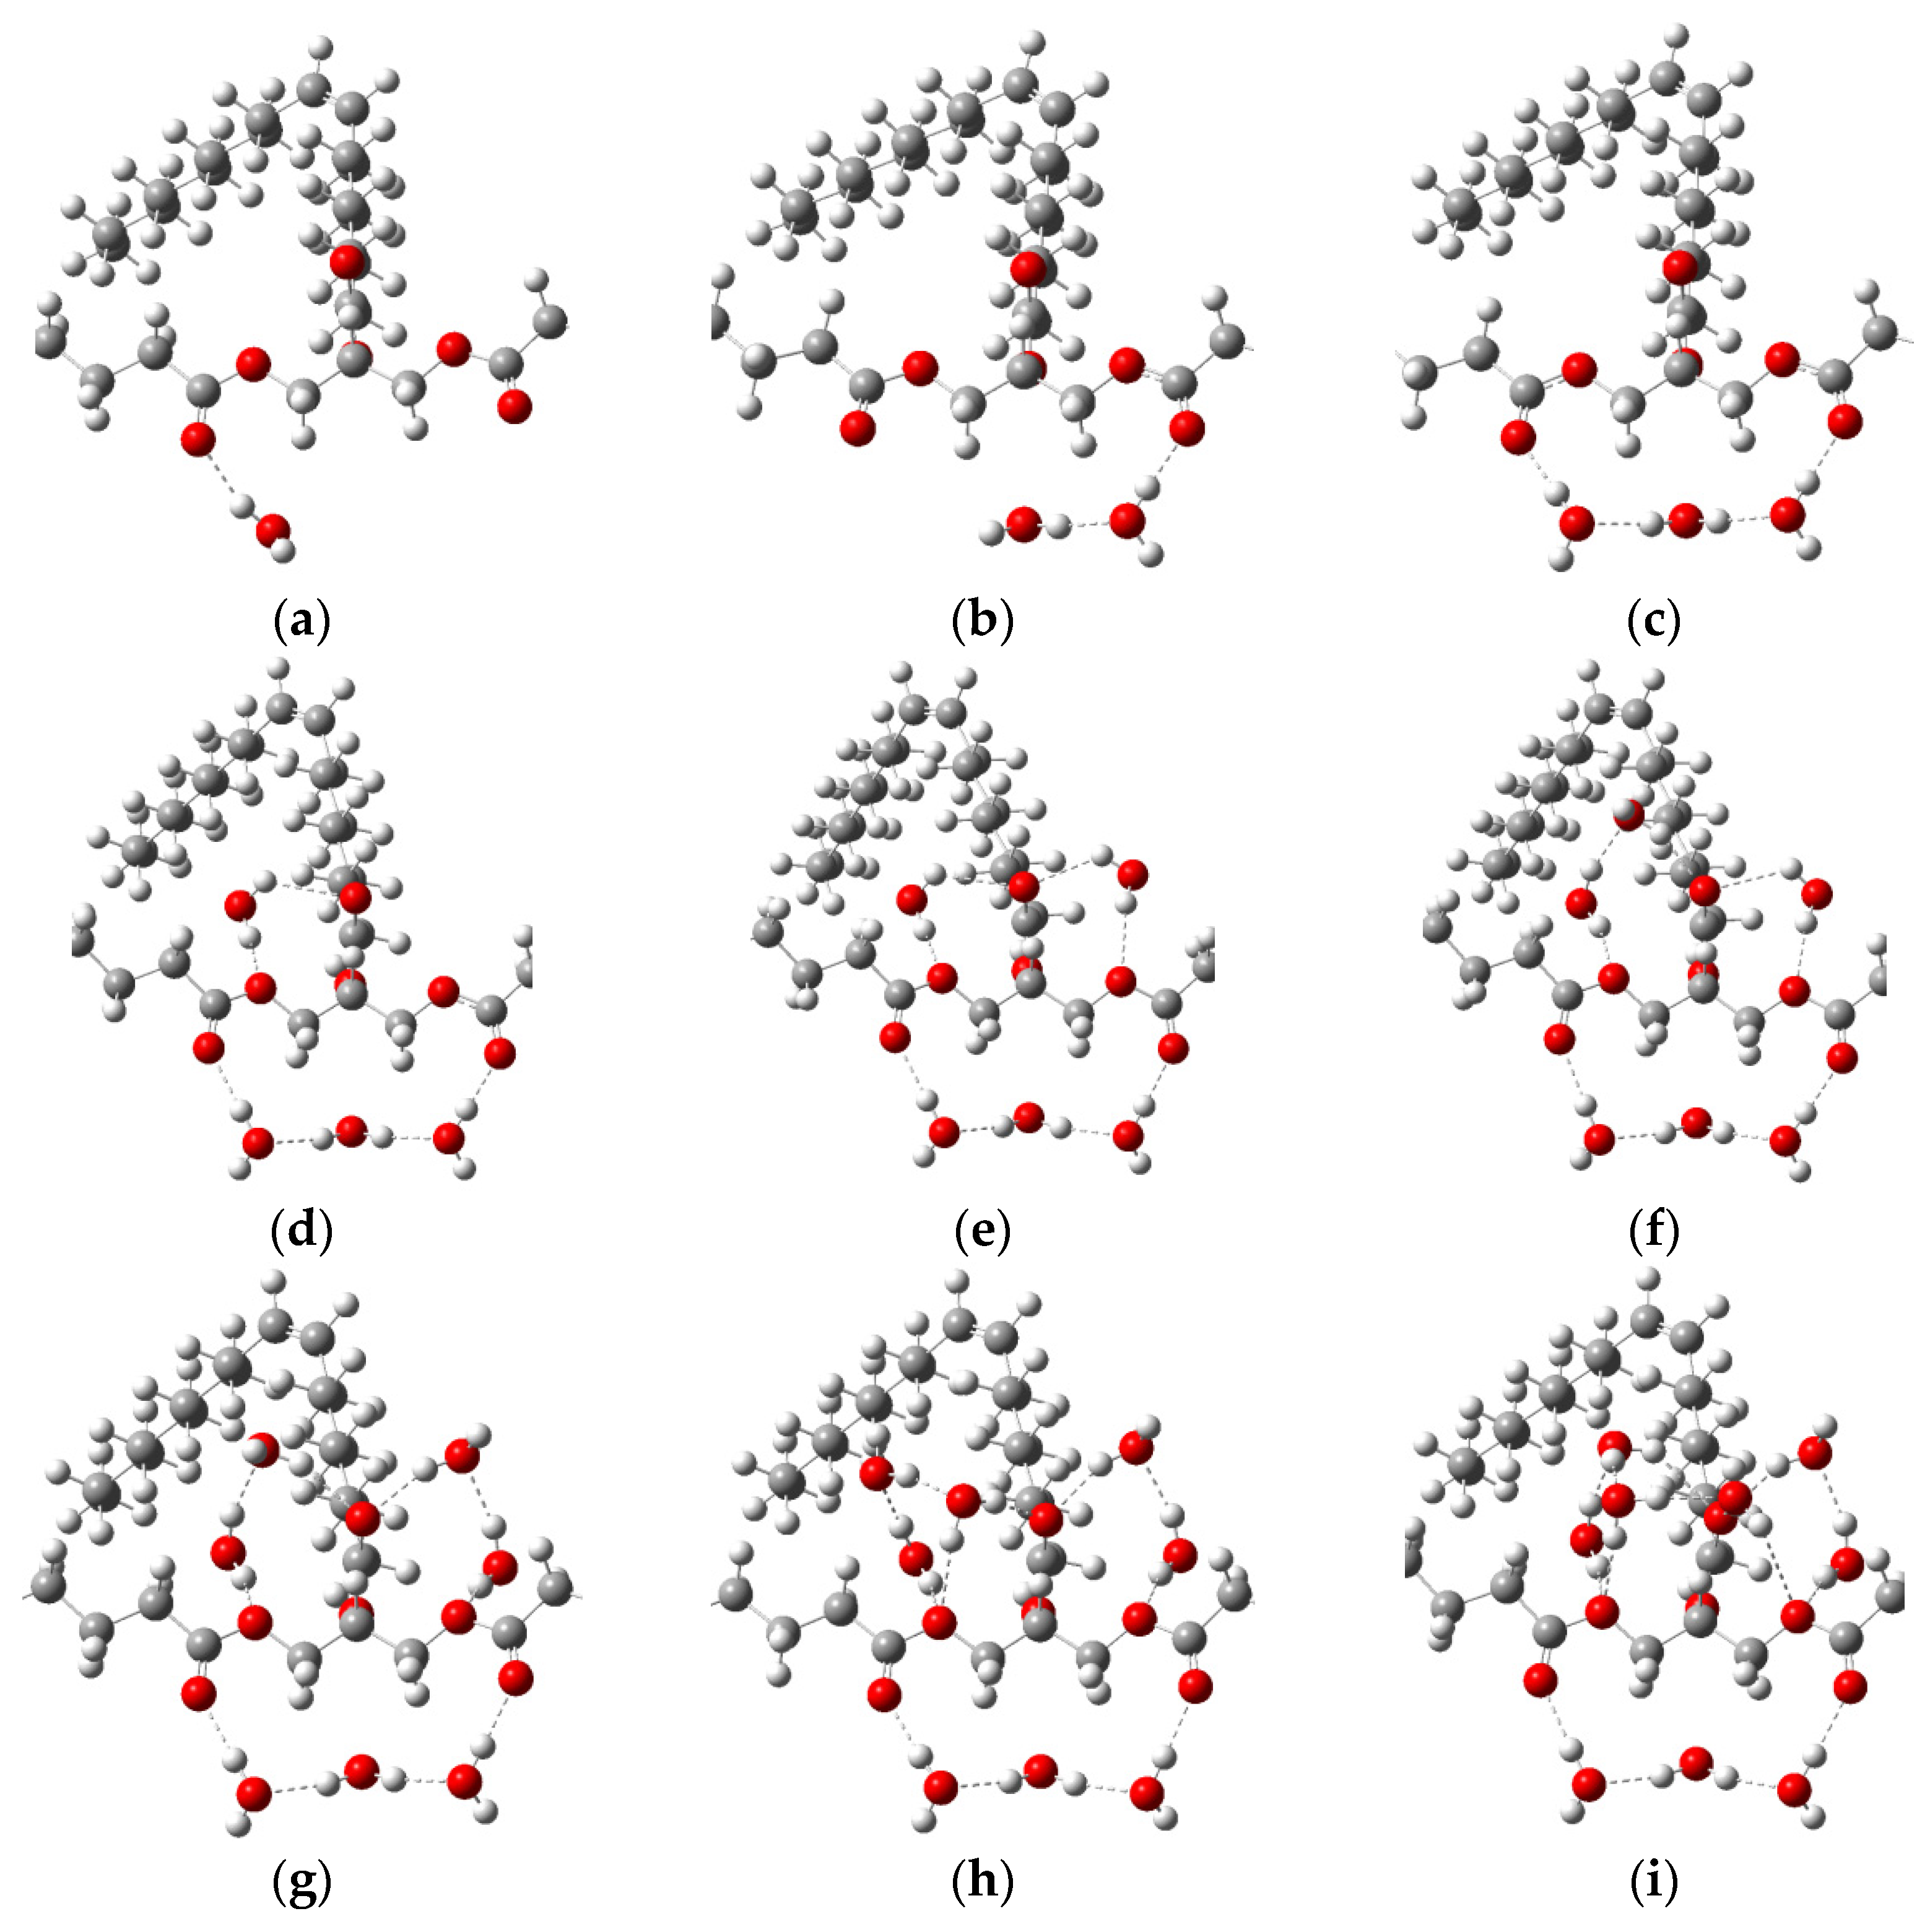
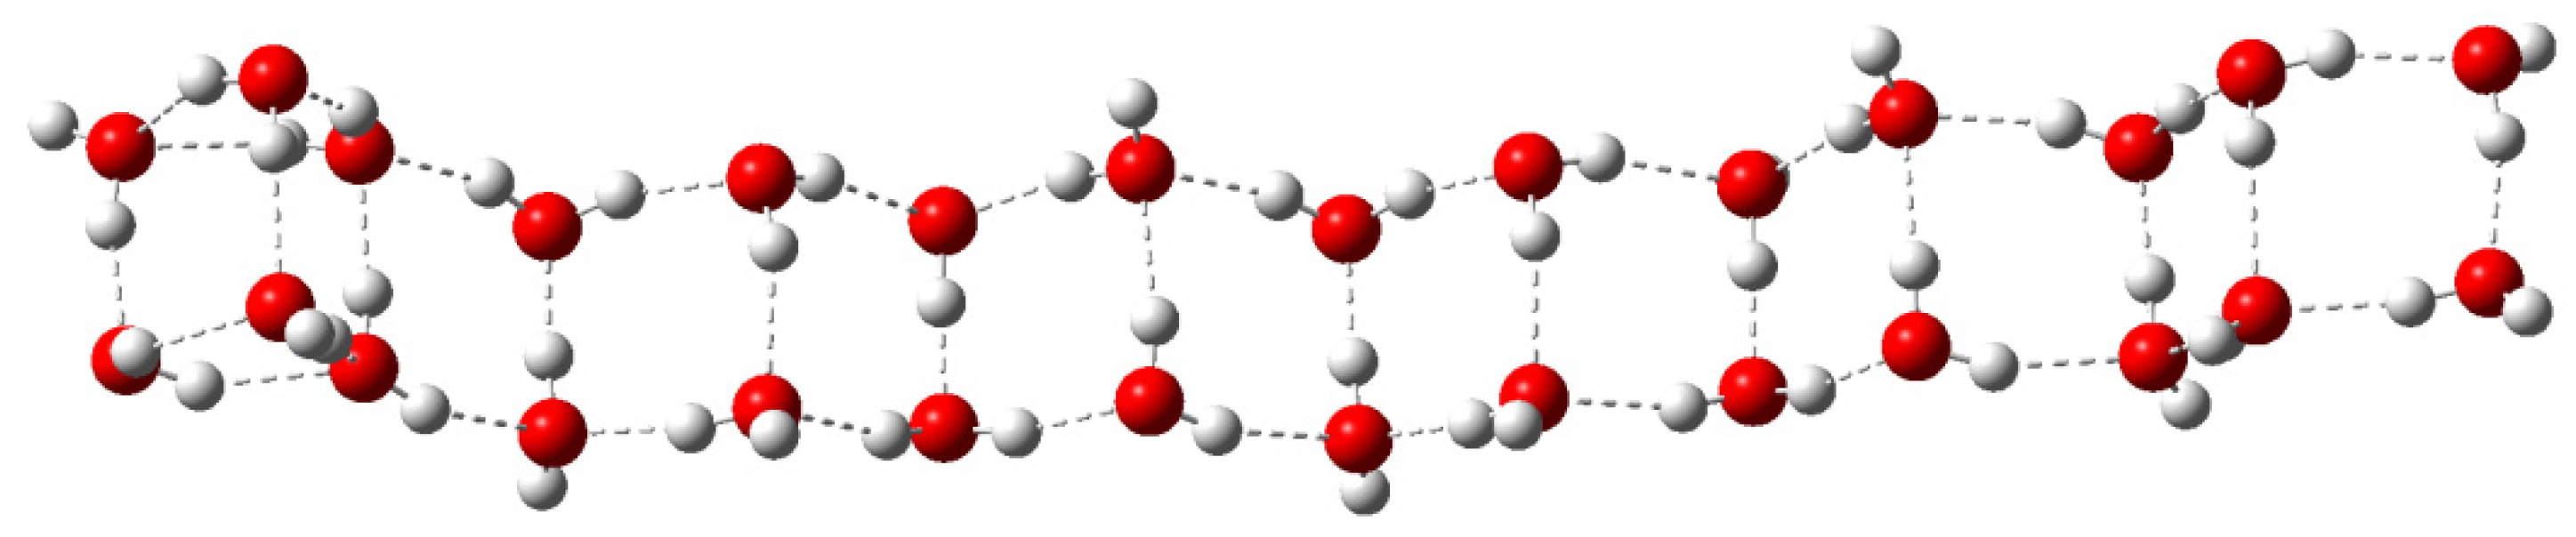
3.3. Molecular Modelling
4. Discussion
5. Conclusions
Author Contributions
Funding
Institutional Review Board Statement
Informed Consent Statement
Data Availability Statement
Conflicts of Interest
References
- Vafapour, Z.; Keshavarz, A.; Ghahraloud, H. The potential of terahertz sensing for cancer diagnosis. Heliyon 2020, 6, e05623. [Google Scholar] [CrossRef] [PubMed]
- Nikitkina, A.I.; Bikmulina, P.Y.; Gafarova, E.R.; Kosheleva, N.V.; Efremov, Y.M.; Bezrukov, E.A.; Butnaru, D.V.; Dolganova, I.N.; Chernomyrdin, N.V.; Cherkasova, O.P.; et al. Terahertz radiation and the skin: A review. J. Bio. Med. Opt. 2021, 26, 043005. [Google Scholar] [CrossRef]
- Ashworth, P.C.; Pickwell-MacPherson, E.; Provenzano, E.; Pinder, S.E.; Purushotham, A.D.; Pepper, M.; Wallace, V.P. Terahertz pulsed spectroscopy of freshly excised human breast cancer. Opt. Express 2009, 17, 12444–12454. [Google Scholar] [CrossRef] [PubMed]
- He, Y.; Ung, B.S.; Parrott, E.P.; Ahuja, A.T.; Pickwell-MacPherson, E. Freeze-thaw hysteresis effects in terahertz imaging of biomedical tissues. Biomed. Opt. Express 2016, 7, 4711–4717. [Google Scholar] [CrossRef] [PubMed] [Green Version]
- Sy, S.; Huang, S.; Wang, Y.X.; Yu, J.; Ahuja, A.T.; Zhang, Y.T.; Pickwell-Macpherson, E. Terahertz spectroscopy of liver cirrhosis: Investigating the origin of contrast. Phys. Med. Biol. 2010, 55, 7587–7596. [Google Scholar] [CrossRef] [PubMed]
- Wahaia, F.; Valusis, G.; Bernardo, L.M.; Almeida, A.; Moreira, J.A.; Lopes, P.C.; Mac Utkevic, J.; Kasalynas, I.; Seliuta, D.; Adomavicius, R.; et al. Detection of colon cancer by terahertz techniques. J. Mol. Struct. 2011, 1006, 77–82. [Google Scholar] [CrossRef]
- Lindley-Hatcher, H.; Hernandez-Serrano, A.I.; Sun, Q.; Wang, J.; Cebrian, J.; Blasco, L.; Pickwell-MacPherson, E.A. Robust Protocol for In Vivo THz Skin Measurements. J. Infrared Millim. Terahertz Waves 2019, 40, 980–989. [Google Scholar] [CrossRef] [Green Version]
- Amini, T.; Jahangiri, F.; Ameri, Z.; Hemmatian, M.A. A Review of Feasible Applications of THz Waves in Medical Diagnostics and Treatments. J. Lasers Med. Sci. 2021, 12, e92. [Google Scholar] [CrossRef] [PubMed]
- Reid, C.B.; Fitzgerald, A.; Reese, G.; Goldin, R.; Tekkis, P.; O’Kelly, P.S.; Pickwell-MacPherson, E.; Gibson, A.P.; Wallace, V.P. Terahertz pulsed imaging of freshly excised human colonic tissues. Phys. Med. Biol. 2011, 56, 4333–4353. [Google Scholar] [CrossRef] [PubMed] [Green Version]
- Fitzgerald, A.J.; Berry, E.; Zinovev, N.N.; Walker, G.C.; Smith, M.A.; Chamberlain, J.M. An introduction to medical imaging with coherent terahertz frequency radiation. Phys. Med. Biol. 2002, 47, R67–R84. [Google Scholar] [CrossRef]
- Fitzgerald, A.; Pickwell, E.; Wallace, V.; Purushotham, A.; Pinder, S.; Linan, M.; Pye, R.; Ha, T. Medical applications of broadband terahertz pulsed radiation. In 2005 IEEE LEOS Annual Meeting Conference Proceedings; IEEE: Sydney, NSW, Australia, 2005; pp. 120–121. [Google Scholar]
- Ji, Y.B.; Oh, S.J.; Kang, S.G.; Heo, J.; Kim, S.H.; Choi, Y.; Song, S.; Son, H.Y.; Kim, S.H.; Lee, J.H.; et al. Terahertz reflectometry imaging for low and high grade gliomas. Sci. Rep. 2016, 6, 36040. [Google Scholar] [CrossRef] [PubMed] [Green Version]
- Berrier, A.; Schaafsma, M.C.; Nonglaton, G.; Bergquist, J.; Rivas, J.G. Selective detection of bacterial layers with terahertz plasmonic antennas. BioMed. Opt. Express 2012, 3, 2937–2949. [Google Scholar] [CrossRef] [PubMed] [Green Version]
- Peng, Y.; Shi, C.; Wu, X.; Zhu, Y.; Zhuang, S. Terahertz Imaging and Spectroscopy in Cancer Diagnostics: A Technical Review. BME Front. 2020, 2020, 2547609. [Google Scholar] [CrossRef]
- Li, T.; Ma, H.; Peng, Y.; Chen, X.; Zhu, Z.; Wu, X.; Kou, T.; Song, B.; Guo, S.; Liu, L.; et al. Gaussian numerical analysis and terahertz spectroscopic measurement of homocysteine. BioMed. Opt. Express 2018, 9, 5467–5476. [Google Scholar] [CrossRef]
- Zaytsev, K.I.; Dolganova, I.N.; Karasik, V.E.; Kurlov, V.N.; Reshetov, I.V.; Tuchin, V.V.; Beshplav, S.-I.T.; Potapov, A.A. Terahertz Spectroscopy and Imaging of Brain Tumors. In Multimodal Optical Diagnostics of Cancer, 1st ed.; Tuchin, V.V., Popp, J., Zakharov, V., Eds.; Springer: Cham, Switzerland, 2020; pp. 551–574. [Google Scholar]
- Zou, Y.; Li, J.; Cui, Y.; Tang, P.; Du, L.; Chen, T.; Meng, K.; Liu, Q.; Feng, H.; Zhao, J.; et al. Terahertz spectroscopic diagnosis of myelin deficitbrain in mice and rhesus monkey with chemometric techniques. Sci. Rep. 2017, 7, 5176. [Google Scholar] [CrossRef]
- Yaroslavsky, A.N.; Feng, X.; Neel, V.A. Polarization Optical Imaging of Skin Pathology and Ageing. In Imaging in Dermatology; Hamblin, M.R., Avci, P., Gupta, G.K., Eds.; Elsevier/Academic Press: Amsterdam, Netherlands, 2016; Chapter 22; pp. 291–325. [Google Scholar]
- Joseph, C.; Patel, R.; Neel, V.; Giles, R.; Yaroslavsky, A. Imaging of ex vivo nonmelanoma skin cancers in the optical and terahertz spectral regions Optical and terahertz skin cancers imaging. J. Biophotonics 2014, 7, 295–303. [Google Scholar] [CrossRef]
- Doradla, P.; Alavi, K.; Joseph, C.; Giles, R. Detection of colon cancer by continuous-wave terahertz polarization imaging technique. J. Biomed. Opt. 2013, 18, 090504. [Google Scholar] [CrossRef] [Green Version]
- Gniadecka, M.; Nielsen, O.F.; Wulf, H.C. Water content and structure in malignant and benign skin tumours. J. Mol. Struct. 2003, 661, 405–410. [Google Scholar] [CrossRef]
- Ross, K.F.A.; Gordon, R.E. Water in malignant tissue, measured by cell refractometry and nuclear magnetic resonance. J. Microsc. 1982, 128, 7–21. [Google Scholar] [CrossRef] [PubMed]
- Wallace, V.P.; Fitzgerald, A.J.; Pickwell, E.; Pye, R.J.; Taday, P.F.; Flanagan, N.; Ha, T. Terahertz pulsed spectroscopy of human Basal cell carcinoma. Appl. Spectrosc. 2006, 60, 1127–1133. [Google Scholar] [CrossRef]
- Karampinos, D.C.; Baum, T.; Nardo, L.; Alizai, H.; Yu, H.; Carballido-Gamio, J.; Yap, S.P.; Shimakawa, A.; Link, T.M.; Majumdar, S. Characterization of the regional distribution of skeletal muscle adipose tissue in type 2 diabetes using chemical shift-based water/fat separation. J. Magn. Reson. Imaging 2012, 35, 899–907. [Google Scholar] [CrossRef] [PubMed] [Green Version]
- Shen, J.; Baum, T.; Cordes, C.; Ott, B.; Skurk, T.; Kooijman, H.; Rummeny, E.J.; Hauner, H.; Menze, B.H.; Karampinos, D.C. Automatic segmentation of abdominal organs and adipose tissue compartments in water-fat MRI: Application to weight-loss in obesity. Eur. J. Radiol. 2016, 85, 1613–1621. [Google Scholar] [CrossRef] [PubMed]
- Moraes, J.A.; Encarnação, C.; Franco, V.A.; Xavier Botelho, L.G.; Rodrigues, G.P.; Ramos-Andrade, I.; Barja-Fidalgo, C.; Renovato-Martins, M. Adipose Tissue-Derived Extracellular Vesicles and the Tumor Microenvironment: Revisiting the Hallmarks of Cancer. Cancers 2021, 13, 3328. [Google Scholar] [CrossRef] [PubMed]
- Hausberger, F.X. Pathological changes in adipose tissue of obese mice. Anat. Rec. 1966, 154, 651–660. [Google Scholar] [CrossRef] [PubMed]
- Bertevello, P.S.; Seelaender, M.C. Heterogeneous response of adipose tissue to cancer cachexia. Braz. J. Med. Biol. Res. 2001, 34, 1161–1167. [Google Scholar] [CrossRef] [PubMed] [Green Version]
- Thaiss, W.M.; Gatidis, S.; Sartorius, T.; Machann, J.; Peter, A.; Eigentler, T.K.; Nikolaou, K.; Pichler, B.J.; Kneilling, M. Noninvasive, longitudinal imaging-based analysis of body adipose tissue and water composition in a melanoma mouse model and in immune checkpoint inhibitor-treated metastatic melanoma patients. Cancer. Immunol. Immunother. 2021, 70, 1263–1275. [Google Scholar] [CrossRef] [PubMed]
- Wang, L. Terahertz Imaging for Breast Cancer Detection. Sensors 2021, 21, 6465. [Google Scholar] [CrossRef]
- El-Shenawee, M.; Vohra, N.; Bowman, T.; Bailey, K. Cancer Detection in Excised Breast Tumors Using Terahertz Imaging and Spectroscopy. BioMed. Spectrosc. Imaging 2019, 8, 1–9. [Google Scholar] [CrossRef] [PubMed] [Green Version]
- Hu, Y.; Guo, L.; Wang, X.; Zhang, X.C. Thz time-domain spectroscopy on plant oils and animal fats. Proc. SPIE 2005, 5640, 334–340. [Google Scholar]
- Gorenflo, S.; Tauer, U.; Hinkov, I.; Lambrecht, A.; Buchner, R.; Helm, H. Dielectric properties of oil-water complexes using terahertz transmission spectroscopy. Chem. Phys. Lett. 2006, 421, 494–498. [Google Scholar] [CrossRef]
- Nazarov, M.M.; Shkurinov, A.P.; Kuleshov, E.A.; Tuchin, V.V. Terahertz pulsed spectroscopy of biological tissues. QuantumElectr. 2008, 38, 647–654. [Google Scholar]
- Karaliūnas, M.; Nasser, K.E.; Urbanowicz, A.; Kašalynas, I.; Bražinskienė, D.; Asadauskas, S.; Valušis, G. Non-destructive inspection of food and technical oils by terahertz spectroscopy. Sci. Rep. 2018, 8, 18025. [Google Scholar] [CrossRef]
- Sun, Y.; Sy, M.Y.; Wang, J.Y.-X.; Ahuja, A.T.; Zhang, Y.-T.; Pickwell-Mac Pherson, E. A promising diagnostic method: Terahertz pulsed imaging and spectroscopy. World. J. Radiol. 2011, 3, 55–65. [Google Scholar] [CrossRef] [PubMed]
- Choe, C.; Lademann, J.; Darvin, M.E. Depth profiles of hydrogen bound water molecule types and their relation to lipid and protein interaction in the human stratum corneum in vivo. Analyst 2016, 141, 6329–6337. [Google Scholar] [CrossRef] [PubMed]
- Li, C.; Jiang, J.; Xu, K. The variations of water in human tissue under certain compression: Studied with diffuse reflectance spectroscopy. J. Innov. Opt. Health Sci. 2013, 6, 1350005. [Google Scholar] [CrossRef] [Green Version]
- Bashkatov, A.N.; Genina, E.A.; Tuchin, V.V. Optical properties of skin, subcutaneous and muscle tissues, a review. J. Innov. Opt. Health Sci. 2011, 14, 938. [Google Scholar] [CrossRef]
- Troy, T.L.; Thennadil, S.N. Optical properties of human skin in the NIR wavelength range of 1000–2200 nm. J. Biomed. Opt. 2001, 6, 167176. [Google Scholar] [CrossRef]
- Sdobnov, A.Y.; Darvin, M.E.; Schleusener, J.; Lademann, J.; Tuchin, V.V. Hydrogen bound water profiles in the skin influenced by optical clearing molecular agents– quantitative analysis using confocal Raman microscopy. J. Biophotonics 2019, 12, e201800283. [Google Scholar] [CrossRef] [Green Version]
- Bouwstra, J.A.; de Graaff, A.; Gooris, G.S.; Nijsse, J.; Wiechers, J.W.; van Aelst, A.C. Water distribution and related morphology in human stratum corneum at different hydration levels. J. Investig. Dermatol. 2003, 120, 750–758. [Google Scholar] [CrossRef] [Green Version]
- Albright, A.L.; Stern, J.S. Adipose tissue. In Encyclopedia of Sports Medicine and Science; Fahey, T.D., Ed.; Internet Society for Sport Science, 1998; Available online: http://sportsci.org (accessed on 10 June 2022).
- Wang, J.; Pierson, R.N., Jr. Disparate Hydration of Adipose and Lean Tissue Require a New Model for Body Water Distribution in Man. J. Nutr. 1976, 106, 1687–1693. [Google Scholar] [CrossRef]
- Janssens, M.; van Smeden, J.; Puppels, G.; Lavrijsen, A.; Caspers, P.; Bouwstra, J. Lipid to protein ratio plays an important role in the skin barrier function in patients with atopic eczema. Br. J. Dermatol. 2014, 170, 1248–1255. [Google Scholar] [CrossRef] [PubMed]
- Guo, L.; Wang, X.; Han, P.; Sun, W.; Feng, S.; Ye, J.; Zhang, Y. Observation of dehydration dynamics in biological tissues with terahertz digital holography [Invited]. Appl. Opt. 2017, 56, F173–F178. [Google Scholar] [CrossRef]
- Labanowski, J.K.; Andzelm, J.W. Density Functional Methods in Chemistry, 1st ed.; Springer-Verlag: New York, NY, USA, 1991; 443p. [Google Scholar]
- Turk, S.N.; Smith, S.B. Carcass fatty acid mapping. Meat. Sci. 2009, 81, 658. [Google Scholar] [CrossRef] [PubMed]
- Frisch, M.J.; Trucks, G.W.; Schlegel, H.B.; Scuseria, G.E.; Robb, M.A.; Cheeseman, J.R.; Montgomery, J.A., Jr.; Vreven, T.; Kudin, K.N.; Burant, J.C.; et al. Gaussian03, Revision. B.03; Gaussian, Inc.: Pittsburgh, PA, USA, 2003; 302p. [Google Scholar]
- Berezin, K.V.; Nechaev, V.V.; Krivokhizhina, T.V. Application of a method of linear scaling of frequencies in calculations of the normal vibrations of polyatomic molecules. Opt. Spectrosc. 2003, 94, 357–360. [Google Scholar] [CrossRef]
- Musina, G.R.; Dolganova, I.N.; Chernomyrdin, N.V.; Gavdush, A.A.; Ulitko, V.E.; Cherkasova, O.P.; Tuchina, D.K.; Nikitin, P.V.; Alekseeva, A.I.; Bal, N.V.; et al. Optimal hyperosmotic agents for tissue immersion optical clearing in terahertz biophotonics. J. Biophotonics 2020, 13, e202000297. [Google Scholar] [CrossRef] [PubMed]
- Al-Ibadi, A. Terahertz Imaging and Spectroscopy of Biomedical Tissues Application to Breast Cancer Detection. Ph.D. Thesis, University Bordeaux Department of Physics Sciences and Engineering, Bordeaux, France, 11 July 2018. [Google Scholar]
- Sun, Y.; Fischer, B.M.; Pickwell-MacPherson, E. Effects of formalin fixing on the terahertz properties of biological tissues. J. Biomed. Opt. 2009, 14, 064017. [Google Scholar] [CrossRef] [PubMed] [Green Version]
- Pickwell, E.; Wallace, V.P. TOPICAL REVIEW. Biomedical applications of terahertz technology. J. Phys. D Appl. Phys. 2006, 39, R301. [Google Scholar] [CrossRef]
- Wilmink, G.J.; Ibey, B.L.; Rivest, B.D.; Grundt, J.E.; Roach, W.P.; Tongue, T.D.; Schulkin, B.J.; Laman, N.; Peralta, X.G.; Roth, C.C.; et al. Development of a compact terahertz time-domain spectrometer for the measurement of the optical properties of biological tissues. J. Biomed. Opt. 2011, 16, 047006. [Google Scholar] [CrossRef] [PubMed]
- Fitzgerald, A.J.; Pickwell-MacPherson, E.; Wallace, V.P. Use of Finite Difference Time Domain Simulations and Debye Theory for Modelling the Terahertz Reflection Response of Normal and Tumour Breast Tissue. PLoS ONE 2014, 9, e99291. [Google Scholar] [CrossRef]
- Nazarov, M.; Shkurinov, A.; Tuchin, V.V.; Zhang, X.C. Terahertz tissue spectroscopy and imaging. In Handbook of Photonics for Biomedical Science; CRC Press: Boca Raton, FL, USA, 2010; pp. 519–617. [Google Scholar]
- Vohra, N.; Bowman, T.; Diaz, P.M.; Rajaram, N.; Bailey, K.; El-Shenawee, M. Pulsed Terahertz Reflection Imaging of tumors in a spontaneous model of breast cancer. Biomed. Phys. Eng. Express 2018, 4, 065025. [Google Scholar] [CrossRef] [PubMed]
- Cassar, Q.; Al-Ibadi, A.; Mavarani, L.; Hillger, P.; Grzyb, J.; Mac Grogan, G.; Zimmer, T.; Pfeiffer, U.R.; Guillet, J.P.; Mounaix, P. Pilot study of freshly excised breast tissue response in the 300–600 GHz range. Biomed. Opt. Express 2018, 9, 2930–2942. [Google Scholar] [CrossRef]
- Reid, C.B.; Pickwell-MacPherson, E.; Laufer, J.G.; Gibson, A.P.; Hebden, J.C.; Wallace, V.P. Accuracy and resolution of THz reflection spectroscopy for medical imaging. Phys. Med. Biol. 2010, 55, 4825. [Google Scholar] [CrossRef] [PubMed]
- Walter, A. Development of Breast Tissue Phantoms for Enhanced Terahertz Imaging Utilizing Microdiamond and Nano-Onion Particles. Bachelor’s Thesis, University of Arkansas, Fayetteville, AR, USA, December 2016. [Google Scholar]
- Bowman, T.; El-Shenawee, M.; Campbell, L.K. Terahertz transmission vs reflection imaging and model-based characterization for excised breast carcinomas. Biomed. Opt. Express 2016, 7, 3756–3783. [Google Scholar] [CrossRef] [PubMed] [Green Version]
- Chen, H.; Chen, T.-H.; Tseng, T.-F.; Lu, J.-T.; Kuo, C.-C.; Fu, S.-C.; Lee, W.-J.; Tsai, Y.-F.; Huang, Y.-Y.; Chuang, E.Y.; et al. High-sensitivity in vivo THz transmission imaging of early human breast cancer in a subcutaneous xenograft mouse model. Opt. Express 2011, 19, 21552–21562. [Google Scholar] [CrossRef]
- Reid, C. Spectroscopic Methods for Medical Diagnosis at Terahertz Wavelengths. Ph.D. Thesis, University College, London, UK, 2009. [Google Scholar]
- Ji, Y.B.; Lee, E.S.; Kim, S.-H.; Son, J.-H.; Jeon, T.-I. A miniaturized fiber-coupled terahertz endoscope system. Opt. Express 2009, 17, 17082–17087. [Google Scholar] [CrossRef] [PubMed]
- Smolyanskaya, O.A.; Chernomyrdin, N.V.; Konovko, A.A.; Zaytsev, K.I.; Ozheredov, I.A.; Cherkasova, O.P.; Nazarov, M.M.; Guillet, J.-P.; Kozlov, S.A.; Kistenev, Y.V.; et al. Terahertz biophotonics as a tool for studies of dielectric and spectral properties of biological tissues and liquids. Prog. Quantum Electron. 2018, 62, 1–77. [Google Scholar] [CrossRef]
- Romanenko, S.; Begley, R.; Harvey, A.R.; Hool, L.; Wallace, V.P. The interaction between electromagnetic fields at megahertz, gigahertz and terahertz frequencies with cells, tissues and organisms: Risks and potential. J. R. Soc. Interface 2017, 14, 20170585. [Google Scholar] [CrossRef] [Green Version]
- Abufadda, M.H.; Mbithi, N.M.; Polónyi, G.; Nugraha, P.S.; Buzády, A.; Hebling, J.; Molnár, L.; Fülöp, J.A. Absorption of Pulsed Terahertz and Optical Radiation in Earthworm Tissue and Its Heating Effect. J. Infrared. Millim. Terahertz. Waves 2021, 42, 1065–1077. [Google Scholar] [CrossRef]
- Taylor, Z.D.; Singh, R.S.; Bennett, D.B.; Tewari, P.; Kealey, C.P.; Bajwa, N.; Culjat, M.O.; Stojadinovic, A.; Lee, H.; Hubschman, J.P.; et al. THz Medical Imaging: In vivo Hydration Sensing. IEEE. Trans. Terahertz. Sci. Technol. 2011, 1, 201–219. [Google Scholar] [CrossRef] [Green Version]
- Walker, G.C.; Berry, E.; Smye, S.W.; Brettle, D.S. Materials for phantoms for terahertz pulsed imaging. Phys. Med. Biol. 2004, 49, N363–N369. [Google Scholar] [CrossRef] [Green Version]
- Chen, H.; Han, J.; Wang, D.; Zhang, Y.; Li, X.; Chen, X. In vivo Estimation of Breast Cancer Tissue Volume in Subcutaneous Xenotransplantation Mouse Models by Using a High-Sensitivity Fiber-Based Terahertz Scanning Imaging System. Front. Genet. 2021, 12, 700086. [Google Scholar] [CrossRef]
- Wallace, V.P.; MacPherson, E.; Fitzgerald, A.J.; Lo, T.; Provenzano, E.; Pinder, S.; Purushotham, A. Terahertz pulsed imaging and spectroscopy of breast tumors. Proc. SPIE 2006, 6386, 638610. [Google Scholar]
- Parrotta, E.P.J.; Sun, Y.; Pickwell-MacPherson, E. Terahertz spectroscopy: Its future role in medical diagnoses. J. Mol. Struct. 2011, 1006, 66–76. [Google Scholar] [CrossRef]
- Pfeiffer, U.R.; Hillger, P.; Jain, R.; Grzyb, J.; Bucher, T.; Cassar, Q.; MacGrogan, G.; Guillet, J.-P.; Mounaix, P.; Zimmer, T. Ex Vivo Breast Tumor Identification: Advances Toward a Silicon-Based Terahertz Near-Field Imaging Sensor. IEEE Microw. Mag. 2019, 20, 32–46. [Google Scholar] [CrossRef]
- Lu, C.; Liu, C.; Cui, E.; Li, J.; Liu, W.; Sun, P. Analysis on the characteristics of animal tissues based on the Terahertz time domain spectroscopy system. Chin. Opt. Lett. 2012, 10, S13201. [Google Scholar]
- Nazarov, R.; Zhang, T.; Khodzitsky, M.; Demchenko, P. Comparative study of quantitative methods to determine component concentration for water-free biotissue phantom. Proc. SPIE 2019, 11075, 110750Y. [Google Scholar]
- Ashworth, P.C.; Pickwell-MacPherson, E.; Pinder, S.E.; Provenzano, E.; Purushotham, A.D.; Pepper, M.; Wallace, V.P. Terahertz spectroscopy of breast tumors. In Proceedings of the Joint 32nd International Conference on Infrared and Millimeter Waves and the 15th International Conference on TerahertzElectronics, Cardiff, UK, 3–7 September 2007; pp. 603–605. [Google Scholar]
- Yu, C.; Fan, S.; Sun, Y.; Pickwell-MacPherson, E. The potential of terahertz imaging for cancer diagnosis: A review of investigations to date. Quant. Imaging Med. Surg. 2012, 2, 33–45. [Google Scholar]
- Bowman, T.; Walter, A.; El-Shenawee, M. Margin assessment of three-dimensional breast cancer phantoms using terahertz imaging. Proc. SPIE 2016, 9700, 97000J. [Google Scholar]
- 80 Walter, A.; Bowman, T.; El-Shenawee, M. Development of breast cancer tissue phantoms for terahertz imaging. Proc. SPIE 2016, 9700, 970003. [Google Scholar]
- Horowitz, J.D. Characterization of Optimized Si-MOSFETs for Terahertz Detection. Master’s Thesis, Imaging Science Chester F. Carlson Center for Imaging Science College of Science Rochester Institute of Technology, Rochester, NY, USA, 18 May 2017. [Google Scholar]
- Reid, C.; Gibson, A.P.; Hebden, J.C.; Wallace, V.P. An oil and water emulsion phantom for biomedical terahertz spectroscopy. In Proceedings of the 4th IEEE-EMBS International Summer School and Symposium on Medical Devices and Biosensors, Cambridge, UK, 19–22 August 2007; pp. 25–34. [Google Scholar]
- Jiang, F.L.; Ikeda, I.; Ogawa, Y.; Endo, Y. Terahertz absorption spectra of fatty acids and their analogues. J. Oleo. Sci. 2011, 60, 339–343. [Google Scholar] [CrossRef] [PubMed] [Green Version]
- Bandyopadhyay, A.; Sengupta, A.; Barat, R.B.; Gary, D.E.; Federici, J.F.; Chen, M.; Tanner, D.B. Effects of Scattering on THz Spectra of Granular Solids. Int. J. Infrared. Milli. Waves 2007, 28, 969–978. [Google Scholar] [CrossRef]
- Dolganova, I.N.; Zaytsev, K.I.; Yurchenko, S.O.; Karasik, V.E.; Tuchin, V.V. The Role of Scattering in Quasi-Ordered Structures for Terahertz Imaging: Local Order Can Increase an Image Quality. IEEE Trans. Terahertz. Sci. Technol. 2018, 8, 403–409. [Google Scholar] [CrossRef]
- Berry, E.; Fitzgerald, A.J.; Zinov’ev, N.N.; Walker, G.C.; Homer-Vanniasinkam, S.; Sudworth, C.D.; Miles, R.E.; Chamberlain, J.M.; Smith, M.A. Optical properties of tissue measured using terahertz pulsed imaging. Proc. SPIE 2003, 5030, 459–470. [Google Scholar]
- Yanina, I.Y.; Nikolaev, V.V.; Zakharova, O.A.; Borisov, A.V.; Dvoretski, K.N.; Berezin, K.V.; Kochubey, V.I.; Kistenev, Y.V.; Tuchin, V.V. Measurement and modeling of optical properties of heated adipose tissue in the terahertz range. Proc. SPIE 2020, 11348, 1134817. [Google Scholar]
- Stuart, B.H.; Notter, S.J.; Langlois, N.; Maynard, P.; Ray, A.; Berkahn, M. Characterization of the triacylglycerol crystal formation in adipose tissue during a vehicle collision. J. Forensic. Sci. 2007, 52, 938–942. [Google Scholar] [CrossRef]
- Tuchin, V.V. Tissue Optics: Light Scattering Methods and Instruments for Medical Diagnostics; PM 254; SPIE Press: Bellingham, WA, USA, 2015; p. 988. [Google Scholar]
- DiGirolamo, M.; Owens, J.L. Water content of rat adipose tissue and isolated adipocytes in relation to cell size. Am. J. Physiol. Content 1976, 231, 1568–1572. [Google Scholar] [CrossRef] [PubMed]
- Martines-Arano, H.; Palacios-Barreto, S.; Castillo-Cruz, J.; Meda-Campaña, A.J.; García-Pérez, B.E.; Torres-Torres, C. Fractional photodamage triggered by chaotic attractors in human lung epithelial cancer cells. Int. J. Therm. Sci. 2022, 181, 107734. [Google Scholar] [CrossRef]
- Motoyama, M.; Ando, M.; Sasaki, K.; Nakajima, I.; Chikuni, K.; Aikawa, K.; Hamaguchi, H.O. Simultaneous imaging of fat crystallinity and crystal polymorphic types by Raman microspectroscopy. Food. Chem. 2016, 196, 411–417. [Google Scholar] [CrossRef] [PubMed]
- Bowen, J.W.; Owen, T.; Jackson, J.B.; Walker, G.C.; Roberts, J.F.; Martos-Levif, D.; Lascourrèges, P.; Giovannacci, D.; Detalle, V. Cyclododecane as a Contrast Improving Substance for the Terahertz Imaging of Artworks. IEEE. Trans. Terahertz. Sci. Technol. 2015, 5, 1005–1011. [Google Scholar] [CrossRef]
- Ong, H.H.; Webb, C.D.; Gruen, M.L.; Hasty, A.H.; Gore, J.C.; Welch, E.B. Fat-water MRI is sensitive to local adipose tissue inflammatory changes in a diet-induced obesity mouse model at 15T. Proc. SPIE 2015, 9417, 94170C. [Google Scholar]
- Kühn, J.P.; Hernando, D.; Muñoz del Rio, A.; Evert, M.; Kannengiesser, S.; Völzke, H.; Mensel, B.; Puls, R.; Hosten, N.; Rieder, S.B. Effect of multi-peak spectral fat modeling on liver iron and fat quantification: Correlation of biopsy with MRI findings. Radiology 2012, 265, 133–142. [Google Scholar] [CrossRef] [PubMed]
- Prokopovich, Z.; Malecka-Tendera, E.; Matusik, P. Predictive value of obesity rates, metabolic syndrome, and insulin resistance for the risk of diagnosing non-alcoholic fatty liver disease in obese children. J. Gastroenterol. Hepatol. 2018, 2018, 9465784. [Google Scholar]
- Joy, D.; Thava, V.R.; Scott, B.B. Diagnosis of fatty liver disease: Is biopsy necessary? Eur. J. Gastroenterol. Hepatol. 2003, 15, 539–543. [Google Scholar] [PubMed]
- Zaytsev, K.I.; Dolganova, I.N.; Chernomyrdin, N.V.; Katyba, G.M.; Gavdush, A.A.; Cherkasova, O.P.; Komandin, G.A.; Shchedrina, M.A.; Khodan, A.; Ponomarev, D.S.; et al. The progress and perspectives of terahertz technology for diagnosis of neoplasms: A review. J. Opt. 2019, 22, 013001. [Google Scholar] [CrossRef]
- Cherkasova, O.P.; Serdyukov, D.S.; Nemova, E.F.; Ratushnyak, A.S.; Kucheryavenko, A.S.; Dolganova, I.N.; Xu, G.; Skorobogatiy, M.; Reshetov, I.V.; Timashev, P.S.; et al. Cellular effects of terahertz waves. J. Biomed. Opt. 2021, 26, 090902. [Google Scholar] [CrossRef] [PubMed]


| Porcine Fat (in Solid State) | Melting Temperature, °C | FFA, Melting Temperature, °C (Concentration, % by Mass) | ||||
|---|---|---|---|---|---|---|
| Palmitic | Stearic | Oleic | Linoleic | Linolenic | ||
| Triglycerides | 36–45 | 63 (27%) | 70 (14%) | 16 (45%) | −5 (5%) | −11 (5%) |
| Object | Refractive Index | References | Comments | |||
|---|---|---|---|---|---|---|
| Absorption Coefficient, cm−1 | ||||||
| 0.5 THz | 1 THz | 1.5 THz | 2 THz | |||
| Water | 2.4 157.8 | 2.2 220.3 | 2.1 270.6 | 2.0 316.9 | [51] * | Water samples were laboratory grade purified and deionized, and studied at room temperature and atmospheric pressure |
| 2.3 16.5 | 2.1 23.4 | 2.0 28.9 | 2.0 33.6 | [23] | ||
| 2.2 187.9 | 2.1 253.6 | 2.0 299.1 | 2.0 339.0 | [54] | ||
| 2.2 181.8 | 2.0 236.3 | 2.0 284.9 | 1.9 343.6 | [60] | ||
| 2.4 200.6 | 2.2 269.4 | 2.1 329.3 | 2.1 396.8 | [61] | ||
| 2.3 189.4 | 2.1 272.3 | 2.0 328.5 | 2.0 395.1 | [58] * | Distilled at room temperature and normal pressure | |
| 2.3 196.6 | 2.16 272.8 | 2.1 326.1 | 2.0 396.6 | [62] | ||
| 2.3 163.2 | 2.1 255.5 | 2.0 348.5 | 2.1 - | [59] ** | Liquid state | |
| Fat | 1.6 36.3 | 1.6 63.3 | 1.5 80.0 | 1.5 93.5 | [3] | Human |
| 1.6 44.5 | 1.6 72.5 | 1.6 98.7 | 1.6 123.3 | [23] | ||
| 2.7 27.1 | 2.3 37.1 | 2.2 46.3 | 2.0 54.3 | [52] | ||
| 1.6 37.2 | 1.6 59.7 | 1.6 81.7 | 1.5 90.7 | [80] | ||
| 1.6 42.6 | 1.6 75.5 | 1.6 100.7 | 1.6 115.6 | [81] | ||
| 1.5 14.8 | 1.5 28.5 | 1.5 37.8 | 1.5 44.4 | [54] | Human, ex vivo | |
| 1.6 46.5 | 1.6 73.6 | 1.6 98.8 | 1.6 115.4 | [77] | Human, at room temperature | |
| 1.6 38.7 | 1.6 63.3 | 1.6 78.0 | 1.5 92.7 | [61] | Fresh | |
| 1.4 68.7 | 1.4 78.6 | 1.3 41.2 | 1.3 6.1 | [75] | Pork | |
| 1.6 36.3 | 1.6 60.7 | 1.6 80.5 | 1.6 93.7 | [79] | Fresh, bovine | |
| Lipids | 1.5 6.1 | 1.5 12.3 | 1.5 18.3 | 1.5 21.7 | [60] | Beef tallow, pure lipids from beef |
| 1.5 6.1 | 1.5 12.0 | 1.5 17.6 | 1.5 20.7 | [82] | Lard, pure commercially available lipid | |
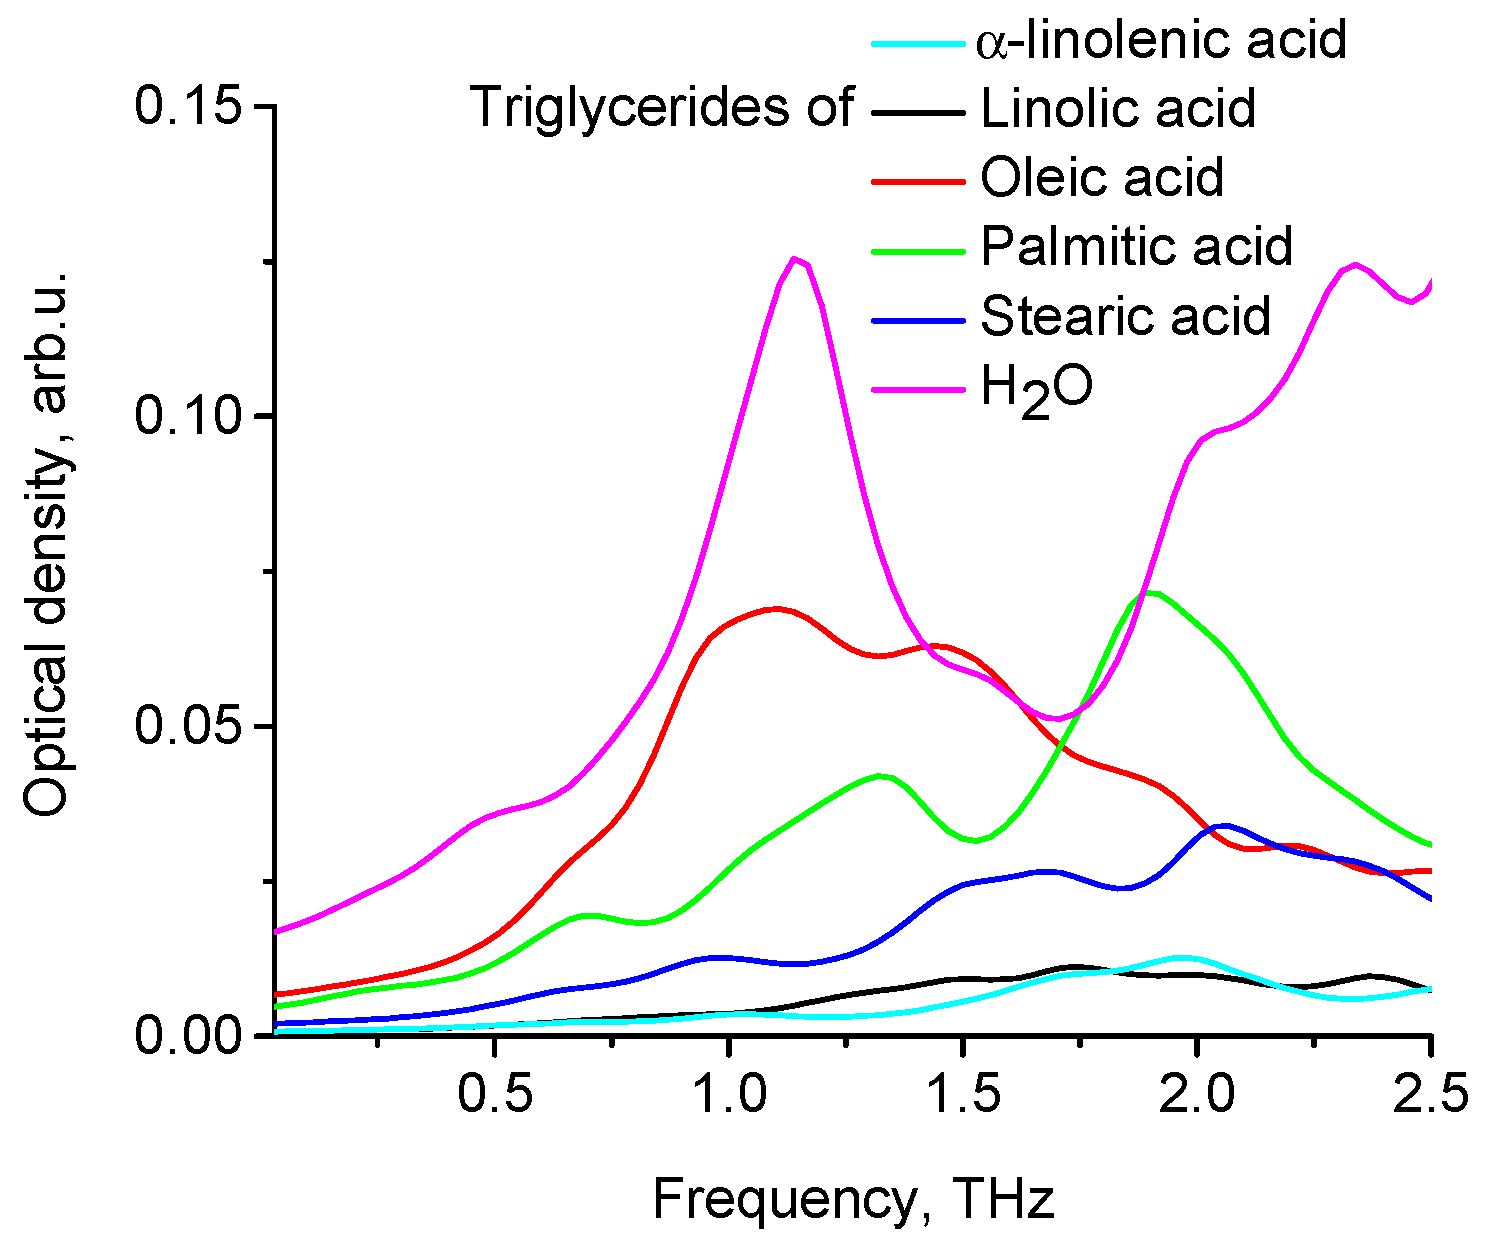
| Frequency (THz) | Interpretation |
|---|---|
| 0.72 | Deformation (bending) oscillation of the left chain of palmitic acid triglyceride |
| 1.20 | Deformation (torsion) oscillation of the left chain of oleic acid triglyceride |
| 1.41 | Deformation (torsion) oscillation of the central chain of palmitic acid triglyceride and mixed deformation (torsion) oscillation of the side chains of oleic acid triglyceride |
| 1.92 | Deformation (bending) oscillation of the right chain of palmitic acid triglyceride and a similar oscillation of the central chain |
Publisher’s Note: MDPI stays neutral with regard to jurisdictional claims in published maps and institutional affiliations. |
© 2022 by the authors. Licensee MDPI, Basel, Switzerland. This article is an open access article distributed under the terms and conditions of the Creative Commons Attribution (CC BY) license (https://creativecommons.org/licenses/by/4.0/).
Share and Cite
Yanina, I.Y.; Nikolaev, V.V.; Zakharova, O.A.; Borisov, A.V.; Dvoretskiy, K.N.; Berezin, K.V.; Kochubey, V.I.; Kistenev, Y.V.; Tuchin, V.V. Measurement and Modeling of the Optical Properties of Adipose Tissue in the Terahertz Range: Aspects of Disease Diagnosis. Diagnostics 2022, 12, 2395. https://doi.org/10.3390/diagnostics12102395
Yanina IY, Nikolaev VV, Zakharova OA, Borisov AV, Dvoretskiy KN, Berezin KV, Kochubey VI, Kistenev YV, Tuchin VV. Measurement and Modeling of the Optical Properties of Adipose Tissue in the Terahertz Range: Aspects of Disease Diagnosis. Diagnostics. 2022; 12(10):2395. https://doi.org/10.3390/diagnostics12102395
Chicago/Turabian StyleYanina, Irina Y., Viktor V. Nikolaev, Olga A. Zakharova, Alexei V. Borisov, Konstantin N. Dvoretskiy, Kirill V. Berezin, Vyacheslav I. Kochubey, Yuri V. Kistenev, and Valery V. Tuchin. 2022. "Measurement and Modeling of the Optical Properties of Adipose Tissue in the Terahertz Range: Aspects of Disease Diagnosis" Diagnostics 12, no. 10: 2395. https://doi.org/10.3390/diagnostics12102395