
Surgically Induced Contrast Enhancements on Intraoperative and Early Postoperative MRI Following High-Grade Glioma Surgery: A Systematic Review

 ,
,
Abstract
:1. Introduction
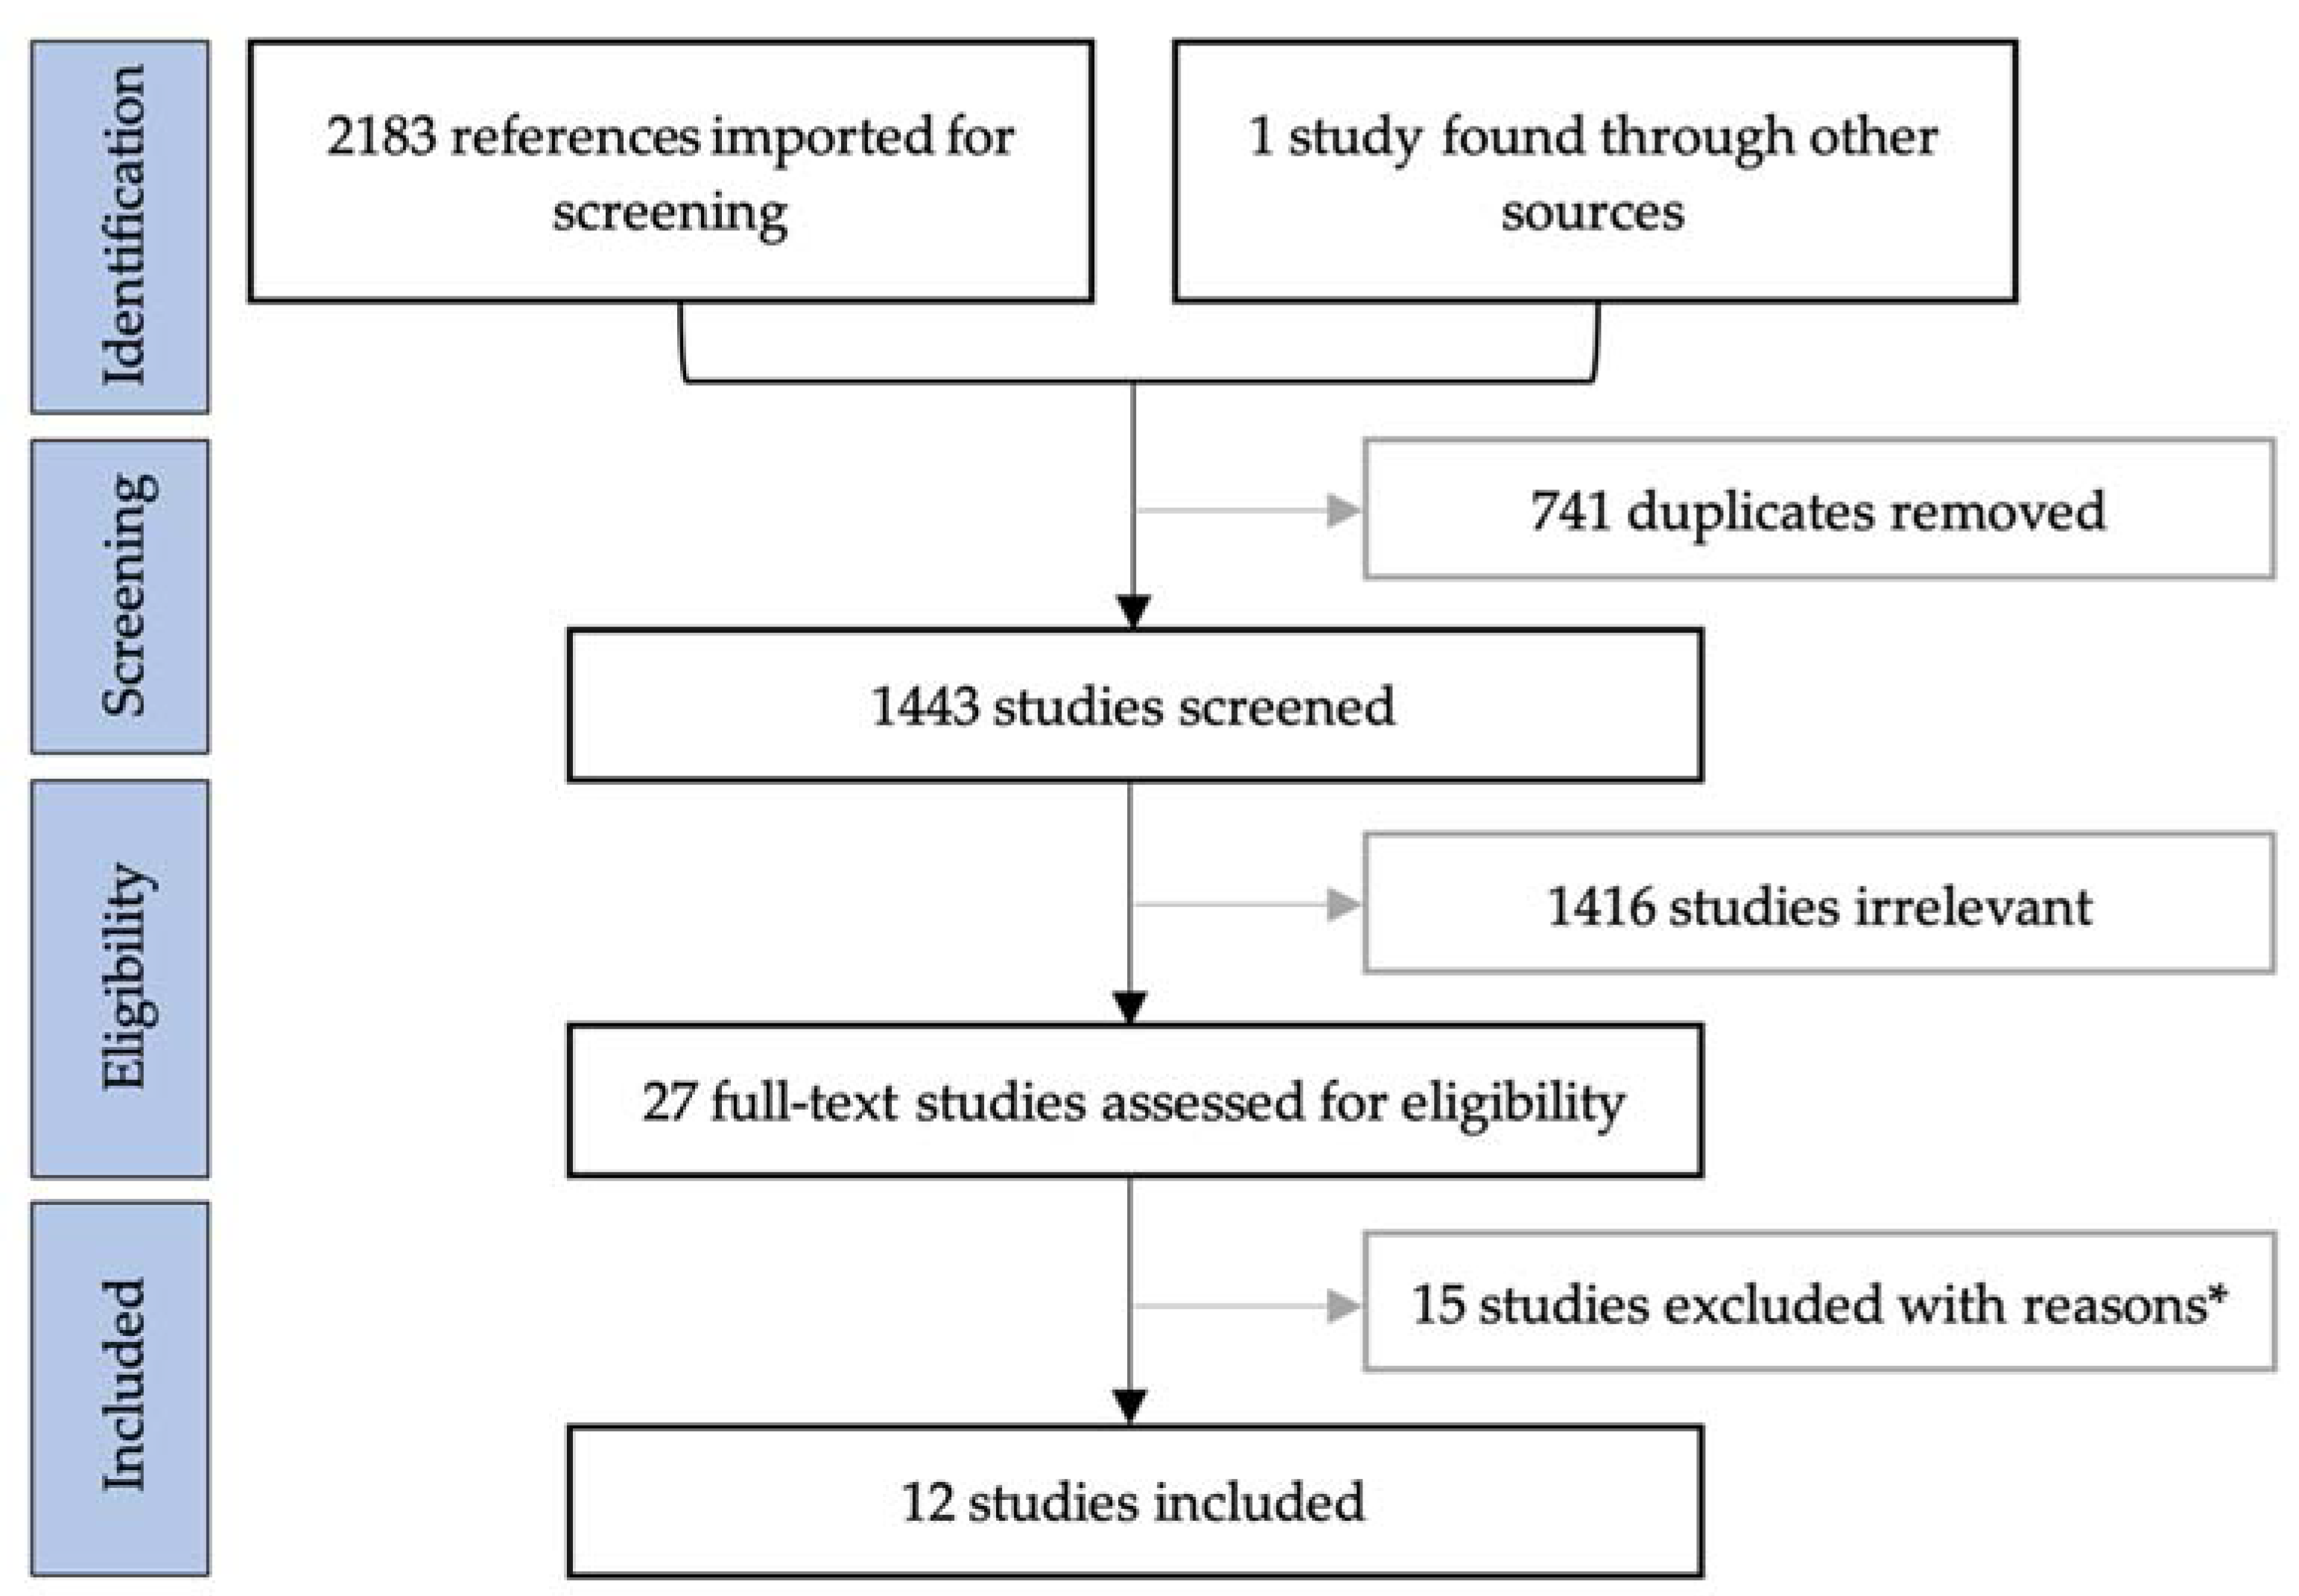
2. Materials and Methods
3. Results
3.1. Study Characteristics
3.2. Results of Individual Studies
3.2.1. Studies on Intraoperative MRI
3.2.2. Studies on Early Postoperative MRI within 72 h
3.2.3. Studies on Postoperative MRI beyond 72 h
3.3. Bias Assessment
4. Discussion
4.1. Limitations of Included Studies
4.2. Limitations of This Review
5. Conclusions
Author Contributions
Funding
Institutional Review Board Statement
Informed Consent Statement
Conflicts of Interest
Appendix A

| Author | Reason for Exclusion |
|---|---|
| Aprile et al., (2008) [37] | Only perfusion MRI |
| Belhawi et al., (2010) [8] | Only T2-weighted/FLAIR MRI |
| Boyett et al., (2019) [38] | Conference abstract |
| Brochado et al., (2012) [39] | Conference abstract |
| Colen et al., (2012) [40] | Abstract only |
| Fei et al., (2020) [41] | Only diffusion/perfusion MRI |
| Finck et al., (2020) [42] | Only black-blood MRI sequence |
| Florez et al., (2020) [43] | Conference abstract |
| Garcia-Ruiz et al., (2021) [32] | No data for patterns of contrast enhancements |
| Heßelmann et al., (2017) [44] | No data for patterns of contrast enhancements |
| Lescher et al., (2016) [45] | Only FLAIR MRI |
| Lescher et al., (2014) [46] | Conference abstract |
| Majos et al., (2016) [5] | No data for patterns of contrast enhancements |
| Martin et al., (2000) [47] | No data for patterns of contrast enhancements |
| Özduman et al., (2014) [48] | Only dynamic contrast enhanced (DCE)-MRI |
Appendix B
| Authors | Enhancement Patterns | |||||
|---|---|---|---|---|---|---|
| Meningeal | Increased Choroid Plexus | Intraparenchymal | Enhancement Ring | Nodular | Frayed | |
| Wirtz et al. [29] | X | X | X | |||
| Knauth et al. [30] | X | X | X | |||
| Smets et al. [26] | X | X | ||||
| Ekinci et al. [15] | X | |||||
| Bette et al. [6] | X | X | ||||
| Lescher et al. [16] | X | |||||
| Sui et al. [27] | X | X | ||||
| Forsyth et al. [31] | X | |||||
References
- Gandhi, S.; Tayebi Meybodi, A.; Belykh, E.; Cavallo, C.; Zhao, X.; Syed, M.P.; Borba Moreira, L.; Lawton, M.T.; Nakaji, P.; Preul, M.C. Survival Outcomes Among Patients with High-Grade Glioma Treated with 5-Aminolevulinic Acid-Guided Surgery: A Systematic Review and Meta-Analysis. Front. Oncol. 2019, 9, 620. [Google Scholar] [CrossRef] [PubMed] [Green Version]
- Thakkar, J.P.; Dolecek, T.A.; Horbinski, C.; Ostrom, Q.T.; Lightner, D.D.; Barnholtz-Sloan, J.S.; Villano, J.L. Epidemiologic and Molecular Prognostic Review of Glioblastoma. Cancer Epidemiol. Biomark. Prev. 2014, 23, 1985–1996. [Google Scholar] [CrossRef] [Green Version]
- Stummer, W.; Reulen, H.-J.; Meinel, T.; Pichlmeier, U.; Schumacher, W.; Tonn, J.-C.; Rohde, V.; Oppel, F.; Turowski, B.; Woiciechowsky, C.; et al. Extent of Resection and Survival in Glioblastoma Multiforme: Identification of and Adjustment for Bias. Neurosurgery 2008, 62, 564–576. [Google Scholar] [CrossRef]
- Grabowski, M.M.; Recinos, P.F.; Nowacki, A.S.; Schroeder, J.L.; Angelov, L.; Barnett, G.H.; Vogelbaum, M.A. Residual Tumor Volume versus Extent of Resection: Predictors of Survival after Surgery for Glioblastoma. J. Neurosurg. 2014, 121, 1115–1123. [Google Scholar] [CrossRef]
- Majos, C.; Cos, M.; Castaner, S.; Gil, M.; Plans, G.; Lucas, A.; Bruna, J.; Aguilera, C. Early Post-Operative Magnetic Resonance Imaging in Glioblastoma: Correlation among Radiological Findings and Overall Survival in 60 Patients. Eur. Radiol. 2016, 26, 1048–1055. [Google Scholar] [CrossRef] [PubMed]
- Bette, S.; Gempt, J.; Huber, T.; Boeckh-Behrens, T.; Ringel, F.; Meyer, B.; Zimmer, C.; Kirschke, J.S. Patterns and Time Dependence of Unspecific Enhancement in Postoperative Magnetic Resonance Imaging After Glioblastoma Resection. World Neurosurg. 2016, 90, 440–447. [Google Scholar] [CrossRef] [PubMed]
- Ulmer, S.; Braga, T.A.; Barker, F.G.; Lev, M.H.; Gonzalez, R.G.; Henson, J.W. Clinical and Radiographic Features of Peritumoral Infarction Following Resection of Glioblastoma. Neurology 2006, 67, 1668–1670. [Google Scholar] [CrossRef] [PubMed]
- Belhawi, S.M.K.; Hoefnagels, F.W.A.; Baaijen, J.C.; Aliaga, E.S.; Reijneveld, J.C.; Heimans, J.J.; Barkhof, F.; Vandertop, W.P.; Hamer, P.C.D.W. Early Postoperative MRI Overestimates Residual Tumour after Resection of Gliomas with No or Minimal Enhancement. Eur. Radiol. 2011, 21, 1526–1534. [Google Scholar] [CrossRef] [Green Version]
- Vogelbaum, M.A.; Jost, S.; Aghi, M.K.; Heimberger, A.B.; Sampson, J.H.; Wen, P.Y.; Macdonald, D.R.; Van den Bent, M.J.; Chang, S.M. Application of Novel Response/Progression Measures for Surgically Delivered Therapies for Gliomas: Response Assessment in Neuro-Oncology (RANO) Working Group. Neurosurgery 2012, 70, 234–243. [Google Scholar] [CrossRef] [Green Version]
- Thust, S.C.; Heiland, S.; Falini, A.; Jäger, H.R.; Waldman, A.D.; Sundgren, P.C.; Godi, C.; Katsaros, V.K.; Ramos, A.; Bargallo, N.; et al. Glioma Imaging in Europe: A Survey of 220 Centres and Recommendations for Best Clinical Practice. Eur. Radiol. 2018, 28, 3306–3317. [Google Scholar] [CrossRef] [Green Version]
- Albert, F.K.; Forsting, M.; Sartor, K.; Adams, H.P.; Kunze, S. Early Postoperative Magnetic Resonance Imaging after Resection of Malignant Glioma: Objective Evaluation of Residual Tumor and Its Influence on Regrowth and Prognosis. Neurosurgery 1994, 34, 45–60. [Google Scholar] [CrossRef]
- Forsting, M.; Albert, F.K.; Kunze, S.; Adams, H.P.; Zenner, D.; Sartor, K. Extirpation of Glioblastomas: MR and CT Follow-up of Residual Tumor and Regrowth Patterns. AJNR Am. J. Neuroradiol. 1993, 14, 77–87. [Google Scholar]
- Sato, N.; Bronen, R.A.; Sze, G.; Kawamura, Y.; Coughlin, W.; Putman, C.M.; Spencer, D.D. Postoperative Changes in the Brain: MR Imaging Findings in Patients without Neoplasms. Radiology 1997, 204, 839–846. [Google Scholar] [CrossRef]
- Henegar, M.M.; Moran, C.J.; Silbergeld, D.L. Early Postoperative Magnetic Resonance Imaging Following Nonneoplastic Cortical Resection. J. Neurosurg. 1996, 84, 174–179. [Google Scholar] [CrossRef]
- Ekinci, G.; Akpinar, I.N.; Baltacioğlu, F.; Erzen, C.; Kiliç, T.; Elmaci, I.; Pamir, N. Early-Postoperative Magnetic Resonance Imaging in Glial Tumors: Prediction of Tumor Regrowth and Recurrence. Eur. J. Radiol. 2003, 45, 99–107. [Google Scholar] [CrossRef]
- Lescher, S.; Schniewindt, S.; Jurcoane, A.; Senft, C.; Hattingen, E. Time Window for Postoperative Reactive Enhancement after Resection of Brain Tumors: Less than 72 h. Neurosurg. Focus 2014, 37, E3. [Google Scholar] [CrossRef] [PubMed]
- Knauth, M.; Wirtz, C.R.; Tronnier, V.M.; Aras, N.; Kunze, S.; Sartor, K. Intraoperative MR Imaging Increases the Extent of Tumor Resection in Patients with High-Grade Gliomas. AJNR Am. J. Neuroradiol. 1999, 20, 1642–1646. [Google Scholar] [PubMed]
- Kuhnt, D.; Becker, A.; Ganslandt, O.; Bauer, M.; Buchfelder, M.; Nimsky, C. Correlation of the Extent of Tumor Volume Resection and Patient Survival in Surgery of Glioblastoma Multiforme with High-Field Intraoperative MRI Guidance. Neuro-Oncology 2011, 13, 1339–1348. [Google Scholar] [CrossRef] [PubMed] [Green Version]
- Schneider, J.P.; Trantakis, C.; Rubach, M.; Schulz, T.; Dietrich, J.; Winkler, D.; Renner, C.; Schober, R.; Geiger, K.; Brosteanu, O.; et al. Intraoperative MRI to Guide the Resection of Primary Supratentorial Glioblastoma Multiforme—A Quantitative Radiological Analysis. Neuroradiology 2005, 47, 489–500. [Google Scholar] [CrossRef] [PubMed]
- Senft, C.; Bink, A.; Franz, K.; Vatter, H.; Gasser, T.; Seifert, V. Intraoperative MRI Guidance and Extent of Resection in Glioma Surgery: A Randomised, Controlled Trial. Lancet Oncol. 2011, 12, 997–1003. [Google Scholar] [CrossRef]
- Miskin, N.; Unadkat, P.; Carlton, M.E.; Golby, A.J.; Young, G.S.; Huang, R.Y. Frequency and Evolution of New Postoperative Enhancement on 3 Tesla Intraoperative and Early Postoperative Magnetic Resonance Imaging. Neurosurgery 2019, 87, 238–246. [Google Scholar] [CrossRef]
- Zaidi, H.A.; Chowdhry, S.A.; Wilson, D.A.; Spetzler, R.F. The Dilemma of Early Postoperative Magnetic Resonance Imaging: When Efficiency Compromises Accuracy: Case Report. Neurosurgery 2014, 74, E335–E340. [Google Scholar] [CrossRef]
- Lara-Velazquez, M.; Al-Kharboosh, R.; Jeanneret, S.; Vazquez-Ramos, C.; Mahato, D.; Tavanaiepour, D.; Rahmathulla, G.; Quinones-Hinojosa, A. Advances in Brain Tumor Surgery for Glioblastoma in Adults. Brain Sci. 2017, 7, 166. [Google Scholar] [CrossRef] [Green Version]
- Eriksen, M.B.; Frandsen, T.F. The Impact of Patient, Intervention, Comparison, Outcome (PICO) as a Search Strategy Tool on Literature Search Quality: A Systematic Review. J. Med. Libr. Assoc. JMLA 2018, 106, 420–431. [Google Scholar] [CrossRef] [PubMed]
- Moher, D.; Liberati, A.; Tetzlaff, J.; Altman, D.G.; PRISMA Group. Preferred Reporting Items for Systematic Reviews and Meta-Analyses: The PRISMA Statement. Ann. Intern. Med. 2009, 151, 264–269. [Google Scholar] [CrossRef] [PubMed] [Green Version]
- Smets, T.; Lawson, T.M.; Grandin, C.; Jankovski, A.; Raftopoulos, C. Immediate Post-Operative MRI Suggestive of the Site and Timing of Glioblastoma Recurrence after Gross Total Resection: A Retrospective Longitudinal Preliminary Study. Eur. Radiol. 2013, 23, 1467–1477. [Google Scholar] [CrossRef]
- Sui, Z.; Zhang, X.; Li, H.; Xu, D.; Li, G. Magnetic Resonance Imaging Evaluation of Brain Glioma before Postoperative Radiotherapy. Clin. Transl. Oncol. 2020. [Google Scholar] [CrossRef]
- Masuda, Y.; Akutsu, H.; Ishikawa, E.; Matsuda, M.; Masumoto, T.; Hiyama, T.; Yamamoto, T.; Kohzuki, H.; Takano, S.; Matsumura, A. Evaluation of the Extent of Resection and Detection of Ischemic Lesions with Intraoperative MRI in Glioma Surgery: Is Intraoperative MRI Superior to Early Postoperative MRI? J. Neurosurg. 2019, 131, 209–216. [Google Scholar] [CrossRef]
- Wirtz, C.R.; Knauth, M.; Staubert, A.; Bonsanto, M.M.; Sartor, K.; Kunze, S.; Tronnier, V.M. Clinical Evaluation and Follow-up Results for Intraoperative Magnetic Resonance Imaging in Neurosurgery. Neurosurgery 2000, 46, 1112–1120. [Google Scholar] [CrossRef] [PubMed]
- Knauth, M.; Aras, N.; Wirtz, C.R.; Dörfler, A.; Engelhorn, T.; Sartor, K. Surgically Induced Intracranial Contrast Enhancement: Potential Source of Diagnostic Error in Intraoperative MR Imaging. AJNR Am. J. Neuroradiol. 1999, 20, 1547–1553. [Google Scholar] [PubMed]
- Forsyth, P.A.; Petrov, E.; Mahallati, H.; Cairncross, J.G.; Brasher, P.; MacRae, M.E.; Hagen, N.A.; Barnes, P.; Sevick, R.J. Prospective Study of Postoperative Magnetic Resonance Imaging in Patients with Malignant Gliomas. J. Clin. Oncol. 1997, 15, 2076–2081. [Google Scholar] [CrossRef] [PubMed]
- Garcia-Ruiz, A.; Naval-Baudin, P.; Ligero, M.; Pons-Escoda, A.; Bruna, J.; Plans, G.; Calvo, N.; Cos, M.; Majós, C.; Perez-Lopez, R. Precise Enhancement Quantification in Post-Operative MRI as an Indicator of Residual Tumor Impact Is Associated with Survival in Patients with Glioblastoma. Sci. Rep. 2021, 11, 695. [Google Scholar] [CrossRef]
- De Barros, A.; Attal, J.; Roques, M.; Nicolau, J.; Sol, J.-C.; Charni, S.; Cohen-Jonathan-Moyal, E.; Roux, F.-E. Glioblastoma Survival Is Better Analyzed on Preradiotherapy MRI than on Postoperative MRI Residual Volumes: A Retrospective Observational Study. Clin. Neurol. Neurosurg. 2020, 196, 105972. [Google Scholar] [CrossRef] [PubMed]
- Booth, T.C.; Luis, A.; Brazil, L.; Thompson, G.; Daniel, R.A.; Shuaib, H.; Ashkan, K.; Pandey, A. Glioblastoma Post-Operative Imaging in Neuro-Oncology: Current UK Practice (GIN CUP Study). Eur. Radiol. 2020, 31, 2933–2943. [Google Scholar] [CrossRef] [PubMed]
- Kubben, P.L.; ter Meulen, K.J.; Schijns, O.E.; ter Laak-Poort, M.P.; van Overbeeke, J.J.; van Santbrink, H. Intraoperative MRI-Guided Resection of Glioblastoma Multiforme: A Systematic Review. Lancet Oncol. 2011, 12, 1062–1070. [Google Scholar] [CrossRef]
- Bero, L.; Chartres, N.; Diong, J.; Fabbri, A.; Ghersi, D.; Lam, J.; Lau, A.; McDonald, S.; Mintzes, B.; Sutton, P.; et al. The Risk of Bias in Observational Studies of Exposures (ROBINS-E) Tool: Concerns Arising from Application to Observational Studies of Exposures. Syst. Rev. 2018, 7, 242. [Google Scholar] [CrossRef]
- Aprile, I.; Armadori, M.; Conti, G.; Ottaviano, I.; Ranaldi, A.; Ottaviano, P. MR Perfusion Imaging of Intracranial Tumors: A Retrospective Study of 218 Patients. Neuroradiol. J. 2008, 21, 472–489. [Google Scholar] [CrossRef]
- Boyett, D.; Englander, Z.; Zanazzi, Z.; Marie, T.; McKhann, G.; Sisti, M.; Grinband, J.; Canoll, P.; Bruce, J. MR Imaging Is Not Reliable for Tumor Presence in Post-Treatment Recurrent High-Grade Glioma. J. Neurosurg. 2019. [Google Scholar] [CrossRef] [Green Version]
- Brochado, A.T.V.H.S.R.; Reis, C.; Linhares, P.; Rocha, A.; Vaz, R. Early Postoperative Magnetic Resonance Imaging in Glioblastomas. Neuroradiology 2012. [Google Scholar] [CrossRef]
- Colen, R.; Kovacs, A.; Zinn, P.; Jolesz, F. MRI to Predict Surgical and Radiation Dosimetry Borders: A Methodology Feasibility Study. Neuro-Oncology 2012. [Google Scholar] [CrossRef] [Green Version]
- Fei, Q.; Qian, L.-X.; Zhang, Y.-J.; Guo, W.-J.; Bian, X.-H.; Yin, L.; Yan, P.-W.; Wang, T.-T.; Qian, P.-D.; Guo, Z.; et al. The Utility of Diffusion and Perfusion Magnetic Resonance Imaging in Target Delineation of High-Grade Gliomas. BioMed Res. Int. 2020, 2020, 8718097. [Google Scholar] [CrossRef]
- Finck, T.; Gempt, J.; Krieg, S.M.; Meyer, B.; Zimmer, C.; Wiestler, B.; Kirschke, J.S.; Sollmann, N. Assessment of the Extent of Resection in Surgery of High-Grade Glioma—Evaluation of Black Blood Sequences for Intraoperative Magnetic Resonance Imaging at 3 Tesla. Cancers 2020, 12, 1580. [Google Scholar] [CrossRef] [PubMed]
- Florez, E.; Hamidi, R.; Howard, C. Response Assessment in Recurrent Glioblastoma Based on Contrast-Enhanced T1-Weighted Subtraction Color Maps and Rano Criteria. J. Investig. Med. 2020, 68, 435–710. [Google Scholar] [CrossRef] [Green Version]
- Hesselmann, V.; Mager, A.-K.; Goetz, C.; Detsch, O.; Theisgen, H.-K.; Friese, M.; Schwindt, W.; Gottschalk, J.; Kremer, P. Accuracy of High-Field Intraoperative MRI in the Detectability of Residual Tumor in Glioma Grade IV Resections. Rofo 2017, 189, 519–526. [Google Scholar] [CrossRef] [PubMed] [Green Version]
- Lescher, S.; Jurcoane, A.; Schniewindt, S.; Senft, C.; Hattingen, E. Misleading FLAIR Imaging Pattern after Glioma Surgery with Intraoperative MRI. Neurosurg. Rev. 2016, 39, 79–85. [Google Scholar] [CrossRef] [PubMed]
- Lescher, S.; Schniewindt, S.; Jurcoane, A.; Senft, S.; Hattingen, E. SAH-like Pattern in Flair Imaging after Intraoperative MRI Guidance in Patients with Malignant Gliomas Surgery. Clin. Neuroradiol. 2014. [Google Scholar] [CrossRef]
- Martin, A.J.; Hall, W.A.; Liu, H.; Pozza, C.H.; Michel, E.; Casey, S.O.; Maxwell, R.E.; Truwit, C.L. Brain Tumor Resection: Intraoperative Monitoring with High-Field-Strength MR Imaging-Initial Results. Radiology 2000, 215, 221–228. [Google Scholar] [CrossRef]
- Ozduman, K.; Yildiz, E.; Dincer, A.; Sav, A.; Pamir, M.N. Using Intraoperative Dynamic Contrast-Enhanced T1-Weighted MRI to Identify Residual Tumor in Glioblastoma Surgery. J. Neurosurg. 2014, 120, 60–66. [Google Scholar] [CrossRef] [Green Version]


| Authors | Year | Design | Cases | Pathology (%) | Tesla | Sequences | epMRI Timing | CE Assessments | CE Comparison | |
|---|---|---|---|---|---|---|---|---|---|---|
| iMRI | Miskin et al. [21] | 2019 | R | 64 | HGG (69%) | 3 T iMRI 1.5/3 T epMRI | iMRI: T1 epMRI: NS | <72 h | New enhancements | iMRI and epMRI with preMRI epMRI with iMRI and follow-up |
| Masuda et al. [28] | 2018 | p | 22 | HGG (95%) | 1.5 T iMRI 1.5 T epMRI | T1, T2, DWI, MPRAGE | <24 h | New enhancements | PreMRI | |
| Wirtz et al. [29] | 2000 | p | 88 | HGG (70%) | 0.2 T | T1, T2, FLAIR | n/A | Surgically induced as linear, intraparenchymal | PreMRI | |
| Knauth et al. [30] | 1999 | p | 48 | HGG (71%) | 0.2 T | T1 | Day 1–3 | Surgically induced as linear, intraparenchymal | PreMRI and epMRI | |
| <72 h | Smets et al. [26] | 2013 | R | 24 | GBM (100%) | 3 T | T1, T2, DWI | <2 h and24–48 h | Linear, micronodular, frayed | Follow-up MRI |
| Ekinci et al. [15] | 2003 | R | 50 | HGG (78%) | 1.5 T | T1, T2 | <24 h | Thin linear, thick linear, thick linear-nodular | Follow-up MRI | |
| Bette et al. [6] | 2016 | R | 173 | GBM (100%) | 3 T | T1, FLAIR, MPRAGE | <17 to >72 h in 4-h intervals | Linear, nodular | Follow-up MRI | |
| Lescher et al. [16] | 2014 | R | 46 | HGG (100%) | 3 T | T1, T2, FLAIR, other | <24 to >48 h in 3 groups | Surgically induced if thin linear Tumoral if bulky/nodular | Follow-up MRI | |
| >72 h | Sui et al. [27] | 2020 | R | 106 | HGG (66%) | 3 T | T1, T2, FLAIR | <24 h to 30 days | Enhancement ring | Follow-up MRI |
| Forsyth et al. [31] | 1997 | p | 17 | HGG (100%) | 1.5 T (4 on 0.5 T) | T1, T2 | Day 1, 3, 5, 7, 14 and 21 | Surgically induced as linear. Subdivided by intensity. | Follow-up MRI | |
| Albert et al. [11] | 1994 | p | 60 | HGG (100%) | 1 T | T1 | Day 1–5, week 2, week 4–6, then bimonthly | Enhancement patterns evaluated over time. | Follow-up MRI | |
| Forsting et al. [12] | 1993 | p | 68 | GBM (100%) | 1 T | T1 | Day 1–5, week 2, week 4–6, then bimonthly | Enhancement patterns evaluated over time. | Follow-up MRI |
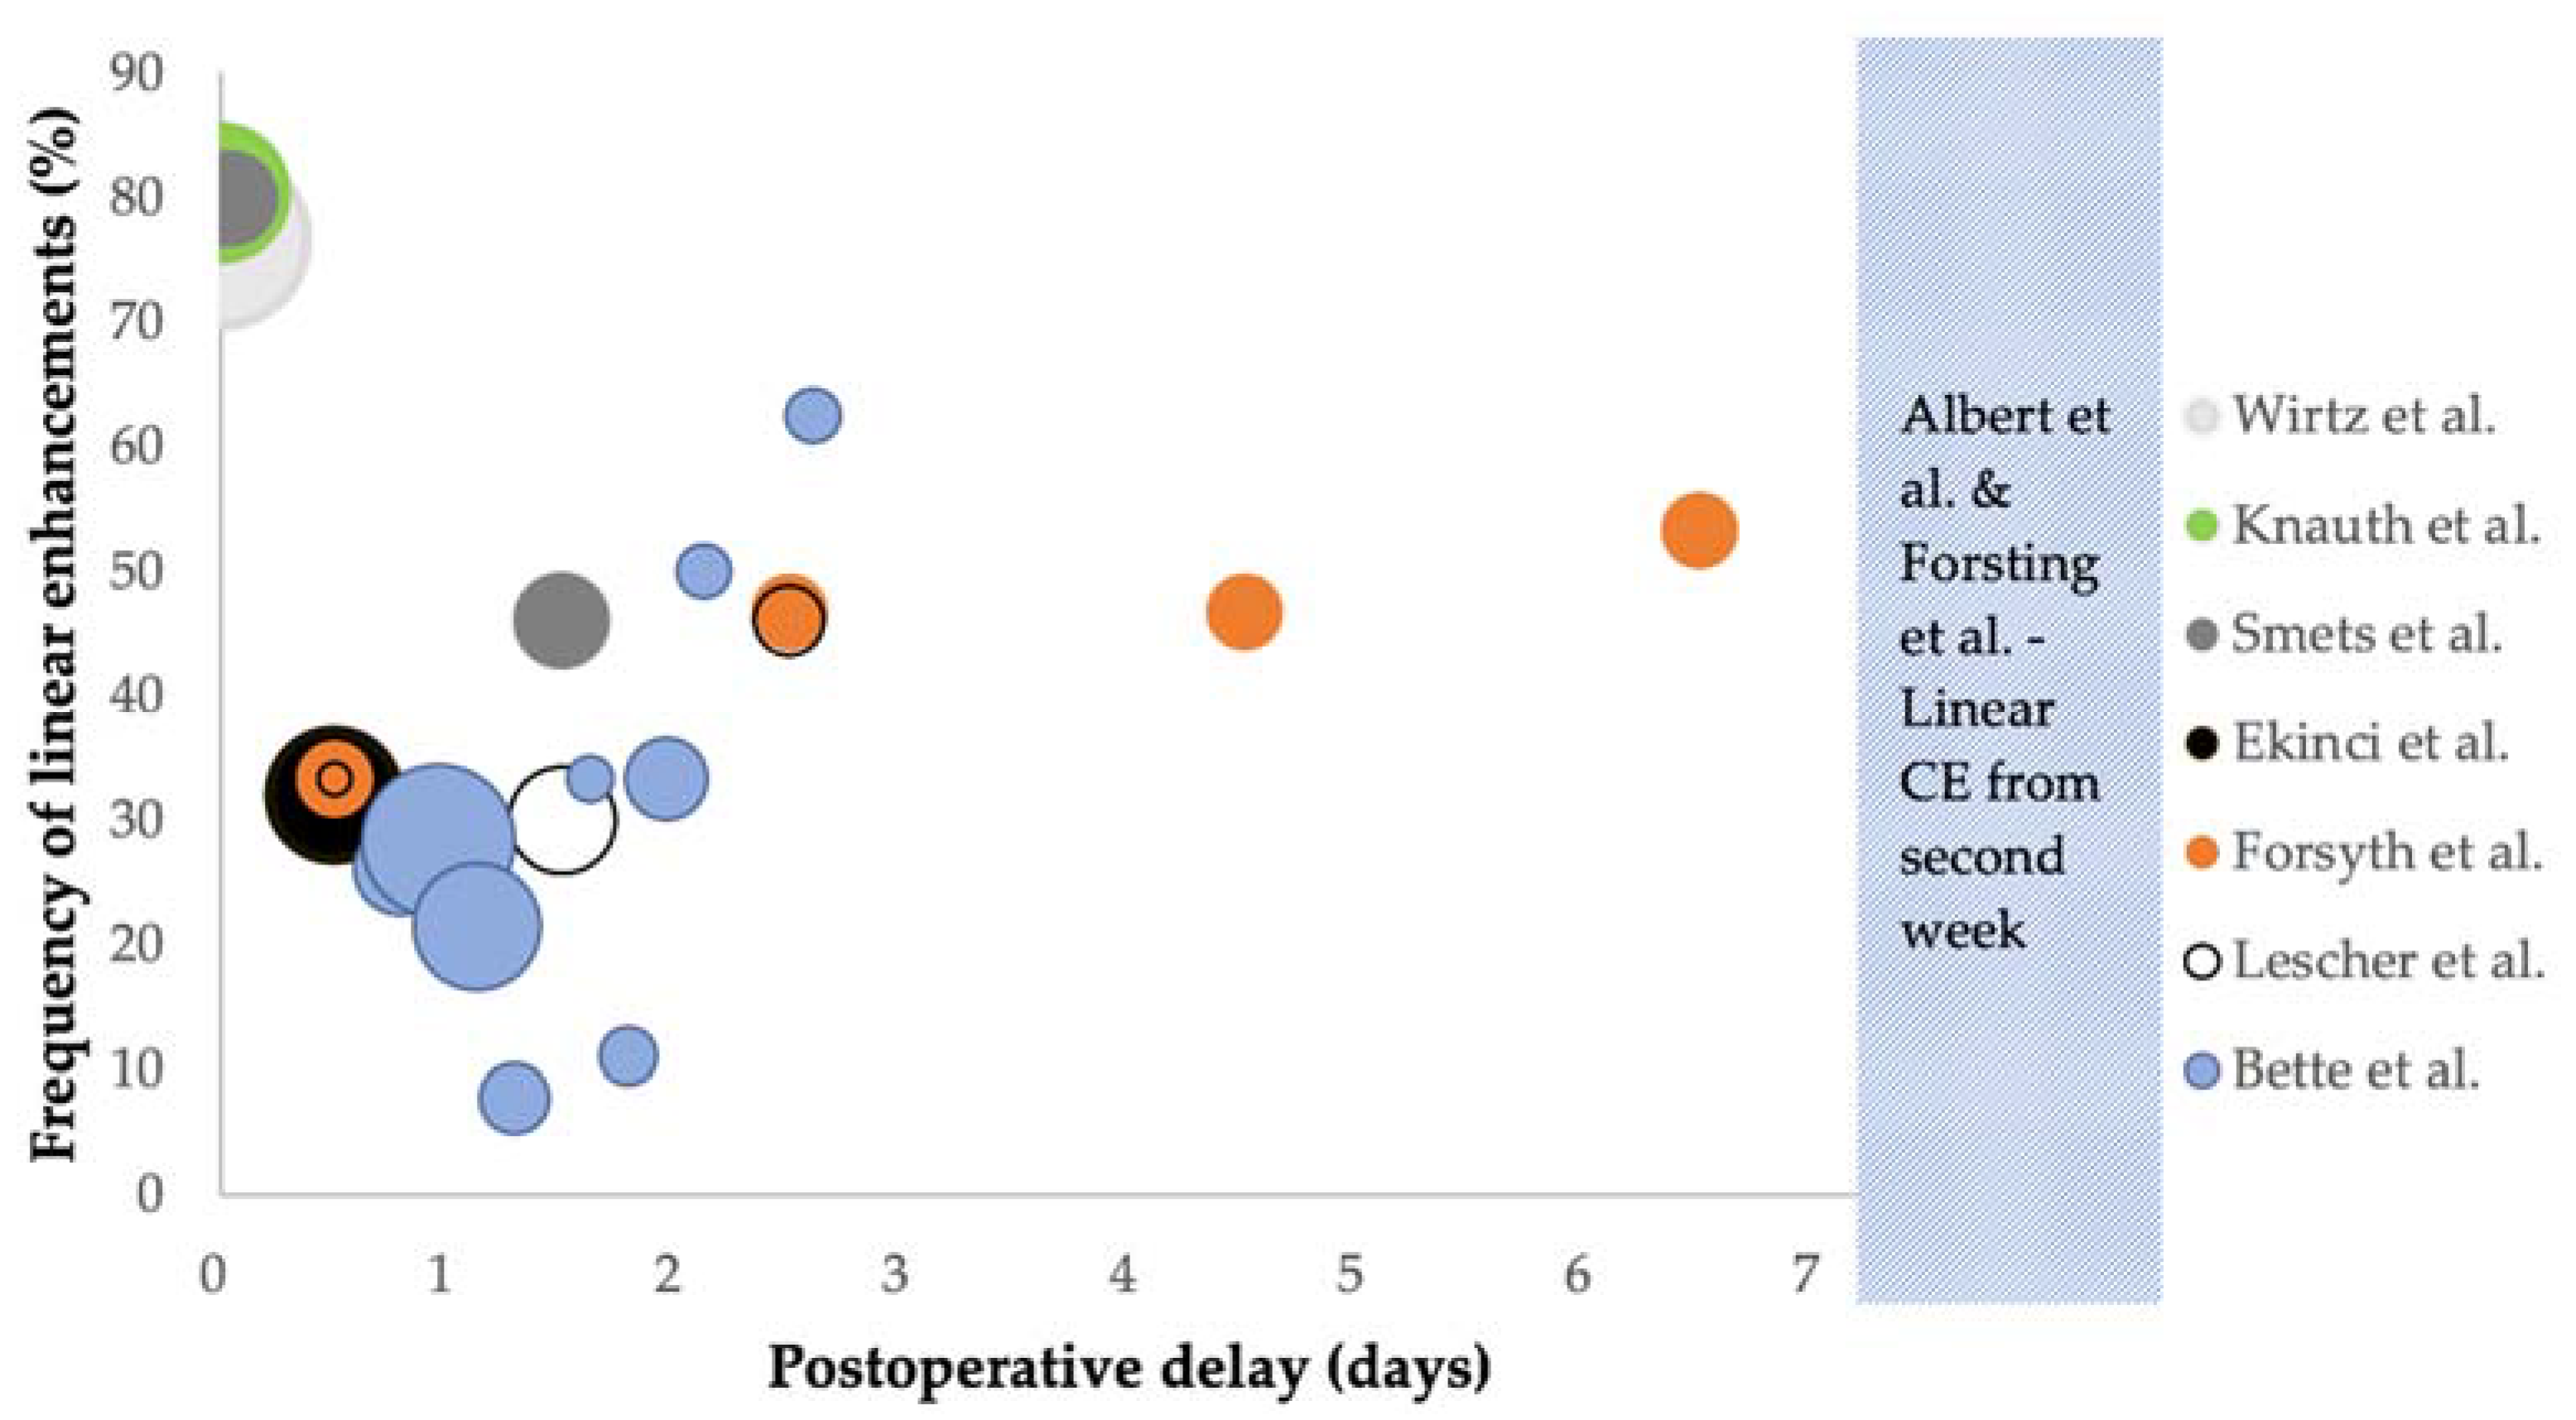
| Author | Timing | Frequency (%) | Surgically Induced (% of Linear CE) | ||
|---|---|---|---|---|---|
| iMRI | Wirtz et al. [29] | iMRI | 76.7% (66/86) | NS | |
| Knauth et al. [30] | iMRI | 80.4% (41/51) | NS | ||
| <72 h | Smets et al. [26] | <2 h 24–48 h | 80% 46% | NS | |
| Ekinci et al. [15] | <24 h | 32% (16/50) | 87.5% (14/16) * | ||
| Bette et al. [6] | <45 h >45 h | 24.1% (39/162) 45.5% (20/44) | 61.5% (24/39) 75% (15/20) | ||
| Lescher et al. [16] | <72 h | 28.3% (13/46) | NS | ||
| >72 h | Forsyth et al. [31] | Day 1 Day 3 Day 5 Day 7 Day 14 Day 21 | All grades 33.3% (5/15) * 46.7% (7/15) * 46.7% (7/15) * 53.3% (8/15) * 53.3% (8/15) * 40% (6/15) * | Grade 2–3 0% (0/15) * 20% (3/15) * 40% (6/15) * 40% (6/15) * 53.3% (8/15) * 27% (4/15) * | NS |
| Albert et al. [11] | Day 1–5, week 2, week 4–6, then bimonthly | Did not occur before day 4, developed in week 2 and had resolved after 2 months in most patients | NS | ||
| Forsting et al. [12] | Day 1–5, week 2, week 4–6, then bimonthly | Did not occur before day 4, developed in week 2 and had resolved after 2 months in most patients | NS | ||
Publisher’s Note: MDPI stays neutral with regard to jurisdictional claims in published maps and institutional affiliations. |
© 2021 by the authors. Licensee MDPI, Basel, Switzerland. This article is an open access article distributed under the terms and conditions of the Creative Commons Attribution (CC BY) license (https://creativecommons.org/licenses/by/4.0/).
Share and Cite
Rykkje, A.M.; Li, D.; Skjøth-Rasmussen, J.; Larsen, V.A.; Nielsen, M.B.; Hansen, A.E.; Carlsen, J.F. Surgically Induced Contrast Enhancements on Intraoperative and Early Postoperative MRI Following High-Grade Glioma Surgery: A Systematic Review. Diagnostics 2021, 11, 1344. https://doi.org/10.3390/diagnostics11081344
Rykkje AM, Li D, Skjøth-Rasmussen J, Larsen VA, Nielsen MB, Hansen AE, Carlsen JF. Surgically Induced Contrast Enhancements on Intraoperative and Early Postoperative MRI Following High-Grade Glioma Surgery: A Systematic Review. Diagnostics. 2021; 11(8):1344. https://doi.org/10.3390/diagnostics11081344
Chicago/Turabian StyleRykkje, Alexander Malcolm, Dana Li, Jane Skjøth-Rasmussen, Vibeke Andrée Larsen, Michael Bachmann Nielsen, Adam Espe Hansen, and Jonathan Frederik Carlsen. 2021. "Surgically Induced Contrast Enhancements on Intraoperative and Early Postoperative MRI Following High-Grade Glioma Surgery: A Systematic Review" Diagnostics 11, no. 8: 1344. https://doi.org/10.3390/diagnostics11081344