
Deep Radiotranscriptomics of Non-Small Cell Lung Carcinoma for Assessing Molecular and Histology Subtypes with a Data-Driven Analysis

 ,
,  , and
, and 
Abstract
:1. Introduction
2. Materials and Methods
2.1. Dataset
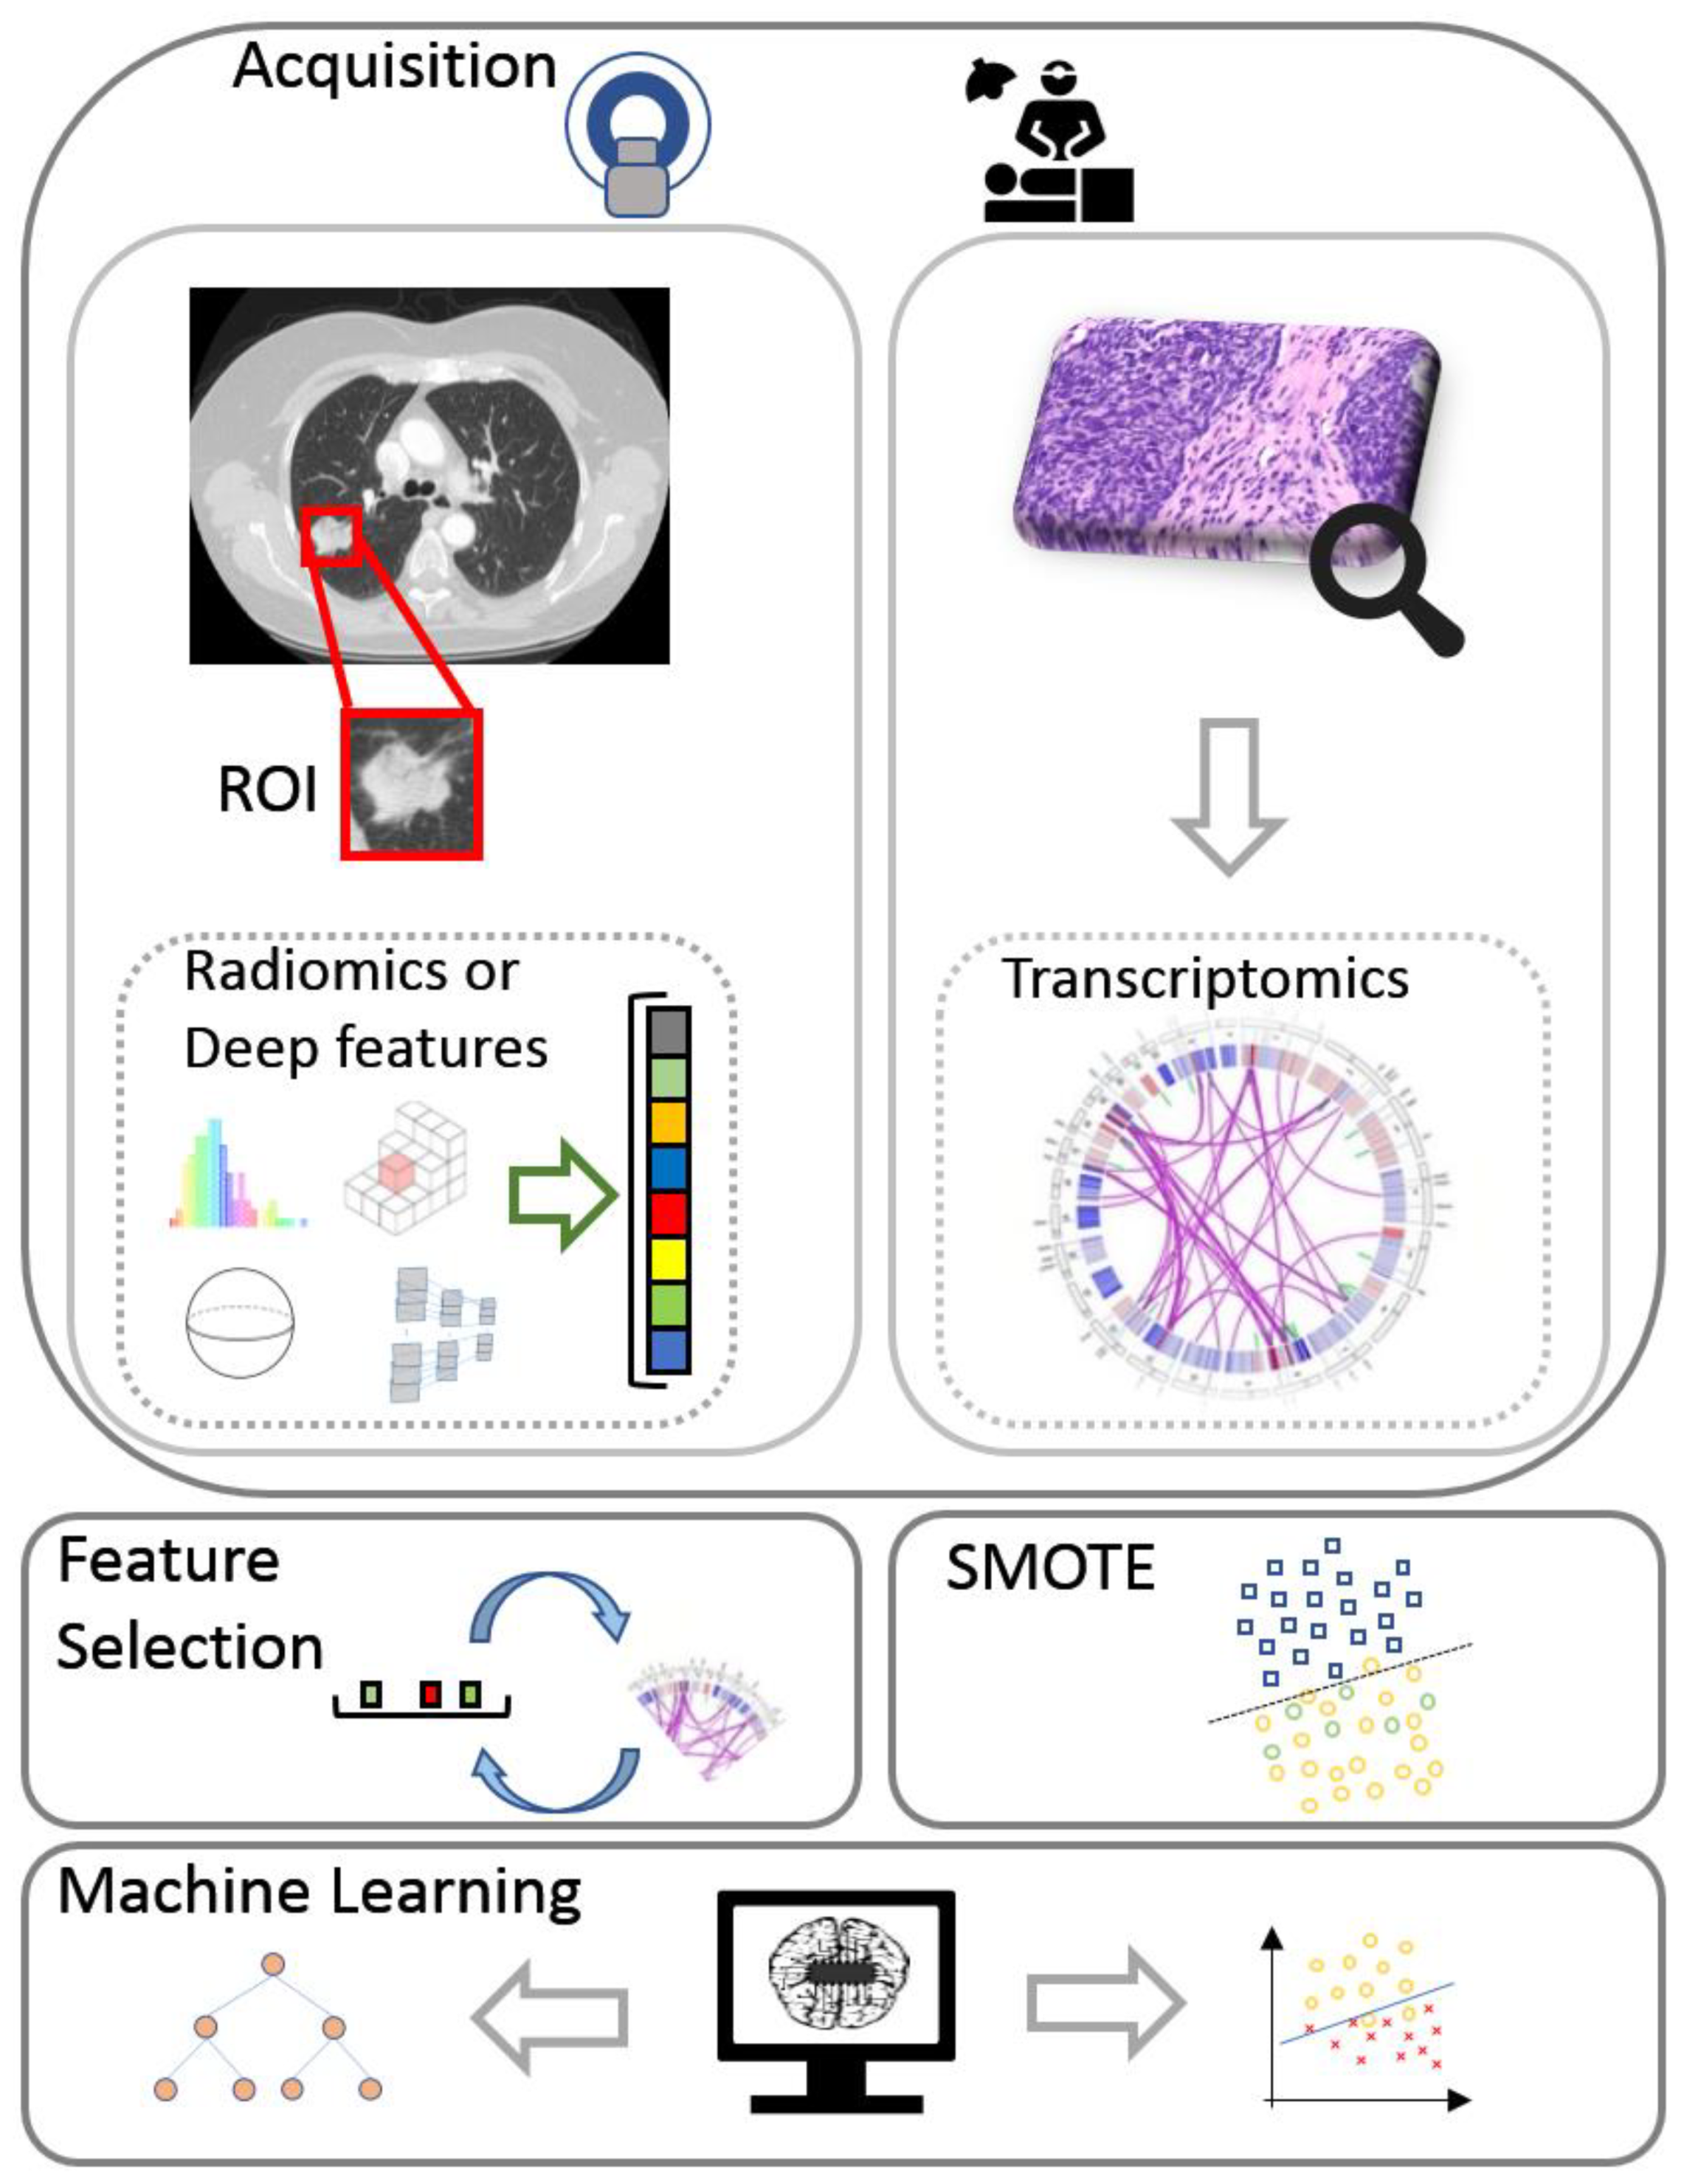
2.2. Multi-View Learning for Radiotranscriptomics
2.2.1. Deep Features
2.2.2. Radiomics
2.2.3. Transcriptomics
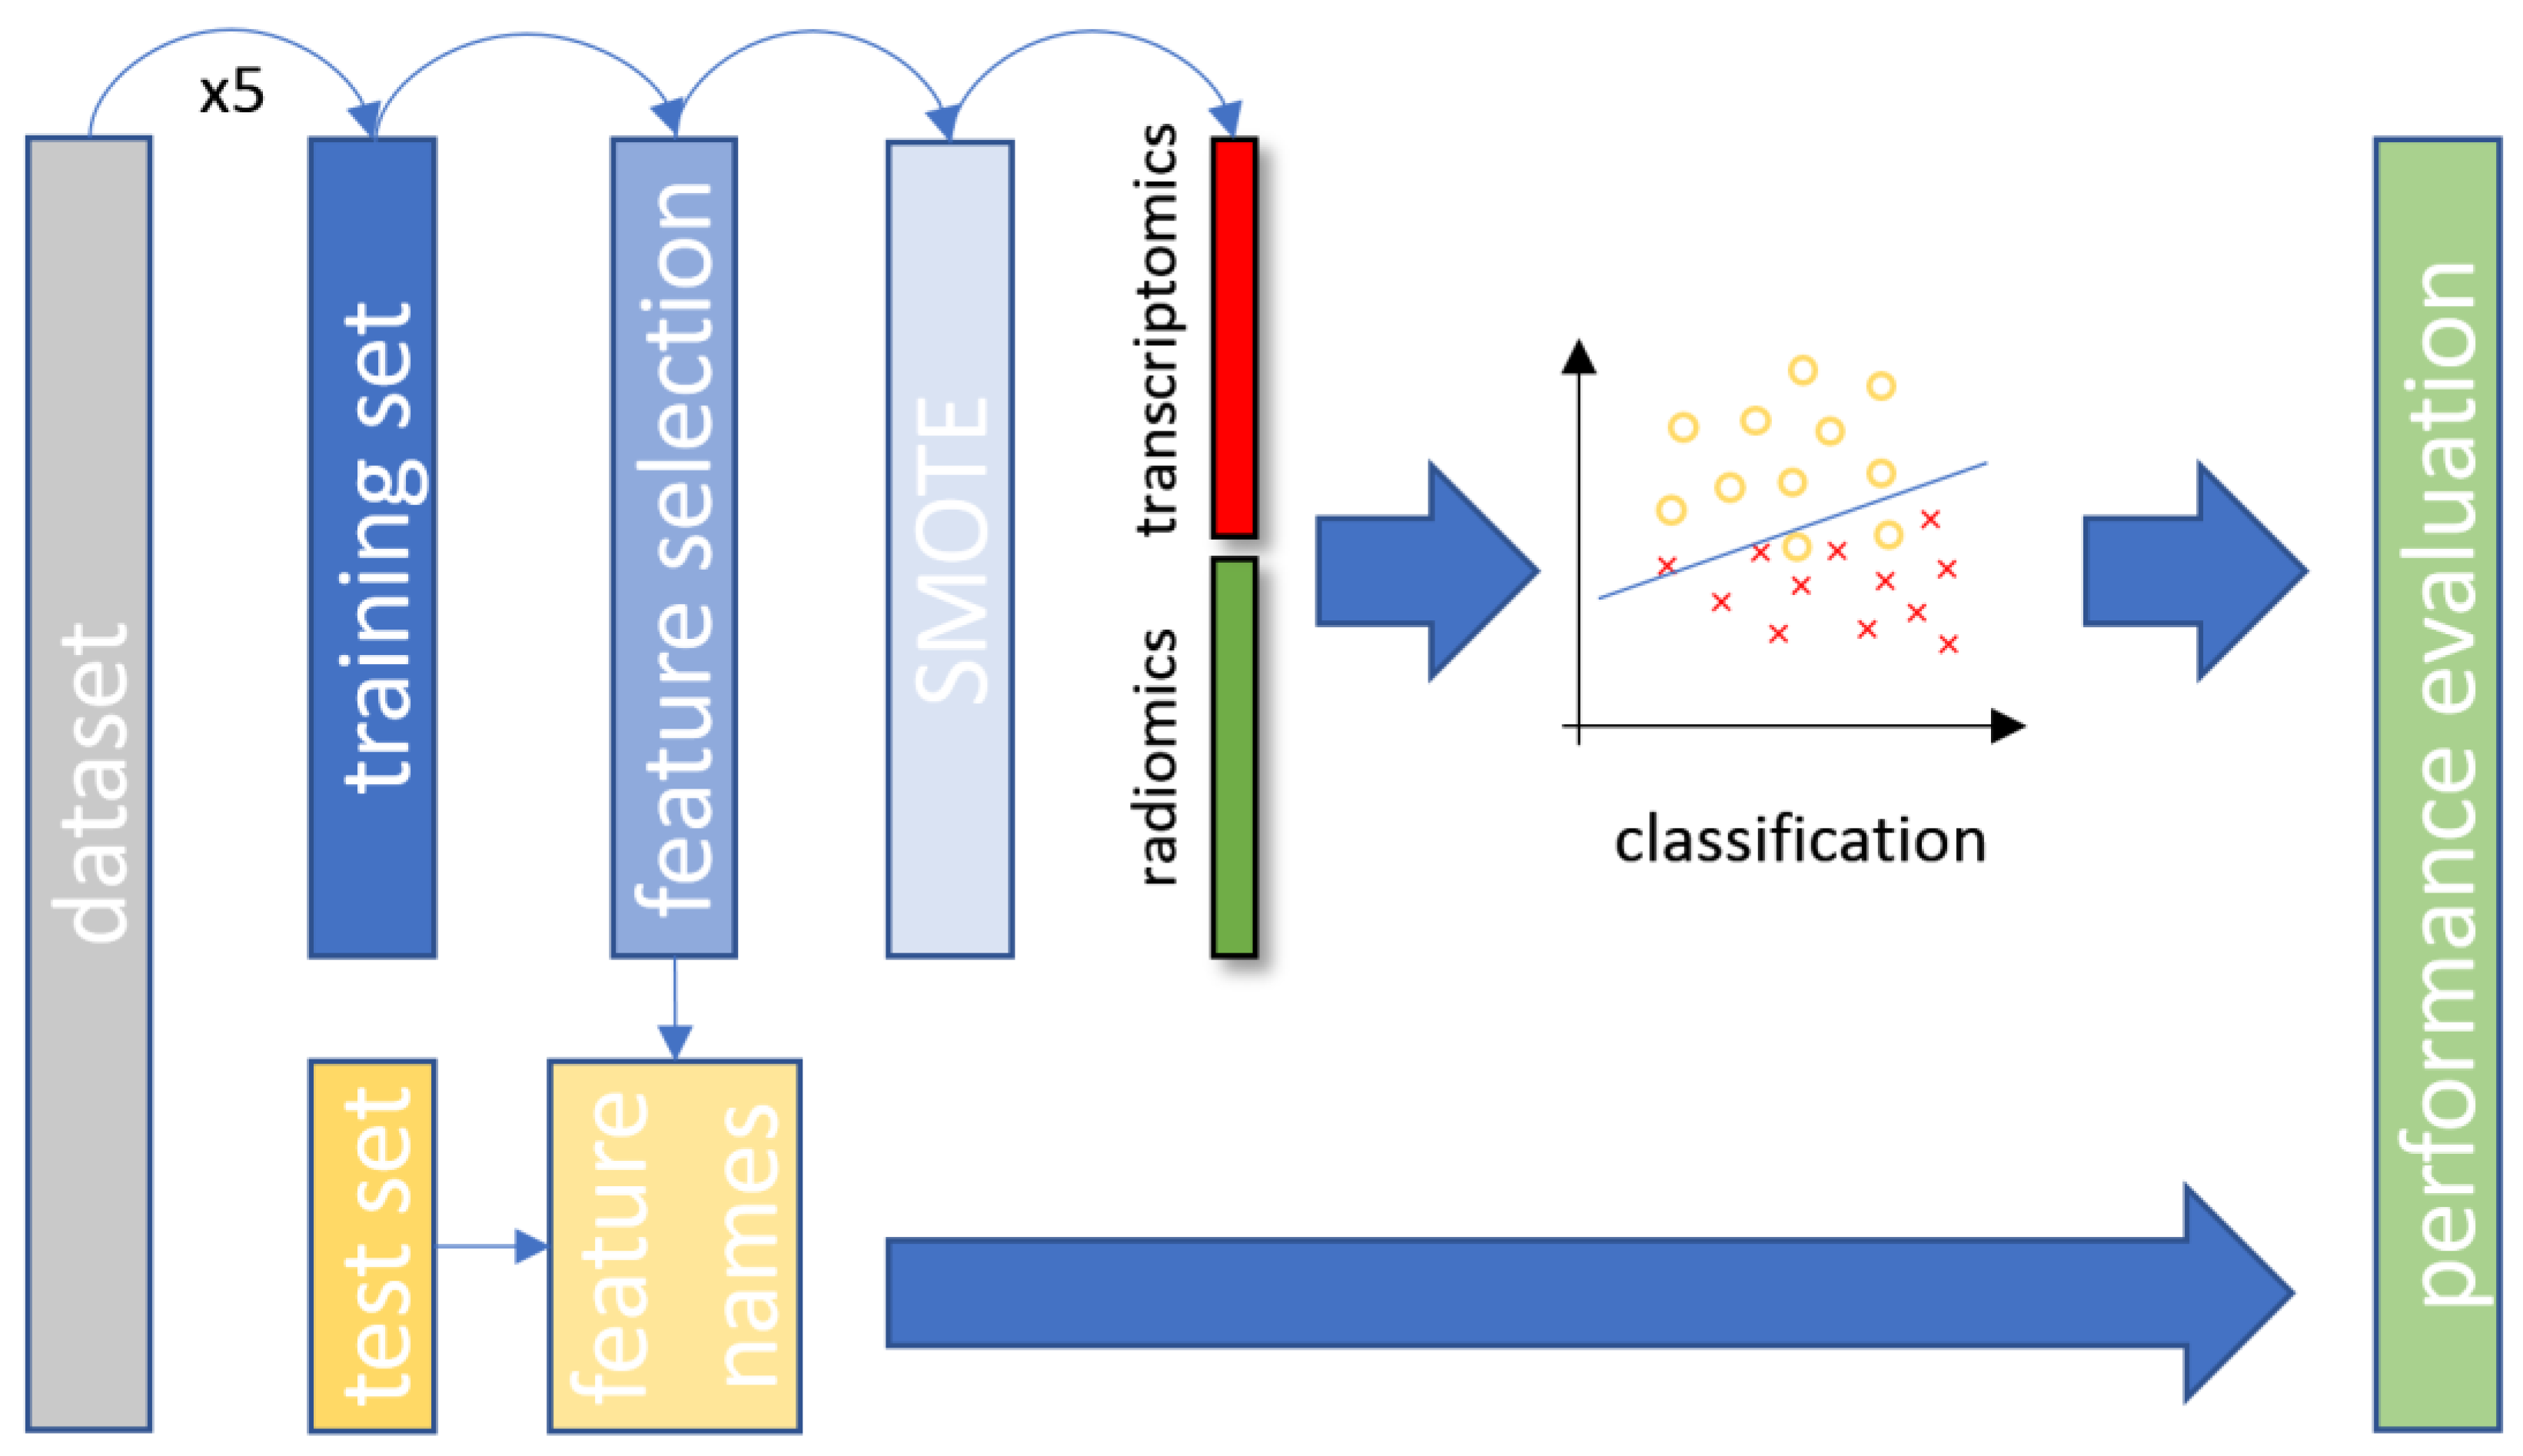
2.2.4. Feature Selection
2.2.5. Synthetic Minority Oversampling Technique
2.2.6. Data Stratification
2.2.7. Classification
3. Results
4. Discussion
4.1. Common Features Found in Current Literature
4.2. Performance of Radiotranscriptomics Versus Single Source Models
4.3. Clinical Impact of the Study
4.4. Limitations and Future Extensions
5. Conclusions
Supplementary Materials
Author Contributions
Funding
Institutional Review Board Statement
Informed Consent Statement
Data Availability Statement
Conflicts of Interest
References
- International Agency for Research on Cancer. Latest Global Cancer Data: Cancer Burden Rises to 18.1 Million New Cases and 9.6 Million Cancer Deaths in 2018; IARC: Geneva, Switzerland, 2018. [Google Scholar]
- World Health Organization. Available online: https://covid19.who.int/ (accessed on 1 August 2020).
- Potti, A.; Mukherjee, S.; Petersen, R.; Dressman, H.K.; Bild, A.; Koontz, J.; Kratzke, R.; Watson, M.A.; Kelley, M.; Ginsburg, G.S.; et al. A genomic strategy to refine prognosis in early-stage non-small-cell lung cancer. N. Engl. J. Med. 2006, 355, 570–580. [Google Scholar] [CrossRef] [Green Version]
- Sanchez-Palencia, A.; Gomez-Morales, M.; Gomez-Capilla, J.A.; Pedraza, V.; Boyero, L.; Rosell, R.; Fárez-Vidal, M.E. Gene expression profiling reveals novel biomarkers in nonsmall cell lung cancer. Int. J. Cancer 2011, 129, 355–364. [Google Scholar] [CrossRef] [PubMed]
- Li, J.; Bi, L.; Shi, Z.; Sun, Y.; Lin, Y.; Shao, H.; Zhu, Z. RNA-Seq analysis of non-small cell lung cancer in female never-smokers reveals candidate cancer-associated long non-coding RNAs. Pathol. Res. Pract. 2016, 212, 549–554. [Google Scholar] [CrossRef] [PubMed]
- Trivizakis, E.; Papadakis, G.Z.; Souglakos, I.; Papanikolaou, N.; Koumakis, L.; Spandidos, D.A.; Tsatsakis, A.; Karantanas, A.H.; Marias, K. Artificial intelligence radiogenomics for advancing precision and effectiveness in oncologic care (Review). Int. J. Oncol. 2020, 57, 43–53. [Google Scholar] [CrossRef] [PubMed]
- Yoon, H.-Y.; Ryu, J.-S.; Sim, Y.S.; Kim, D.; Lee, S.Y.; Choi, J.; Park, S.; Ryu, Y.J.; Lee, J.H.; Chang, J.H. Clinical significance of EGFR mutation types in lung adenocarcinoma: A multi-centre Korean study. PLoS ONE 2020, 15, e0228925. [Google Scholar] [CrossRef]
- Aguilar, K.M.; Winfree, K.B.; Muehlenbein, C.E.; Zhu, Y.E.; Wilson, T.; Wetmore, S.; Nadler, E.S. Treatment Patterns by EGFR Mutation Status in Non-Small Cell Lung Cancer Patients in the USA: A Retrospective Database Analysis. Adv. Ther. 2018, 35, 1905–1919. [Google Scholar] [CrossRef]
- Hammoudeh, Z.A.; Antonova, O.; Staneva, R.; Nikolova, D.; Kyuchukov, Y.; Penev, A.; Mintchev, T.; Koleva, V.; Hadjidekova, S.; Toncheva, D. Detecting EGFR mutations in patients with non-small cell lung cancer. Balk. J. Med. Genet. 2018, 21, 13–18. [Google Scholar] [CrossRef] [Green Version]
- Bironzo, P.; Reale, M.L.; Sperone, T.; Tabbò, F.; Caglio, A.; Listì, A.; Passiglia, F.; Di Maio, M.; Righi, L.; Bussolino, F.; et al. Clinical and molecular features of epidermal growth factor receptor (Egfr) mutation positive non-small-cell lung cancer (nsclc) patients treated with tyrosine kinase inhibitors (tkis): Predictive and prognostic role of co-mutations. Cancers 2021, 13, 2425. [Google Scholar] [CrossRef]
- Greenhalgh, J.; Dwan, K.; Boland, A.; Bates, V.; Vecchio, F.; Dundar, Y.; Jain, P.; Green, J.A. First-line treatment of advanced epidermal growth factor receptor (EGFR) mutation positive non-squamous non-small cell lung cancer. Cochrane Database Syst. Rev. 2016. [Google Scholar] [CrossRef] [PubMed]
- Borghaei, H.; Paz-Ares, L.; Horn, L.; Spigel, D.R.; Steins, M.; Ready, N.E.; Chow, L.Q.; Vokes, E.E.; Felip, E.; Holgado, E.; et al. Nivolumab versus docetaxel in advanced nonsquamous non-small-cell lung cancer. N. Engl. J. Med. 2015, 373, 1627–1639. [Google Scholar] [CrossRef] [PubMed]
- Suda, K.; Tomizawa, K.; Mitsudomi, T. Biological and clinical significance of KRAS mutations in lung cancer: An oncogenic driver that contrasts with EGFR mutation. Cancer Metastasis Rev. 2010, 29, 49–60. [Google Scholar] [CrossRef] [PubMed]
- Román, M.; Baraibar, I.; López, I.; Nadal, E.; Rolfo, C.; Vicent, S.; Gil-Bazo, I. KRAS oncogene in non-small cell lung cancer: Clinical perspectives on the treatment of an old target. Mol. Cancer 2018, 17, 33. [Google Scholar] [CrossRef] [Green Version]
- Massarelli, E.; Varella-Garcia, M.; Tang, X.; Xavier, A.C.; Ozburn, N.C.; Liu, D.D.; Bekele, B.N.; Herbst, R.S.; Wistuba, I.I. KRAS mutation is an important predictor of resistance to therapy with epidermal growth factor receptor tyrosine kinase inhibitors in non-small cell lung cancer. Clin. Cancer Res. 2007, 13, 2890–2896. [Google Scholar] [CrossRef] [Green Version]
- Yang, H.; Liang, S.Q.; Schmid, R.A.; Peng, R.W. New horizons in KRAS-mutant lung cancer: Dawn after darkness. Front. Oncol. 2019, 9, 953. [Google Scholar] [CrossRef] [PubMed] [Green Version]
- Morgado, J.; Pereira, T.; Silva, F.; Freitas, C.; Negrão, E.; de Lima, B.F.; da Silva, M.C.; Madureira, A.J.; Ramos, I.; Hespanhol, V.; et al. Machine learning and feature selection methods for egfr mutation status prediction in lung cancer. Appl. Sci. 2021, 11, 3273. [Google Scholar] [CrossRef]
- Zhu, Y.; Guo, Y.-B.; Xu, D.; Zhang, J.; Liu, Z.-G.; Wu, X.; Yang, X.-Y.; Chang, D.-D.; Xu, M.; Yan, J.; et al. A computed tomography (CT)-derived radiomics approach for predicting primary co-mutations involving TP53 and epidermal growth factor receptor (EGFR) in patients with advanced lung adenocarcinomas (LUAD). Ann. Transl. Med. 2021, 9, 545. [Google Scholar] [CrossRef]
- Moreno, S.; Bonfante, M.; Zurek, E.; Cherezov, D.; Goldgof, D.; Hall, L.; Schabath, M. A Radiogenomics Ensemble to Predict EGFR and KRAS Mutations in NSCLC. Tomography 2021, 7, 154. [Google Scholar] [CrossRef]
- Dong, Y.; Hou, L.; Yang, W.; Han, J.; Wang, J.; Qiang, Y.; Zhao, J.; Hou, J.; Song, K.; Ma, Y.; et al. Multi-channel multi-task deep learning for predicting EGFR and KRAS mutations of non-small cell lung cancer on CT images. Quant. Imaging Med. Surg. 2021, 11, 2354–2375. [Google Scholar] [CrossRef] [PubMed]
- Yamada, M.; Arimura, H.; Ninomiya, K.; Soufi, M. Automated classification of histological subtypes of NSCLC using support vector machines with radiomic features. In Proceedings of the International Forum on Medical Imaging in Asia 2019; Fujita, H., Lin, F., Kim, J.H., Eds.; SPIE: Bellingham, WA, USA, 2019; Volume 11050, p. 37. [Google Scholar]
- Koyasu, S.; Nishio, M.; Isoda, H.; Nakamoto, Y.; Togashi, K. Usefulness of gradient tree boosting for predicting histological subtype and EGFR mutation status of non-small cell lung cancer on 18F FDG-PET/CT. Ann. Nucl. Med. 2020, 34, 49–57. [Google Scholar] [CrossRef] [PubMed]
- Rizzo, S.; Petrella, F.; Buscarino, V.; De Maria, F.; Raimondi, S.; Barberis, M.; Fumagalli, C.; Spitaleri, G.; Rampinelli, C.; De Marinis, F.; et al. CT Radiogenomic Characterization of EGFR, K-RAS, and ALK Mutations in Non-Small Cell Lung Cancer. Eur. Radiol. 2016, 26, 32–42. [Google Scholar] [CrossRef] [PubMed]
- Wang, H.; Schabath, M.B.; Liu, Y.; Stringfield, O.; Balagurunathan, Y.; Heine, J.J.; Eschrich, S.A.; Ye, Z.; Gillies, R.J. Association Between Computed Tomographic Features and Kirsten Rat Sarcoma Viral Oncogene Mutations in Patients with Stage I Lung Adenocarcinoma and Their Prognostic Value. Clin. Lung Cancer 2016, 17, 271–278. [Google Scholar] [CrossRef] [PubMed] [Green Version]
- Li, X.; Yin, G.; Zhang, Y.; Dai, D.; Liu, J.; Chen, P.; Zhu, L.; Ma, W.; Xu, W. Predictive Power of a Radiomic Signature Based on 18F-FDG PET/CT Images for EGFR Mutational Status in NSCLC. Front. Oncol. 2019, 9, 1062. [Google Scholar] [CrossRef] [PubMed] [Green Version]
- Zhu, X.; Dong, D.; Chen, Z.; Fang, M.; Zhang, L.; Song, J.; Yu, D.; Zang, Y.; Liu, Z.; Shi, J.; et al. Radiomic signature as a diagnostic factor for histologic subtype classification of non-small cell lung cancer. Eur. Radiol. 2018, 28, 2772–2778. [Google Scholar] [CrossRef] [PubMed]
- Oikonomou, E.K.; Williams, M.C.; Kotanidis, C.P.; Desai, M.Y.; Marwan, M.; Antonopoulos, A.S.; Thomas, K.E.; Thomas, S.; Akoumianakis, I.; Fan, L.M.; et al. A novel machine learning-derived radiotranscriptomic signature of perivascular fat improves cardiac risk prediction using coronary CT angiography. Eur. Heart J. 2019, 40, 3529–3543. [Google Scholar] [CrossRef] [PubMed]
- Chaddad, A.; Daniel, P.; Sabri, S.; Desrosiers, C.; Abdulkarim, B. Integration of Radiomic and Multi-omic Analyses Predicts Survival of Newly Diagnosed IDH1 Wild-Type Glioblastoma. Cancers 2019, 11, 1148. [Google Scholar] [CrossRef] [Green Version]
- Fan, L.; Cao, Q.; Ding, X.; Gao, D.; Yang, Q.; Li, B. Radiotranscriptomics signature-based predictive nomograms for radiotherapy response in patients with nonsmall cell lung cancer: Combination and association of CT features and serum miRNAs levels. Cancer Med. 2020, 9, 5065–5074. [Google Scholar] [CrossRef]
- Bakr, S.; Gevaert, O.; Echegaray, S.; Ayers, K.; Zhou, M.; Shafiq, M.; Zheng, H.; Benson, J.A.; Zhang, W.; Leung, A.N.C.; et al. A radiogenomic dataset of non-small cell lung cancer. Sci. Data 2018, 5, 180202. [Google Scholar] [CrossRef] [Green Version]
- Rubin, D.L.; Akdogan, M.U.; Altindag, C.; Alkim, E. ePAD: An Image Annotation and Analysis Platform for Quantitative Imaging. Tomography 2019, 5, 170–183. [Google Scholar] [CrossRef] [PubMed]
- Trivizakis, E. NSCLC Radiogenomics Source Code. Available online: https://github.com/trivizakis/nsclc_radiotranscriptomics (accessed on 8 June 2021).
- Razavian, A.S.; Azizpour, H.; Sullivan, J.; Carlsson, S. CNN Features Off-the-Shelf: An Astounding Baseline for Recognition. In Proceedings of the 2014 IEEE Conference on Computer Vision and Pattern Recognition Workshops, Columbus, OH, USA, 23–28 June 2014; Lehmann, P.H., Ed.; IEEE: Piscataway, NJ, USA, 2014; Volume 7389, pp. 512–519. [Google Scholar]
- Oquab, M.; Bottou, L.; Laptev, I.; Sivic, J. Learning and transferring mid-level image representations using convolutional neural networks. In Proceedings of the 2014 IEEE Conference on Computer Vision and Pattern Recognition Workshops, Columbus, OH, USA, 23–28 June 2014; pp. 1717–1724. [Google Scholar] [CrossRef] [Green Version]
- Zeiler, M.D.; Fergus, R. Visualizing and Understanding Convolutional Networks. In Proceedings of the Computer Vision—ECCV 2014, Zurich, Switzerland, 6–12 September 2014; pp. 818–833. [Google Scholar]
- Mormont, R.; Geurts, P.; Maree, R. Comparison of Deep Transfer Learning Strategies for Digital Pathology. In Proceedings of the 2018 IEEE/CVF Conference on Computer Vision and Pattern Recognition Workshops (CVPRW), Salt Lake City, UT, USA, 18–22 June 2018; IEEE: Piscataway, NJ, USA, 2018; pp. 2343–234309. [Google Scholar]
- Shin, H.C.; Roth, H.R.; Gao, M.; Lu, L.; Xu, Z.; Nogues, I.; Yao, J.; Mollura, D.; Summers, R.M. Deep Convolutional Neural Networks for Computer-Aided Detection: CNN Architectures, Dataset Characteristics and Transfer Learning. IEEE Trans. Med. Imaging 2016, 35, 1285–1298. [Google Scholar] [CrossRef] [PubMed] [Green Version]
- Ribeiro, E.; Uhl, A.; Wimmer, G.; Häfner, M. Transfer Learning for Colonic Polyp Classification Using Off-the-Shelf CNN Features. In Computer-Assisted and Robotic Endoscopy; Springer: Cham, Switzerland, 2016; Volume 10170, pp. 1–13. [Google Scholar] [CrossRef]
- Zhi, W.; Wing, H.; Yueng, F.; Chen, Z.; Zandavi, S.M.; Lu, Z.; Chung, Y.Y. Using Transfer Learning with Convolutional Neural Networks to Diagnose Breast Cancer from Histopathological Images. In Proceedings of the 24th International Conference on Neural Information Processing, Guangzhou, China, 14–18 November 2017. [Google Scholar] [CrossRef]
- Giannakakis, G.; Trivizakis, E.; Tsiknakis, M.; Marias, K. A novel multi-kernel 1D convolutional neural network for stress recognition from ECG. In Proceedings of the 2019 8th International Conference on Affective Computing and Intelligent Interaction Workshops and Demos (ACIIW), Cambridge, UK, 3–6 September 2019; IEEE: Piscataway, NJ, USA, 2019; pp. 1–4. [Google Scholar]
- Ioannidis, G.S.; Trivizakis, E.; Metzakis, I.; Papagiannakis, S.; Lagoudaki, E.; Marias, K. Pathomics and Deep Learning Classification of a Heterogeneous Fluorescence Histology Image Dataset. Appl. Sci. 2021, 11, 3796. [Google Scholar] [CrossRef]
- Deng, J.; Dong, W.; Socher, R.; Li, L.-J.; Li, K.; Fei-Fei, L. ImageNet: A Large-Scale Hierarchical Image Database. In Proceedings of the 2009 IEEE Conference on Computer Vision and Pattern Recognition, Miami, FL, USA, 20–25 June 2009. [Google Scholar]
- Simonyan, K.; Zisserman, A. Very Deep Convolutional Networks for Large-Scale Image Recognition. arXiv 2014, arXiv:1409.1556. [Google Scholar]
- Szegedy, C.; Vanhoucke, V.; Ioffe, S.; Shlens, J.; Wojna, Z. Rethinking the Inception Architecture for Computer Vision. In Proceedings of the IEEE Computer Society Conference on Computer Vision and Pattern Recognition, Las Vegas, NV, USA, 27–30 June 2016; IEEE Computer Society: Piscataway, NJ, USA, 2016; pp. 2818–2826. [Google Scholar]
- Chollet, F. Xception: Deep learning with depthwise separable convolutions. In Proceedings of the 30th IEEE Conference on Computer Vision and Pattern Recognition, CVPR 2017, Honolulu, HI, USA, 21–26 July 2017; Institute of Electrical and Electronics Engineers Inc.: Piscataway, NJ, USA, 2017; pp. 1800–1807. [Google Scholar]
- He, K.; Zhang, X.; Ren, S.; Sun, J. Deep residual learning for image recognition. In Proceedings of the IEEE Computer Society Conference on Computer Vision and Pattern Recognition, Las Vegas, NV, USA, 27–30 June 2016; IEEE Computer Society: Piscataway, NJ, USA, 2016; pp. 770–778. [Google Scholar]
- Zoph, B.; Vasudevan, V.; Shlens, J.; Le, Q.V. Learning Transferable Architectures for Scalable Image Recognition. arXiv 2017, arXiv:1707.07012. [Google Scholar]
- Howard, A.G.; Zhu, M.; Chen, B.; Kalenichenko, D.; Wang, W.; Weyand, T.; Andreetto, M.; Adam, H. MobileNets: Efficient Convolutional Neural Networks for Mobile Vision Applications. arXiv 2017, arXiv:1704.04861. [Google Scholar]
- Huang, G.; Liu, Z.; van der Maaten, L.; Weinberger, K.Q. Densely Connected Convolutional Networks. arXiv 2016, arXiv:1608.06993. [Google Scholar]
- Chollet, F. Others Keras. Available online: https://keras.io (accessed on 8 June 2021).
- Van Griethuysen, J.J.M.; Fedorov, A.; Parmar, C.; Hosny, A.; Aucoin, N.; Narayan, V.; Beets-Tan, R.G.H.; Fillion-Robin, J.C.; Pieper, S.; Aerts, H.J.W.L. Computational radiomics system to decode the radiographic phenotype. Cancer Res. 2017, 77, e104–e107. [Google Scholar] [CrossRef] [PubMed] [Green Version]
- Zhang, J.; Zhu, N.; Chen, X. A novel long noncoding RNA LINC01133 is upregulated in lung squamous cell cancer and predicts survival. Tumor Biol. 2015, 36, 7465–7471. [Google Scholar] [CrossRef]
- Bakr, S.; Gevaert, O.; Plevritis, S.K. Identification of Relationships between Molecular and Imaging Phenotypes in Non-Small Cell Lung Cancer Using Radiogenomics Map. Available online: https://www.ncbi.nlm.nih.gov/geo/query/acc.cgi?acc=GSE103584 (accessed on 1 January 2021).
- Chawla, N.V.; Bowyer, K.W.; Hall, L.O.; Kegelmeyer, W.P. SMOTE: Synthetic Minority Over-sampling Technique. J. Artif. Intell. Res. 2002, 16, 321–357. [Google Scholar] [CrossRef]
- Pedregosa, F.; Varoquaux, G.; Gramfort, A.; Michel, V.; Thirion, B.; Grisel, O.; Blondel, M.; Prettenhofer, P.; Weiss, R.; Dubourg, V.; et al. Scikit-learn: Machine Learning in {P}ython. J. Mach. Learn. Res. 2011, 12, 2825–2830. [Google Scholar]
- Mielgo-Rubio, X.; Calvo, V.; Luna, J.; Remon, J.; Martín, M.; Berraondo, P.; Jarabo, J.R.; Higuera, O.; Conde, E.; De Castro, J.; et al. Immunotherapy Moves to the Early-Stage Setting in Non-Small Cell Lung Cancer: Emerging Evidence and the Role of Biomarkers. Cancers 2020, 12, 3459. [Google Scholar] [CrossRef]
- Ntzifa, A.; Kotsakis, A.; Georgoulias, V.; Lianidou, E. Detection of EGFR Mutations in Plasma cfDNA and Paired CTCs of NSCLC Patients before and after Osimertinib Therapy Using Crystal Digital PCR. Cancers 2021, 13, 2736. [Google Scholar] [CrossRef]
- Alhaddad, L.; Pustovalova, M.; Blokhina, T.; Chuprov-Netochin, R.; Osipov, A.N.; Leonov, S. IR-Surviving NSCLC Cells Exhibit Different Patterns of Molecular and Cellular Reactions Relating to the Multifraction Irradiation Regimen and p53-Family Proteins Expression. Cancers 2021, 13, 2669. [Google Scholar] [CrossRef]
- Hu, W.; Wang, G.; Yarmus, L.B.; Wan, Y. Combined Methylome and Transcriptome Analyses Reveals Potential Therapeutic Targets for EGFR Wild Type Lung Cancers with Low PD-L1 Expression. Cancers 2020, 12, 2496. [Google Scholar] [CrossRef] [PubMed]
- Soundararajan, R.; Fradette, J.J.; Konen, J.M.; Moulder, S.; Zhang, X.; Gibbons, D.L.; Varadarajan, N.; Wistuba, I.I.; Tripathy, D.; Bernatchez, C.; et al. Targeting the Interplay between Epithelial-to-Mesenchymal-Transition and the Immune System for Effective Immunotherapy. Cancers 2019, 11, 714. [Google Scholar] [CrossRef] [PubMed] [Green Version]
- Zhang, T.; Xu, Z.; Liu, G.; Jiang, B.; de Bock, G.H.; Groen, H.J.M.; Vliegenthart, R.; Xie, X. Simultaneous identification of egfr, kras, erbb2, and tp53 mutations in patients with non-small cell lung cancer by machine learning-derived three-dimensional radiomics. Cancers 2021, 13, 1814. [Google Scholar] [CrossRef]
- Yang, F.; Chen, W.; Wei, H.; Zhang, X.; Yuan, S.; Qiao, X.; Chen, Y.W. Machine Learning for Histologic Subtype Classification of Non-Small Cell Lung Cancer: A Retrospective Multicenter Radiomics Study. Front. Oncol. 2021, 10, 608598. [Google Scholar] [CrossRef] [PubMed]
- Liu, J.; Cui, J.; Liu, F.; Yuan, Y.; Guo, F.; Zhang, G. Multi-subtype classification model for non-small cell lung cancer based on radiomics: SLS model. Med. Phys. 2019, 46, 3091–3100. [Google Scholar] [CrossRef]
- Liu, S.; Liu, S.; Zhang, C.; Yu, H.; Liu, X.; Hu, Y.; Xu, W.; Tang, X.; Fu, Q. Exploratory Study of a CT Radiomics Model for the Classification of Small Cell Lung Cancer and Non-small-Cell Lung Cancer. Front. Oncol. 2020, 10, 1268. [Google Scholar] [CrossRef] [PubMed]
- Trivizakis, E.; Ioannidis, G.S.; Souglakos, I.; Karantanas, A.H.; Tzardi, M.; Marias, K. A neural pathomics framework for classifying colorectal cancer histopathology images based on wavelet multi-scale texture analysis. Sci. Rep. 2021, 11, 15546. [Google Scholar] [CrossRef]
- Bianconi, F.; Palumbo, I.; Spanu, A.; Nuvoli, S.; Fravolini, M.L.; Palumbo, B. PET/CT radiomics in lung cancer: An overview. Appl. Sci. 2020, 10, 1718. [Google Scholar] [CrossRef] [Green Version]
- Wang, Y.; Han, R.; Wang, Q.; Zheng, J.; Lin, C.; Lu, C.; Li, L.; Chen, H.; Jin, R.; He, Y. Biological significance of18F-FDG PET/CT maximum standard uptake value for predicting egfr mutation status in non-small cell lung cancer patients. Int. J. Gen. Med. 2021, 14, 347–356. [Google Scholar] [CrossRef] [PubMed]
- Sun, X.; Xiao, Z.; Chen, G.; Han, Z.; Liu, Y.; Zhang, C.; Sun, Y.; Song, Y.; Wang, K.; Fang, F.; et al. A PET imaging approach for determining EGFR mutation status for improved lung cancer patient management. Sci. Transl. Med. 2018, 10. [Google Scholar] [CrossRef] [PubMed] [Green Version]
- Wang, S.; Shi, J.; Ye, Z.; Dong, D.; Yu, D.; Zhou, M.; Liu, Y.; Gevaert, O.; Wang, K.; Zhu, Y.; et al. Predicting EGFR Mutation Status in Lung Adenocarcinoma on CT Image Using Deep Learning. Eur. Respir. J. 2019, 53, 1800986. [Google Scholar] [CrossRef] [PubMed]
- Cao, H.; Bernard, S.; Sabourin, R.; Heutte, L. Random forest dissimilarity based multi-view learning for Radiomics application. Pattern Recognit. 2019, 88, 185–197. [Google Scholar] [CrossRef]
- Krzak, M.; Raykov, Y.; Boukouvalas, A.; Cutillo, L.; Angelini, C. Benchmark and Parameter Sensitivity Analysis of Single-Cell RNA Sequencing Clustering Methods. Front. Genet. 2019, 10, 1253. [Google Scholar] [CrossRef] [Green Version]
- Cui, W.; Xue, H.; Wei, L.; Jin, J.; Tian, X.; Wang, Q. High heterogeneity undermines generalization of differential expression results in RNA-Seq analysis. Hum. Genom. 2021, 15, 7. [Google Scholar] [CrossRef]
- Jia, Q.; Wu, W.; Wang, Y.; Alexander, P.B.; Sun, C.; Gong, Z.; Cheng, J.N.; Sun, H.; Guan, Y.; Xia, X.; et al. Local mutational diversity drives intratumoral immune heterogeneity in non-small cell lung cancer. Nat. Commun. 2018, 9, 5361. [Google Scholar] [CrossRef] [PubMed]
- Stencel, K.; Chmielewska, I.; Milanowski, J.; Ramlau, R. Non-small-cell lung cancer: New rare targets—New targeted therapies—state of the art and future directions. Cancers 2021, 13, 1829. [Google Scholar] [CrossRef]
- Schulze, A.B.; Evers, G.; Kerkhoff, A.; Mohr, M.; Schliemann, C.; Berdel, W.E.; Schmidt, L.H. Future options of molecular-targeted therapy in small cell lung cancer. Cancers 2019, 11, 690. [Google Scholar] [CrossRef] [Green Version]


| Experiments | Classifier | Feature Type | Over-Sampling | ACC | AUC | SN | SPC |
|---|---|---|---|---|---|---|---|
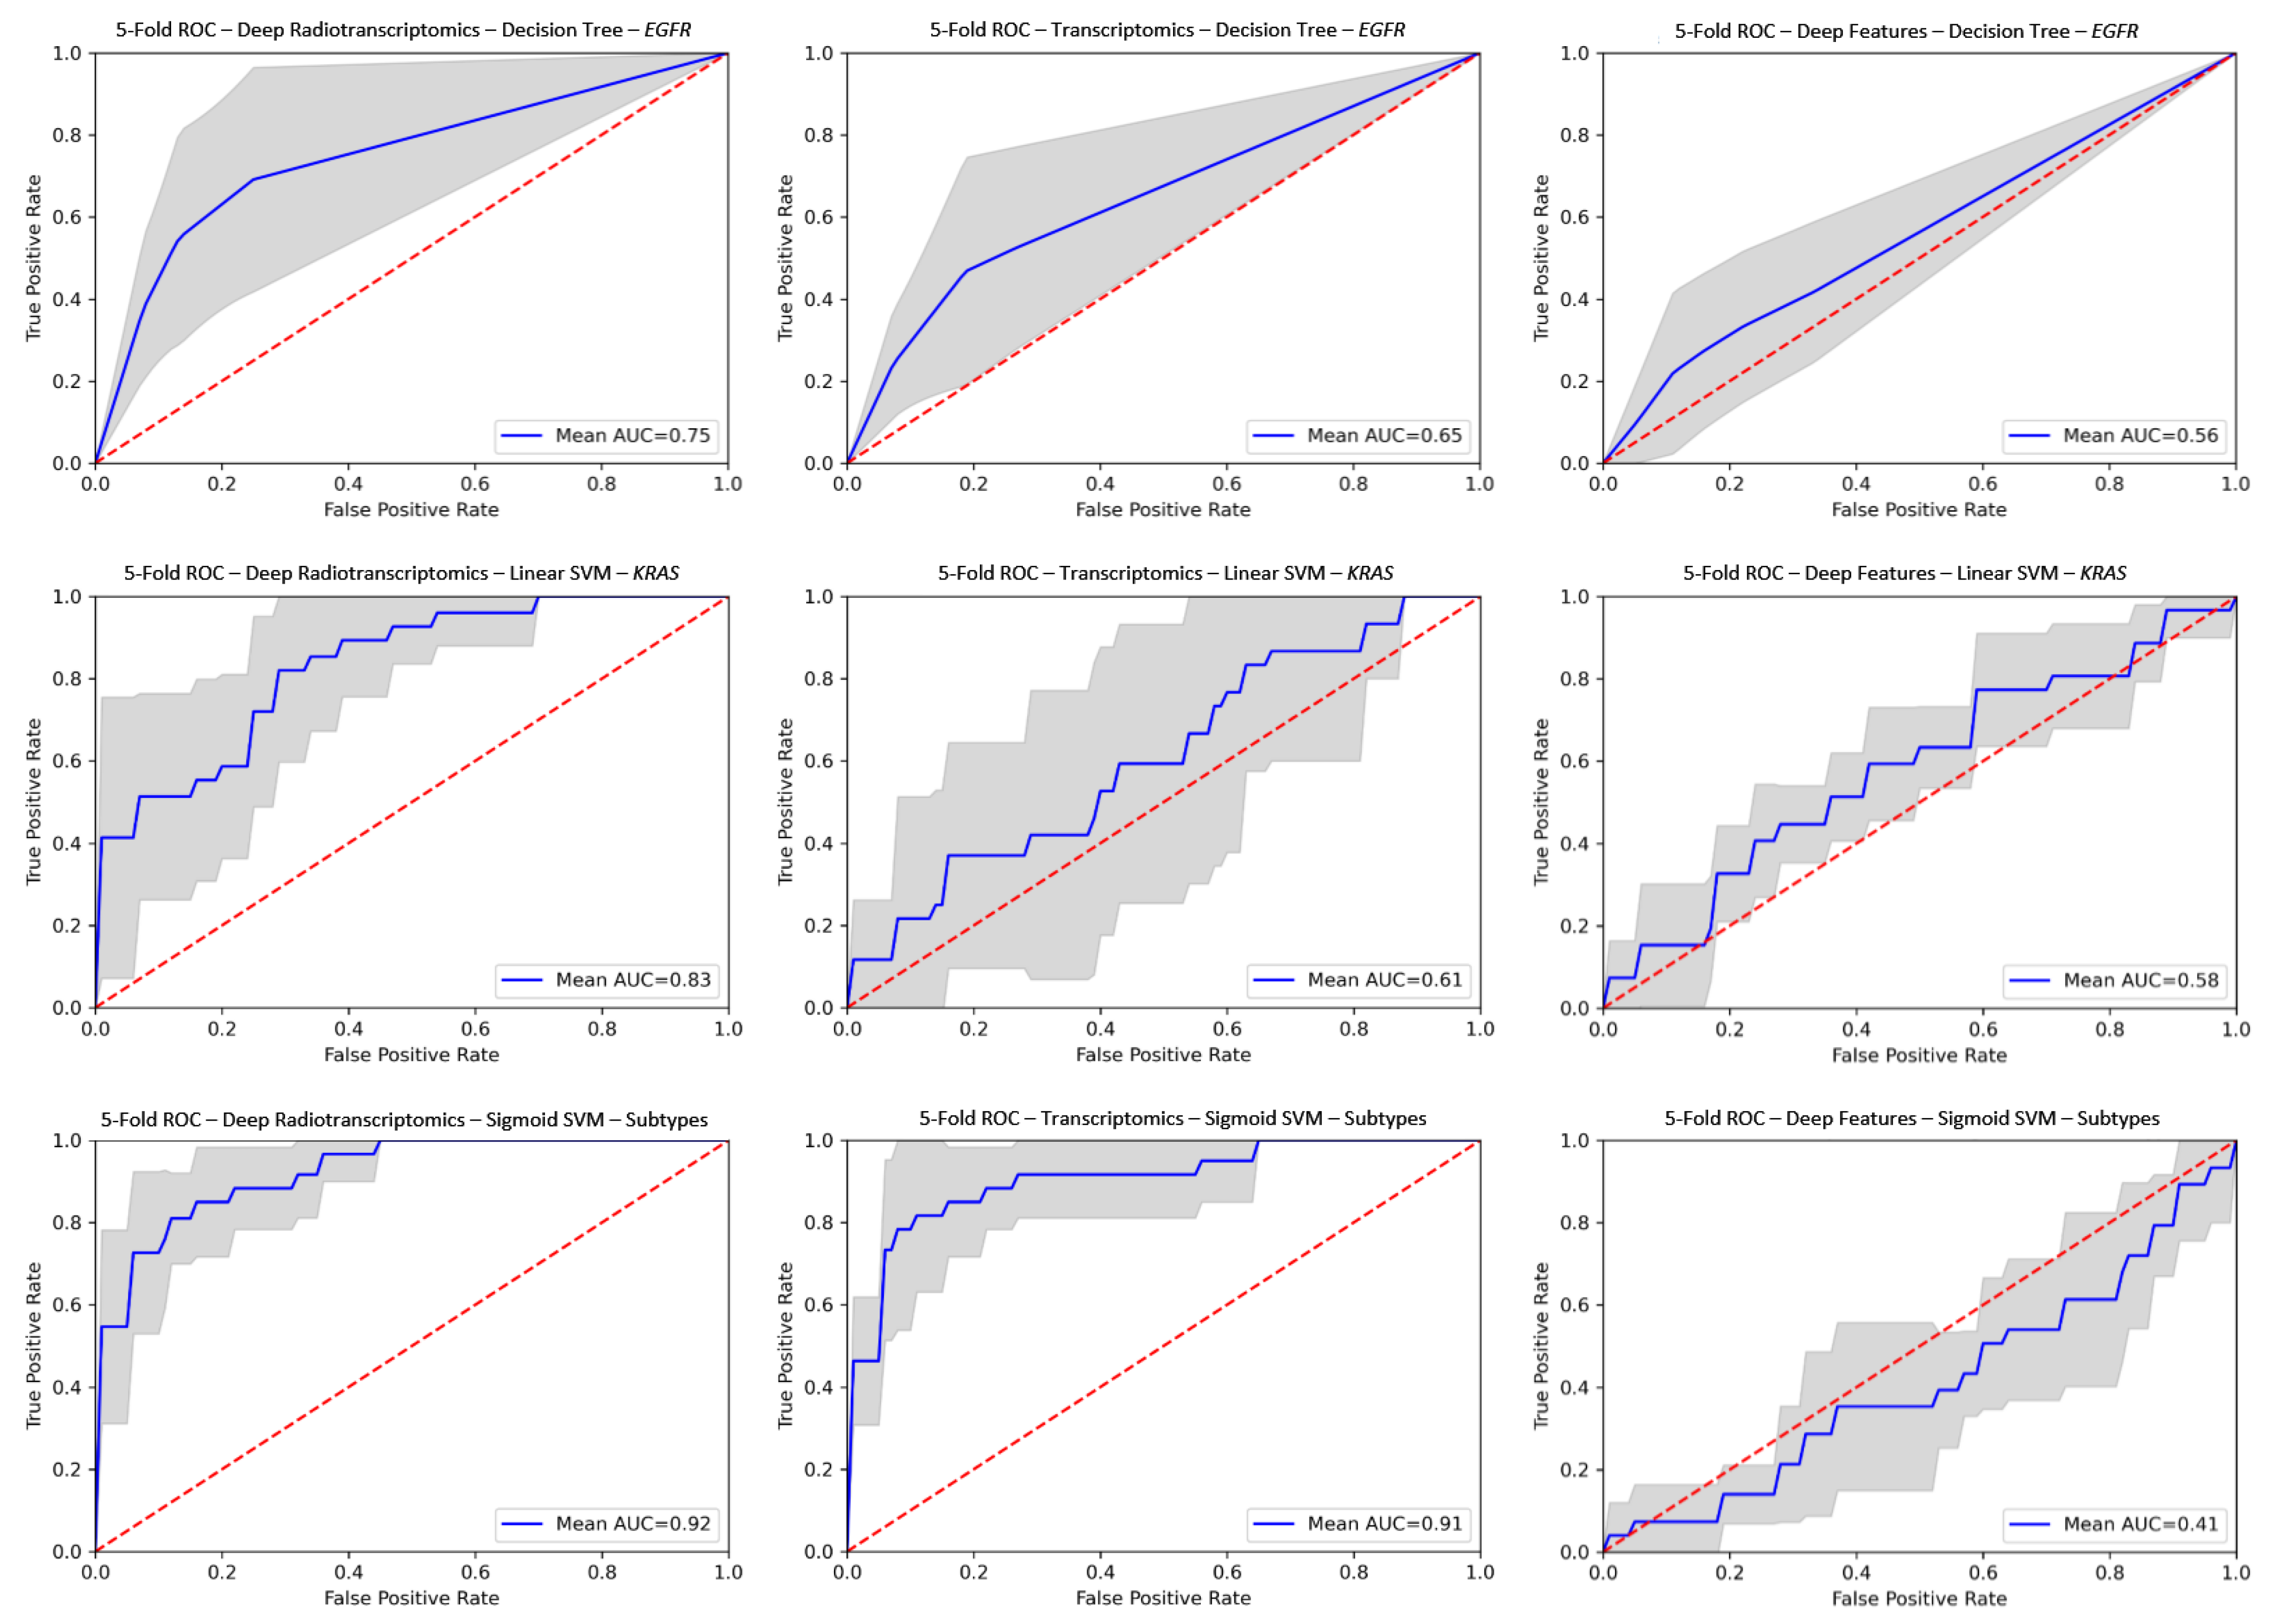
| EGFR | Decision Tree | ResNet | SMOTE | 0.805 ± 0.05 | 0.747 ± 0.14 | 0.627 ± 0.33 | 0.869 ± 0.06 |
| KRAS | Linear SVM | DenseNet | No | 0.865 ± 0.08 | 0.831 ± 0.09 | 0.512 ± 0.25 | 0.974 ± 0.03 |
| Histology Subtypes | Sigmoid SVM | ResNet | No | 0.888 ± 0.07 | 0.925 ± 0.04 | 0.743 ± 0.16 | 0.933 ± 0.06 |
| EGFR | Sigmoid SVM | Radiomics-based | SMOTE | 0.761 ± 0.10 | 0.726 ± 0.10 | 0.600 ± 0.16 | 0.800 ± 0.11 |
| KRAS | Linear SVM | No | 0.730 ± 0.05 | 0.719 ± 0.07 | 0.34 ± 0.27 | 0.883 ± 0.08 | |
| Histology Subtypes | Linear SVM | No | 0.907 ± 0.05 | 0.943 ± 0.03 | 0.797 ± 0.12 | 0.941 ± 0.03 |
| EGFR | KRAS | Histological Subtypes | |
|---|---|---|---|
| Proposed Traditional Radiotranscriptomics | 0.726 ± 0.10 | 0.719 ± 0.07 | 0.942 ± 0.03 |
| Proposed Deep Radiotranscriptomics | 0.747±0.14 | 0.831 ± 0.09 | 0.924 ± 0.04 |
| Morgado et al. [17] | 0.737 | - | - |
| Moreno et al. [19] | up to 0.82 | up to 0.778 | - |
| Dong et al. [20] | 0.751 | 0.696 | - |
| Yamada et al. [21] | - | - | 0.754 |
| Koyasu et al. [22] | 0.659 | - | 0.843 |
| Rizzo et al. [23] | 0.823 | 0.667 | - |
| Li et al. [25] | 0.667 | - | - |
| Zhu et al. [26] | - | - | 0.893 |
Publisher’s Note: MDPI stays neutral with regard to jurisdictional claims in published maps and institutional affiliations. |
© 2021 by the authors. Licensee MDPI, Basel, Switzerland. This article is an open access article distributed under the terms and conditions of the Creative Commons Attribution (CC BY) license (https://creativecommons.org/licenses/by/4.0/).
Share and Cite
Trivizakis, E.; Souglakos, J.; Karantanas, A.; Marias, K. Deep Radiotranscriptomics of Non-Small Cell Lung Carcinoma for Assessing Molecular and Histology Subtypes with a Data-Driven Analysis. Diagnostics 2021, 11, 2383. https://doi.org/10.3390/diagnostics11122383
Trivizakis E, Souglakos J, Karantanas A, Marias K. Deep Radiotranscriptomics of Non-Small Cell Lung Carcinoma for Assessing Molecular and Histology Subtypes with a Data-Driven Analysis. Diagnostics. 2021; 11(12):2383. https://doi.org/10.3390/diagnostics11122383
Chicago/Turabian StyleTrivizakis, Eleftherios, John Souglakos, Apostolos Karantanas, and Kostas Marias. 2021. "Deep Radiotranscriptomics of Non-Small Cell Lung Carcinoma for Assessing Molecular and Histology Subtypes with a Data-Driven Analysis" Diagnostics 11, no. 12: 2383. https://doi.org/10.3390/diagnostics11122383