Article

The Oncogenic Roles of PTTG1 and PTTG2 Genes and Pseudogene PTTG3P in Head and Neck Squamous Cell Carcinomas

1
Department of Cancer Immunology, Chair of Medical Biotechnology, Poznan University of Medical Sciences, 8 Rokietnicka Street, 60-806 Poznan, Poland
2
Laboratory of Cancer Genetics, 15 Garbary Street, 61-866 Poznan, Poland
3
Postgraduate School of Molecular Medicine, Medical University of Warsaw, 61 Zwirki i Wigury Street, 02-091 Warsaw, Poland
4
Department of Oncologic Pathology and Prophylaxis, Poznan University of Medical Sciences, Greater Poland Cancer Center, 15 Garbary Street, 61-866 Poznan, Poland
5
Department of Pathology, Pomeranian Medical University, 1 Unii Lubelskiej Street, 71-242 Szczecin, Poland
6
Department of Diagnostics and Cancer Immunology, Greater Poland Cancer Centre, 15 Garbary Street, 61-866 Poznan, Poland
*
Author to whom correspondence should be addressed.
Diagnostics 2020, 10(8), 606; https://doi.org/10.3390/diagnostics10080606
Submission received: 29 June 2020 / Revised: 13 August 2020 / Accepted: 14 August 2020 / Published: 18 August 2020
(This article belongs to the Special Issue Biomarkers of Oral Cancer)

Abstract

:
Background: Head and neck squamous cell carcinomas are a group of heterogeneous diseases that occur in the mouth, pharynx and larynx and are characterized by poor prognosis. A low overall survival rate leads to a need to develop biomarkers for early head and neck squamous cell carcinomas detection, accurate prognosis and appropriate selection of therapy. Therefore, in this paper, we investigate the biological role of the PTTG3P pseudogene and associated genes PTTG1 and PTTG2 and their potential use as biomarkers. Methods: Based on TCGA data and the UALCAN database, PTTG3P, PTTG1 and PTTG2 expression profiles and clinicopathological features with TP53 gene status as well as expression levels of correlated genes were analyzed in patients’ tissue samples. The selected genes were classified according to their biological function using the PANTHER tool. Gene Set Enrichment Analysis software was used for functional enrichment analysis. All statistical analyses were performed using GraphPad Prism 5. Results: In head and neck squamous cell carcinomas, significant up-regulation of the PTTG3P pseudogene, PTTG1 and PTTG2 genes’ expression between normal and cancer samples were observed. Moreover, the expression of PTTG3P, PTTG1 and PTTG2 depends on the type of mutation in TP53 gene, and they correlate with genes from p53 pathway. PTTG3P expression was significantly correlated with PTTG1 as well as PTTG2, as was PTTG1 expression with PTTG2. Significant differences between expression levels of PTTG3P, PTTG1 and PTTG2 in head and neck squamous cell carcinomas patients were also observed in clinicopathological contexts. The contexts taken into consideration included: T-stage for PTTG3P; grade for PTTG3, PTTG1 and PTTG2; perineural invasion and lymph node neck dissection for PTTG1 and HPV p16 status for PTTG3P, PTTG1 and PTTG2. A significantly longer disease-free survival for patients with low expressions of PTTG3P and PTTG2, as compared to high expression groups, was also observed. Gene Set Enrichment Analysis indicated that the PTTG3 high-expressing group of patients have the most deregulated genes connected with DNA repair, oxidative phosphorylation and peroxisome pathways. For PTTG1, altered genes are from DNA repair groups, Myc targets, E2F targets and oxidative phosphorylation pathways, while for PTTG2, changes in E2F targets, G2M checkpoints and oxidative phosphorylation pathways are indicated. Conclusions: PTTG3P and PTTG2 can be used as a prognostic biomarker in head and neck squamous cell carcinomas diagnostics. Moreover, patients with high expressions of PTTG3P, PTTG1 or PTTG2 have worse outcomes due to upregulation of oncogenic pathways and more aggressive phenotypes.

1. Introduction

Head and neck squamous cell carcinomas (HNSCCs) belong to the most prevalent cancers, with an annual incidence of 600,000 cases [1]. These cancers are anatomically located in the oral cavity, the nasal cavity, the nasopharynx, the oropharynx, paranasal sinuses, the hypopharynx and the larynx. HNSCCs develop mostly via chemical carcinogenesis, and the main risk factors are alcohol, tobacco use and human papillomavirus (HPV) infections [1,2,3]. Treatments include surgical eradication, radiotherapy (RT) and chemotherapy (CT), but they are associated with a reduction in life expectancy and quality of life. There is an urgent need for more effective therapies to improve treatment outcomes [4].
The main cause of death is metastasis, which in HNSCC is most commonly formed in the cervical lymph nodes. The absence of clinical symptoms makes it impossible to detect this type of cancer in the early stages of the disease. Molecular markers such as cell cycle regulators, cell adhesion proteins and growth factors for cancer metastasis have recently been studied [5].
The latest class of studied biomarkers are non-coding RNAs (ncRNAs), which can be distinguished into two main groups: short RNAs (e.g., miRNAs) and long RNAs (lncRNAs). These molecules are well known elements of the competitive endogenous RNA (ceRNA) network. However, recent studies revealed new elements of the ceRNA network, which are RNA pseudogene transcripts [6].
Pseudogenes are relicts of parental genes, which have lost their original functions through accumulation of mutations. The aforementioned functions include the capability to synthesize proteins due to events such as insertions, premature stop codons, frameshift-causing deletions and splicing errors [7]. However, reports indicate that they have defined roles in the regulation of gene expression [6,8]. Based on the structure and origin of pseudogenes, they were divided into two groups, processed and unprocessed transcripts, which contain introns [8]. Pseudogenes and corresponding protein-coding genes can talk with each other, pseudogene 1 (PTENp1) being a notable example, as it contains elements of the miRNA response (MRE) shared by the corresponding gene encoding protein, PTEN. Thus, the pseudogene and the coding gene compete for the same miRNAs [7]. It was indicated that PTENp1 is involved in oral squamous cell carcinoma (OSCC) [9]. PTENp1 acts as a potential tumor suppressor due to the reduction of its copy number, independent of PTEN. It has also shown examples of ectopic expression of PTENP1 inhibited proliferation, colony formation and migration of HNSCC cells, which proves that PTENP1 may serve as a prognostic factor in patients with HNSCC [10].
Recently, the pituitary tumor processing gene (PTTG) family was described in the context of carcinogenesis. The PTTG family includes two genes with protein products PTTG1, PTTG2 and one processed pseudogene, PTTG3P [11]. The protein product of the pituitary tumor processing gene (PTTG) was isolated for the first time from a rat’s pituitary gland tumor cells and shown to be transforming in vitro and tumorigenic in vivo [12]. It was demonstrated that the pituitary tumor transforming gene (PTTG) plays a role in tumor initiation and progression, including mitosis control, cell transformation and DNA repair [13]. The first one, PTTG1 regulator of sister chromatid separation, securin (previously named as pituitary tumor-transforming gene 1-PTTG1 or tumor-transforming protein 1-TUTR1) is a member of the family of securin proteins. PTTG1 displays many biological functions such as DNA repair, the inhibition of sister chromatid separation, organ development and the regulation of expression and secretion of angiogenic and metastatic factors [14]. The second member of the PTTG family is the pituitary tumor-transforming gene 2 (PTTG2). PTTG2 is considered to be a regulator of the cell circadian clock, functioning in cell mitosis, differentiation and apoptosis [15]. The latter is a pituitary tumor-transforming 3 pseudogene (PTTG3P; previous symbol: PTTG3). It is an intronless gene highly homologous to PTTG1 and PTTG2 [16]. PTTG3P can be expressed in a variety of normal adult tissues [16]. Moreover, it has a limited protein-coding capacity, and thus, it is regarded as one long non-coding RNA (lncRNA). The mechanisms of PTTG3P functions are not yet well understood, but it has been demonstrated that PTTG3P promotes both proliferation and invasion throght upregulation of PTTG1 and is an indicator of bad prognosis in cervical cancer and hepatocellular carcinoma [17,18].
It should be noted that the PTTG family interacts with p53. For example, PTTG1 is thought to influence p53 activity by blocking p53 binding to DNA [19]. Moreover, Méndez-Vidal et al. indicated that PTTG2 silencing results in increased levels of p53 protein [20]. Suppressor p53 serves an important role in the cellular homeostasis maintenance [21]. Mutations in TP53 gene are prevalent in many cancers, including HNSCC [21,22]. Studies suggest that evaluation of TP53 mutation type may have a prognostic value and could prove useful in predicting response to radio- and chemotherapy as well as become a potential target for new therapeutic strategies [22]. Mutations in p53 can be divided into two main groups: DNA contact mutations (such as R273H and R280K) and conformational mutations (such as R175H and V143A). Missense mutations in the DNA-binding domain are the most common ones among TP53 mutations [22]. It should be noted that besides loss-of-function of wild type p53 and dominant-negative forms of p53, some mutations cause gain-of-function and lead to tumor progression, metastatic potential as well as may influence drug resistance [23]. Recently, Caponio et al. confirmed that classification of HNSCC patients based on TP53 mutation types serves as an independent prognostic factor. Moreover, specific TP53 mutations are associated with different anatomical sites of HNSCC and modulate its cellular activity in different ways [24].
In this study we examined the expression levels of PTTG3P, PTTG1 and PTTG2 in HNSCC using data from The Cancer Genome Atlas (TCGA), making it the first comprehensive study of its kind based on a large group of patients. The role of these genes in HNSCC biology and their potential as biomarkers in clinical practice was investigated.

2. Materials and Methods

2.1. TCGA Data

The TCGA expression data of PTTG3P, PTTG1 and PTTG2, as well as the expression of selected genes and clinical data were downloaded from cBioPortal (Head and Neck Squamous Cell Carcinoma, TCGA) [25] and from UALCAN databases (http://ualcan.path.uab.edu) [26]. All data is available online; access is unrestricted and does not require patient’s consent or other permissions. The use of the data does not violate the rights of any person or any institution.

2.2. Data Analysis

The expression levels of PTTG3P, PTTG1 and PTTG2 genes were analyzed and correlated with clinicopathological parameters such as: age (≤60 vs. >60), gender (women vs. men), smoking category (1, 2 vs. 3, 4, 5), alcohol history (negative vs. positive), T-stage (T1 + T2 vs. T3 + T4), N-stage (N0 + N1 vs. N2 + N3), cancer grade (G1 + G2 vs. G3 + G4), cancer stage (I + II vs. III + IV), HPV p16 marker (negative vs. positive), perineural invasion (negative vs. positive), lymphovascular invasion (negative vs. positive), and lymphoid neck dissection status (negative vs. positive) in all localizations of the HNSCC samples. Next, in a group of 522 patients with adequate gene expression, disease-free survival (DFS) and overall survival (OS) data were selected for analysis. DFS and OS probability were estimated in patients with high and low expression of PTTG3P, PTTG1 or PTTG2.

2.3. Gene Analysis

Association between PTTG3P, PTTG1 and PTTG2 expression levels and TP53 was analyzed using UALCAN database. Next, specific mutations in TP53, described previously by Caponio et al. as well as Freed-Pastor and Prives [23,24], and expression levels of PTTG3P, PTTG1 and PTTG2 were analyzed using TCGA data. The mutant p53-interacting partners and genes transcriptionally activated by mutant p53 protein, described by Freed-Pastor and Prives [23], and their correlations with PTTG3P, PTTG1 or PTTG2 were evaluated using StarBase v3.0 database [27].
Genes positively and negatively correlated with PTTG3P, PTTG1 and PTTG2 (Spearman’s correlation R > 0.3 or R < −0.3, respectively) were obtained from cBioportal and analyzed using the REACTOME pathway database [28].

2.4. Functional Enrichment Analysis and Prediction of Gene Function

Gene Set Enrichment Analysis (GSEA) software version 3.0 (http://www.gsea-msigdb.org/gsea/index.jsp) was used for the aforementioned analysis of functional enrichment [29]. HNSCC patients were divided into two groups with high and low expressions of PTTG3P, PTTG1 and PTTG2 (groups divided by the mean of the expression level). The input file contained expression data for 20,530 genes and 565 patients. We used 1000 gene set permutations for the analysis and pathway (hallmark gene sets (H) and collection from MSigDB) with nominal p-value p ≤ 0.05 and FDR ≤ 0.25 were considered significant. Next, the interactions between protein encoding genes in the pathway, which were most significantly enriched in a group of patients with high expression of PTTG3P, PTTG1 and PTTG2 were analyzed using the GeneMANIA prediction tool (http://genemania.org) [30].

2.5. Statistical Analysis

All statistical analyses were performed using GraphPad Prism 5 (GraphPad, San Diego, CA, USA). The Shapiro–Wilk normality test, t-test and Mann–Whitney U test were used for measuring PTTG3P, PTTG1 and PTTG2 levels (depending on clinical parameters) and gene expressions (depending on PTTG3P, PTTG1 and PTTG2 subgroups). The expression levels of PTTG3P, PTTG1 and PTTG2 (depending on the cancer location) were compared using one-way ANOVA obtained using Dunn’s multiple test. All TCGA data are presented as a median with SEM. For disease-free survival (DSF) and overall survival (OS) prognosis, the Log-Rank (Mantel–Cox) and Gehan–Breslow–Wilcoxon tests were used. The Hazard Ratio (Mantel–Haenszel; HR) and 95% Confidence Interval (CI) of ratio were calculated. In all analyses, p < 0.05 was used to determine statistical significance.

2.6. Availability of Data and Materials

The datasets used and/or analyzed during the current study are available from the corresponding author on reasonable request. Raw data is available on the cBioPortal, UALCAN and StarBase v3.0 databases.

3. Results

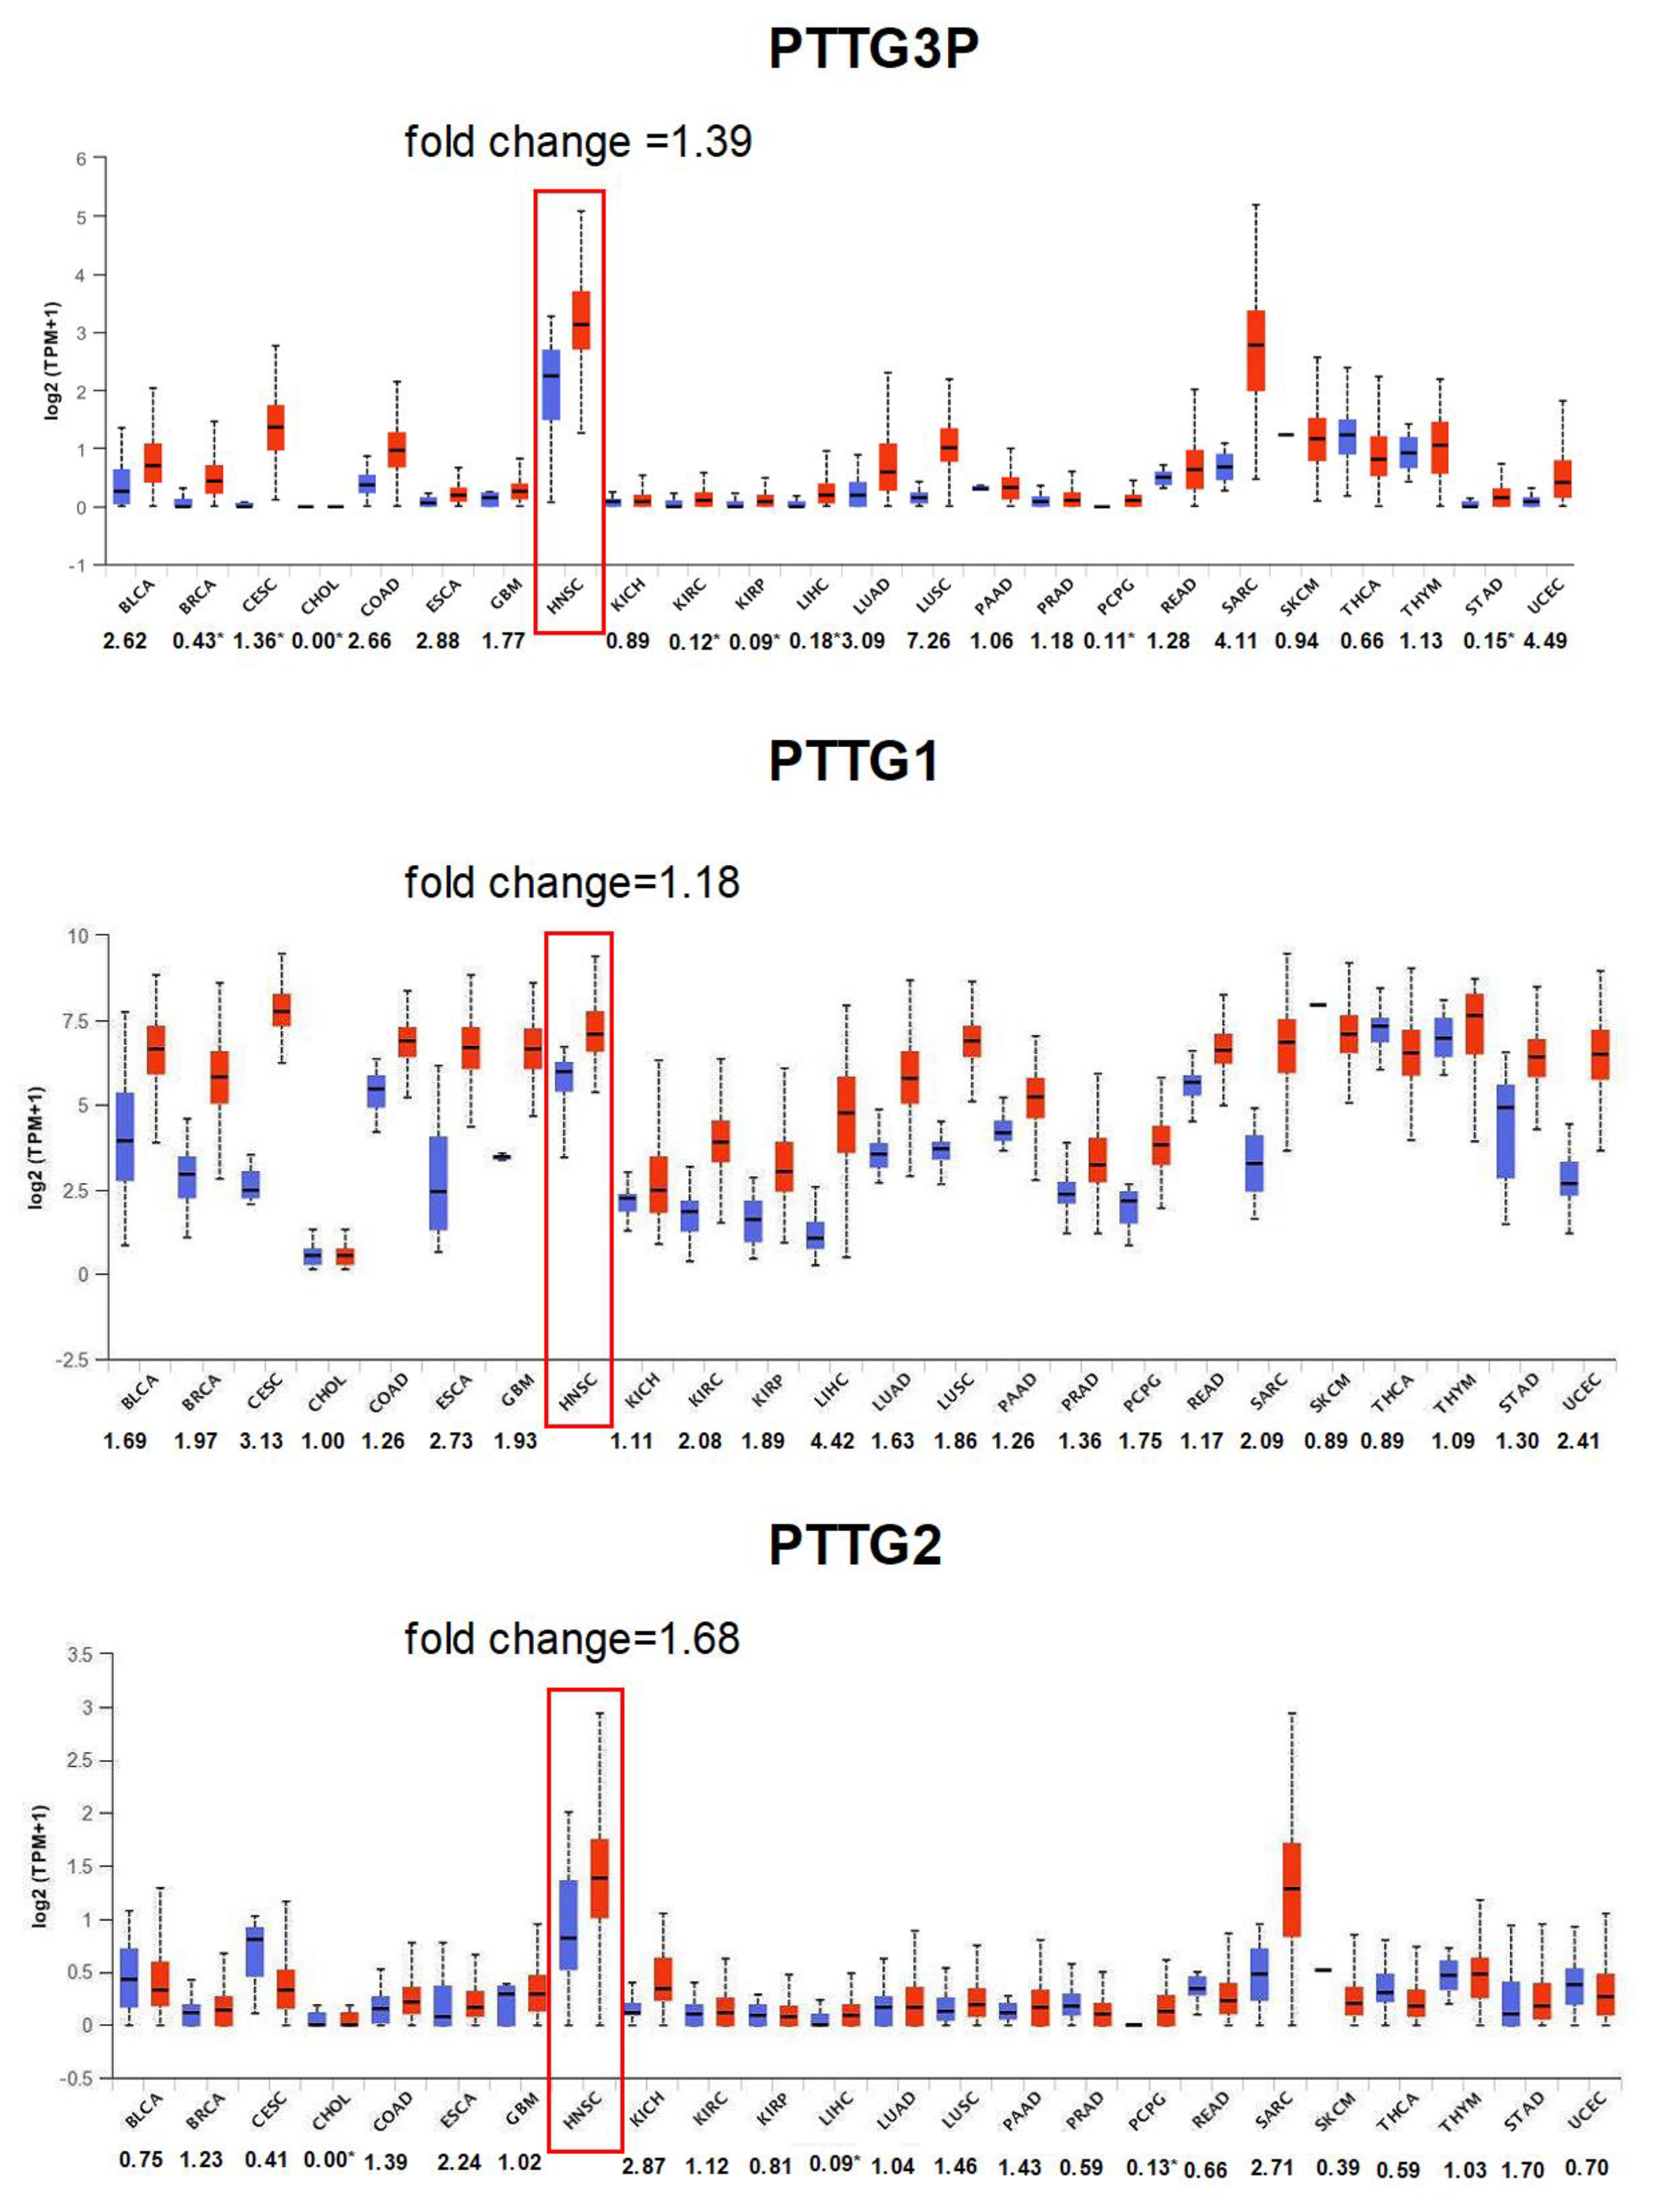
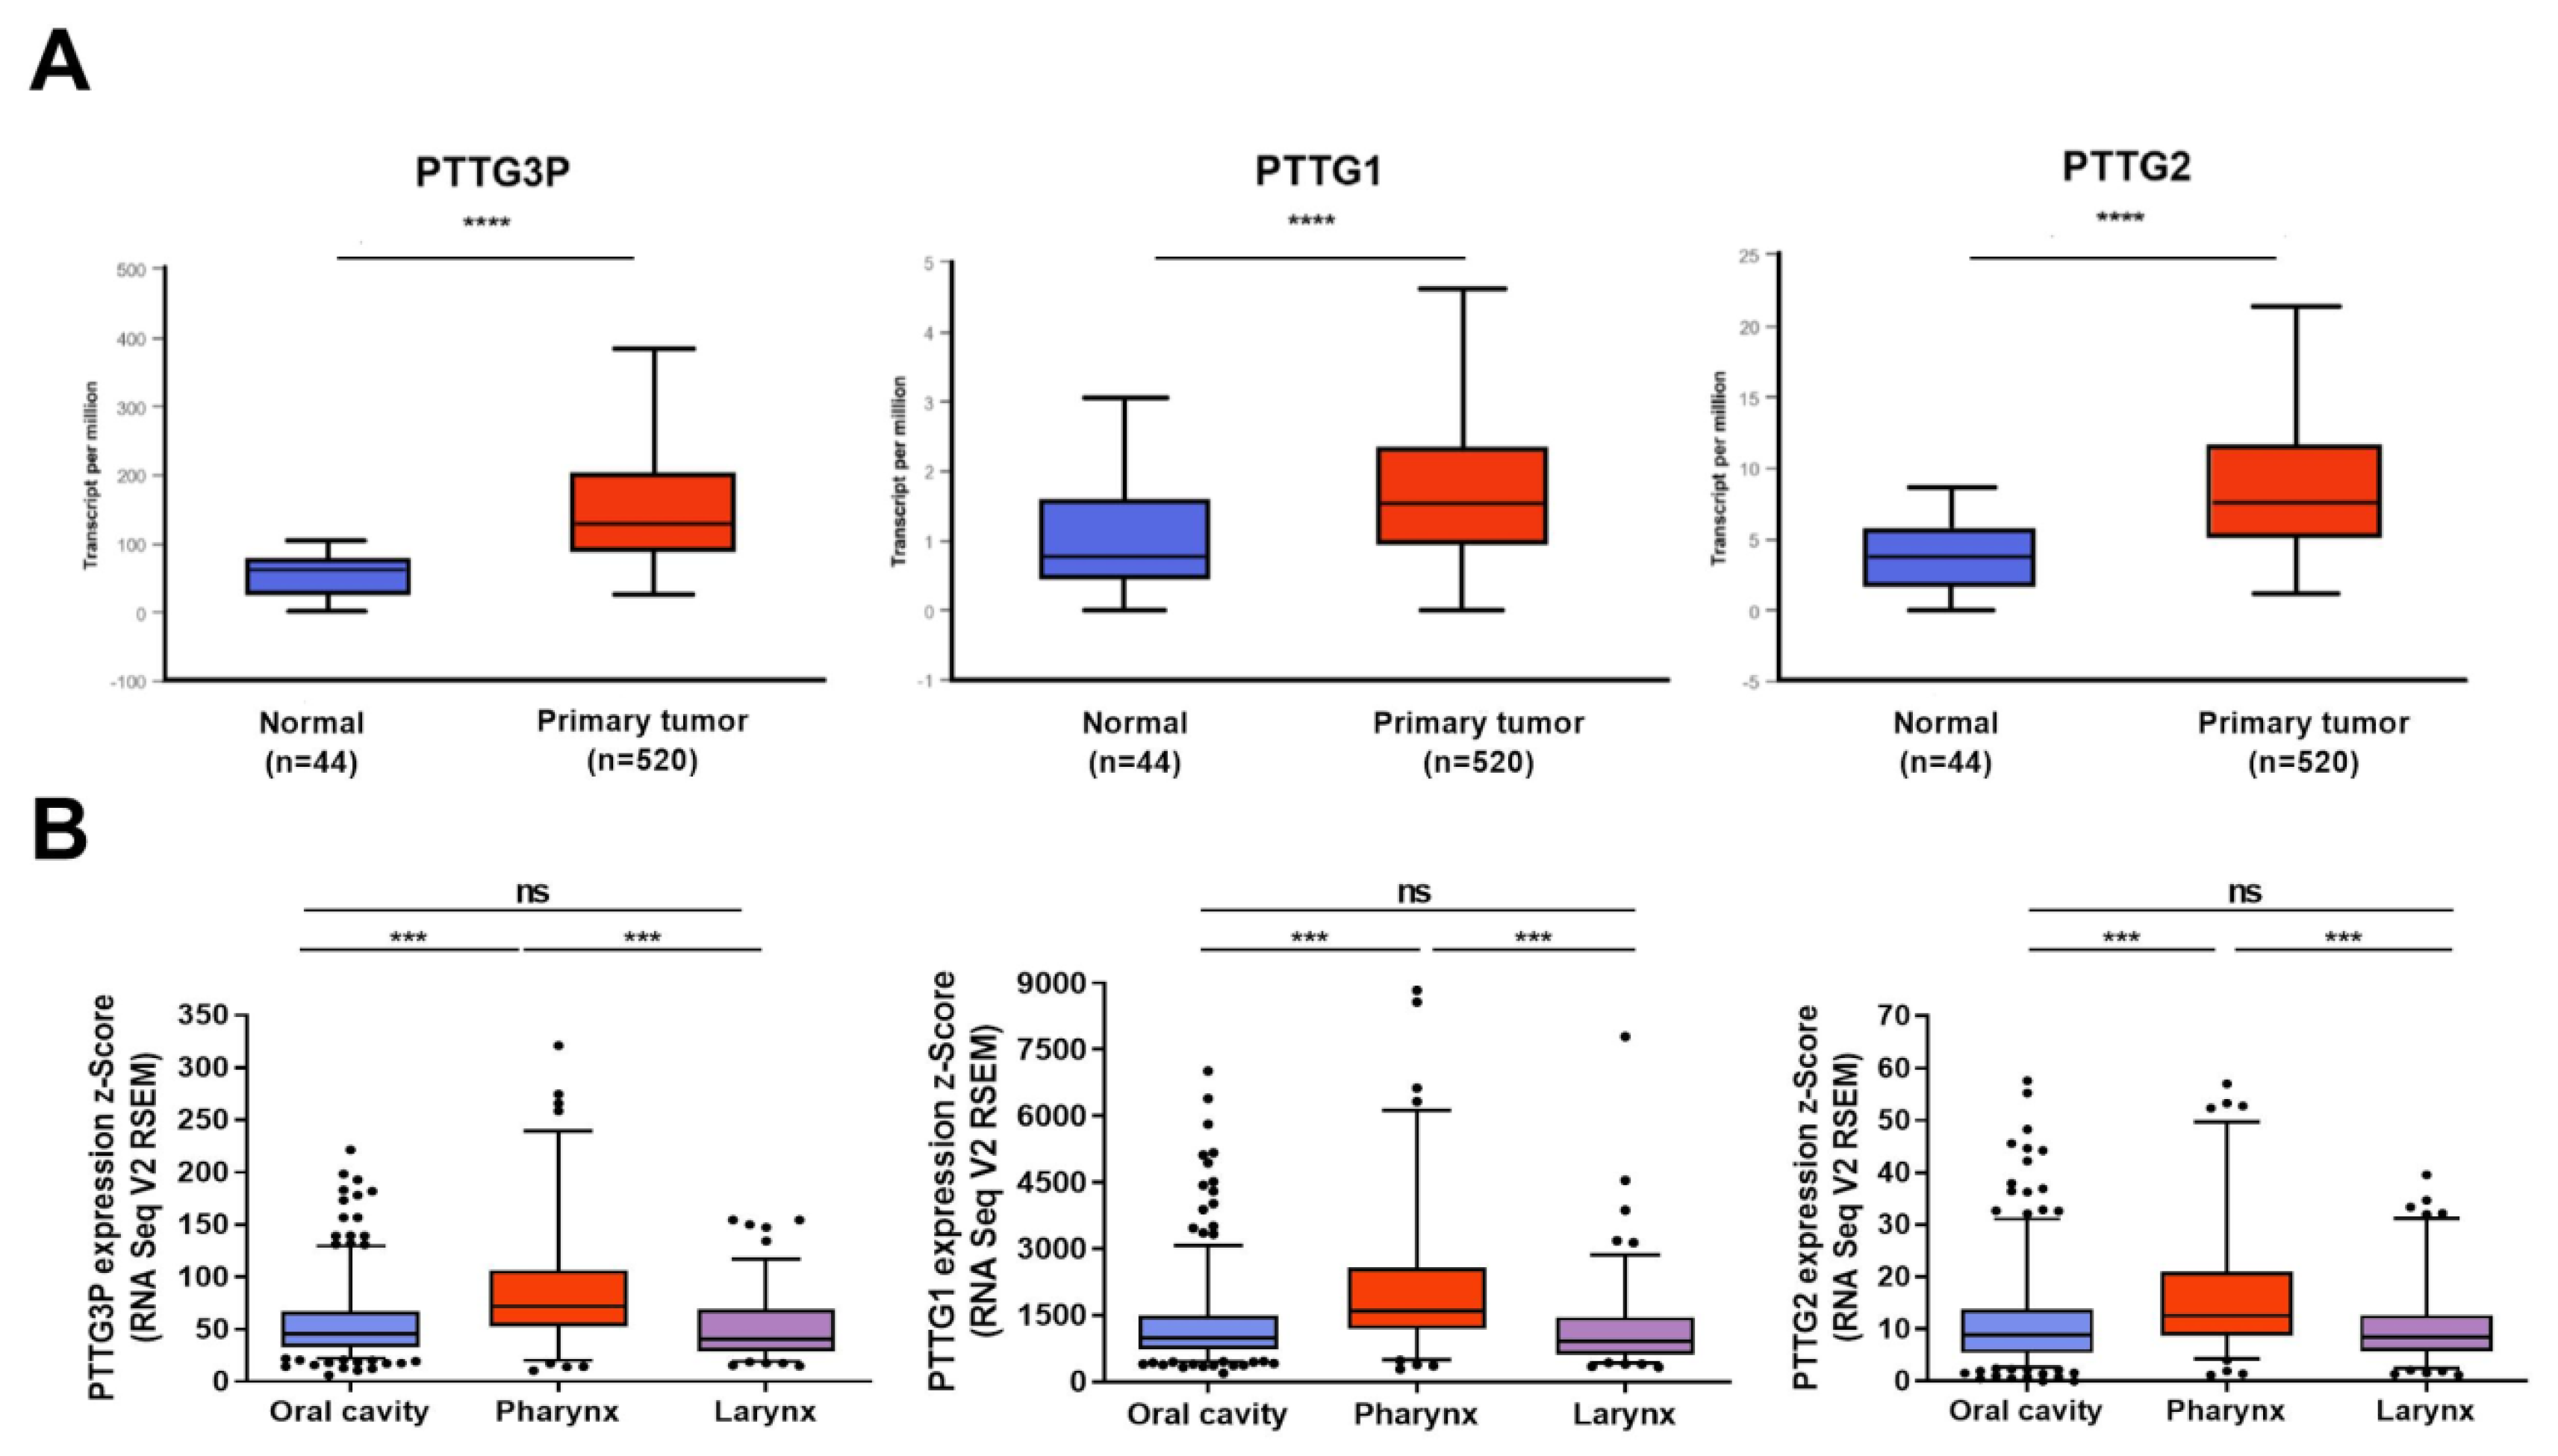
3.1. PTTG3P, PTTG1 and PTTG2 Are Upregulated in Most Cancers, Including HNSCC

Firstly, the expression levels of PTTG3P and two other members of the PTTG family, PTTG1 and PTTG2, were analyzed across twenty-four different cancers, including squamous cell carcinomas, adenocarcinomas and other cancers based on data from the UALCAN database. In the group of squamous cell carcinomas, the highest fold change of PTTG3P was observed for LUSC (7.26), while the lowest for CESC (1.36); For HNSCC, a 1.39-fold change was indicated. In the same group of cancers, the highest fold change of PTTG1 was observed for CESC (3.14) and the lowest for HNSC (1.18). For PTTG2, the highest fold change value was observed in HNSC (1.68), while the lowest in CESC (0.41) in squamous cell carcinomas. In the group of adenocarcinomas, the highest fold change of PTTG3P was indicated for LUAD (3.09) and the lowest for STAD (0.15). In the same group of cancers, the highest fold change of PTTG1 was observed for LUAD (1.63), while the lowest for READ (1.17). For PTTG2, the highest fold change value in this group of cancer was obtained for STAD (1.70) and the lowest for PRAD (0.59). In the group of other cancers, the highest fold change of PTTG3P was observed for UCEC (4.49) and the lowest for KIRP (0.09). In the same group of cancers, the highest fold change of PTTG1 was obtained for LIHC (4.42) and the lowest for SKCM (0.89) and THCA (0.89). For PTTG2 the highest fold change value in this group of cancer was obtained for KICH (2.87) and the lowest for LIHL (0.09). All obtained results are presented in Figure 1.
In HNSCC, significant up-regulation of PTTG3P, PTTG1 and PTTG2 expressions between normal and cancer samples was observed (3.758 vs. 7.534; p = 1.62 × 10⁻¹²), (62.059 vs. 129.031; p = 1.62 × 10⁻¹²) and (0.776 vs. 1.533; p = 2.04 × 10⁻¹²), respectively, Figure 2A. Moreover, based on the National Institute of Health’s (NIH) classification, HNSCC patients were divided into three groups according to the localization of cancer and expression levels of PTTG3P, PTTG1 and PTTG2. Afterwards, these subgroups were analyzed. Differences were not observed between tumors from the oral cavity and larynx in all the analyzed genes (p > 0.05). Statistical significance was obtained between tumors from the oral cavity and pharynx and between tumors from the pharynx and larynx in all three genes (p < 0.001), Figure 2B.

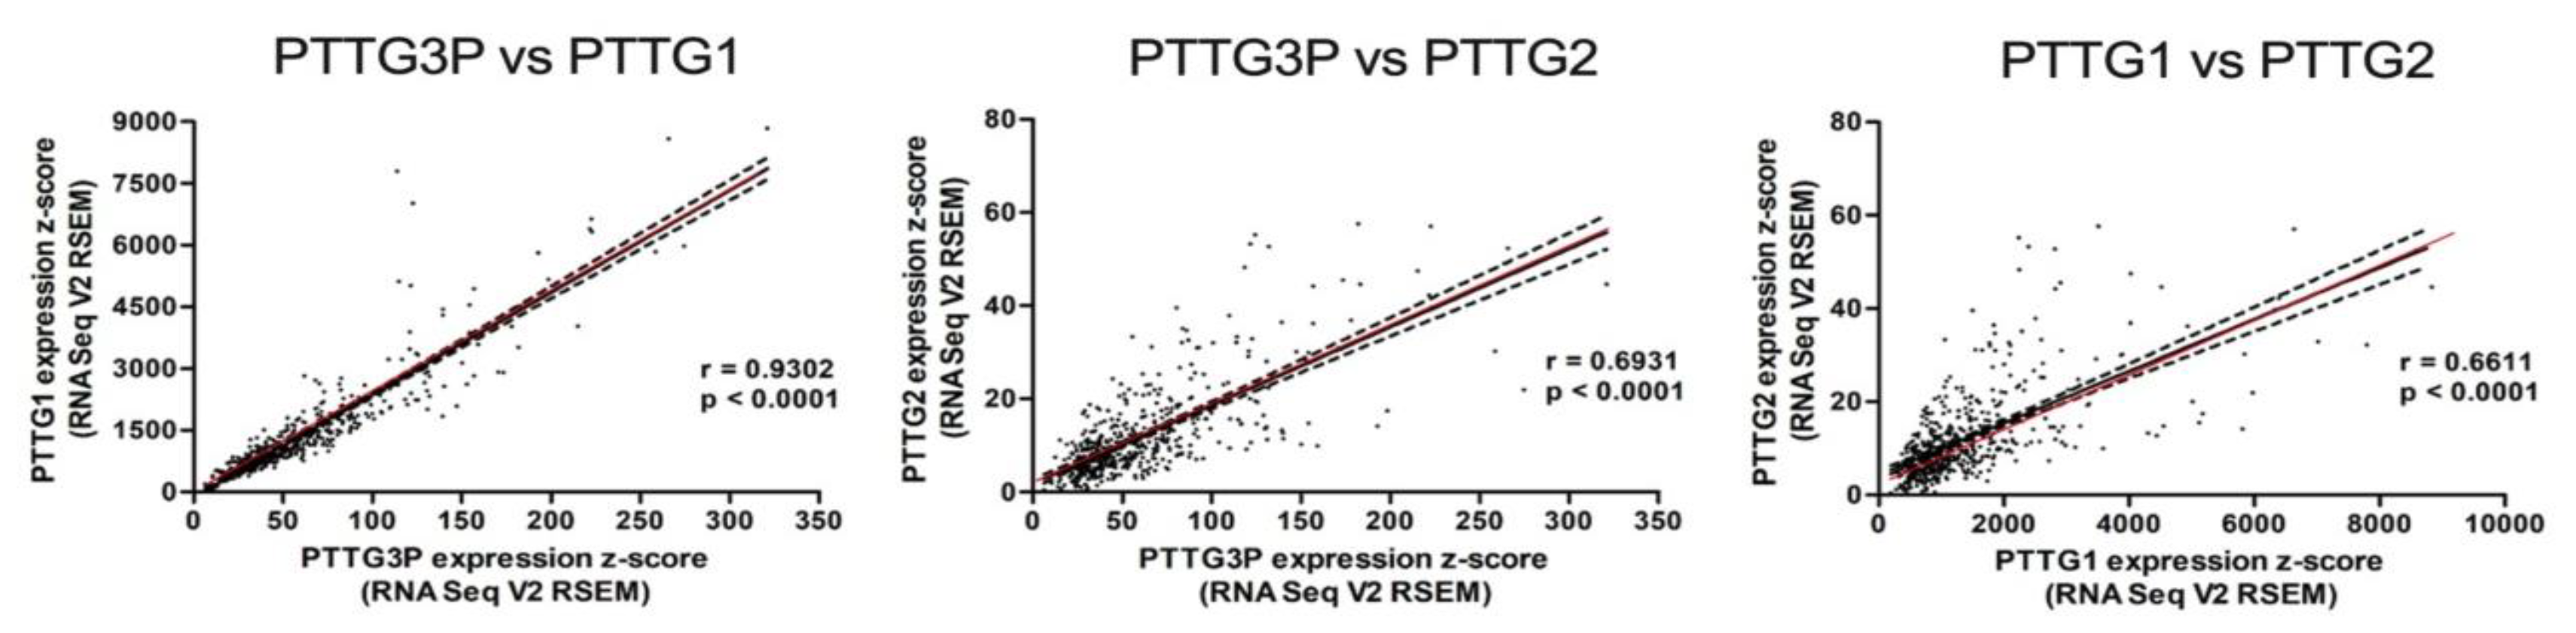
3.2. PTTG3P Positively Correlates with PTTG1 and PTTG2 in HNSCC Patients

To analyze the correlation between PTTG3P and PTTG1 or PTTG2 gene expressions in HNSCC samples, the Spearman test was used. The results showed that PTTG3P expression was positively correlated with PTTG1 (r = 0.9302, p < 0.0001) as well as PTTG2 (r = 0.6931, p < 0.0001) and also the PTTG1 expression was positively correlated with PTTG2 (r = 0.6611, p < 0.0001). All results are shown in Figure 3 below.

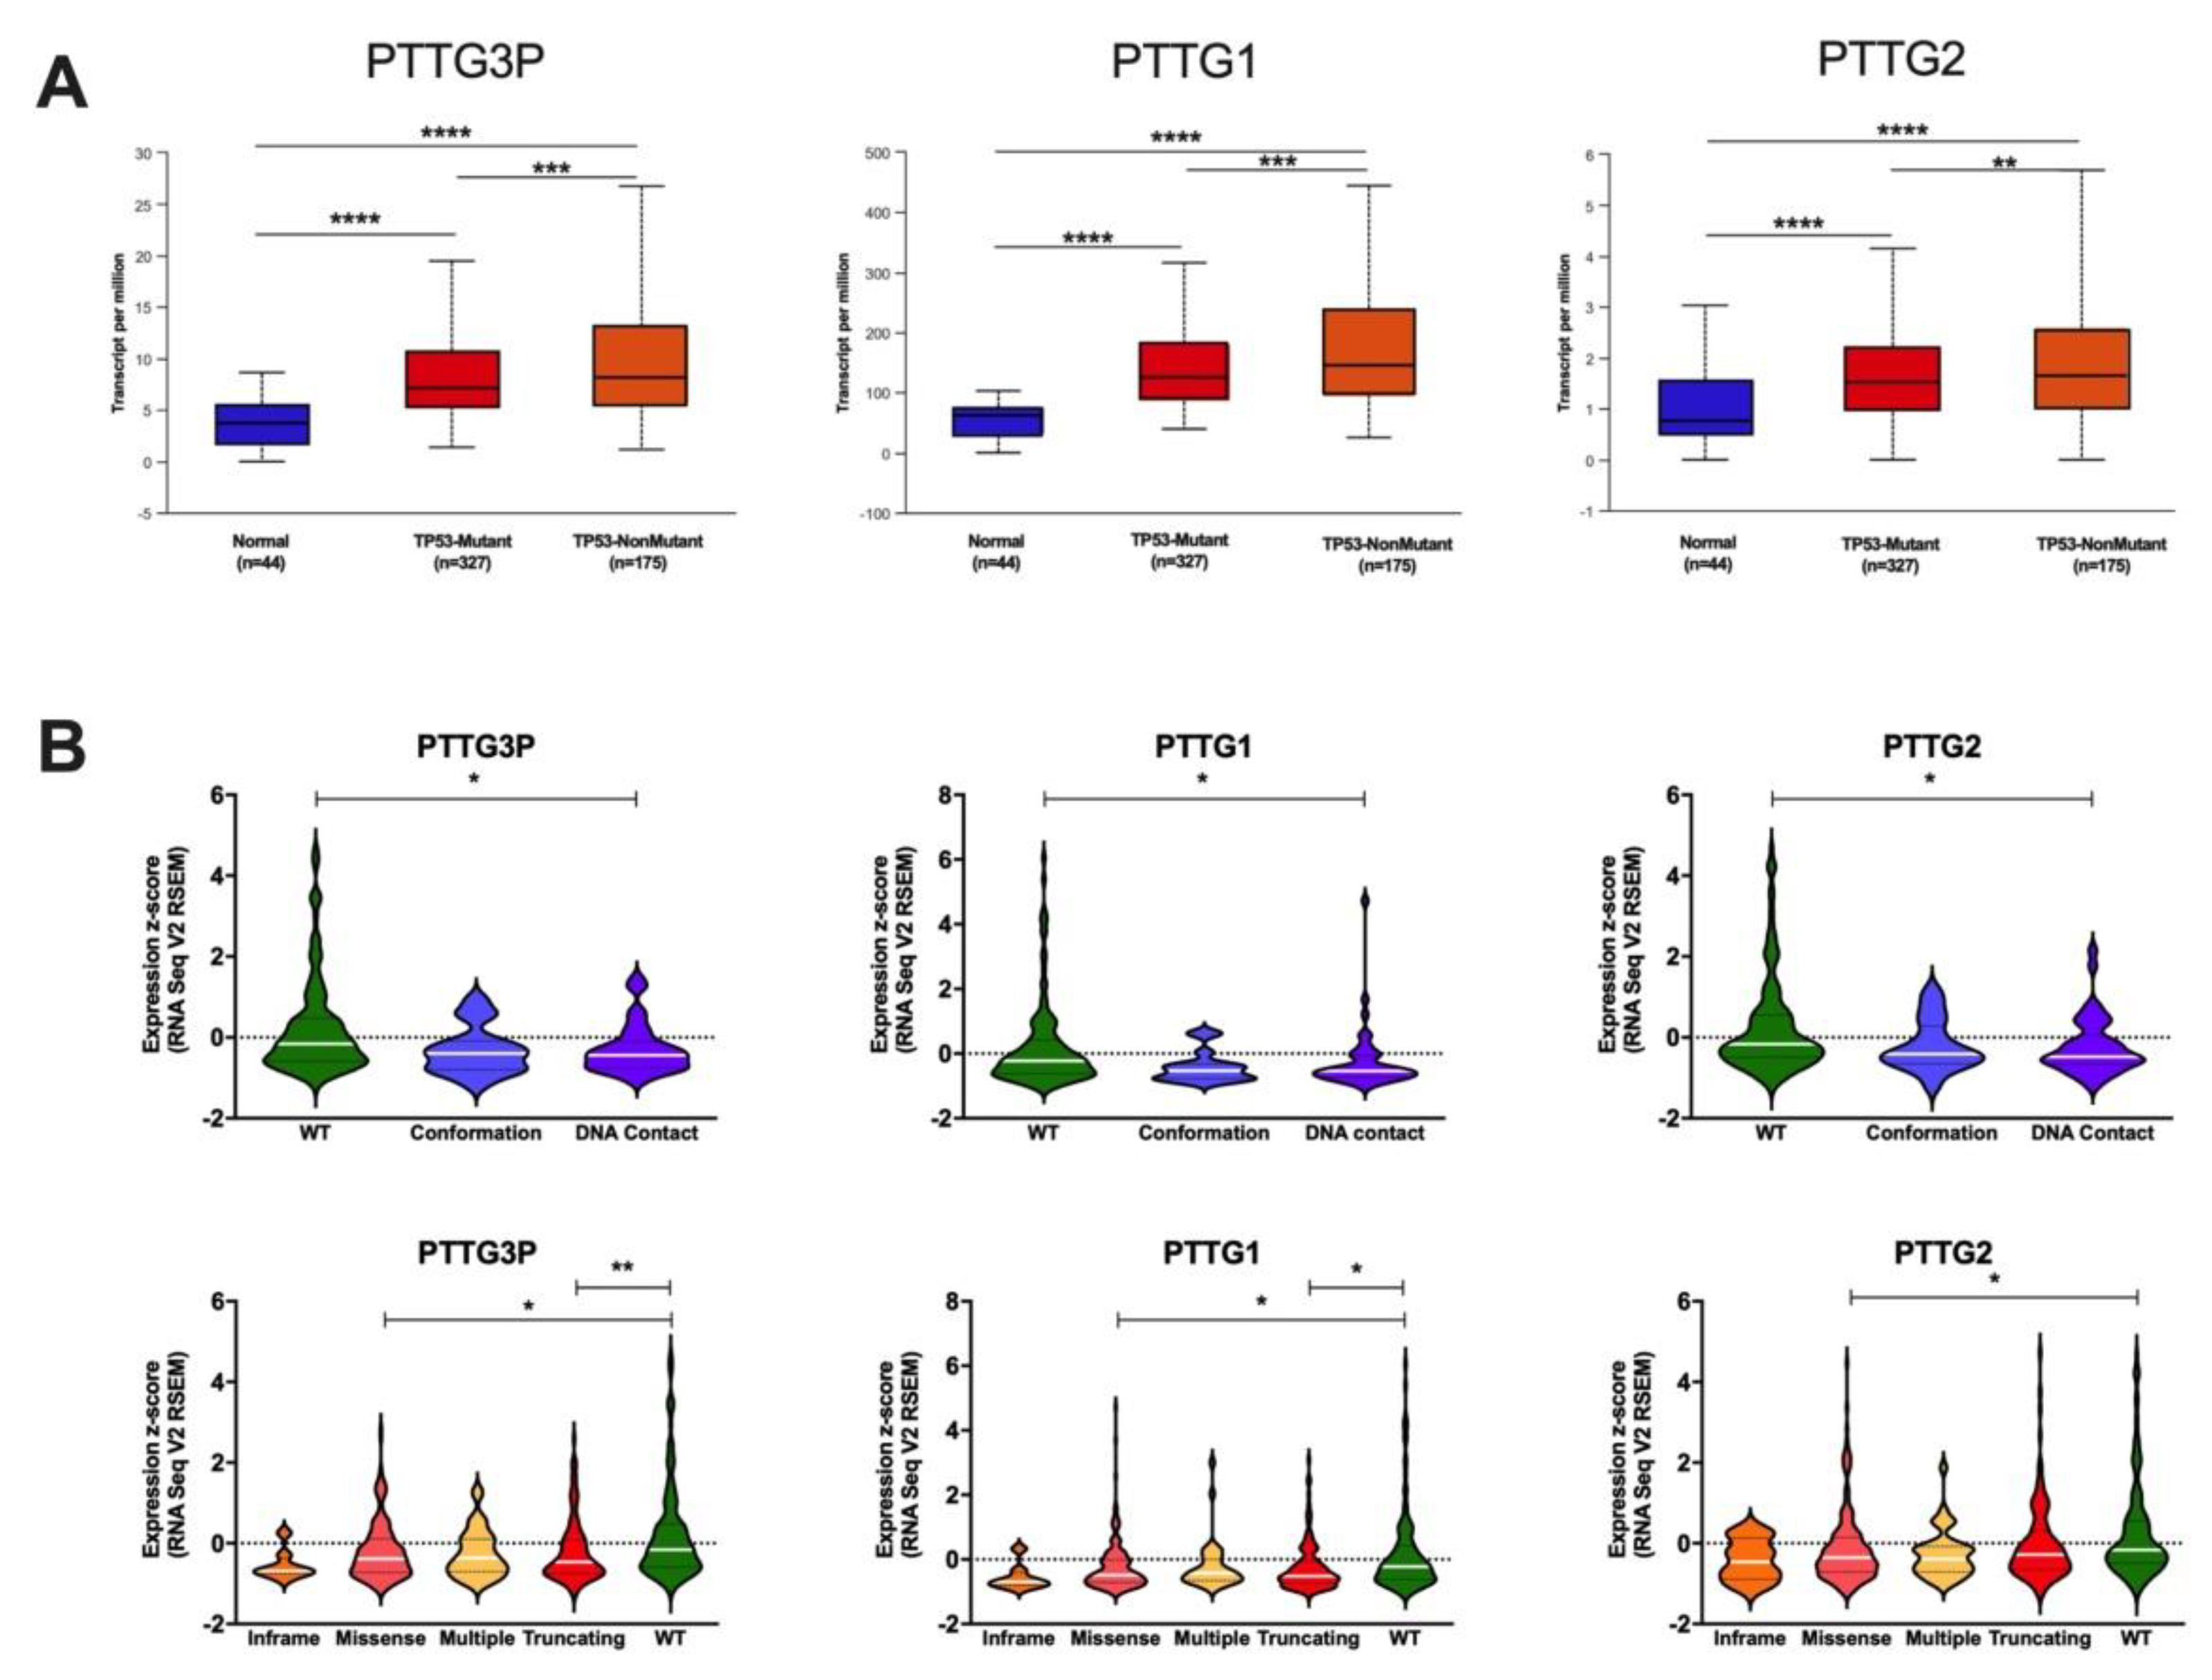
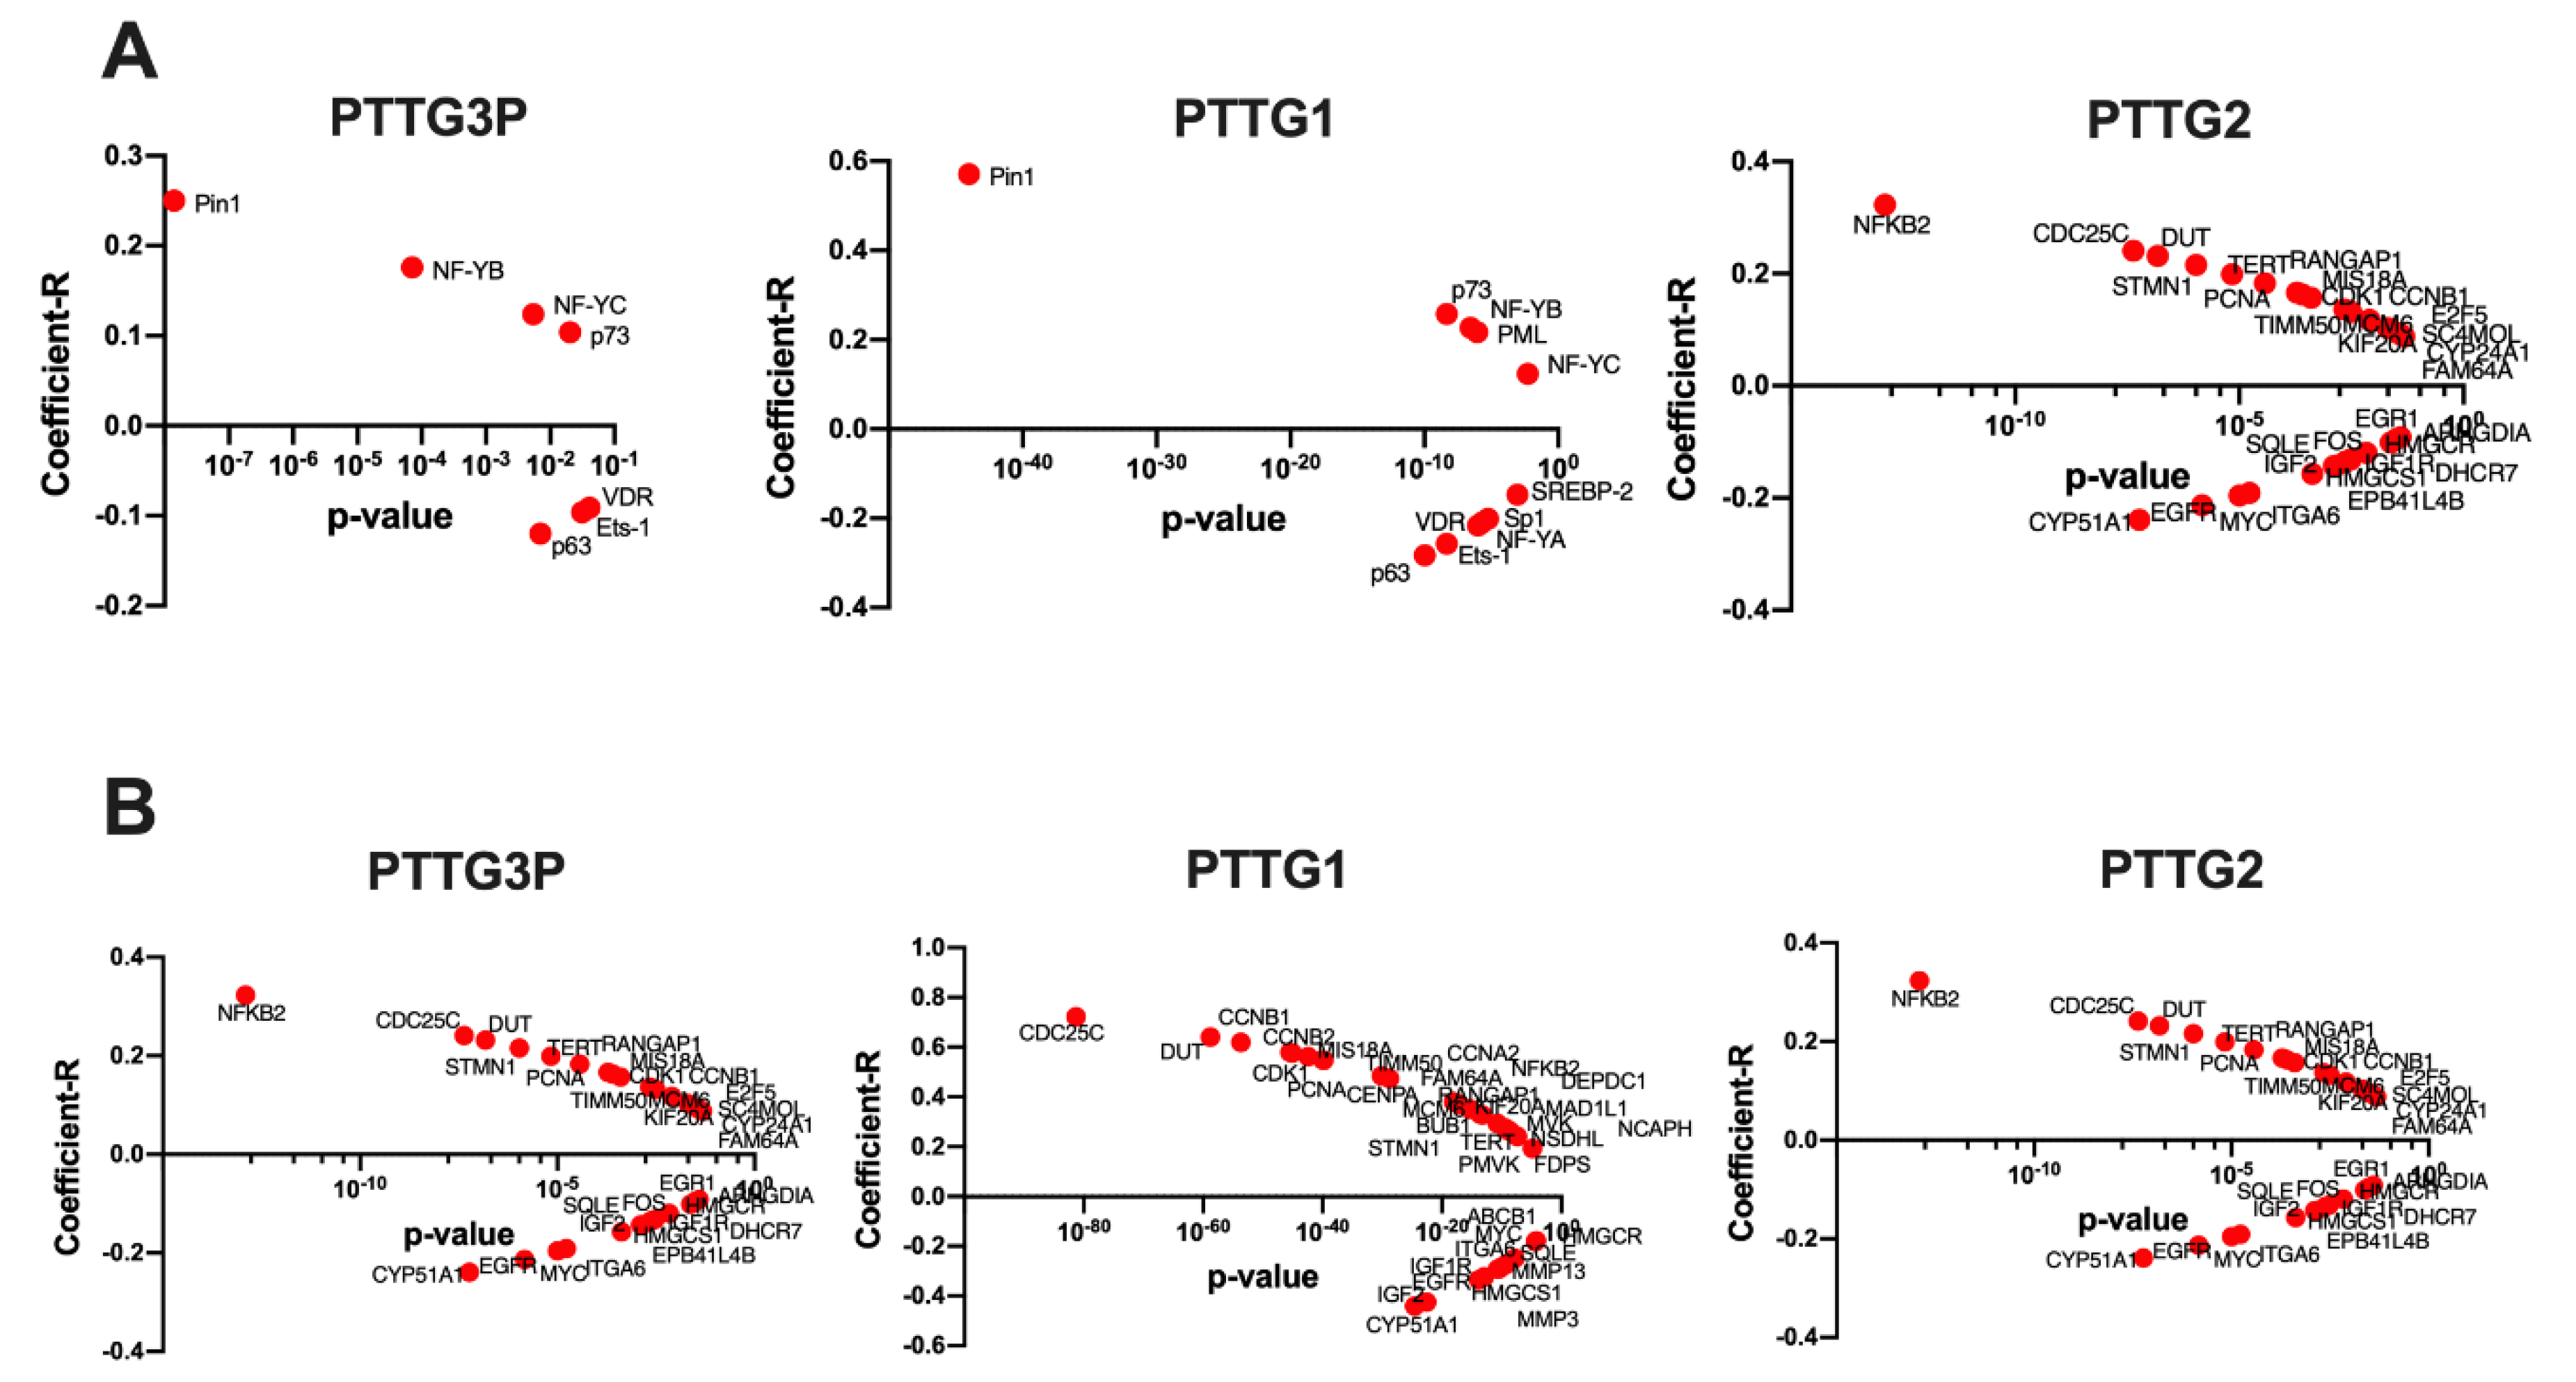
3.3. Expression Levels of PTTG3P, PTTG1 and PTTG2 Depend on TP53 Status and Correlate with Expression of the Genes from the p53 Pathway

Due to TP53 status being an important marker for HNSCC, the dependent expression levels of PTTG3P, PTTG1 and PTTG2 were checked. In all analyzed genes, a significantly higher (p < 0.05) expression of mutant and wild type TP53 cases (compared to normal samples) was observed. Moreover, expression levels of PTTG3P, PTTG1 and PTTG2 were significantly higher in patients with non-mutated as compared to mutated TP53 genes (p = 2.20 × 10⁻⁵; p = 1.67 × 10⁻⁵ and p = 1.73 × 10⁻³, respectively), Figure 4A. To further analyze the connection between PTTG3P, PTTG1 and PTTG2 expression and TP53 status, the expression levels of PTTG gene family were checked in groups of patients divided depending on TP53 gene mutation type. In all examined cases, the highest expressions of PTTG3P, PTTG1 and PTTG2 were observed in wild type TP53 versus DNA contact mutations (p = 0.0127; p = 0.0072; p = 0.0323, respectively), Figure 4B. Analysis of different division of TP53 mutation types showed significant differences between missense mutations versus wild type and truncating mutations versus wild type for PTTG3P and PTTG1 (p = 0.0011; p = 0.0025, respectively). Finally, for PTTG2, significant difference was observed only between missense mutations versus wild type TP53 (p = 0.0099), Figure 4B.
Next, selected mutant p53-interacting partners and genes transcriptionally activated by mutant p53 protein were analyzed. In the case of mutant p53-interacting partners and PTTG3P statistically significant positive correlation (p < 0.05) of NF-YB, NF-YC, Pin1 and p73 expression, and negative of Ets-1, VDR and p63 was indicated. Positive correlation was also found between PTTG1 and NF-YB, NF-YC, Pin1, PML and p73, in contrast to NF-YA, Sp1, Ets-1, VDR, SREBP-2 and p63, which were negatively correlated. The expression of last examined gene, PTTG2, was positively correlated with NF-YB, Pin1, PML and p73 and significantly negatively correlated only with NF-YA and p63 (Figure 5A). However, observed coefficient-R was not strong for analyzed genes (Supplementary Table S1).
The group of genes transcriptionally activated by mutant p53 protein and positively correlated (R > 0.2, p < 0.05) with PTTG3P comprised CCNA2, KIF20A, MCM6, TIMM50, TERT, CENPA, CCNB2, CDK1, CCNB1, DUT, MIS18A, STMN1 and CDC25C, whereas in the group of negatively correlated (R < −0.17, p < 0.05) were IGF2, MMP3, CYP51A1 and MMP13. In the group of genes positively correlated (R > 0.2, p < 0.05) with PTTG1 were NCAPH, NSDHL, DEPDC1, BUB1, MVK, MAD1L1, TERT, PMVK, KIF20A, MCM6, CCNA2, NFKB2, RANGAP1, FAM64A, CENPA, TIMM50, MIS18A, PCNA, CDK1, STMN1, CCNB2, CCNB1, DUT and CDC25C, in contrast to the negatively correlated genes (R < −0.17, p < 0.05): MYC, ABCB1, HMGCR, SQLE, MMP13, ITGA6, MMP3, HMGCS1, IGF1R, EGFR, IGF2 and CYP51A1. PTTG2 was found to be positively correlated (R > 0.2, p < 0.05) with STMN1, DUT, CDC25C and NFKB2 and negatively correlated (R < −0.17, p < 0.05) with ITGA6, MYC, EGFR and CYP51A1. All data is presented in Figure 5B and Supplementary Table S2.
It should be noted that statistically significant (p < 0.05) relationship between the expression levels and patients’ survival was observed only in the case of: Pin1, p73, IGF1R, ABCB1 and SQLE, (data from StarBase v3.0); Supplementary Tables S3 and S4.

3.4. PTTG3P, PTTG1 and PTTG2 Levels Differ Depending on Clinicopathological Parameters

The expression levels of PTTG3P, PTTG1 and PTTG2 were analyzed in the context of clinicopathological parameters in HNSCC patients. Significant differences between expression levels of PTTG3P, PTTG1 and PTTG2 were observed with regard to T-stage (p = 0.037 for PTTG3P), grade (p < 0.0001 for PTTG3 and PTTG1, p = 0.005 for PTTG2), perineural invasion (p = 0.032 for PTTG1), lymph node neck dissection (p = 0.033 for PTTG1) and HPV p16 status (p < 0.0001 for PTTG3P, PTTG1 and PTTG2). All data are summarized in Table 1.

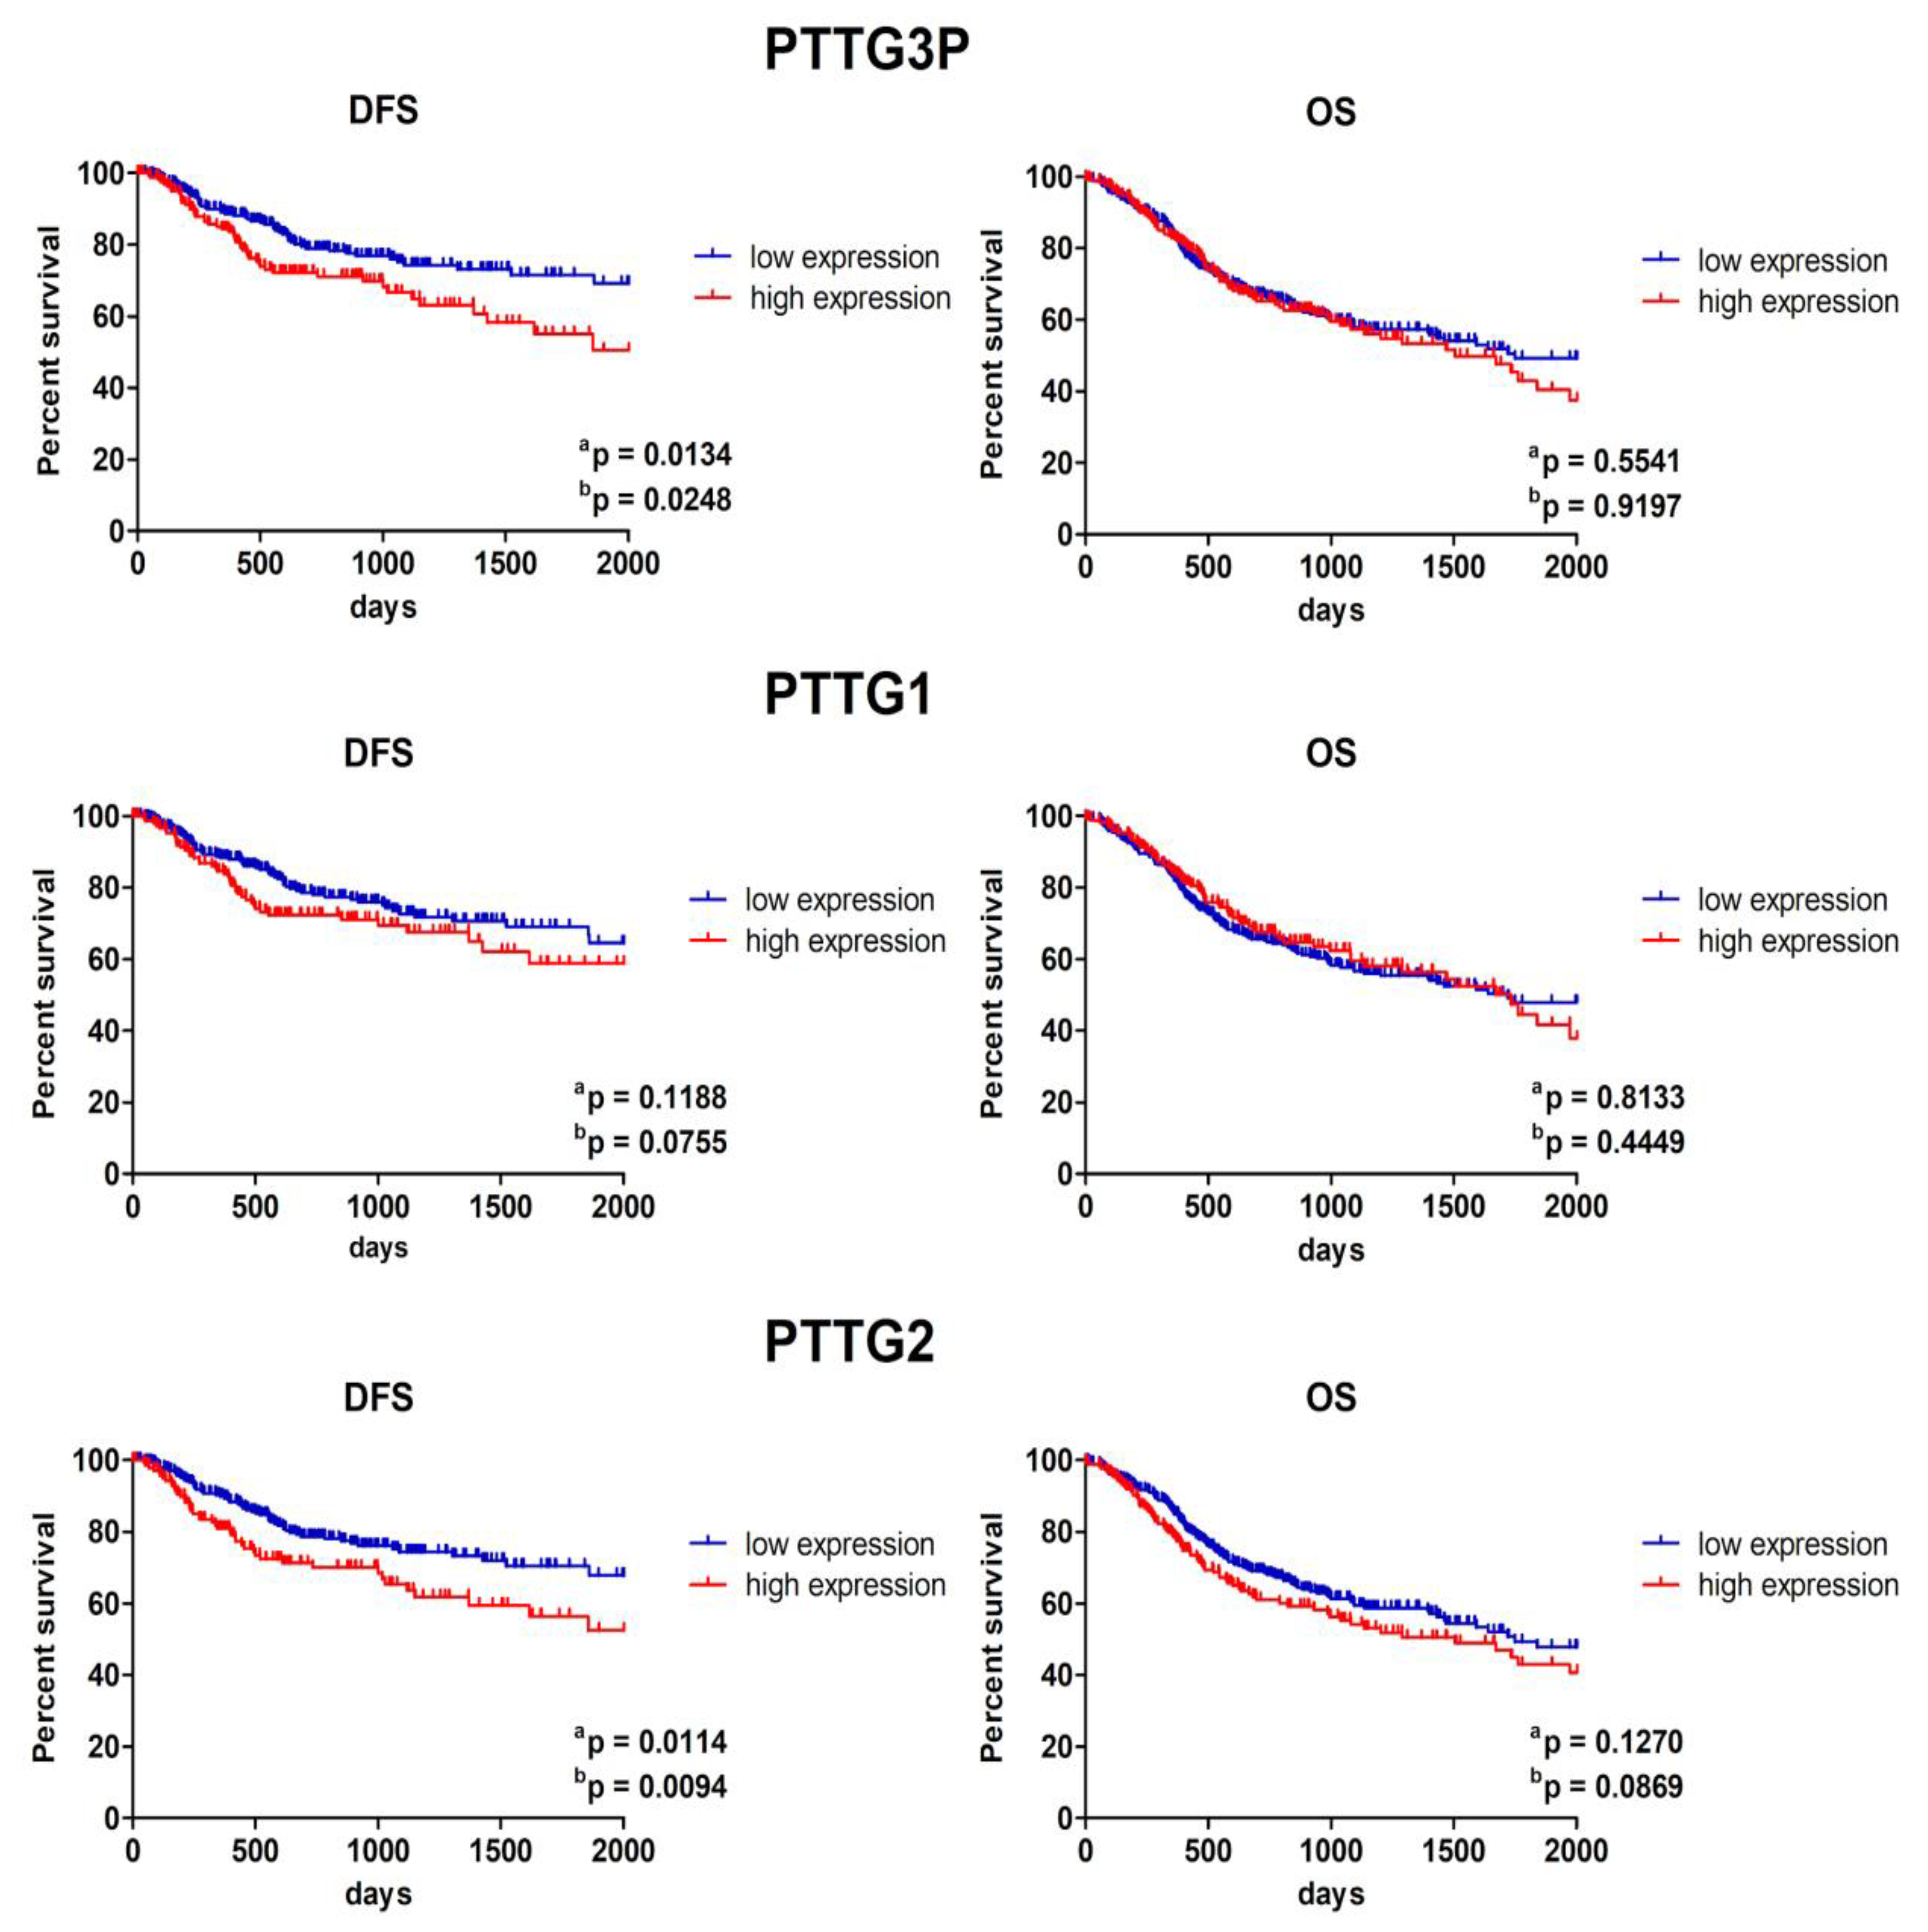
3.5. Patients with Low PTTG3P and PTTG2 Expression Display Longer Disease-Free Survival

HNSCC samples were divided into low and high PTTG3P, PTTG1 or PTTG2 expression groups based on the median expression level of the selected gene and DFS, as well as OS between groups of patients were compared. Significantly longer DFS of patients with low expressions of PTTG3P and PTTG2 compared to high expression groups (p = 0.0094 and p = 0.0248, respectively) was found. No statistical significance was discovered in the length of DFS between PTTG1 low and high expression groups. No notable differences in the length of OS between low and high expression groups in any of the studied genes were detected, Figure 6.

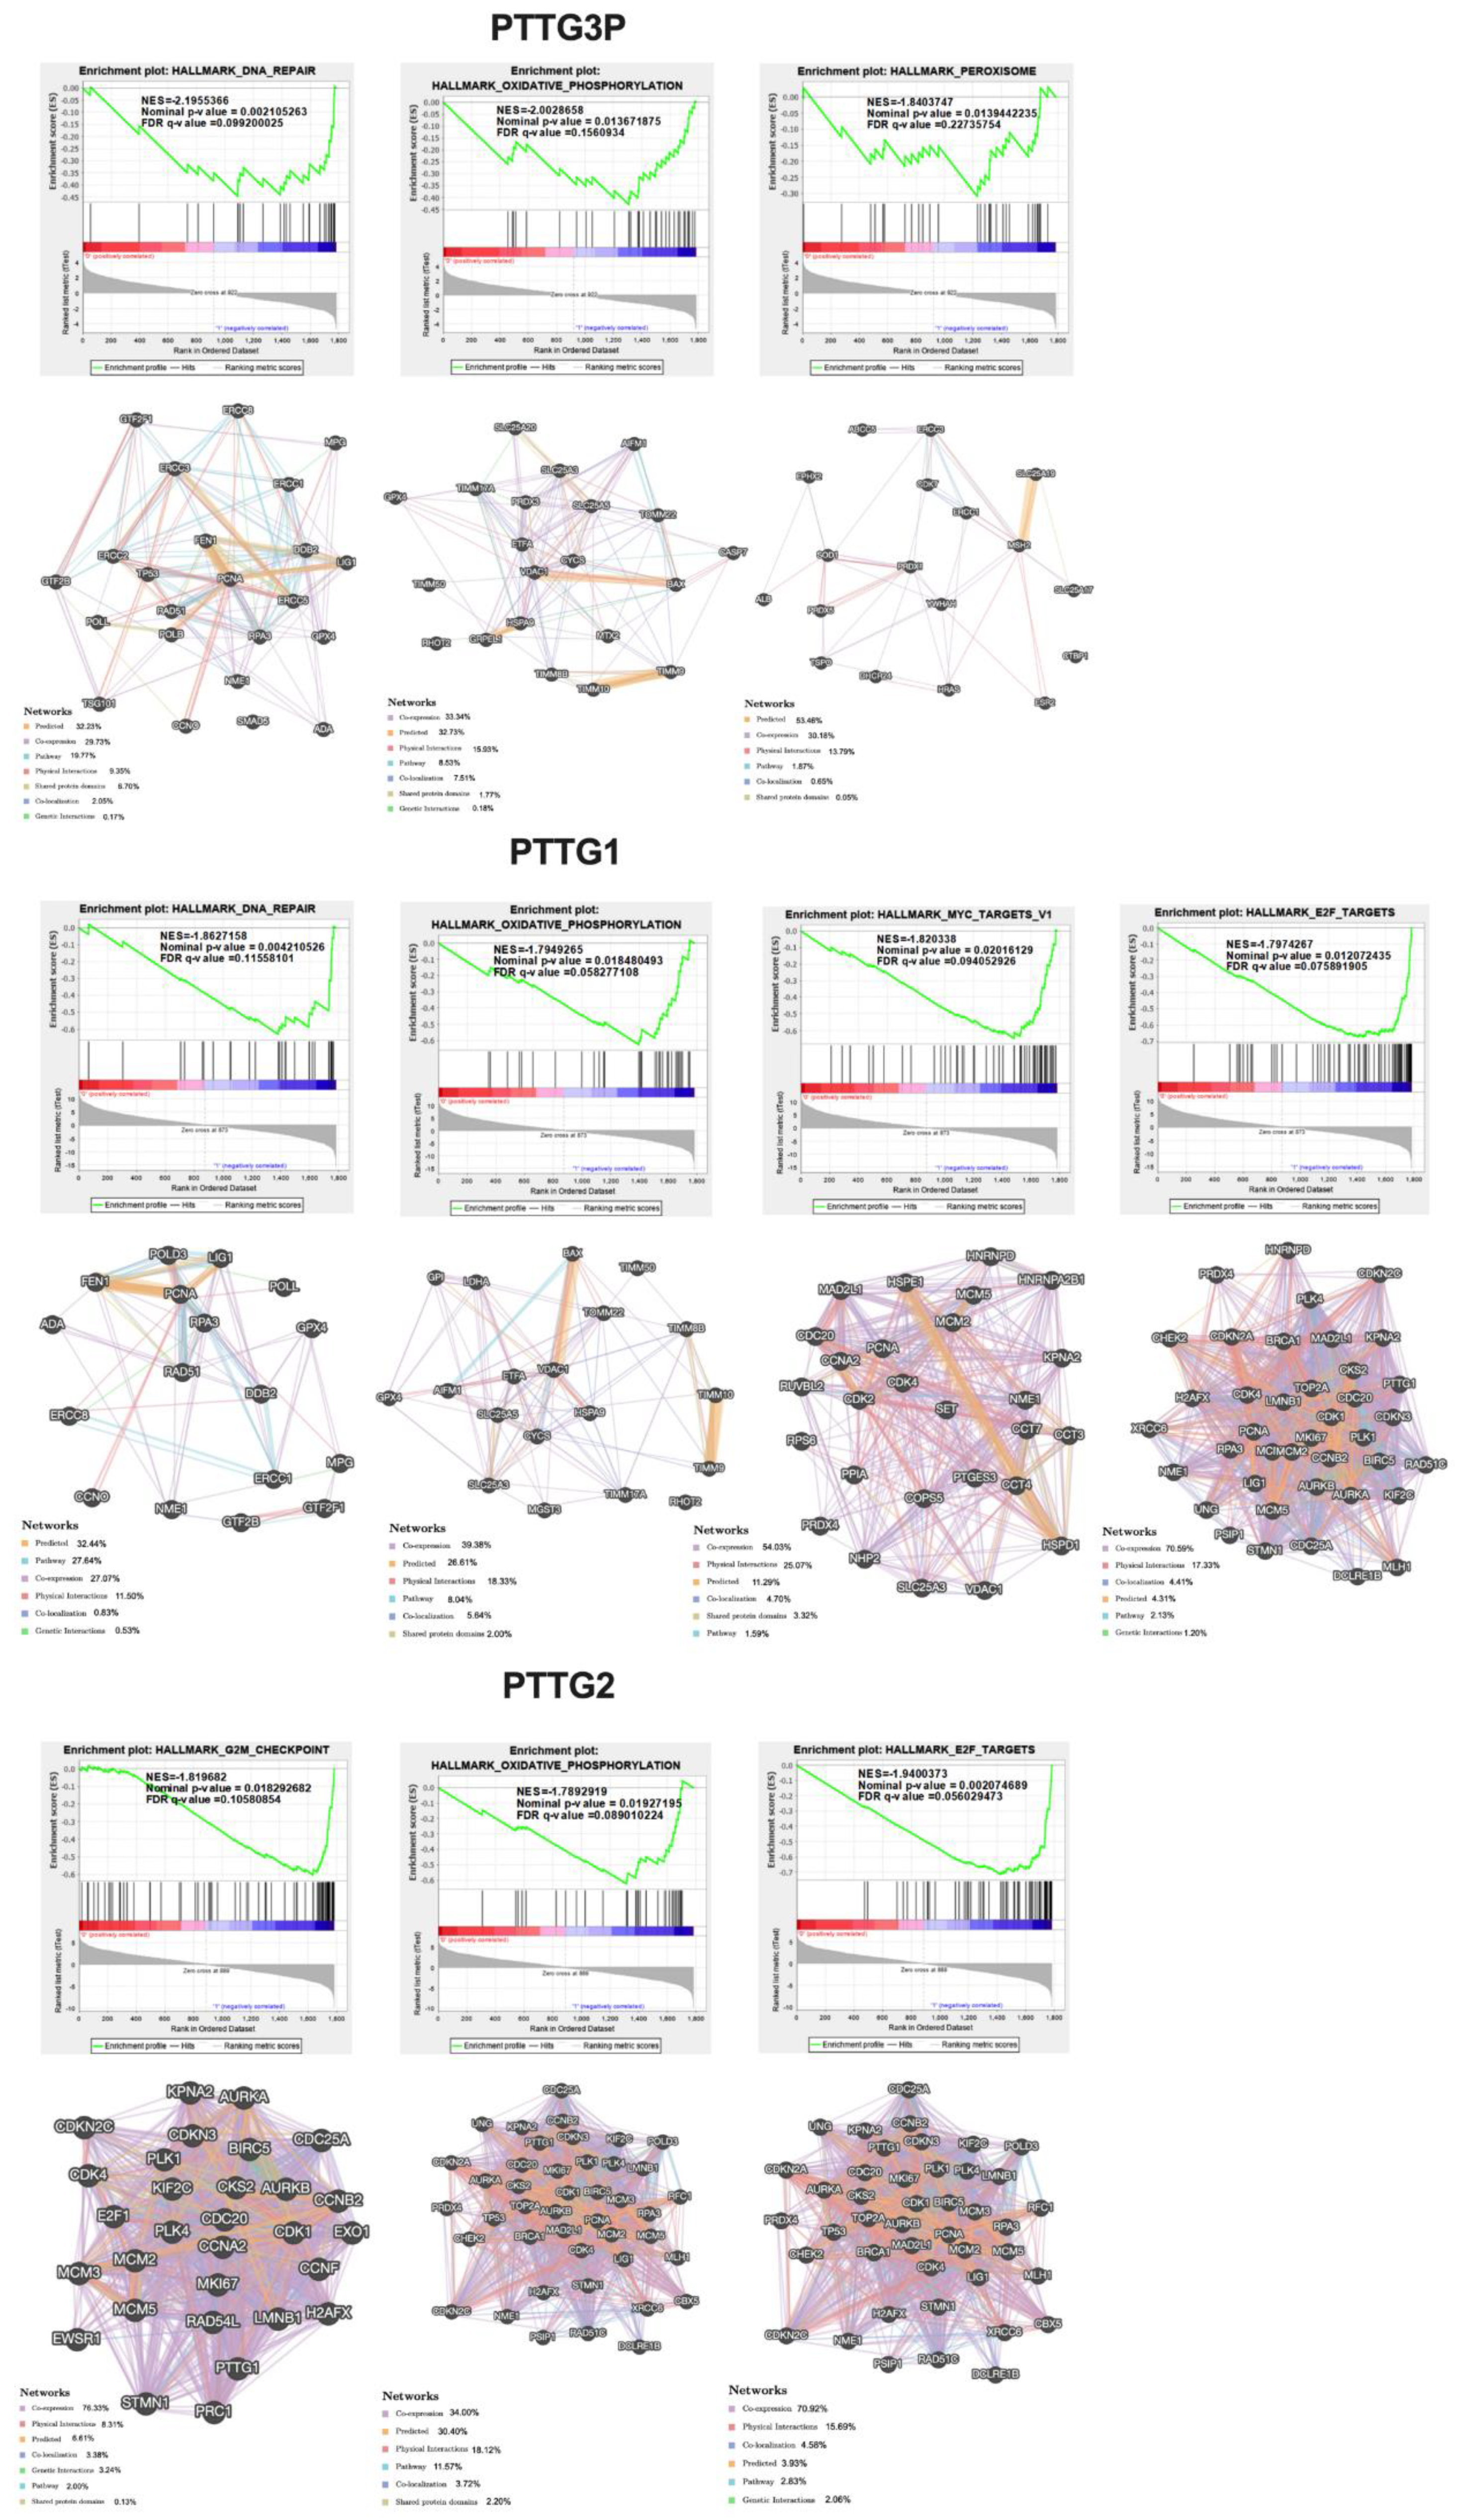
3.6. Expression Levels of PTTG3P, PTTG1 and PTTG2 Correlate with Genes Involved in Important Cellular Processes

Next, positive (R > 0.3) and negative (R < −0.3) Pearson correlations of PTTG3P, PTTG1 and PTTG2 with genes involved in important cellular processes were analyzed using REACTOME pathway analysis. For PTTG3P, 1252 positively correlated genes are mostly involved in cell cycle, gene expression, metabolism of RNA, DNA repair, DNA replication, organelle biogenesis and maintenance, chromatin organization, programmed cell death as well as in HIV viral infection. In spite of this, only 46 negatively correlated genes were indicated and connected with developmental biology processes (keratinization) and signal transduction.
For PTTG1, 1277 positively correlated genes connected with cell cycle, the metabolism of RNA, cellular responses to external stimuli, DNA repair, DNA replication, programmed cell death and protein localization as well as viral infection (HIV and influenza) were indicated. The analysis for 264 negatively regulated genes for PTTG1 indicated that they are involved in the immune system, developmental biology, vesicle-mediated transport, programmed cell death and cell–cell communication. The last gene analyzed was PTTG2. It had 593 positively correlated genes found in processes such as cell cycle, gene expression (transcription), DNA repair, metabolism of RNA, DNA replication as well as in organelle biogenesis and maintenance. Surprisingly, only 2 genes were negatively correlated with PTTG2 and associated with developmental biology processes (keratinization). All results are presented in Figure 7 and a list of genes in Supplementary Table S5.

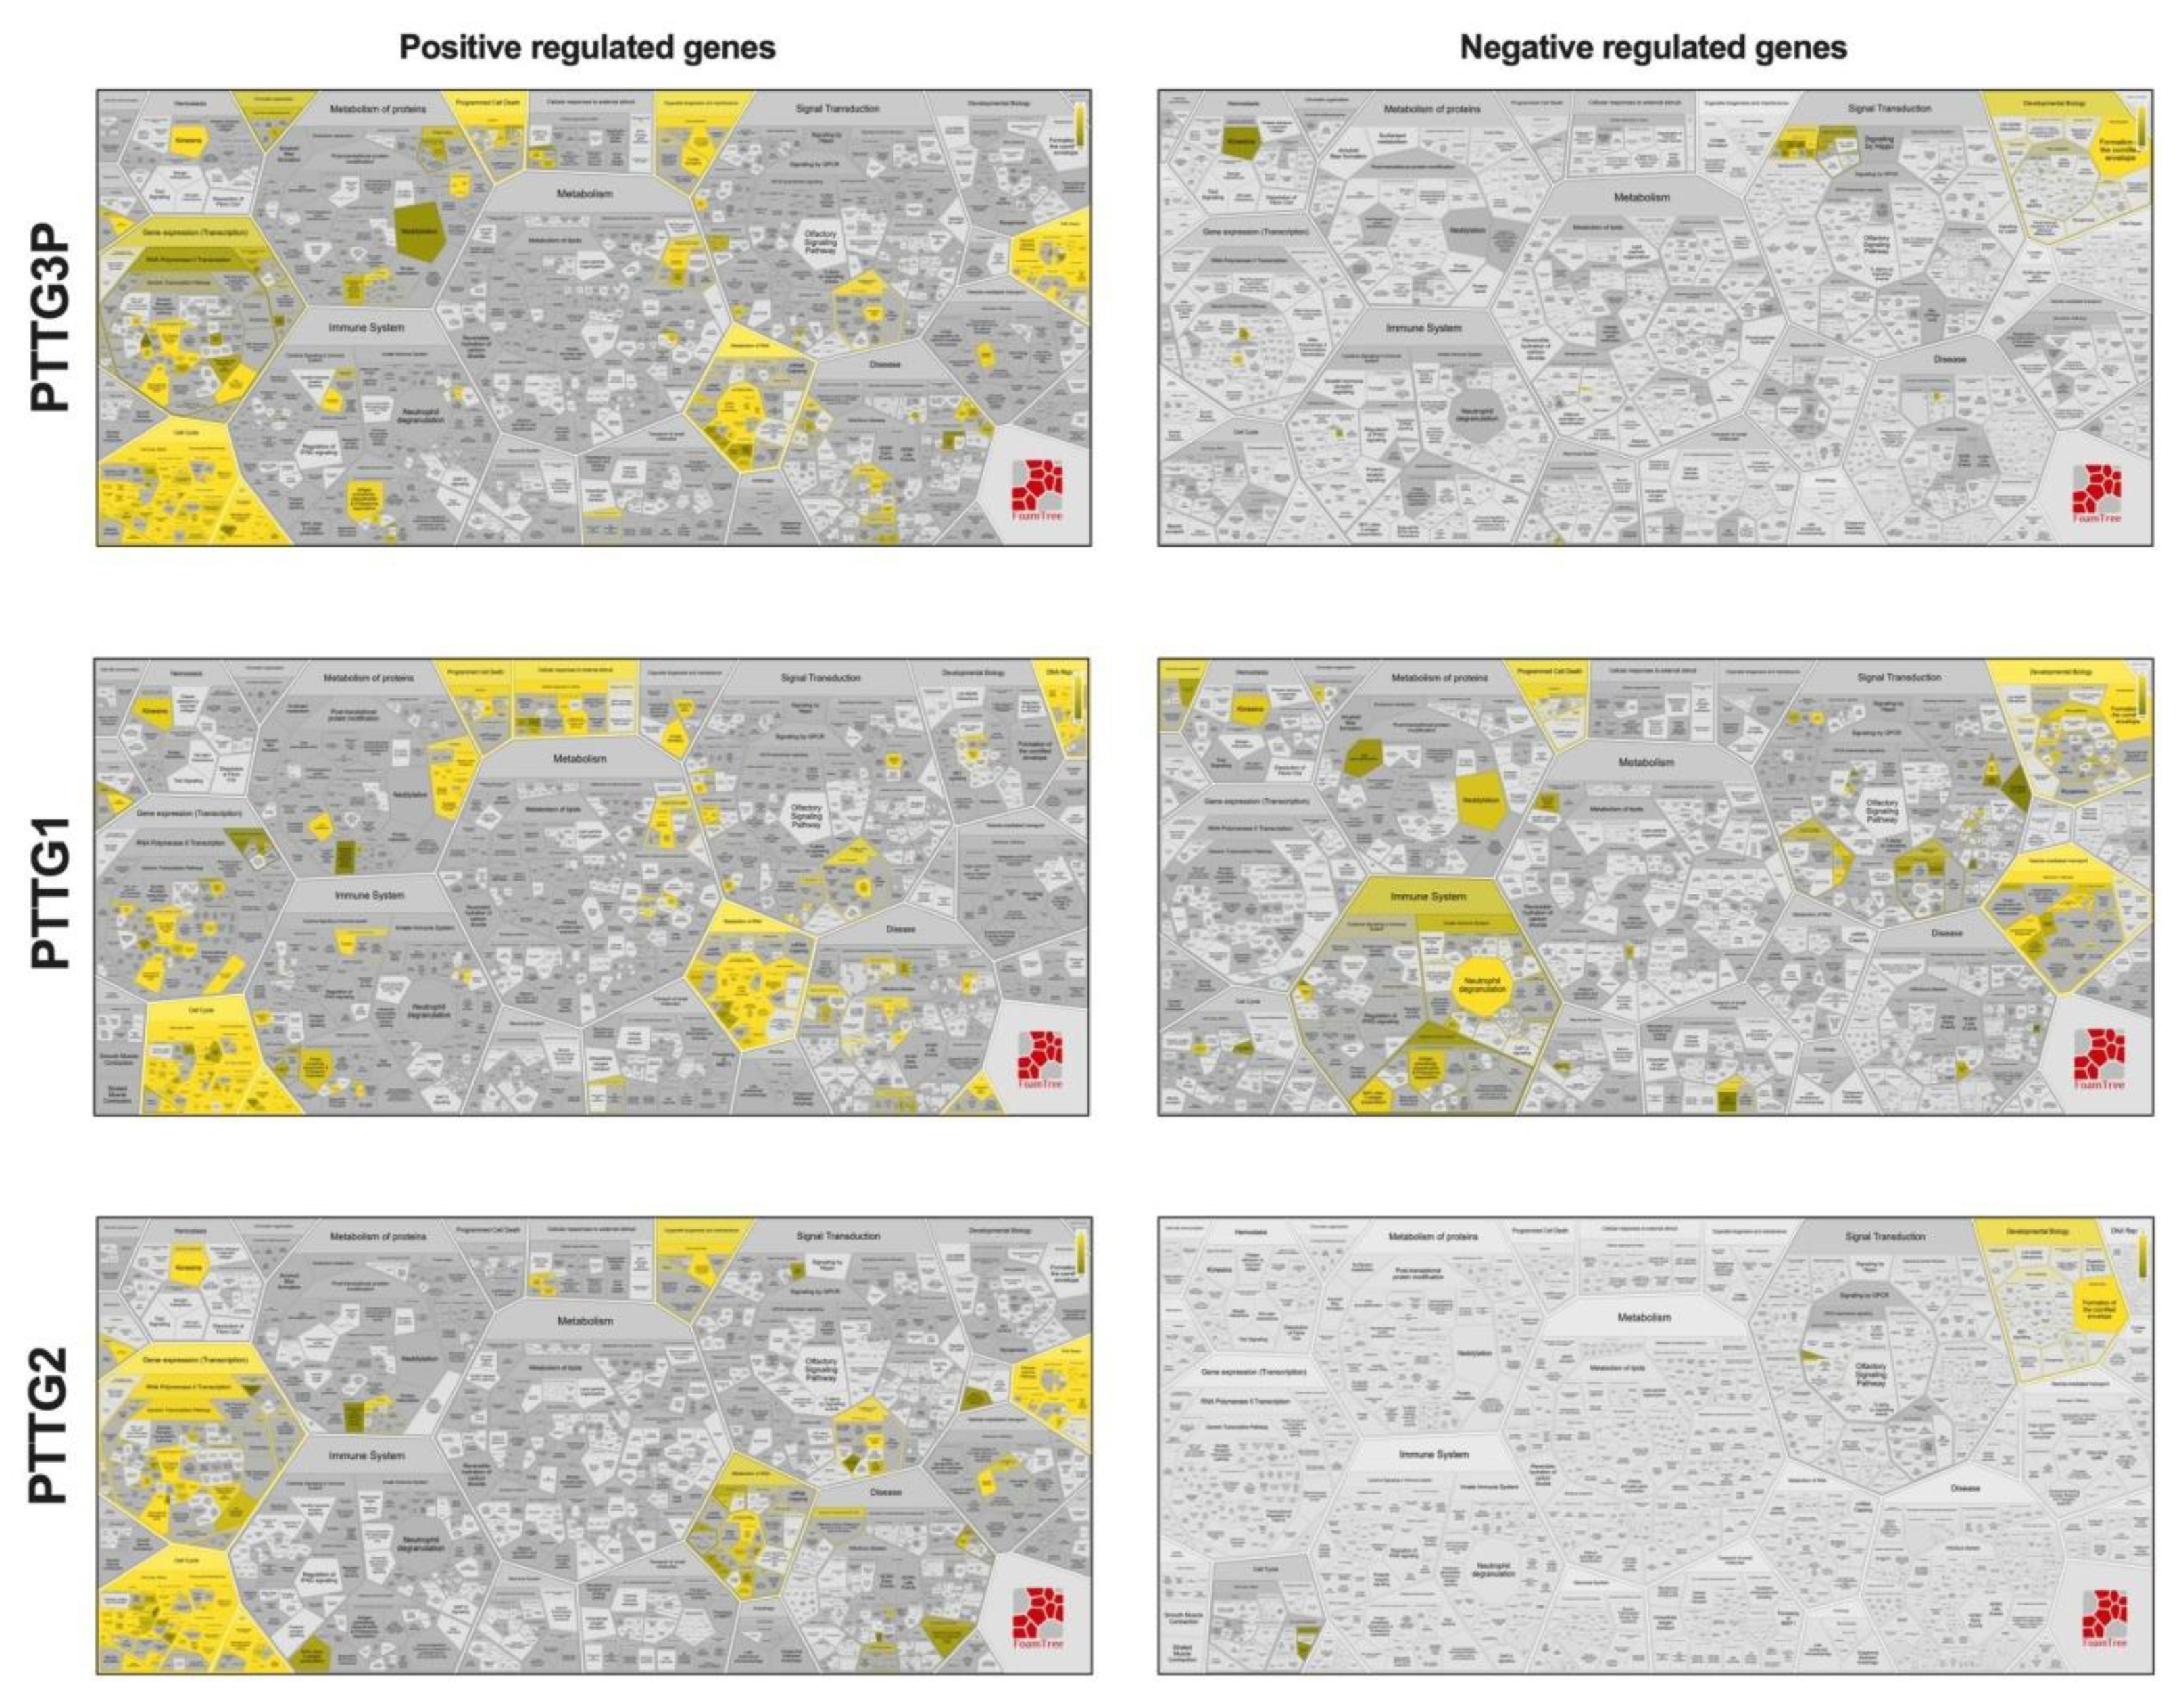
3.7. Patients with High and Low Expressions of PTTG3P, PTTG1 or PTTG2 Have Different Patterns of Genes

The functional implications of PTTG3P, PTTG1 or PTTG2 expression signatures were analyzed using gene set enrichment analysis (GSEA), and several top enriched datasets are shown in Figure 5. It was found that the most deregulated genes in PTTG3P high-expressing group of patients are clustered most significantly in DNA repair, oxidative phosphorylation and peroxisome pathways, NES = −2.196, NES = −2.003 and NES = −1.840, respectively. In the case of high-expressing group of patients in PTTG1, a gene set enrichment analysis indicated that the most deregulated genes in this group of patients are clustered most significantly in DNA repair, Myc targets, E2F targets and oxidative phosphorylation pathways, NES = −1.863, NES = −1.820, NES = −1.797 and NES = −1.794, respectively. In the PTTG2 high-expressing group, gene set enrichment analysis indicated that the most deregulated genes in this group of patients are clustered most significantly in E2F targets, G2M checkpoints and oxidative phosphorylation pathways, NES = −1.940, NES = −1.820 and NES = −1.789, respectively; Figure 8 and list of genes are shown in Supplementary Table S6.

4. Discussion

The PTTG gene family consists of three members: one pseudogene (PTTG3P) and two protein coding genes, namely PTTG1 and PTTG2 [12]. Numerous studies have proven the significant role of PTTGs in cancer initiation and progression [11,13,16,17,18], although the mechanisms of these processes mostly remain unclear. It is known that PTTG3P influences tumor growth and metastasis in both cervical cancer and hepatocellular carcinoma [17,18]. Similarly, the second member, PTTG1, has been reported to promote migration and invasion in non-small cell lung cancer [11]. It has also been shown to play the role of an inflammation-related oncogene in hepatocellular carcinoma [31] Additionally, PTTG1 was found to induce epithelial–mesenchymal transition in colon carcinoma [32].
To the best of our knowledge, this is the first study to present a comprehensive analysis of all three members of the PTTG gene family in HNSCC carcinoma patients. Based on TCGA data, we found that in HNSCC PTTG3P alteration is mild and is estimated to be around 1.39, compared to the highest fold change of PTTG3P observed in lung squamous cell carcinoma (LUSC), 7.26-fold change.
However, the expression of PTTG3P is significantly upregulated in HNSCC tumor tissues compared with normal samples. Moreover, the highest upregulation of PTTG3P expression was observed in pharynx tumors compared to oral and larynx locations, and instances of PTTG1 and PTTG2 were significantly upregulated in HNSCC tumor tissues compared with normal samples. As was the case with PTTG3P, the highest upregulation was observed in pharynx tumors compared to oral and larynx locations. This may indicate the significant role of these transcripts in pharyngeal tumors, which are known to be HPV dependent and, due to this fact, display distinct biological and clinical characteristics from HPV negative tumors [2].
As previously described, we observed differences in the expression of analyzed genes depending on TP53 status. TCGA data analysis of breast cancer patients performed by Lou et al. showed a positive correlation between the PTTG3P pseudogene and TP53 signaling pathways [33]. Moreover, Read et al. reported that PTTG1 and PBF (PTTG1IP, PTTG1 interacting protein) together modulate the interaction with TP53, reduce p53 protein stability and affect its downstream targets which lead to worse outcomes in HNSCC patients [34]. Our results indicated that expression levels of PTTG3P, PTTG1 and PTTG2 depend on TP53 mutation type. Furthermore, they correlate with expression of the genes from the p53 pathway. We found that mutant p53-interacting partners such as: NF-YB, NF-YC, Pin1, PML and p73 positively correlate with PTTG3P, PTTG1 or PTTG2. The aforementioned genes interact with mutated and non-mutated p53. NF-Y influences the cell cycle progression, Pin1 promotes mutant p53 gain-of-function, and PML enhances transcriptional activity of mutant p53. Only p73 interacts with specific mutated variants of p53 and is responsible for regulation of the cell cycle and induction of apoptosis [23]. The group of negatively correlated genes comprises NF-YA (a member of NF-Y), Sp1, Ets-1, VDR, SREBP-2 and p63, which influence the cell cycle, drug resistance, promotion of cell survival and interaction with other genes from p53 pathway [23]. It should be noted that expression of p63 is reduced in advanced HNSCC, which results in metastasis promotion by activation of MAPK and STAT3 signaling pathways [35].
To further investigate the connection between the PTTG gene family and p53, we analyzed genes transcriptionally activated by mutant p53. The most positively correlated genes were found to be associated with increased proliferation (CCNB2, CDK1, CCNB1, STMN1, CDC25C), inhibition of apoptosis (NFKB2, TIMM50, DUT) and with centromere (CENPA, MIS18A). Whereas, the most negatively correlated are gene groups involved in the processes connected with increased proliferation (MYC, IGF1R, EGFR), metabolism (DHCR24, HMGCS1, SQLE, DHCR7, CYP51A1), cell–cell/cell–ECM signaling (ITGA6, MMP3, MMP13) and inhibition of apoptosis (IGF2). However, it should be noted that in the case of all three genes, PTTG3P, PTTG1 and PTTG2, positive correlations were stronger than the negative ones. These findings indicate that higher expression of PTTG3P, PTTG1 and PTTG2 is connected with activation of prosurvival and protumorigenic downstream genes by mutant p53 protein. Indeed, our observations are supported by the results obtained by Read et al.; however, their analysis focused solely on PTTG1 [34]. In our work, we separately examined the roles of PTTG3P, PTTG1 and PTTG2. Similarly to Zhang et al., we observed a statistically significant positive correlation between PTTG3P and PTTG1 as well as PTTG2 in esophageal squamous cell carcinoma. The coexisting expression of PTTG1 and PTTG2 genes with the PTTG3P pseudogene may suggest that PTTG3P regulates PTTG1 and PTTG2. It is possible that PTTG3P positively promotes the regulation of parental genes PTTG1 and PTTG2, as is the case in esophageal squamous cell carcinoma [16]. In vitro studies have confirmed that exogenously the overexpression of PTTG3P promotes the transcription of its parental genes PTTG1 and PTTG2 in esophageal squamous cell carcinoma cells. However, the mechanism behind this discovery remains unknown [16].
Read et al. indicated that PTTG1 together with PTTG1IP play an important role in regulation of p53 protein stability [34]. We observed correlation between all PTTG3P, PTTG1 and PTTG2 in HNSCC patients. Therefore, it comes as no surprise that in the case of p53 signaling pathway, we observed similar, but not identical, changes in gene expression for all members of the PTTG family. High expression of PTTG1 was found to be associated with advanced cancers and short disease-free survival. Moreover Read et al., postulated that PTTG1IP does not reduce the stability of mutated p53 as it is observed in the case of mutant p53 protein in colorectal tumors [34]. The transcripts of PTTG3P, PTTG1 and PTTG2 seem to complement each other in fulfilling their biological function and influence on cellular program. However, this hypothesis should be verified using in vitro models.
Analysis of the relationship between PTTG3P, PTTG1 and PTTG2 expressions and clinicopathological characteristics in patients with HNSCCs revealed that high expression levels of PTTG3P correlated closely with lower T-stage, a higher grade and with HPV p16 status. As mentioned above, a higher expression of PTTG3P was observed in pharyngeal tumors with HPV status. This is additional evidence that PTTG3P may be involved in virus-related carcinogenesis in HNSCC. Roychowdhury et al. indicated that PTTG3P, as well as other 7 pseudogenes, are overexpressed in patient samples and cell lines of the uterine cervix carcinoma, where HPV infection is indicated as a primary causal agent [36]. Moreover, PTTG3P was correlated with a higher stage of uterine cervix carcinoma [36]. However, there is a lack of association studies of HNSCC, viral infection and PTTG3P. We also observed high expressions of PTTG1 in higher cancer grade and in patients’ samples with negative perineural invasion, negative lymph node neck dissection and positive HPV p16 status. In contrast, PTTG2 expression levels correlated with the N-stage of cancer, cancer grade, lymph node neck dissection, angiolymphatic invasion and HPV p16 status. The PTTG expression levels were previously found to correlate with clinicopathological parameters in HNSCCs, which was also the case in our analysis. Solbach et al. analyzed PTTG mRNA levels using northern blotting in 89 primary tumor samples and demonstrated a positive association between PTTG expressions and T and N tumor stages [37]. These findings support the results obtained in our analysis—higher PTTG2 levels correlated with cancer N stage, whereas PTTG3P levels with the T stage of cancer. However, it should be noted that Solbach et al., in contrast to our findings, did not differentiate PTTG into three known transcripts, PTTG3P, PTTG1 and PTTG2 [37]. Other studies have shown that in esophageal cancer PTTG overexpression correlates with advanced pathological stage, extensive lymph node metastases and reduced survival [38]. PTTG expression in oropharyngeal tumors was significantly higher than at other subsites. A higher PTTG1 expression significantly correlated with pathological stage and lymph node metastases [34,38]. Guo et al. indicated higher levels of PTTG1 and PTTG3P in cervical cancer tissues compared to the paired adjacent healthy ones. Both were highly correlated and influenced by the EMT process and metastases [17]. Indeed, Zheng et al. revealed that FoxM1 transactivated PTTG1 and promoted colorectal cancer cell migration and invasion by way of the regulation of the WNT pathway [39].
Our findings also support the observed association between PTTG3P, PTTG1 and PTTG2 with other genes. We indicated that many genes associated with important cellular processes are positively correlated with PTTG3P, PTTG1 and PTTG2. It should be noted that among these genes are those connected with viral infections as well as tumor progression. It proves that PTTG3P, PTTG1 and PTTG2 may function as oncogenes in HNSCC, similarly as was indicated in other cancers [17,30,31,34,36,37,38,39,40].
This statement also confirms our observation that HNSCC patients with lower PTTG3P and PTTG2 gene expressions exhibit longer DFS than patients in high expressing groups. Weng et al. demonstrated similar results in gastric cancer—high expressions of PTTG3P were correlated with significantly shorter DFS [40]. Even though our analysis did not provide evidence of PTTG genes’ expression associated with OS in HNSCC, there have been reports of such correlation in other cancer types [41]. Patients with non-small cell lung cancer with higher expression levels of the PTTG1 gene exhibited shorter OS times [11]. However, Read et al. observed significant differences in the length of OS between PTTG1 low and high expressing groups of HNSCC patients [34]. The reports mentioned above suggest that PTTG genes bear potential to become prognostic markers.
GSEA analysis indicated that patients with low expressions of pseudogene PTTG3P, as well as PTTG1 and PTTG2 genes have significantly negatively enriched genes involved in some pathways, such as DNA repair, E2F targets, Myc targets and peroxisome. These pathways are associated with carcinogenesis and cancer progression, which may explain that patients with low expressions of members of the PTTG family display better survival. However, in this group, the negative enrichment of genes connected with oxidative phosphorylation and G2M checkpoints was also observed.
DNA repair enzymes are responsible for the constant monitoring of chromosomes to correct damaged nucleotide residues induced in cells through external environmental factors. The result of DNA repair defects may be the accumulation of mutations that contribute to genomic instability and then to carcinogenesis [42]. The positive correlation of PTTG with E2F may be due to the fact that the cell cycle regulatory Rb-E2F pathway is a major target for HPV, and as we mentioned above, PTTG expression positively correlated with HPV. E2F family members are responsible for regulating the cell cycle during G1/S transition [42,43].
Moreover, we observed negative association of patients with low expression of PTTG3P, PTTG1 as well as PTTG2 genes and oxidative phosphorylation (OXPHOS). OXPHOS is a metabolic pathway that leads to the conversion of ADP to ATP. OXPHOS levels increase in cancer cells and form the major metabolic program in cancer initiating cells (cancer stem cells) [44,45]. Only for patients with low expression of PTTG3P was a negative association with peroxisome proliferator-activated receptor-γ (PPAR-γ) indicated in our study. The genes from this group participate in various aspects of cancer biology, including differentiation, proliferation, invasion and angiogenesis [46].
The next important pathways indicated by GSEA analysis are c-Myc targets, which are enriched in the group of patients with a higher level of PTTG1. In normal cells, the level of c-Myc protein is low. The level of c-Myc protein increases in cancer cells, especially in the final stages of cancer, because its expression is usually induced via upstream oncogenic pathways. In human cancer, an overexpression of c-Myc protein stimulates genes involved in protein biosynthesis, cancer metabolism, transcription factors and cell cycle genes [47]. This could potentially explain the observed worse patients’ disease-free survival and more advanced cancers (higher grade) in the group of patients with high levels in comparison to patients with low levels of PTTG1. However, negative enrichment of genes connected with the G2M checkpoint was observed by us in the case of patients with low expression levels of PTTG2. The G2M checkpoint is a particularly important cell cycle checkpoint because it ensures that cells do not initiate mitosis until the damaged or incompletely replicated DNA is fully repaired. G2M checkpoint abnormalities can lead to the proliferation of cells with damaged DNA [48]. It is difficult to explain why patients with a low expression of PTTG2, which is connected with better survival, have not got enriched genes connected with G2M checkpoint. However, it should be noted that in our analysis, we compared only cancer patients, so it is not surprising that some oncogenic pathways are up-regulated just as some pathways connected with tumor suppressors are down-regulated in the group of patients with better survival. We need to remember that patients with low expressions of PTTG3P, PTTG1 and PTTG2 have cancer. The comparison of data from healthy subjects with HNSCC patients divided into groups depending on expression level PTTG3P, PTTG1 and PTTG2 could give more sophisticated data about the role of these transcripts. A lack of full access to TCGA data makes our study limited to the presented results and conclusions. However, we are the first to not only thoroughly analyze the role of the pituitary tumor processing gene (PTTG) family, PTTG3P, PTTG1 and PTTG2, in HNSCC, but we are also the first to indicate their important function as well as potential utility as biomarkers.

5. Conclusions

The major findings of the study are:
  • The expression of PTTG3P, PTTG1 and PTTG2 was upregulated in cancer tissue compared to normal in most cancer types including HNSCC and depends on TP53 status.
  • Statistical significance was obtained between tumors from the oral cavity and pharynx and between tumors from the pharynx and larynx in all three genes.
  • PTTG3P positively correlated with PTTG1 and PTTG2 in HNSCC tissue.
  • Patients with low expressions of PTTG3P and PTTG2 displayed significantly longer disease-free survival.
  • Analysis of gene correlations and GSEA indicated that patients with high expressions of PTTG3P, PTTG1 and PTTG2 have different expression patterns of genes associated with carcinogenesis pathways in comparison to patients with low expressions of these three transcripts.

Supplementary Materials

The following are available online at https://www.mdpi.com/2075-4418/10/8/606/s1, Table S1: Correlation between the mutant p53-interacting partners and PTTG3P, PTTG1 and PTTG2, Table S2: Correlation between transcriptionally activated genes by mutant p53 protein and PTTG3P, PTTG1 and PTTG2, Table S3: HNSCC patients’ survival depending on the low and high expression of mutant p53-interacting partners, Table S4: HNSCC patients’ survival depending on the low and high expression of transcriptionally activated genes by mutant p53 protein, Table S5: List of positively and negatively correlated genes with PTTG3P, PTTG1 or PTTG2 and involved in important cellular processes, Table S6: List of protein coding genes in the pathways which were the most significantly enriched in a group of patients with high expression of PTTG3P, PTTG1 or PTTG2.

Author Contributions

Conceptualization, T.K.; methodology, T.K.; investigation, J.G., I.G., D.S., K.G., P.P., T.K.; data curation, J.G., I.G., D.S., M.B.; writing—original draft preparation, J.G., I.G., D.S., M.B., T.K.; writing—review and editing, I.G., K.G., T.K., A.M.; visualization, J.G., I.G., D.S., T.K.; supervision, T.K., A.M. All authors have read and agreed to the published version of the manuscript.

Funding

This work was supported by Poznan University of Medical Sciences: scientific and education activity of the Chair of Medical Biotechnology Department of Cancer Immunology.

Acknowledgments

Publication was made during the class “Analysis of experimental data”, performed in the Chair of Medical Biotechnology, Department of Cancer Immunology, Poznan University of Medical Sciences, in 2019/2020.

Conflicts of Interest

The authors declare no conflict of interest.

Abbreviations

BLCABladder urothelial carcinoma
BRCABreast invasive carcinoma
CESCCervical squamous cell carcinoma
CHOLCholangiocarcinoma
COADColon adenocarcinoma
CTChemotherapy
DFSDisease-free survival
ESCAEsophageal carcinoma
GBMGlioblastoma multiforme
GSEAGene Set Enrichment Analysis
HNSCCHead and Neck squamous cell carcinoma
HPVHuman papillomavirus
KICHKidney Chromophobe
KIRCKidney renal clear cell carcinoma
KIRPKidney renal papillary cell carcinoma
LIHCLiver hepatocellular carcinoma
LUADLung adenocarcinoma
LUSCLung squamous cell carcinoma
OSOverall survival
OXPHOSOxidative phosphorylation
PAADPancreatic adenocarcinoma
PRADProstate adenocarcinoma
RTRadiotherapy
SARCSarcoma
SKCMSkin Cutaneous Melanoma
TCGAThe Cancer Genome Atlas
THCAThyroid carcinoma
THYMThymoma
STADStomach adenocarcinoma
UCECUterine Corpus Endometrial Carcinoma

References

  1. Jou, A.; Hess, J. Epidemiology and Molecular Biology of Head and Neck Cancer. Oncol. Res. Treat. 2017, 40, 328–332. [Google Scholar] [CrossRef]
  2. Dok, R.; Nuyts, S. HPV Positive Head and Neck Cancers: Molecular Pathogenesis and Evolving Treatment Strategies. Cancers 2016, 8, 41. [Google Scholar] [CrossRef] [PubMed] [Green Version]
  3. Cohen, N.; Fedewa, S.; Chen, A.Y. Epidemiology and Demographics of the Head and Neck Cancer Population. Oral Maxillofac. Surg. Clin. N. Am. 2018, 30, 381–395. [Google Scholar] [CrossRef] [PubMed]
  4. Alsahafi, E.; Begg, K.; Amelio, I.; Raulf, N.; Lucarelli, P.; Sauter, T.; Tavassoli, M. Clinical update on head and neck cancer: Molecular biology and ongoing challenges. Cell Death Dis. 2019, 10, 540. [Google Scholar] [CrossRef] [Green Version]
  5. Irani, S. miRNAs Signature in Head and Neck Squamous Cell Carcinoma Metastasis: A Literature Review. J. Dent. 2016, 17, 71–83. [Google Scholar]
  6. An, Y.; Furber, K.L.; Ji, S. Pseudogenes regulate parental gene expression via ceRNA network. J. Cell. Mol. Med. 2017, 21, 185–192. [Google Scholar] [CrossRef]
  7. Hu, X.; Yang, L.; Mo, Y.-Y. Role of Pseudogenes in Tumorigenesis. Cancers 2018, 10, 256. [Google Scholar] [CrossRef] [PubMed] [Green Version]
  8. Kovalenko, T.F.; Patrushev, L.I. Pseudogenes as Functionally Significant Elements of the Genome. Biochemistry 2018, 83, 1332–1349. [Google Scholar] [CrossRef]
  9. Gao, L.; Ren, W.; Zhang, L.; Li, S.; Kong, X.; Zhang, H.; Dong, J.; Cai, G.; Jin, C.; Zheng, D.; et al. PTENp1, a natural sponge of miR-21, mediates PTEN expression to inhibit the proliferation of oral squamous cell carcinoma. Mol. Carcinog. 2016, 56, 1322–1334. [Google Scholar] [CrossRef]
  10. Liu, J.; Xing, Y.; Xu, L.; Chen, W.; Cao, W.; Zhang, C. Decreased expression of pseudogene PTENP1 promotes malignant behaviours and is associated with the poor survival of patients with HNSCC. Sci. Rep. 2017, 7, 41179. [Google Scholar] [CrossRef] [Green Version]
  11. Li, H.; Yin, C.; Zhang, B.; Sun, Y.; Shi, L.; Liu, N.; Liang, S.; Lu, S.; Liu, Y.; Zhang, J.; et al. PTTG1 promotes migration and invasion of human non-small cell lung cancer cells and is modulated by miR-186. Carcinogenesis 2013, 34, 2145–2155. [Google Scholar] [CrossRef] [Green Version]
  12. Chen, L.; Puri, R.; Lefkowitz, E.; Kakar, S.S. Identification of the human pituitary tumor transforming gene (hPTTG) family: Molecular structure, expression, and chromosomal localization. Gene 2000, 248, 41–50. [Google Scholar] [CrossRef]
  13. Guo, Y.; Shao, Y.; Chen, J.; Xu, S.; Zhang, X.; Liu, H. Expression of pituitary tumor-transforming 2 in human glioblastoma cell lines and its role in glioblastomatumorigenesis. Exp. Ther. Med. 2016, 11, 1847–1852. [Google Scholar] [CrossRef] [PubMed] [Green Version]
  14. Moreno-Mateos, M.A.; Espina, Á.G.; Torres, B.; del Estal, M.M.G.; Romero-Franco, A.; Ríos, R.M.; Pintor-Toro, J.A. PTTG1/securin modulates microtubule nucleation and cell migration. Mol. Biol. Cell 2011, 22, 4302–4311. [Google Scholar] [CrossRef] [PubMed] [Green Version]
  15. Liu, X.-B.; Li, F.; Li, Y.-Q.; Yang, F. Pituitary tumor transforming gene PTTG2 induces psoriasis by regulating vimentin and E-cadherin expression. Int. J. Clin. Exp. Pathol. 2015, 8, 10887–10893. [Google Scholar]
  16. Zhang, Z.; Shi, Z. The pseudogene PTTG3P promotes cell migration and invasion in esophageal squamous cell carcinoma. Open Med. 2019, 14, 516–522. [Google Scholar] [CrossRef]
  17. Guo, X.-C.; Li, L.; Gao, Z.-H.; Zhou, H.-W.; Li, J.; Wang, Q.-Q. The long non-coding RNA PTTG3P promotes growth and metastasis of cervical cancer through PTTG1. Aging 2019, 11, 1333–1341. [Google Scholar] [CrossRef]
  18. Huang, J.-L.; Cao, S.-W.; Ou, Q.-S.; Yang, B.; Zheng, S.-H.; Tang, J.; Chen, J.; Hu, Y.-W.; Zheng, L.; Wang, Q. The long non-coding RNA PTTG3P promotes cell growth and metastasis via up-regulating PTTG1 and activating PI3K/AKT signaling in hepatocellular carcinoma. Mol. Cancer 2018, 17, 93. [Google Scholar] [CrossRef]
  19. Bernal, J.A.; Hernández, A. p53 stabilization can be uncoupled from its role in transcriptional activation by loss of PTTG1/securin. J. Biochem. 2007, 141, 737–745. [Google Scholar] [CrossRef]
  20. Méndez-Vidal, C.; Estal, M.D.M.G.-D.; Moreno-Mateos, M.A.; Espina-Zambrano, Á.G.; Torres, B.; Pintor-Toro, J.A. PTTG2 silencing results in induction of epithelial-to-mesenchymal transition and apoptosis. Cell Death Dis. 2013, 4, e530. [Google Scholar] [CrossRef] [Green Version]
  21. Kastenhuber, E.R.; Lowe, S.W. Putting p53 in Context. Cell 2017, 170, 1062–1078. [Google Scholar] [CrossRef] [Green Version]
  22. Zhou, G.; Liu, Z.; Myers, J.N. TP53 Mutations in Head and Neck Squamous Cell Carcinoma and Their Impact on Disease Progression and Treatment Response. J. Cell. Biochem. 2016, 117, 2682–2692. [Google Scholar] [CrossRef] [PubMed] [Green Version]
  23. Freed-Pastor, W.A.; Prives, C. Mutant p53: One name, many proteins. Genes Dev. 2012, 26, 1268–1286. [Google Scholar] [CrossRef] [PubMed] [Green Version]
  24. Caponio, V.C.A.; Troiano, G.; Adipietro, I.; Zhurakivska, K.; Arena, C.; Mangieri, D.; Mascitti, M.; Cirillo, N.; Muzio, L.L. Computational analysis of TP53 mutational landscape unveils key prognostic signatures and distinct pathobiological pathways in head and neck squamous cell cancer. Br. J. Cancer 2020, 1–13. [Google Scholar] [CrossRef] [PubMed]
  25. Gao, J.; Aksoy, B.A.; Dogrusoz, U.; Dresdner, G.; Gross, B.; Sumer, S.O.; Sun, Y.; Jacobsen, A.; Sinha, R.; Larsson, E.; et al. Integrative analysis of complex cancer genomics and clinical profiles using the cBioPortal. Sci. Signal. 2013, 6, l1. [Google Scholar]
  26. Chandrashekar, D.S.; Bashel, B.; Balasubramanya, S.A.H.; Creighton, C.J.; Ponce-Rodriguez, I.; Chakravarthi, B.V.S.K.; Varambally, S. UALCAN: A Portal for Facilitating Tumor Subgroup Gene Expression and Survival Analyses. Neoplasia 2017, 19, 649–658. [Google Scholar] [CrossRef]
  27. Li, J.-H.; Liu, S.; Zhou, H.; Qu, L.-H.; Yang, J.-H. starBase v2.0: Decoding miRNA-ceRNA, miRNA-ncRNA and protein-RNA interaction networks from large-scale CLIP-Seq data. Nucleic Acids Res. 2014, 42, D92–D97. [Google Scholar] [CrossRef] [Green Version]
  28. Jassal, B.; Matthews, L.; Viteri, G.; Gong, C.; Lorente, P.; Fabregat, A.; Sidiropoulos, K.; Gillespie, M.; Garapati, P.; Haw, R.; et al. The reactome pathway knowledgebase. Nucleic Acids Res. 2020, 48, D498–D503. [Google Scholar] [CrossRef]
  29. Klimczak, M.; Biecek, P.; Zylicz, A.; Zylicz, M. Heat shock proteins create a signature to predict the clinical outcome in breast cancer. Sci. Rep. 2019, 9, 7507. [Google Scholar] [CrossRef] [Green Version]
  30. Warde-Farley, D.; Donaldson, S.L.; Comes, O.; Zuberi, K.; Badrawi, R.; Chao, P.; Franz, M.; Grouios, C.; Kazi, F.; Lopes, C.T.; et al. The GeneMANIA prediction server: Biological network integration for gene prioritization and predicting gene function. Nucleic Acids Res. 2010, 38 (Suppl. 2), W214–W220. [Google Scholar] [CrossRef]
  31. Lin, X.; Yang, Y.; Guo, Y.; Liu, H.; Jiang, J.; Zheng, F.; Wu, B. PTTG1 is involved in TNF-α-related hepatocellular carcinoma via the induction of c-myc. Cancer Med. 2019, 8, 5702–5715. [Google Scholar] [CrossRef] [PubMed] [Green Version]
  32. Ren, Q.; Jin, B. The clinical value and biological function of PTTG1 in colorectal cancer. Biomed. Pharmacother. 2017, 89, 108–115. [Google Scholar] [CrossRef] [PubMed]
  33. Lou, W.; Ding, B.; Fan, W. High Expression of Pseudogene PTTG3P Indicates a Poor Prognosis in Human Breast Cancer. Mol. Ther. Oncol. 2019, 14, 15–26. [Google Scholar] [CrossRef] [PubMed] [Green Version]
  34. Read, M.L.; Modasia, B.; Fletcher, A.; Thompson, R.J.; Brookes, K.; Rae, P.C.; Nieto, H.R.; Poole, V.L.; Roberts, S.; Campbell, M.J.; et al. PTTG and PBF functionally interact with p53 and predict overall survival in head and neck cancer. Cancer Res. 2018, 78. [Google Scholar] [CrossRef] [Green Version]
  35. Lakshmanachetty, S.; Balaiya, V.; High, W.A.; Koster, M.I. Loss of TP63 Promotes the Metastasis of Head and Neck Squamous Cell Carcinoma by Activating MAPK and STAT3 Signaling. Mol. Cancer Res. 2019, 17, 1279–1293. [Google Scholar] [CrossRef] [PubMed] [Green Version]
  36. Roychowdhury, A.; Samadder, S.; Das, P.; Mazumder, D.I.; Chatterjee, A.; Addya, S.; Mondal, R.; Roy, A.; Roychoudhury, S.; Panda, C.K. Deregulation of H19 is associated with cervical carcinoma. Genomics 2020, 112, 961–970. [Google Scholar] [CrossRef]
  37. Solbach, C.; Roller, M.; Eckerdt, F.; Peters, J.M.; Knecht, R. Pituitary tumor-transforming gene expression is a prognostic marker for tumor recurrence in squamous cell carcinoma of the head and neck. BMC Cancer 2006, 6, 242. [Google Scholar] [CrossRef] [Green Version]
  38. Shibata, Y.; Haruki, N.; Kuwabara, Y.; Nishiwaki, T.; Kato, J.; Shinoda, N.; Sato, A.; Kimura, M.; Koyama, H.; Toyama, T.; et al. Expression of PTTG (pituitary tumor transforming gene) in esophageal cancer. Jpn. J. Clin. Oncol. 2002, 32, 233–237. [Google Scholar] [CrossRef] [Green Version]
  39. Zheng, Y.; Guo, J.; Zhou, J.J.; Lu, J.-J.; Chen, Q.; Zhang, C.; Qing, C.; Koeffler, H.P.; Tong, Y. FoxM1 transactivates PTTG1 and promotes colorectal cancer cell migration and invasion. BMC Med. Genom. 2015, 8, 49. [Google Scholar] [CrossRef] [Green Version]
  40. Weng, W.; Ni, S.; Wang, Y.; Xu, M.; Zhang, Q.; Yang, Y.; Wu, Y.; Xu, Q.; Qi, P.; Tan, C.; et al. PTTG3P promotes gastric tumour cell proliferation and invasion and is an indicator of poor prognosis. J. Cell. Mol. Med. 2017, 21, 3360–3371. [Google Scholar] [CrossRef]
  41. Yang, S.; Wang, X.; Liu, J.; Ding, B.; Shi, K.; Chen, J.; Lou, W. Distinct expression pattern and prognostic values of pituitary tumor transforming gene family genes in non-small cell lung cancer. Oncol. Lett. 2019, 18, 4481–4494. [Google Scholar] [CrossRef] [PubMed]
  42. Johnson, M.E.; Cantalupo, P.G.; Pipas, J.M. Identification of Head and Neck Cancer Subtypes Based on Human Papillomavirus Presence and E2F-Regulated Gene Expression. mSphere 2018, 3. [Google Scholar] [CrossRef] [PubMed] [Green Version]
  43. Gaubatz, S.; Lindeman, G.J.; Ishida, S.; Jakoi, L.; Nevins, J.R.; Livingston, D.M.; Rempel, R.E. E2F4 and E2F5 Play an Essential Role in Pocket Protein–Mediated G1 Control. Mol. Cell 2000, 6, 729–735. [Google Scholar] [CrossRef]
  44. Burke, P. Mitochondria, Bioenergetics and Apoptosis in Cancer. Trends Cancer 2017, 3, 857–870. [Google Scholar] [CrossRef] [PubMed]
  45. Zacksenhaus, E.; Shrestha, M.; Liu, J.C.; Vorobieva, I.; Chung, P.E.; Ju, Y.; Nir, U.; Jiang, Z. Mitochondrial OXPHOS Induced by RB1 Deficiency in Breast Cancer: Implications for Anabolic Metabolism, Stemness, and Metastasis. Trends Cancer 2017, 3, 768–779. [Google Scholar] [CrossRef] [PubMed]
  46. Theocharis, S.; Klijanienko, J.; Giaginis, C.; Rodriguez, J.; Jouffroy, T.; Girod, A.; Point, D.; Tsourouflis, G.; Satre-Garau, X. Peroxisome proliferator-activated receptor-γ in mobile tongue squamous cell carcinoma: Associations with clinicopathological parameters and patients survival. J. Cancer Res. Clin. Oncol. 2011, 137, 251–259. [Google Scholar] [CrossRef]
  47. Miller, D.M.; Thomas, S.D.; Islam, A.; Muench, D.; Sedoris, K. c-Myc and Cancer Metabolism. Clin. Cancer Res. 2012, 18, 5546–5553. [Google Scholar] [CrossRef] [Green Version]
  48. Stark, G.R.; Taylor, W.R. Analyzing the G2/M checkpoint. Methods Mol. Biol. 2004, 280, 51–82. [Google Scholar]
Figure 1. The expression levels of PTTG3P, PTTG1 and PTTG2 in HNSCC patients. Expression of PTTG3P, PTTG1 and PTTG2 in normal and cancer tissues. Graphs from the UALCAN database; modified; fold change for PTTG3P, PTTG1 and PTTG2 was calculated between normal (blue boxes) and cancer tissue (red boxes) and placed next to the cancer acronyms (see abbreviation section). The changed fold values marked with an asterisk are values for which the median value of healthy tissues was equal to zero. In this case, the median value in cancer tissues was given as the fold change value.
Diagnostics 10 00606 g001
Figure 2. The expression levels of PTTG3P, PTTG1 and PTTG2 in HNSCC patients. Expression of PTTG3P, PTTG1 and PTTG2 in normal and cancer tissues (A); expression of PTTG3P, PTTG1 and PTTG2 depending on HNSCC localization (B). Graphs from UALCAN database; modified (A); unpaired t-test; the graphs show the median of value presented as transcripts per million; and box and whiskers with 5–95 percentile, one-way ANOVA obtained using Dunn’s multiple comparisons tests (B). ns—not significant (p > 0.05), **** p ≤ 0.0001; *** p ≤ 0.001; p < 0.05 considered as significant.
Diagnostics 10 00606 g002
Figure 3. Correlation between expression levels of PTTG3P and PTTG1, PTTG3P and PTTG2, and PTTG1 and PTTG2 in HNSCC patients; Spearman correlation test with p < 0.05 considered as significant.
Diagnostics 10 00606 g003
Figure 4. Expression level of PTTG3P, PTTG1 and PTTG2 depending on the TP53 status (A) and depending on the specific type of TP53 mutations (B) in HNSCC patients; graphs from UALCAN database included in panel A; modified, **** p ≤ 0.0001; *** p ≤ 0.001; ** p < 0.01; * p < 0.05.
Diagnostics 10 00606 g004
Figure 5. Correlation of PTTG3P, PTTG1 or PTTG2 with mutant p53-interacting partners (A) and transcriptionally activated genes by mutant p53 protein (B). Genes only significant (p < 0.05) and in panel B with correlation R < −0.17 and R > 0.17 were indicated.
Diagnostics 10 00606 g005
Figure 6. Disease-free survival (DFS) and overall survival (OS) of HNSCC patients with all localizations of tumors depending on the PTTG3P, PTTG1 or PTTG2 expression levels; results presented for 5.5 years of observation; low and high subgroups of patients divided based on median expression; a—Log-rank (Mantel–Cox) test, b—Gehan–Breslow–Wilcoxon test; p < 0.05 considered as significant.
Diagnostics 10 00606 g006
Figure 7. Positive and negative correlation of PTTG3P, PTTG1 and PTTG2 with genes involved in important cellular processes. Only genes with Spearman’s correlation R > 0.3, R < −0.3 and p < 0.05 were indicated in REACTOME pathway analysis as yellow fields in FoamTree graphs.
Diagnostics 10 00606 g007
Figure 8. GSEA results for HNSCC patients analyzed in groups with low/high expression of PTTG3P, PTTG1 and PTTG2. GSEA plots of significantly enriched datasets; NES (normalized enrichment score), p-value (nominal p-value), FDR q-value (false discovery rate). Normalized enrichment scores for GSEA analysis of MSigDB gene sets enriched in low (RED—0 on the graphs) and in high (VIOLET—1 on the graphs) PTTG3P, PTTG1 and PTTG2 patients. Interactions between protein coding genes in the pathway, which were the most significantly enriched in a group of patients with high expression of analyzed genes. Only results set with p ≤ 0.05 and FDR ≤ 0.25 were shown.
Diagnostics 10 00606 g008
Table 1. The expression levels of PTTG3P, PTTG1 and PTTG2 are associated with clinicopathological parameters in all localizations of HNSCC. t-test or Mann–Whitney U test; p < 0.05 considered as significant.
PTTG3PPTTG1PTTG2
ParameterGroupMean ± SEMp-ValuenMean ± SEMp-ValuenMean ± SEMp-Valuen
GradeG1 + G255.57 ± 2.016<0.00013681284 ± 58.95<0.000136811.17 ± 0.46420.005368
G3 + G473.03 ± 4.1171321623 ± 101.113214.09 ± 0.9859132
HPV p16 statusNegative46.65 ± 3.023<0.000180958.6 ± 62.19<0.0001738.528 ± 0.6258<0.000173
Positive102.6 ± 10.77422601 ± 314.93918.47 ± 1.98339
Lymph Node Neck DissectionPositive59.05 ± 2.0620.8004221382 ± 58.680.03342211.42 ± 0.44300.003422
Negative68.07 ± 3.750971420 ± 80.869714.59 ± 1.13397
Angiolymphatic InvasionPositive66.06 ± 4.8300.1541251575 ± 132.80.09812513.56 ±1.0610.034125
Negative55.19 ± 2.4282251273 ± 72.5522510.61 ± 0.5364225
Perineural InvasionPositive53.03 ± 2.5700.5571691230 ± 75.920.03216710.97 ± 0.64150.210169
Negative64.66 ± 3.5801951536 ± 102.519312.42 ± 0.7516195
Age<6062.39 ± 2.8420.8632581454 ± 80.860.80825812.26 ± 0.62420.918258
>6058.88 ± 2.2762631316 ± 58.6726311.82 ± 0.5682263
GenderFemale56.10 ± 3.6000.0771371251 ± 94.080.05513710.98 ± 0.77380.070137
Male62.25 ± 2.0953851434 ± 58.4738512.41 ± 0.4985385
AlcoholPositive60.26 ± 2.2350.4943481363 ± 58.020.60634811.59 ± 0.50010.151348
Negative62.48 ± 3.2581631454 ± 99.5816313.06 ± 0.8033163
SmokingNo/Ex58.45 ± 2.6280.9111911349 ± 60.240.71129411.74 ± 0.54410.708294
Yes61.6 ± 2.4873191406 ± 82.2921612.07 ± 0.6676216
Cancer StageI + II55.40 ± 2.8720.5771011154 ± 61.180.68610111.12 ± 0.83060.823101
III + IV59.57 ± 2.3713491393 ± 66.5134911.93 ± 0.5197349
T StageT1 + T263.94 ± 3.4090.0371851434 ± 88.890.10618512.3 ± 0.73390.354185
T3 + T455.54 ± 2.2662741284 ± 65.2327411.48 ± 0.5600274
N StageN0 + N156.15 ± 2.3600.3652431266 ± 63.750.19624310.65 ± 0.56110.014243
N2 + N362.03 ± 3.6181791474 ± 100.917912.99 ± 0.7680179

